

Submitted:
02 July 2026
Posted:
02 July 2026
You are already at the latest version
Abstract
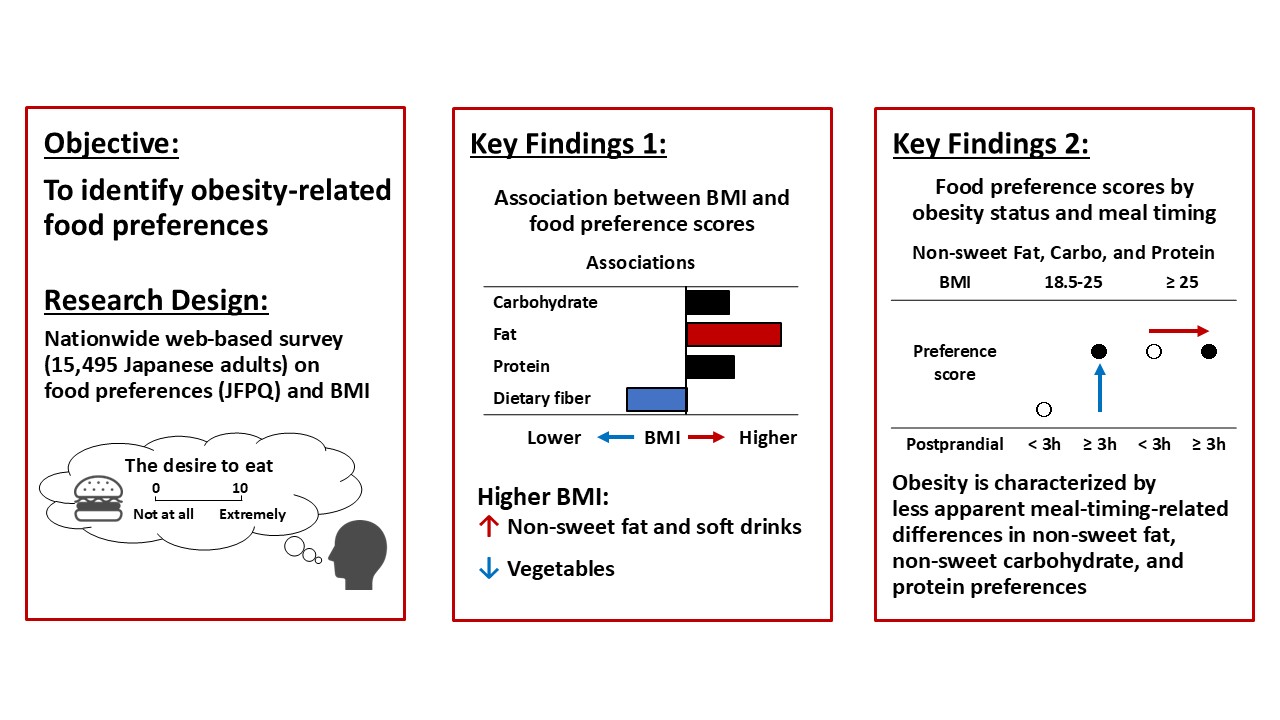
Background/Objectives: Patterns or biases in food preferences are thought to influence eating behavior. However, their associations with obesity remain unclear. We aimed to identify obesity-related food preference characteristics in the general population. Methods: We analyzed a nationwide web-based survey of adults in Japan (7,971 men and 7,524 women). Preferences for carbohydrates, fat, protein, and dietary fiber were assessed using the Japan Food Preference Questionnaire (JFPQ). Associations between food preference scores and BMI were evaluated in individuals with a BMI ≥18.5 kg/m2. Moreover, food preference scores were compared between individuals with normal weight (BMI 18.5 to <25.0 kg/m2) and those with obesity (BMI ≥25.0 kg/m2), stratified by time since the last meal (<3 vs. ≥3 h). Results: A higher BMI was associated with a greater preference for non-sweet fat and soft drinks and with a lower preference for dietary fiber, particularly vegetables, in both genders. Compared with individuals with normal weight, meal-timing-related differences in food preference scores were less apparent in individuals with obesity, accompanied by higher carbohydrate, fat, and protein preference scores at <3 h after the last meal. Conclusions: Obesity was associated with distinct self-reported food preference patterns that may influence food choices and weight gain. Food preference profiling could be useful for identifying individuals at risk of future obesity and for guiding nutritional counseling in weight management.
Keywords:
obesity
; food preference
; questionnaire
; population-based online survey
1. Introduction
Obesity and its related disorders, including type 2 diabetes and cardiovascular diseases, constitute major public health challenges worldwide [1]. Obesity is driven by a complex interplay among biological susceptibility [2], social and environmental factors [3], and individual eating behaviors [4], among which food preference, defined here as the desire to eat particular foods, may serve as a key proximal determinant of food choice and energy intake.
Several instruments have been developed to assess food preferences, including the Leeds Food Preference Questionnaire [5] and the Macronutrient and Taste Preference Ranking Task [6], which has also been adapted for use in Asian populations. However, these questionnaires were not specifically designed to capture preferences for foods commonly consumed in Japan. Therefore, we recently developed the Japan Food Preference Questionnaire (JFPQ) as a clinically oriented, food-image-based questionnaire tailored to foods typically addressed in nutritional counseling for individuals with obesity and diabetes. The JFPQ classifies these foods into macronutrient- and sweetness-based categories and quantitatively assesses individual-level biases in food preferences [7]. In our previous small-scale study using the JFPQ, individuals with abdominal obesity showed stronger preferences for carbohydrate- and fat-rich foods than healthy volunteers, and these preference scores were associated with corresponding dietary intake assessed using a food frequency questionnaire (FFQ) [7]. These findings suggest that obesity may be associated with specific patterns of food preference, which may contribute to actual eating behavior linked to weight gain. However, obesity-related food preference characteristics at the population level remain unclear.
In this study, we examined the associations between JFPQ-derived scores and body mass index (BMI) in a large Japanese cohort, aiming to identify food preference characteristics associated with obesity.
2. Materials and Methods
2.1. Study Design and Participants
In this cross-sectional study, we conducted an anonymous, nationwide web-based survey from November 1 to November 5, 2024, using a framework adapted from previously reported methodology [8]. Individuals preregistered with a commercial panel were recruited using quota sampling to obtain 20,000 respondents aged 20 to 69 years from the general Japanese population. Quotas for age group, gender, and region of residence (Hokkaido/Tohoku, Kanto, Chubu, Kinki, and Chugoku/Shikoku/Kyushu/Okinawa) were set to reflect the population distribution of the 2020 Japanese census. Self-reported information, including gender, age, height, body weight, time since the last meal (<1, 1–2, 2–3, 3–4, 4–5, or ≥5 hours), and responses to the JFPQ, was collected through an online questionnaire.
Individuals with missing data on height or weight were excluded (n = 2,805; 1,107 men and 1,698 women). In addition, respondents who assigned identical preference ratings to all food items were excluded to enhance data quality (n = 1,700; 946 men and 754 women), because these response patterns were considered to indicate low response reliability. We defined obesity as a BMI ≥25.0 kg/m2 based on the Japan Society for the Study of Obesity criteria, given the greater susceptibility of Japanese individuals to obesity-related diseases at lower BMI levels [9].
2.2. Assessment of Food Preference
Food preferences were assessed using the JFPQ, which comprises 25 food items commonly consumed in Japan and frequently addressed in nutritional counseling [7]. Participants rated their current desire to eat each food item using a 0–10 visual analogue scale with food images presented in randomized order to minimize order effects (Figure S1). As shown in Figure S1B, food items were categorized a priori into four macronutrient groups using predefined nutritional criteria: carbohydrate (≥70% of total energy derived from carbohydrates), fat (≥40% of total energy derived from fat), protein (≥30% of total energy derived from protein), and dietary fiber (≥1 g of fiber per 100 g and <100 kcal per 100 g of edible portion). The carbohydrate and fat groups were further subdivided into non-sweet (<10 g of sugars per 100 g of edible portion) or sweet (≥10 g of sugars per 100 g of edible portion) categories according to total sugar content (Figure S1). Preference scores for each nutrient category were calculated as a percentage of the maximum possible score, with higher values indicating a stronger preference [7].
2.3. Statistical Analysis
All of the values are presented as the means ± standard deviations (SDs) or the number of subjects (%). Differences in preference scores by gender were assessed using the Wilcoxon rank–sum test. Differences in preference scores across age categories and time-since-last-meal categories were assessed using the Kruskal–Wallis test, and trends across ordered categories were evaluated using the Jonckheere–Terpstra test. Multiple linear regression analyses were conducted separately by gender, with BMI as the dependent variable and each preference score as the independent variable, adjusting for age and time since the last meal. To account for multiple comparisons, P values were adjusted using the Benjamini–Hochberg false discovery rate procedure within each predefined family of tests, including macronutrient categories and individual food items. Differences in food preference scores according to BMI category (18.5 to <25.0 kg/m2 vs. ≥25.0 kg/m2) and time since the last meal (<3 h vs. ≥3 h) were assessed using two-way ANCOVA adjusted for age and gender, with BMI category, time since the last meal, and their interaction included as fixed factors. Least-squares means and 95% confidence intervals (CIs) were estimated from the ANCOVA models and are presented in the corresponding figures. Post hoc simple main-effect comparisons were performed to compare time-since-last-meal groups within each BMI category and BMI categories within each time-since-last-meal stratum, with P values adjusted using the Holm method. For all statistical analyses, two-sided P values <0.05 were considered statistically significant (JMP version 18; SAS Institute Inc.).
3. Results
3.1. Characteristics of the Study Participants and Food Preference Patterns Among Normal-Weight Individuals
The participant flow for the present study is shown in Figure S2, and Table 1 summarizes the characteristics of the 15,495 participants included in the final analysis (7,971 men and 7,524 women). The mean BMI was 23.1 ± 3.8 kg/m2 in men and 20.8 ± 3.5 kg/m2 in women. By BMI category, 554 men (3.6% of the total study population) and 1,848 women (11.9%) had a BMI <18.5 kg/m2, 5,433 men (35.1%) and 4,898 women (31.6%) had a BMI of 18.5 to <25.0 kg/m2, 1,624 men (10.5%) and 594 women (3.8%) had a BMI of 25.0 to <30.0 kg/m2, and 360 men (2.3%) and 184 women (1.2%) had a BMI ≥30.0 kg/m2.
Among normal-weight individuals (BMI 18.5 to <25.0 kg/m2), food preference scores differed significantly between men and women (Table S1). Women had higher preference scores for sweet fat and dietary fiber groups, whereas men had significantly higher scores for all other food categories. Significant age-related differences in food preferences were also observed across most nutrient groups (Table S2). Overall, older age was associated with higher preference scores for dietary fiber and lower preference scores for sweet carbohydrate and both non-sweet and sweet fat in both men and women. Time since the last meal was also associated with differences in preference scores across all nutrient groups (Table S3). A longer time since the last meal was associated with higher preference scores for non-sweet carbohydrate and protein in both men and women, lower preference scores for sweet carbohydrate and sweet fat in men, and higher preference scores for dietary fiber in women.
3.2. Associations Between BMI and Food Preference Scores
In the initial analysis, individuals with a BMI <18.5 kg/m2 were excluded to focus on obesity-related food preference patterns across the normal-to-higher BMI range. The standardized β coefficients for the associations between BMI and macronutrient-based preference scores adjusted for age and time since the last meal are shown in Figure 1. In both men (Figure 1A) and women (Figure 1B), BMI was positively associated with the fat group, particularly non-sweet fat, and inversely associated with the dietary fiber group.
Figure 2 shows the associations between preference scores for individual food items and BMI in men (Figure 2A) and women (Figure 2B). Higher BMI was associated with higher preference scores for several non-sweet fat items, including deep-fried foods, hamburgers, and high-fat ramen noodles, in both genders. Among the sweet carbohydrate items, only soft drinks (juice) were positively associated with BMI in both genders. In contrast, higher BMI was associated with lower preference scores for multiple types of dietary fiber–rich foods, particularly among women. Notably, the preference for vegetables showed the strongest inverse association with BMI for both genders.
3.3. Differences in Food Preference Scores According to Obesity Status and Meal Timing
Next, we compared the macronutrient-based preference scores between individuals with a BMI ranging from 18.5 to <25.0 kg/m2 (normal weight) and those with a BMI ≥25.0 kg/m2 (obesity), stratified by the time since the last meal and adjusted for age and gender. For this analysis, time since the last meal was dichotomized at 3 h, approximately the median value in the study population, into <3 h (normal weight, n = 5,253; obesity, n = 1,326) and ≥3 h (normal weight, n = 5,078; obesity, n = 1,436). This cutoff was also supported by physiological evidence that postprandial glycemic dips occurring 2–3 h after a meal predict subsequent hunger and energy intake, indicating a transition from postprandial satiety to re-emerging appetite [10]. As shown in Figure 3, the interaction between obesity status, defined by BMI category (18.5 to <25.0 vs. ≥25.0 kg/m²), and dichotomized time since the last meal (<3 h vs. ≥3 h) was significant for all nutrient groups. In normal-weight individuals, non-sweet carbohydrate, non-sweet fat, and protein scores were lower at <3 h than at ≥3 h, whereas no such within-group differences were observed in individuals with obesity (Figure 3A, 3C, 3E). At <3 h, these scores were higher in individuals with obesity than in normal-weight individuals, with no differences at ≥3 h. In contrast, sweet carbohydrate (Figure 3B) and sweet fat (Figure 3D) scores were lower at ≥3 h than at <3 h in both BMI categories but were higher in individuals with obesity at <3 h. In terms of dietary fiber, scores were lower in individuals with obesity than in normal-weight individuals at ≥3 h (Figure 3F).
3.4. Associations Between BMI and Food Preference Scores in Women with BMI <25.0 kg/m2
Given that a substantial proportion of women in our cohort had a BMI <18.5 kg/m2 (n = 1,848; 24.6% of women), and in light of growing attention in Japan to health issues related to low BMI, recently conceptualized as Female Underweight/Undernutrition Syndrome (FUS) [11], we additionally examined the associations between BMI and food preference scores among women with a BMI <25.0 kg/m2, focusing on normal-weight and underweight individuals. The positive association between BMI and preference scores for the fat group, particularly non-sweet fat, was consistent with that observed in the initial analysis of individuals with a BMI ≥18.5 kg/m2, whereas no significant association was observed for dietary fiber (Figure S3A and S3B). Notably, among women with a BMI <25.0 kg/m2, BMI was also positively associated with the non-sweet carbohydrate group (Figure S3A), particularly with preference for white rice and udon/soba noodles at the individual food-item level (Figure S3B), suggesting that women with lower BMI had lower preferences for these staple carbohydrate foods commonly consumed in Japan.
4. Discussion
In this large-scale web-based survey, we demonstrated that higher BMI was associated with a greater preference for fat, particularly non-sweet fat, and a lower preference for dietary fiber, especially vegetables. Moreover, whereas macronutrient-based food preference scores differed according to time since the last meal in normal-weight individuals, such differences were attenuated in individuals with obesity, who showed higher preference scores even within 3 h after a meal.
Several interpretations of our findings merit consideration. First, the pronounced preference for non-sweet fatty foods among individuals with higher BMI is consistent with evidence that savory, energy-dense foods promote excess energy intake in modern food environments [12]. The item-level patterns (e.g., deep-fried foods, hamburgers, and high-fat ramen noodles versus vegetables) suggest a gradient by energy density rather than a uniform shift across macronutrient categories. Furthermore, fat-rich foods may strongly activate reward-related neural pathways, reinforcing palatability-driven intake and potentially creating a feedback loop between food preference and eating behavior [13,14]. Within the sweet carbohydrate group, only preference for soft drinks (juice) was positively associated with BMI in both genders. This observation may be attributable to the widespread accessibility of soft drinks, which can facilitate the translation of preference into actual intake. In addition, liquid carbohydrates may produce weaker satiety than solid foods, partly because of the absence of mastication and more rapid gastric emptying, thereby attenuating compensatory reductions in subsequent energy intake [15]. Furthermore, a dose-response meta-analysis of prospective cohort studies reported that greater consumption of sugar-sweetened beverages was associated with a higher risk of obesity, type 2 diabetes, and all-cause mortality [16]. Collectively, these findings suggest that preference for soft drinks should be considered with caution, as it may contribute to weight gain through both environmental and physiological mechanisms that promote overconsumption and a positive energy balance.
It should be noted that the JFPQ assesses food preference rather than actual dietary habits. Although dietary intake was not assessed in the present study, food preference may not necessarily correspond to actual intake, as food choices and the amount consumed can be influenced by factors such as health consciousness, self-restraint, and food availability. In our previous study, JFPQ-based preference scores for carbohydrate- and fat-rich foods were associated with dietary intake assessed using an FFQ among individuals with abdominal obesity, whereas such associations were limited in healthy volunteers, in whom dietary intake was associated only with preference scores for the dietary fiber group [7]. Thus, the associations between BMI and JFPQ-quantified food preferences observed in the present study may be meaningful because these findings suggest that obesity is linked to subjective desire to eat specific foods per se, which may be particularly relevant to obesity-related eating behavior.
Among normal-weight individuals, preference scores for non-sweet carbohydrates, non-sweet fats, and protein were significantly lower in the postprandial state (<3 h) than in the fasting-like state (≥3 h), likely reflecting satiety and a transient reduction in cravings for savory and energy-dense foods after a meal. Notably, such differences in preference scores according to time since the last meal were attenuated among individuals with obesity, and obesity-associated differences in preference scores were more pronounced within 3 h after a meal across all nutrient-based categories except dietary fiber. These findings suggest that obesity may be characterized by altered feeding-state-related patterns of macronutrient preference. Given that the period 2–3 h after a meal represents a transitional phase during which postprandial satiety may begin to decline and appetite may re-emerge [10], the higher preference scores observed in individuals with obesity even within 3 h after a meal may reflect impaired postprandial suppression of food desire. This pattern might reflect disrupted satiety signaling, including reduced glucagon-like peptide-1 (GLP-1) responsiveness [17] and impaired postprandial ghrelin regulation [18,19]. In addition, obesity-associated eating behaviors, such as rapid eating, as reported in previous studies [8,20], may further impair postprandial satiation and thereby contribute to increased subsequent food intake [21].
The inverse association between BMI and preference scores for the dietary fiber group, particularly vegetables, is noteworthy. Previous epidemiological studies have shown that lower intake of dietary fiber and vegetables is associated with obesity and weight gain [22,23]. In general, this association may be partly explained by social and environmental factors, including socioeconomic disadvantage, which can limit access to healthier foods such as vegetables and fruits while promoting greater consumption of lower-cost, energy-dense foods [24,25]. However, an important finding of the present study is that individuals with obesity showed a lower preference for these dietary fiber-rich foods themselves, highlighting an association at the level of desire to eat. Moreover, preference for the dietary fiber group was significantly lower in individuals with obesity than in normal-weight individuals, especially when more than 3 hours had elapsed since the last meal. This pattern may indicate that a lower preference for low-energy-density, fiber-rich foods becomes more evident under conditions in which appetite is more likely to re-emerge, potentially shifting food preference toward more energy-dense alternatives and contributing to excess energy intake. Importantly, low intake of dietary fiber-rich foods, such as vegetables, has been suggested to increase obesity risk through alterations in the gut microbiota composition [26], which may reduce short-chain fatty acid production and disrupt the gut–brain signaling involved in appetite regulation and food reward [27,28]. In addition, preference for vegetables can be shaped not only by innate taste predispositions but also by repeated exposure and the home food environment early in life [29,30,31]. Thus, lower preferences for vegetables and dietary fiber may reflect the cumulative effects of insufficient consumption of these foods during childhood on later food preference formation. Further studies are needed to examine the associations of social determinants of health, including educational attainment and household income, with food preferences and obesity.
The additional analysis among women with a BMI <25.0 kg/m2 also provides exploratory insight into low BMI in women, which has recently received increasing attention in Japan as FUS. FUS has been proposed as a health concept encompassing diverse physical and psychological disorders related to underweight or undernutrition, especially in premenopausal women, including low muscle mass and reduced muscle strength, menstrual irregularities, abnormalities in bone metabolism, eating disorders, and depressive symptoms [11]. Notably, in the present cohort, nearly one in four women had a BMI <18.5 kg/m2, underscoring the relevance of this issue in Japanese women. In this context, lower preference for staple carbohydrate foods commonly consumed in Japan, such as rice and udon/soba noodles, may represent a distinctive food preference pattern associated with lower BMI in women. A similar pattern was not observed among men with a BMI <25.0 kg/m2 (data not shown). This interpretation is consistent with previous observations in young Japanese women showing that underweight women with a desire for thinness consumed less cereal and rice than normal-weight women [32], suggesting that avoidance of staple carbohydrate foods may characterize a subgroup of women with low BMI and potentially FUS-related undernutrition. Further studies are needed to clarify whether reduced preference for staple non-sweet carbohydrate foods contributes to underweight and undernutrition or reflects broader dietary, psychosocial, or health-related factors in women.
Our findings should be interpreted with caution. First, the cross-sectional design precludes causal inference, and the self-reported nature of the data may have introduced reporting bias, including social desirability bias, as well as misclassification. Second, the web-based sampling approach may have contributed to selection bias. Third, although BMI was significantly associated with multiple food preference scores, the standardized β coefficients were modest in magnitude. Nevertheless, even small effect sizes may be informative at the population level, particularly for multifactorial traits such as obesity. Moreover, despite the inherently subjective nature and potential variability of self-reported preference scores, the consistent associations observed across related food categories support the robustness of the findings.
5. Conclusions
Findings from our large cohort of the Japanese population demonstrate that obesity is associated with distinctive food preference patterns, that is, patterns of desire to consume specific foods, which are potentially linked to eating behavior. Our findings highlight food preference profiling as a valuable approach to guide personalized nutritional counseling for weight management and to identify individuals at risk of future weight gain, with potential implications for preventing obesity-related adverse health outcomes.
Supplementary Materials
The following supporting information can be downloaded at the website of this paper posted on Preprints.org. Table S1: Differences in food preference scores by gender in normal-weight individuals; Table S2: Differences in food preference scores according to age categories in normal-weight individuals.; Table S3: Differences in food preference scores according to time since last meal in normal-weight individuals. Figure S1: Nutrient-based classification framework of the JFPQ.; Figure S2: Flow diagram of participants included in the present analysis.; Figure S3: Associations between food preference scores and BMI among women with a BMI <25.0 kg/m2.
Author Contributions
Conceptualization, Y.F., Y.O. and H.Ni.; Methodology, Y.F., Y.O. and H.Ni.; Validation, H.Na., S.F. and N.N.; Formal analysis, S.S., K.F., Y.F., Y.O., Y.K. and K.K.; Investigation, S.S., K.F., Y.F., Y.O., C.T. and N.N.; Resources, N.N.; Data curation, S.S., K.F., Y.F. and Y.O.; Writing—original draft preparation, S.S., K.F., Y.F. and Y.O.; Writing—review and editing, H.Na., S.F., N.N., H.Ni. and I.S.; Visualization, S.S.; Supervision, Y.F.; Project administration, H.Ni. and I.S.; Funding acquisition, Y.F., Y.O. and H.Ni. All authors have read and agreed to the published version of the manuscript.
Funding
This work was supported in part by the Lotte Foundation, a Lotte Research Promotion Grant (to Y.F.), Japan Society for the Promotion of Science (C) no. 26K21107 (to Y.O.), and Manpei Suzuki Diabetes Foundation (to H.Ni.). The funding agencies had no role in the study design, data collection, analysis, decision to publish, or preparation of the manuscript.
Institutional Review Board Statement
This study was conducted in accordance with the Declaration of Helsinki and approved by the Human Ethics Committee of Osaka University (no. 24163).
Informed Consent Statement
Consent for the use of survey responses was obtained online from all panel members at the time of registration with Cross Marketing Inc. This study used only processed statistical data without personally identifiable information; therefore, additional individual consent was not obtained. Information about the study, including the opportunity to decline participation, was provided through an opt-out notice linked on the survey top page.
Data Availability Statement
The data presented in this study are available from the corresponding author upon reasonable request.
Acknowledgments
We thank all of the members of the Adiposcience Laboratory at the Department of Metabolic Medicine, Graduate School of Medicine, The University of Osaka, for their valuable discussions and suggestions.
Conflicts of Interest
Y.F. and H.Na. are members of the “Department of Metabolism and Atherosclerosis,” which is a sponsored course endowed by Kowa Co., Ltd. The funder had no role in the study design, analysis, or preparation of the manuscript.
References
- Jaacks, L.M.; Vandevijvere, S.; Pan, A.; et al. The obesity transition: stages of the global epidemic. Lancet Diabetes Endocrinol. 2019, 7(3), 231–240. [Google Scholar] [CrossRef] [PubMed]
- Loos, R.J.F.; Yeo, G.S.H. The genetics of obesity: from discovery to biology. Nat. Rev. Genet. 2022, 23(2), 120–133. [Google Scholar] [CrossRef] [PubMed]
- Anekwe, C.V.; Jarrell, A.R.; Townsend, M.J.; Gaudier, G.I.; Hiserodt, J.M.; Stanford, F.C. Socioeconomics of Obesity. Curr. Obes. Rep. 2020, 9(3), 272–279. [Google Scholar] [CrossRef] [PubMed]
- Stuber, G.D.; Schwitzgebel, V.M.; Lüscher, C. The neurobiology of overeating. Neuron 2025, 113(11), 1680–1693. [Google Scholar] [CrossRef] [PubMed]
- Finlayson, G.; King, N.; Blundell, J.E. Is it possible to dissociate 'liking' and 'wanting' for foods in humans? A novel experimental procedure. Physiol. Behav. 2007, 90(1), 36–42. [Google Scholar] [CrossRef] [PubMed]
- de Bruijn, S.E.; de Vries, Y.C.; de Graaf, C.; Boesveldt, S.; Jager, G. The reliability and validity of the Macronutrient and Taste Preference Ranking Task: A new method to measure food preferences. Food Qual. Prefer. 2017, 57, 32–40. [Google Scholar] [CrossRef]
- Nagai, N.; Fujishima, Y.; Tokuzawa, C.; et al. Food Preference Assessed by the Newly Developed Nutrition-Based Japan Food Preference Questionnaire and Its Association with Dietary Intake in Abdominal-Obese Subjects. Nutrients 2024, 16(23), 4252. [Google Scholar] [CrossRef] [PubMed]
- Fujii, K.; Fujishima, Y.; Kimura, Y.; et al. Large-scale web-based survey on eating behaviour in the Japanese general population using a dietary behaviour questionnaire. Diabetes Obes. Metab. 2025, 27(10), 5737–5747. [Google Scholar] [CrossRef] [PubMed]
- Ogawa, W.; Hirota, Y.; Miyazaki, S.; et al. Definition, criteria, and core concepts of guidelines for the management of obesity disease in Japan. Endocr. J. 2024, 71(3), 223–231. [Google Scholar] [CrossRef] [PubMed]
- Wyatt, P.; Berry, S.E.; Finlayson, G.; et al. Postprandial glycaemic dips predict appetite and energy intake in healthy individuals. Nat. Metab. 2021, 3(4), 523–529. [Google Scholar] [CrossRef] [PubMed]
- Tamura, Y.; Ogawa, W.; Ishii, K.; et al. Female Underweight/Undernutrition Syndrome (FUS): An Emerging Health Concept in Premenopausal Women - Secondary Publication (English Translation of the Japanese Statement). J. Obstet. Gynaecol. Res. 2026, 52(2), e70201. [Google Scholar] [CrossRef] [PubMed]
- Prentice, A.M.; Jebb, S.A. Fast foods, energy density and obesity: a possible mechanistic link. Obes. Rev. 2003, 4(4), 187–194. [Google Scholar] [CrossRef] [PubMed]
- Edwin Thanarajah, S.; DiFeliceantonio, A.G.; Albus, K.; et al. Habitual daily intake of a sweet and fatty snack modulates reward processing in humans. Cell Metab. 2023, 35(4), 571–584.e6. [Google Scholar] [CrossRef] [PubMed]
- McDougle, M.; de Araujo, A.; Singh, A.; et al. Separate gut-brain circuits for fat and sugar reinforcement combine to promote overeating. Cell Metab. 2024, 36(2), 393–407.e7. [Google Scholar] [CrossRef] [PubMed]
- Pan, A.; Hu, F.B. Effects of carbohydrates on satiety: differences between liquid and solid food. Curr. Opin. Clin. Nutr. Metab. Care 2011, 14(4), 385–390. [Google Scholar] [CrossRef] [PubMed]
- Qin, P.; Li, Q.; Zhao, Y.; et al. Sugar and artificially sweetened beverages and risk of obesity, type 2 diabetes mellitus, hypertension, and all-cause mortality: a dose-response meta-analysis of prospective cohort studies. Eur. J. Epidemiol. 2020, 35(7), 655–671. [Google Scholar] [CrossRef] [PubMed]
- Færch, K.; Torekov, S.S.; Vistisen, D.; et al. GLP-1 Response to Oral Glucose Is Reduced in Prediabetes, Screen-Detected Type 2 Diabetes, and Obesity and Influenced by Sex: The ADDITION-PRO Study. Diabetes 2015, 64(7), 2513–2525. [Google Scholar] [CrossRef] [PubMed]
- English, P.J.; Ghatei, M.A.; Malik, I.A.; Bloom, S.R.; Wilding, J.P. Food fails to suppress ghrelin levels in obese humans. J. Clin. Endocrinol. Metab. 2002, 87(6), 2984. [Google Scholar] [CrossRef] [PubMed]
- le Roux, C.W.; Patterson, M.; Vincent, R.P.; Hunt, C.; Ghatei, M.A.; Bloom, S.R. Postprandial plasma ghrelin is suppressed proportional to meal calorie content in normal-weight but not obese subjects. J. Clin. Endocrinol. Metab. 2005, 90(2), 1068–1071. [Google Scholar] [CrossRef] [PubMed]
- Yamane, M.; Ekuni, D.; Mizutani, S.; et al. Relationships between eating quickly and weight gain in Japanese university students: a longitudinal study. Obesity 2014, 22(10), 2262–2266. [Google Scholar] [CrossRef] [PubMed]
- Hawton, K.; Ferriday, D.; Rogers, P.; et al. Slow Down: Behavioural and Physiological Effects of Reducing Eating Rate. Nutrients 2018, 11(1), 50. [Google Scholar] [CrossRef] [PubMed]
- Schwingshackl, L.; Hoffmann, G.; Kalle-Uhlmann, T.; Arregui, M.; Buijsse, B.; Boeing, H. Fruit and Vegetable Consumption and Changes in Anthropometric Variables in Adult Populations: A Systematic Review and Meta-Analysis of Prospective Cohort Studies. PLoS ONE 2015, 10(10), e0140846. [Google Scholar] [CrossRef] [PubMed]
- Nour, M.; Lutze, S.A.; Grech, A.; Allman-Farinelli, M. The Relationship between Vegetable Intake and Weight Outcomes: A Systematic Review of Cohort Studies. Nutrients 2018, 10(11), 1626. [Google Scholar] [CrossRef] [PubMed]
- Irala-Estévez, J.D.; Groth, M.; Johansson, L.; Oltersdorf, U.; Prättälä, R.; Martínez-González, M.A. A systematic review of socio-economic differences in food habits in Europe: consumption of fruit and vegetables. Eur. J. Clin. Nutr. 2000, 54(9), 706–714. [Google Scholar] [CrossRef] [PubMed]
- Conklin, A.I.; Forouhi, N.G.; Suhrcke, M.; Surtees, P.; Wareham, N.J.; Monsivais, P. Variety more than quantity of fruit and vegetable intake varies by socioeconomic status and financial hardship. Findings from older adults in the EPIC cohort. Appetite 2014, 83, 248–255. [Google Scholar] [CrossRef] [PubMed]
- Delzenne, N.M.; Bindels, L.B.; Neyrinck, A.M.; Walter, J. The gut microbiome and dietary fibres: implications in obesity, cardiometabolic diseases and cancer. Nat. Rev. Microbiol. 2025, 23(4), 225–238. [Google Scholar] [CrossRef] [PubMed]
- den Besten, G.; van Eunen, K.; Groen, A.K.; Venema, K.; Reijngoud, D.J.; Bakker, B.M. The role of short-chain fatty acids in the interplay between diet, gut microbiota, and host energy metabolism. J. Lipid Res. 2013, 54(9), 2325–2340. [Google Scholar] [CrossRef] [PubMed]
- Dalile, B.; Van Oudenhove, L.; Vervliet, B.; Verbeke, K. The role of short-chain fatty acids in microbiota-gut-brain communication. Nat. Rev. Gastroenterol. Hepatol. 2019, 16(8), 461–478. [Google Scholar] [CrossRef] [PubMed]
- Johnson, S.L. Developmental and Environmental Influences on Young Children's Vegetable Preferences and Consumption. Adv. Nutr. 2016, 7(1), 220S–231S. [Google Scholar] [CrossRef] [PubMed]
- Fletcher, S.; Wright, C.; Jones, A.; Parkinson, K.; Adamson, A. Tracking of toddler fruit and vegetable preferences to intake and adiposity later in childhood. Matern Child Nutr. 2017, 13(2), e12290. [Google Scholar] [CrossRef] [PubMed]
- Nekitsing, C.; Hetherington, M.M.; Blundell-Birtill, P. Developing Healthy Food Preferences in Preschool Children Through Taste Exposure, Sensory Learning, and Nutrition Education. Curr. Obes. Rep. 2018, 7(1), 60–67. [Google Scholar] [CrossRef] [PubMed]
- Mori, N.; Asakura, K.; Sasaki, S. Differential dietary habits among 570 young underweight Japanese women with and without a desire for thinness: a comparison with normal weight counterparts. Asia Pac. J. Clin. Nutr. 2016, 25(1), 97–107. [Google Scholar] [CrossRef] [PubMed]
Figure 1.
Associations between macronutrient-based preference scores and BMI in men and women. (A and B) Standardized β (Stdβ) coefficients for the associations between food preference scores for each macronutrient group and body mass index (BMI) in men (n=7,417) (A) and women (n=5,676) (B) with a BMI ≥18.5 kg/m2. Food preference scores were categorized into carbohydrate (non-sweet and sweet), fat (non-sweet and sweet), protein, and dietary fiber groups. Standardized β coefficients were derived from multiple linear regression analyses to assess the association between scores for each macronutrient group and BMI, adjusted for age and time since the last meal. Positive β values indicate an association with higher BMI, whereas negative β values indicate an association with lower BMI. The corresponding false discovery rate (FDR)-adjusted P values are shown alongside each category.
Figure 1.
Associations between macronutrient-based preference scores and BMI in men and women. (A and B) Standardized β (Stdβ) coefficients for the associations between food preference scores for each macronutrient group and body mass index (BMI) in men (n=7,417) (A) and women (n=5,676) (B) with a BMI ≥18.5 kg/m2. Food preference scores were categorized into carbohydrate (non-sweet and sweet), fat (non-sweet and sweet), protein, and dietary fiber groups. Standardized β coefficients were derived from multiple linear regression analyses to assess the association between scores for each macronutrient group and BMI, adjusted for age and time since the last meal. Positive β values indicate an association with higher BMI, whereas negative β values indicate an association with lower BMI. The corresponding false discovery rate (FDR)-adjusted P values are shown alongside each category.
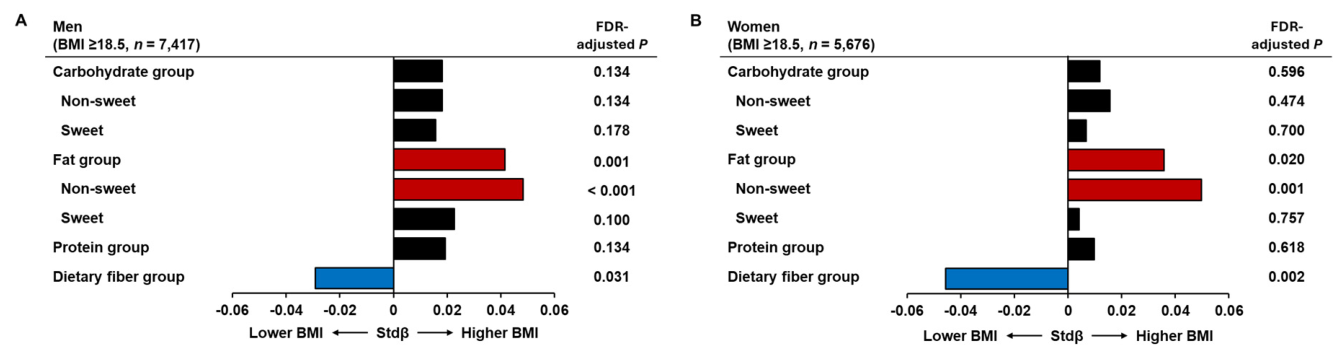
Figure 2.
Associations between preference scores for individual food items and BMI in men and women. (A and B) Standardized β (Stdβ) coefficients for the associations between preference scores for individual food items and body mass index (BMI) in men (n=7,417) (A) and women (n=5,676) (B) with a BMI ≥18.5 kg/m2. Standardized β coefficients were derived from multiple linear regression analyses to assess the association between scores for each individual food item and BMI, adjusting for age and time since the last meal. Positive β values indicate an association with higher BMI, whereas negative β values indicate an association with lower BMI. The corresponding false discovery rate (FDR)-adjusted P values are shown alongside each food item.
Figure 2.
Associations between preference scores for individual food items and BMI in men and women. (A and B) Standardized β (Stdβ) coefficients for the associations between preference scores for individual food items and body mass index (BMI) in men (n=7,417) (A) and women (n=5,676) (B) with a BMI ≥18.5 kg/m2. Standardized β coefficients were derived from multiple linear regression analyses to assess the association between scores for each individual food item and BMI, adjusting for age and time since the last meal. Positive β values indicate an association with higher BMI, whereas negative β values indicate an association with lower BMI. The corresponding false discovery rate (FDR)-adjusted P values are shown alongside each food item.
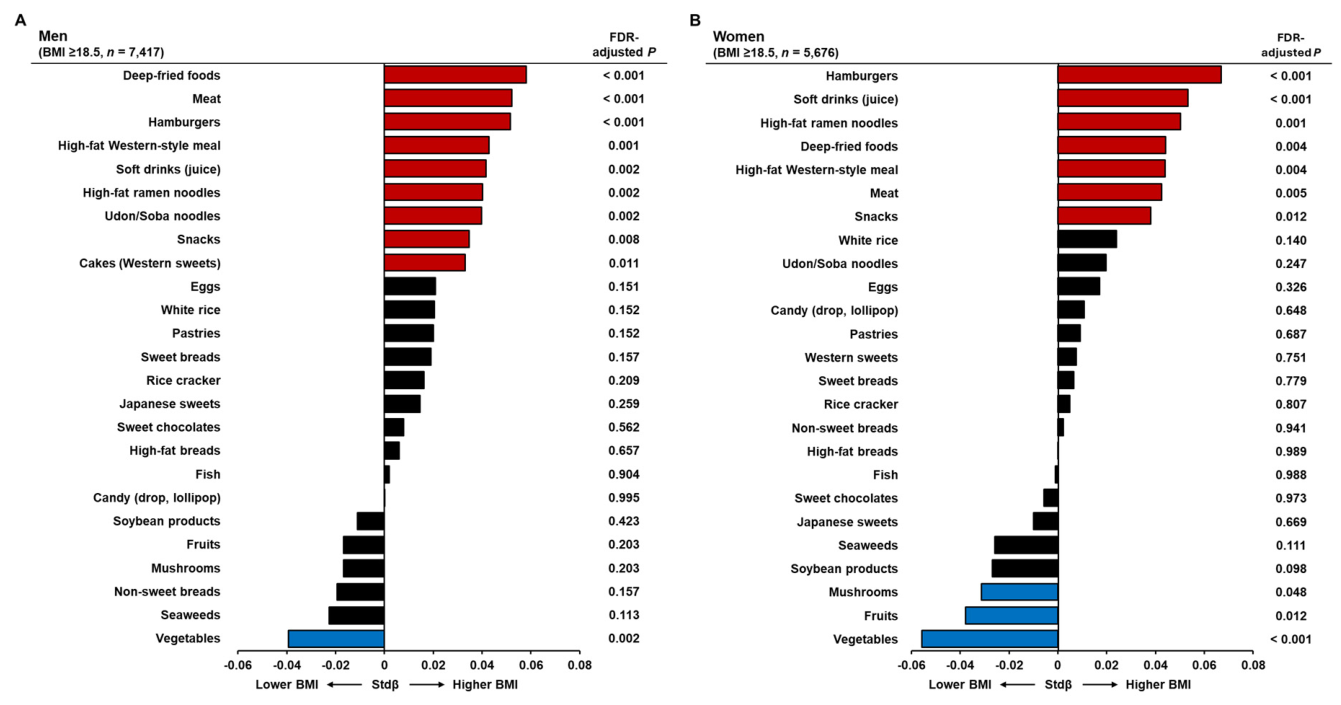
Figure 3.
Effects of obesity status and time since the last meal on macronutrient-based preference scores. Food preference scores for each macronutrient group stratified by BMI category (18.5 to <25.0 vs. ≥25.0 kg/m2) and time since the last meal (<3 vs. ≥3 hours). (A) Carbohydrate group (non-sweet). (B) Carbohydrate group (sweet). (C) Fat group (non-sweet). (D) Fat group (sweet). (E) Protein group. (F) Dietary fiber group. Differences in macronutrient-based preference scores between BMI categories and time-since-last-meal groups were assessed using two-way ANCOVA adjusted for age and gender, with BMI category, time since the last meal, and their interaction included as fixed factors. P values for interaction indicate the interaction between BMI category and time since the last meal. P values shown above the brackets indicate post hoc simple main-effect comparisons, with adjustment for multiple comparisons using the Holm method. Data are presented as least-squares means with 95% confidence intervals.
Figure 3.
Effects of obesity status and time since the last meal on macronutrient-based preference scores. Food preference scores for each macronutrient group stratified by BMI category (18.5 to <25.0 vs. ≥25.0 kg/m2) and time since the last meal (<3 vs. ≥3 hours). (A) Carbohydrate group (non-sweet). (B) Carbohydrate group (sweet). (C) Fat group (non-sweet). (D) Fat group (sweet). (E) Protein group. (F) Dietary fiber group. Differences in macronutrient-based preference scores between BMI categories and time-since-last-meal groups were assessed using two-way ANCOVA adjusted for age and gender, with BMI category, time since the last meal, and their interaction included as fixed factors. P values for interaction indicate the interaction between BMI category and time since the last meal. P values shown above the brackets indicate post hoc simple main-effect comparisons, with adjustment for multiple comparisons using the Holm method. Data are presented as least-squares means with 95% confidence intervals.
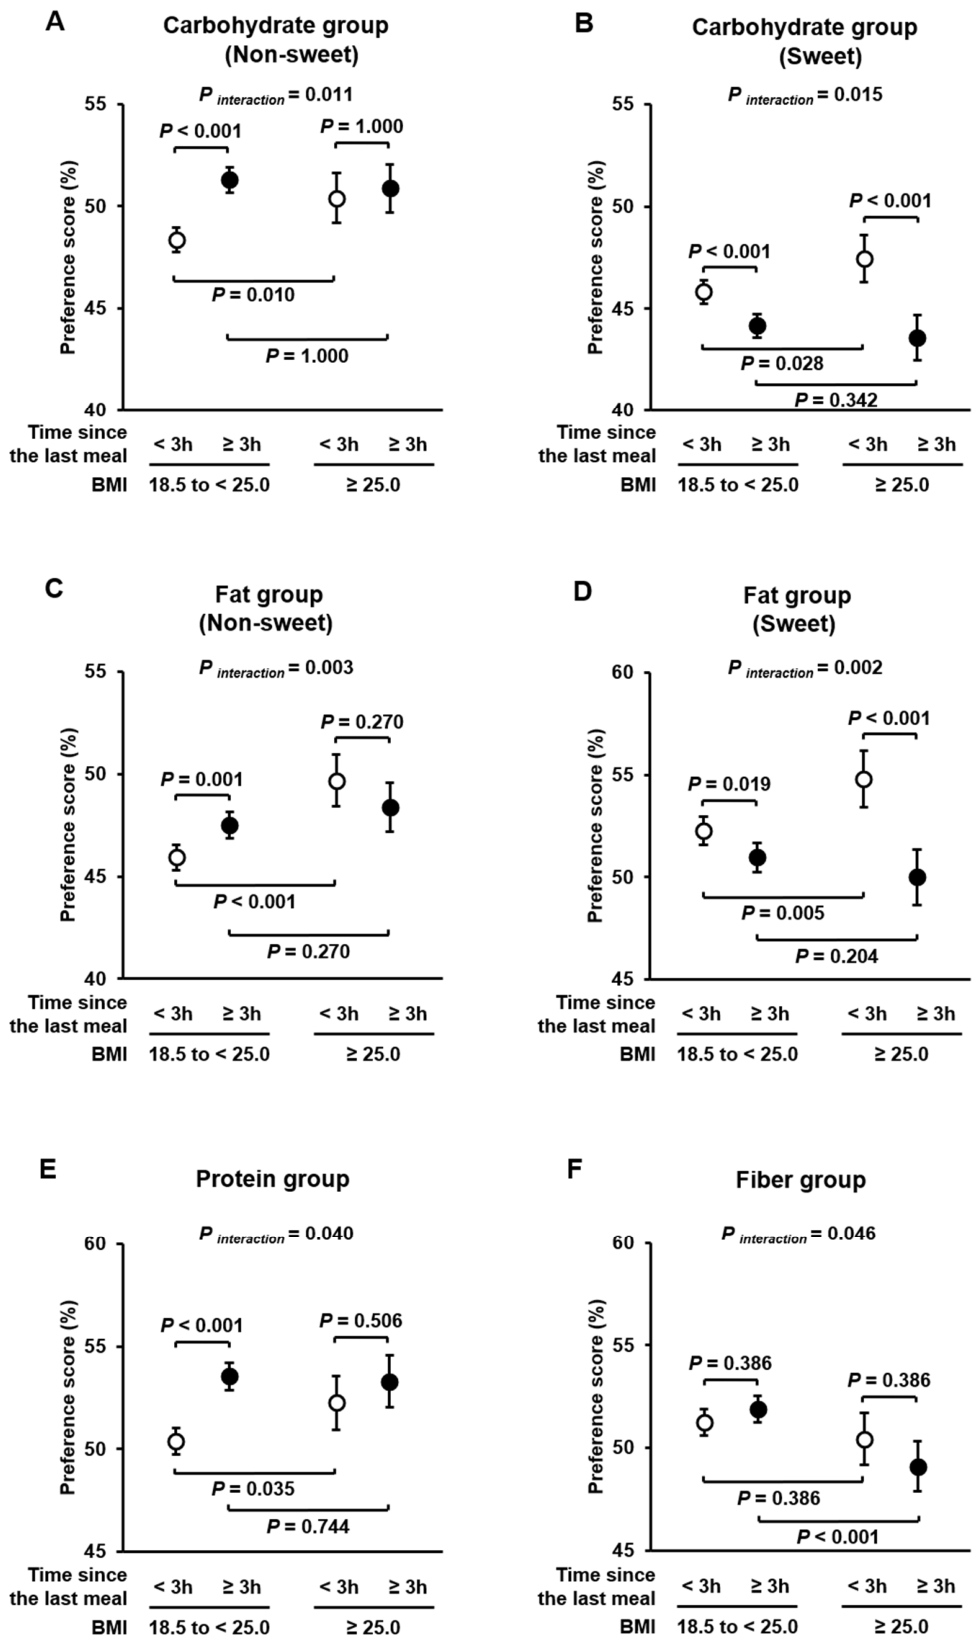

Table 1.
Characteristics of the study participants.
| Total (n = 15495) |
Men (n = 7971) |
Women (n = 7524) |
|
|---|---|---|---|
| Age (years) | 47.1 (13.3) | 47.1 (13.2) | 47.0 (13.3) |
| Age categories, n (%) | |||
| 20s (20–29 years) | 2183 (14.1%) | 1122 (7.2%) | 1061 (6.8%) |
| 30s (30–39 years) | 2643 (17.1%) | 1373 (8.9%) | 1270 (8.2%) |
| 40s (40–49 years) | 3667 (23.7%) | 1926 (12.4%) | 1741 (11.2%) |
| 50s (50–59 years) | 3492 (22.5%) | 1774 (11.4%) | 1718 (11.1%) |
| 60s (60–69 years) | 3510 (22.7%) | 1776 (11.5%) | 1734 (11.2%) |
| BMI (kg/m2) | 22.0 (3.8) | 23.1 (3.8) | 20.8 (3.5) |
| BMI categories, n (%) | |||
| <18.5 kg/m2 | 2402 (15.5%) | 554 (3.6%) | 1848 (11.9%) |
| 18.5 to <25.0 kg/m2 | 10331 (66.7%) | 5433 (35.1%) | 4898 (31.6%) |
| 25.0 to <30.0 kg/m2 | 2218 (14.3%) | 1624 (10.5%) | 594 (3.8%) |
| ≥30.0 kg/m2 | 544 (3.5%) | 360 (2.3%) | 184 (1.2%) |
| Time since last meal, n (%) | |||
| <1 hour | 3140 (20.3%) | 1550 (10.0%) | 1590 (10.3%) |
| 1 to <2 hours | 2439 (15.7%) | 1258 (8.1%) | 1181 (7.6%) |
| 2 to <3 hours | 2181 (14.1%) | 1093 (7.1%) | 1088 (7.0%) |
| 3 to <4 hours | 1502 (9.7%) | 702 (4.5%) | 800 (5.2%) |
| 4 to <5 hours | 1443 (9.3%) | 738 (4.8%) | 705 (4.6%) |
| 5 hours ≥ | 4790 (30.9%) | 2630 (17.0%) | 2160 (14.0%) |
| Food preference score (%) | |||
| Carbohydrate group | 47.3 (20.4) | 49.2 (19.2) | 45.2 (21.3) |
| Non-sweet | 49.9 (22.9) | 52.2 (21.1) | 47.3 (24.4) |
| Sweet | 45.2 (21.4) | 46.8 (20.7) | 43.4 (22.1) |
| Fat group | 48.7 (22.8) | 50.9 (21.4) | 46.3 (24.0) |
| Non-sweet | 47.1 (23.6) | 50.6 (21.9) | 43.4 (24.7) |
| Sweet | 51.9 (26.0) | 51.5 (24.5) | 52.2 (27.4) |
| Protein group | 52.1 (24.4) | 54.8 (22.6) | 49.3 (26.0) |
| Dietary fiber group | 51.2 (23.6) | 50.5 (21.9) | 51.8 (25.2) |
The data are presented as the means (SD) or as the number of subjects (% of the total study population). Food preference scores for each nutrient group were calculated as the percentage of the total score to the full score. BMI, body mass index.
Disclaimer/Publisher’s Note: The statements, opinions and data contained in all publications are solely those of the individual author(s) and contributor(s) and not of MDPI and/or the editor(s). MDPI and/or the editor(s) disclaim responsibility for any injury to people or property resulting from any ideas, methods, instructions or products referred to in the content. |
© 2026 by the authors. Licensee MDPI, Basel, Switzerland. This article is an open access article distributed under the terms and conditions of the Creative Commons Attribution (CC BY) license (http://creativecommons.org/licenses/by/4.0/).
Copyright: This open access article is published under a Creative Commons CC BY 4.0 license, which permit the free download, distribution, and reuse, provided that the author and preprint are cited in any reuse.