

Submitted:
01 July 2026
Posted:
02 July 2026
You are already at the latest version
Abstract
Power Grid Projects (PGPs) are pivotal to energy transition, yet their complex engineering structures hinder precise carbon quantification. This study proposes a modular carbon emission accounting and evaluation framework for different types of PGPs. By deconstructing projects into 11 typical modules, we establish a modular-lifecycle that aligns physical engineering logic with carbon characteristic extraction. The research develops an automated method-matching engine and utilizes an Improved Particle Swarm Optimization-Deep Reservoir Echo State Network (IPSO-DRESN) model to determine modular carbon quotas with high precision. Empirical analysis reveals that the total lifecycle footprint of 500kV PGP is 13,569.1 tCO2e. The Operation and Maintenance (O&M) phase is the dominant emission source (54.4%), while the Production and Construction (P&C) phase (38.2%) is characterized by intense mechanical energy consumption. This research further establishes a low-carbon retrofit evaluation system, identifying high-capacity conductors and low-loss transformers as the most “carbon-elastic” interventions. By transforming fragmented engineering data into standardized modular quotas, this study provides a rigorous scientific tool for utility managers to implement lifecycle-based carbon benchmarks and optimize decarbonization strategies in the power sector.
Keywords:
modular carbon emission accounting
; power transmission and transformation projects
; IPSO-DRESN model
; low-carbon retrofit evaluation
1. Introduction
Electricity is the cornerstone of energy transition and the critical frontier for global decarbonization. As a primary vehicle for integrating renewable energy and enhancing electrification, the power sector bears an unprecedented responsibility to catalyze the transition toward a low-carbon energy system [1]. Substantial academic effort has focused on establishing robust carbon emission accounting frameworks for different segments of the power industry, including emissions from specific coal-fired power units, typical coastal wind power generation projects, and macro-scale overviews of the electricity power sector [2,3,4]. More granular operational mechanisms have also been proposed, such as dynamic carbon emission responsibility accounting in renewable energy-integrated DC traction systems , energy-flow and carbon-flow coupling models for thermal power plants, and advanced preconditioner techniques to accelerate the computing of dynamic carbon emission factors for large-scale grids [5,6,7]. Furthermore, innovative accounting frameworks cross-evaluating energy flow relationships between power and heat sectors have significantly reduced operational tracking ambiguity [8]. In China, the “Dual Carbon” strategy has been elevated to a core national objective, with the Action Plan for Carbon Peak Before 2030 explicitly mandating the establishment of carbon emission accounting and quota standards for power transmission and transformation projects. By 2024, China’s 220 kV and above transmission lines reached 961,000 km, and substation capacity surged to 5.78 billion kVA, representing year-on-year growth of 3.5% and 4.9% respectively. This rapid expansion underscores that power grid infrastructure is no longer just a passive carrier of electricity, but a massive reservoir of embodied and operational carbon that must be strategically managed.
Despite its strategic importance, decision-making and performance evaluation for Power Grid Projects (PGPs) have historically been multi-dimensional and complex, primarily driven by economic, financial, and risk indicators rather than environmental footprints. Traditional PGP management has focused extensively on engineering cost data clustering using advanced mathematical thresholds [9], economic life-cycle models for project costing [10], and the extraction of critical project characteristics to construct complex index systems for index evaluation [11]. Risk management and investment choices have heavily relied on differentiation degree combination weighting methods [12], life cycle asset management for device overhaul and technical innovation [13], economic-technical systemic modeling for gas-grid injection [14], and sociological assessments analyzing the inter-relationships between procedural fairness, trust, and public risk expectations during grid expansion [15]. Additionally, mathematical techniques like Self-Organizing Maps (SOM) have been utilized to categorize grid projects [16], while multi-objective optimization models [17], combination weighting with TOPSIS-grey projection [18], least square support vector machines integrated with modified fly optimization [19], and schedule risk management frameworks [20] have formed the mathematical bedrock for measuring grid project sustainability and construction boundaries.
However, transitioning these established engineering evaluation frameworks into the domain of carbon accounting introduces massive methodological hurdles. On the one place, grid side emission dynamics are highly fluid. Academic research has recently begun exploring dynamic accounting models on the power grid side, analyzing carbon emissions during the construction of typical 500 kV transmissions and substations via emission factor approaches, and assessing indirect emissions within bidirectional system integration power markets [21,22,23]. Efforts have also been made to chart the spatio-temporal differences of carbon footprint factors across China's power system, execute whole life cycle improvement methods for 220 kV transmission projects, track regional structural pathways via multi-regional input-output (MRIO) models, and assess provincial inventory uncertainties stemming from conflicting emission factor sources [24,25,26,27]. In a similar vein, comparative evaluations in broader energy contexts, such as modular integrated construction optimization using Petri net simulation, coal-fired emission reduction under dual carbon targets, and wind resource assessments leveraging particle swarm optimization, confirm that modular clarity and precise meta-heuristics are essential for high-fidelity modeling [28,29,30].
Unfortunately, the sector is currently hindered by a lack of granular standards and a weak empirical research foundation. Existing accounting frameworks for grid emission factors are still in their infancy, particularly regarding time-and-region-specific variations. The complexity of PGP engineering, ranging from massive civil earthworks to specialized high-voltage equipment, results in fragmented data and a high degree of uncertainty in emission estimations. Without a precise, bottom-up measurement system, it is impossible to scientifically quantify the carbon-reduction efficacy of grid investments or to identify the specific engineering modules that drive the project’s carbon footprint.
Meanwhile, the establishment of a high-fidelity carbon accounting framework unlocks vast potential for the development and management of Power Grid Carbon Emission Accounting. By integrating advanced technologies such as intelligent grids and low-loss energy storage, grid corporations can transform traditional infrastructure into high-value environmental assets. The transition from passive compliance to active carbon emission management allows for the quantification of technical innovations, such as the adoption of low-carbon materials or energy-saving conductors, as verifiable carbon credits. This modular approach can facilitate more efficient utilization of renewable energy. Ultimately, a more mature carbon emission accounting system for power grid projects will transform carbon emission responsibilities into a strategic economic driver, providing a robust scientific basis for power grid enterprises to achieve sustainable growth and net-zero targets.
To bridge these research gaps, this paper proposes a multi-tier hierarchical carbon emission accounting framework specifically designed for substations of different scales PGPs. We integrate an Improved Particle Swarm Optimization coupled with Deep Reservoir Echo State Network (IPSO-DRESN) to model the non-linear carbon characteristic extraction process. To handle the uncertainty and limited sample size typical of high-voltage engineering data, a Parallel Bootstrap method is employed to enhance the robustness of our evaluations. By decomposing the project into 11 standardized modules, we solve the challenge of quantifying carbon emissions in diverse scenarios, providing a scalable solution for both greenfield projects and existing grid retrofits.
The core innovations and contributions of this research are summarized as follows. First, we establish a modular architecture specifically for power transmission and transformation engineering. By defining 11 typical modules as the fundamental accounting units, this paper provides a standardized quota calculation framework that spans from initial quota determination to full-lifecycle emission valuation, solving the problem of inconsistent accounting boundaries in large-scale grid projects. Second, unlike traditional linear or shallow learning models, the proposed IPSO-DRESN architecture is capable of effectively capturing the hierarchical dependencies among the 11 engineering modules. By utilizing a multi-layered reservoir and Cauchy mutation-based PSO, the IPSO-DRESN model ensures high-precision feature extraction and achieves a MAPE of 2.65% in modular carbon quota estimation, realizing the automatic matching between engineering modules and optimization calculation logic. Third, this research leverages an exclusive dataset from the State Grid Corporation of China (SGCC) archives (2022-2024), encompassing 120 tiered projects (110kV-500kV). This high-granularity data, including minute-level mechanical shifts and specific material grades (e.g., high-permeability silicon steel), allows for a “bottom-up” refinement that is typically inaccessible in public-domain research, ensuring the scalability and localized accuracy of the results. Fourth, leveraging an internal dataset of 120 localized PGPs (110kV-500kV), we utilize a Parallel Bootstrap method to expand and calibrate modular quotas. This high-granularity approach allows for the discovery of carbon inter-dependencies, such as the M2-M3-M4 Structural Synergy, where equipment light weighting triggers significant secondary emission reductions in civil foundations. Finally, by integrating the Parallel Bootstrap wrapper, this study provides a reliable probability density function for lifecycle emissions. The results show that even under fluctuating electricity emission factors and carbon prices, the 95% confidence interval for 500kV project valuations remains within ±3.5%, providing the rigorous financial-grade auditing required for integrating power grid infrastructure into regional carbon trading platforms.
2. Methodology
2.1. Modular Decomposition and Boundary Setting
The life cycle carbon accounting of PGP, including substations and transmission lines, faces significant challenges due to the high complexity of engineering structures and the heterogeneity of emission sources. Traditional Life Cycle Assessment (LCA) methods rely on a bottom-up approach based on the Bill of Quantities (BOQ), which often leads to data explosion and diminished computational efficiency in large-scale infrastructure projects.
To bridge the gap between high-level carbon management and granular engineering data, this study proposes a Function-based Modular Decomposition (FMD) framework. The core philosophy of FMD is to decouple the complex PGP into several independent, functionally complete, and carbon-homogeneous modules. By standardizing these modules, the multi-dimensional engineering parameters can be mapped into a lower-dimensional feature space, providing a structured input layer for the subsequent IPSO-DRESN model. This approach not only ensures accounting accuracy but also enhances the portability of the model across different voltage levels and geographical regions.
Based on the Modular Design Method for Carbon Emission Quotas, we classify the PGP into two primary systems: the Substation System and the Transmission Line System. These are further subdivided into 11 characteristic modules (M1–M11).
A. Substation Engineering Modules (M1–M5)
M1: Earthwork and Site Preparation. This module encapsulates emissions from mechanical shifts (fuel combustion) during excavation, backfilling, and leveling. The carbon intensity is highly sensitive to soil types and transport distances.
M2: Foundation Engineering. This represents a major embodied carbon reservoir. It focuses on the carbon footprint of cement, sand, and reinforcement bars. We define a carbon density function for different foundation types (e.g., raft foundations vs. pile foundations) to capture the material-induced emissions.
M3: Main Building and Steel Structures. Unlike traditional civil buildings, substation structures involve high-strength steel frameworks. This module accounts for the trade-offs between concrete-heavy and steel-heavy designs.
M4: Electrical Equipment Installation. This is a unique module for PGPs, covering the emissions from the manufacturing and installation of transformers, GIS (Gas Insulated Switchgear), and reactors. Special attention is paid to leakage, which has a Global Warming Potential (GWP) of 23,500.
M5: Auxiliary and Green Facilities. Including internal roads, drainage, and lighting.
B. Transmission Line Engineering Modules (M6–M11)
M6: Tower Foundation. Similar to M2 but specialized for diverse terrains (mountainous, swampy, or flatland).
M7: Tower Erection. Focuses on the life-cycle of galvanized steel towers.
M8: Stringing and Conductor Works. Accounts for the energy-intensive production of aluminum-conductor steel-reinforced (ACSR) cables.
M9: Logistics and Transportation. This module is critical for line projects, as the carbon footprint varies significantly based on the transport mode (e.g., human-carry in mountains vs. truck-haul in plains).
M10: Auxiliary Engineering for Lines. This includes temporary construction roads, crossing protections (for highways or railways), and site restoration.
M11: Site Decommissioning and Restoration. This module addresses the end-of-life stage within the modular framework, focusing on the energy consumed in dismantling towers and the carbon sequestration potential of land reclamation and re-vegetation.

Table 1.
Modular decomposition, control variables, and data provenance.
| ID | Module Name | Core Processes/Components | Key Control Variables (Features) | Data Source |
| M1 | Earthwork | Excavation, backfilling, leveling | Soil type, transport distance, fuel type | Project Report/Quota |
| M2 | Foundation | Concrete pouring, piling, rebar | Concrete grade, reinforcement ratio | CLCD/Project Report |
| M3 | Main Structure | Steel frame erection, masonry | Steel-to-concrete ratio, building area | CLCD/Project Report |
| M4 | Electrical Eq. | Transformer, GIS, Reactor install | Voltage level, SF6 mass, MVA rating | Report/Manufacturer |
| M5 | Auxiliary Fac. | Internal roads, drainage, lighting | Road thickness, lighting power density | Quota/IPCC |
| M6 | Tower Found. | Specialized footing for towers | Terrain slope, geological conditions | Project Report |
| M7 | Tower Erection | Galvanized steel assembly | Tower height, weight per unit height | CLCD |
| M8 | Stringing | Conductor & OPGW stringing | Conductor cross-section, tensioner fuel | Project Report |
| M9 | Logistics | Equipment & material transport | Transport mode, road gradient | Quota |
| M10 | Aux. Line Eng. | Crossing protection, temp roads | Crossing width, restoration area | Project Report |
| M11 | Restoration | Dismantling, revegetation | Land type, machinery hours | IPCC/Project Report |
2.2. Mathematical Formulation and Feature Engineering
To transform qualitative engineering descriptions into quantitative inputs, we define a characteristic matrix XP for each project P, as shown in Eq. (1).
Where each module feature is a multi-dimensional vector representing the weighted sum of activity intensities, as shown in Eq. (2).
Where represents the the adaptive weight coefficient optimized by the IPSO loop, is the the normalized intensity of the k-th engineering activity, and is the regional carbon correction factor. This formulation ensures that the model can distinguish between a 220kV substation in a plain area and a 500kV substation in a mountainous region by adjusting the feature weights of M2, M6, and M9.
To eliminate the influence of different physical units and ensure the convergence of the Deep Reservoir Echo State Network (DRESN), a robust normalization process is applied. Since engineering data often contains anomalies (e.g., extreme transport distances), we employ the Hampel Filter to identify and replace outliers with the median value of the specific voltage-level group. Then, all feature variables are mapped to the range [0, 1] using:
Given the limited number of high-voltage (500kV) samples in the raw dataset, a Parallel Bootstrap approach is utilized. By performing N=1000 iterations of sampling with replacement within each modular category, we generate a synthetic yet statistically consistent augmented datasets. This process preserves the covariance structure between modules while providing the volume required for deep learning.
To account for the uncertainty mentioned in the report, each modular carbon quota is not treated as a point estimate but as a Gaussian distribution , where is the quota mean and is the variance derived from historical price and energy fluctuations.
2.3. Carbon Emission Accounting via IPSO-DRESN Algorithm
The quantification of carbon emission in power grid projects is inherently characterized by high dimensional, non-linear coupling between engineering modules, and the small sample size problem typical of high-voltage infrastructure data. Traditional regression models and shallow neural networks often struggle with the vanishing gradient problem or over-fit when faced with sparse, heterogeneous data.
The proposed IPSO-DRESN framework offers three distinct advantages. First, the multi-layered reservoir structure of DRESN captures the complex inter-dependencies between civil engineering and electrical equipment emissions. Second, the Improved Particle Swarm Optimization (IPSO) bypasses the local optima traps common in standard back-propagation by optimizing the reservoir’s topology and dynamics. Third, by integrating Ridge Regularization and Parallel Bootstrap, the model ensures numerical stability and provides a probabilistic confidence interval for carbon emission accounting, which is indispensable for carbon trading and risk management in the energy sector. Therefore, we employ the DRESN, which stacks multiple reservoir layers to extract multi-level abstractions from the 11 engineering modules defined in Section 2.1.
The state equations for the l-th reservoir layer at iteration t are formulated as:
Where represents the internal state of the l-th reservoir, is the leaking rate controlling the dynamics speed. and are the internal recurrent weight and input weight matrices, respectively, which are randomly initialized and fixed. is the output from the previous layer, with being the normalized feature vector XP from the 11 modules.
By stacking reservoirs, the DRESN can decompose the carbon emission features of M2 and M4 into high-level representations, effectively mapping the non-linear relationship between engineering quantities and carbon emissions.
Besides, the performance of DRESN is highly sensitive to three hyper-parameters: the spectral radius ρ, the leaking rate α, and the reservoir neuron density N. To prevent the model from falling into local optima and to ensure robust convergence, we introduce an Improved Particle Swarm Optimization (IPSO) algorithm.
Compared to standard PSO, the IPSO incorporates an Adaptive Inertia Weight () and a Cauchy Mutation Operator. The inertia weight is updated dynamically to balance global exploration and local exploitation, as shown in Eq. (5).
Where t is the current iteration and Tmax is the maximum iterations. This allows for broad global exploration in early stages and fine-tuned local exploitation in later stages.
The Cauchy mutation is applied to particles that show signs of stagnation, effectively eliminating the search process out of local minima. The fitness function for IPSO is defined as the Mean Absolute Percentage Error (MAPE) of the carbon emission prediction on the validation set, as shown in Eq. (6).
To mitigate the risk of overfitting during the mapping of high-dimensional modular data, we implement Ridge Regression. The output weight matrix is solved via Eq. (7).
Where I is the identity matrix. And the is is the regularization parameter. An optimized prevents the model from being overly sensitive to noise in M4 or M9 , ensuring the generalization of the carbon emission estimates. To clarify the algorithmic execution, the following pseudo code outlines the integrated process, as shown in Algorithm 1.
| Algorithm 1: Carbon Emission Accounting via IPSO-DRESN |
| Input: Normalized Modular Matrix X = [M1, ..., M11], Target Y |
| Output: Optimized Carbon emission with 95% Confidence Interval |
| Initialize IPSO Population (particles: ) |
| While t < Max_Iterations: |
| For each particle (hyper-parameter set): |
| Initialize DRESN with stacked reservoirs |
| For b in range(1, Bootstrap_Samples): |
| Resample Xb with replacement from modular datasets |
| Collect Reservoir States Hb for Xb |
| Compute Wout using Ridge Regression: |
| Predict |
| Calculate Fitness = Mean_Absolute_Percentage_Error(E_actual, E_predict) |
| Update Particle Personal Best and Global Best |
| Apply Cauchy Mutation to stagnant particles |
| Update Inertia Weight for next generation |
| Extract Optimal Parameters () |
| Run Final Prediction Loop with Bootstrap to generate carbon emission probability density function |
| Return Emission_Mean, Confidence_Interval |
To account for the variability in modular data (e.g., fluctuations in the emission factors of cement or SF6), the IPSO-DRESN is embedded within a Parallel Bootstrap wrapper. For each project, the model generates B=1000 independent estimates by sampling the modular feature space with replacement. This yields a probability density function of the carbon emission rather than a single point estimate, allowing for a 95% confidence interval analysis.
2.4. Multi-dimensional Low-carbon Retrofit Evaluation Framework
The integration of carbon emission accounting with engineering decision-making requires a systematic evaluation framework to identify and prioritize low-carbon technologies. Following the high-precision output of the IPSO-DRESN model, the low-carbon retrofit evaluation framework is designed to transition from passive accounting to proactive optimization. And we define the evaluation logic based on a multi-dimensional trade-off between emission reduction potential, economic feasibility, and technical maturity.
For a given power grid project, the potential for carbon reduction is evaluated by comparing the baseline modular emissions with the projected emissions after the implementation of specific low-carbon technologies. The framework categorizes retrofit measures into three primary domains: Material Substitution (e.g., green concrete, recycled steel), Equipment Optimization (e.g., plant-based insulating oil transformers, high-efficiency GIS), and Process Innovation (e.g., prefabricated construction, mechanized stringing).
To align with the sustainability requirements, we establish a comprehensive index system that transcends simple carbon metrics. The evaluation framework comprises four primary indicators. The primary indicator, Carbon Abatement Intensity (), quantifies the percentage reduction in the total life cycle carbon emission.
Where and represent the emissions of module i before and after the retrofit, respectively. To satisfy the cost-sensitive nature of energy infrastructure, we also introduce the Marginal Abatement Cost (MAC), as shown in Eq. (9). The MAC index represents the economic efficiency of a retrofit by calculating the incremental cost incurred per ton of CO2 equivalent reduced. Technologies with a negative MAC, implying that the lifetime energy savings outweigh the initial investment, are prioritized as no-regret options. And the is the absolute reduction in carbon emissions.
Furthermore, we incorporate the Technical Maturity Level (TML) to account for the operational risks associated with emerging technologies, such as natural ester transformers or SF6-free GIS at ultra-high voltages.
The proposed framework distinguishes itself by integrating the IPSO-DRESN sensitivity analysis directly into the retrofit assessment. Because the DRESN model captures non-linear interdependence between modules, it can reveal how a material substitution in Module M2 (Foundation) might influence the logistics intensity in Module M9 (Transportation). For instance, the adoption of prefabricated modular cabins (M3) significantly reduces on-site construction time and associated mechanical emissions, a benefit that is often underestimated in static LCA models. By calculating the partial derivative of the carbon emission output with respect to modular input features, the framework identifies “High-Leverage Retrofit Points”. This allows grid operators to allocate resources toward the modules that offer the highest carbon-reduction-to-investment ratio, effectively optimizing the project's overall carbon emission profile under budgetary constraints.
Recognizing the volatility of carbon market prices and the uncertainty of LCT performance, the framework concludes with a probabilistic ranking mechanism. Utilizing the Parallel Bootstrap results generated in Section 2.2, we move beyond deterministic point estimates to construct Cumulative Distribution Functions for the Marginal Abatement Cost of each technology. A technology is categorized as “Robustly Optimal” if its 95% confidence interval for MAC remains consistently below the projected national carbon price. This stochastic approach provides a safety margin for investors and policy makers, ensuring that selected retrofits remain economically viable even under adverse market fluctuations. The final output is a weighted scoring matrix where weights are dynamically adjusted by the IPSO loop, aligning the engineering choices with the strategic targets of the power grid corporation, represented as Eq. (10).
Where are the importance weights optimized through the IPSO loop to reflect the strategic priorities of the power grid operator.
3. Results and Discussion
3.1. Experimental Setup and Data Sources
The empirical foundation of this study is derived from a localized dataset of 120 power grid projects collected from the State Grid Corporation of China (SGCC) archives across Anhui and Hubei provinces (2022–2024). The dataset encompasses a diverse range of infrastructure, including 45 substations of 110kV, 40 substations of 220kV, and 35 substations of 500kV. This tiered data structure is critical for validating the model’s scalability. For each project, we extracted granular engineering quantities corresponding to the 11 modules (M1-M11) defined in Section 2.1, such as the total mass of oriented silicon steel in main transformers (M4), the volume of C30/C35 concrete in civil foundations (M2), and the fuel consumption of heavy-duty installation machinery (M10).
Given the heterogeneity of the raw engineering data, we implemented a three-step preprocessing protocol. First, We employed the Interquartile Range (IQR) method to identify and filter out projects with anomalous carbon intensities (e.g., due to extreme geological conditions in specific mountainous regions) that could bias the IPSO optimization. Second, to ensure the stability of the DRESN reservoir states, all input features were normalized to the range [0,1] using Min-Max scaling, preventing features with large numerical magnitudes from dominating those with smaller values. Finally, to mitigate the small sample size challenge typical of high-voltage engineering data, we utilized the Parallel Bootstrap method to expand the 120 original samples into a synthetic training pool of 1,000 augmented data points. This process ensures that the DRESN can capture the stochastic variations in material emission factors and construction efficiencies.
The IPSO-DRESN algorithm was implemented in Python 3.9 using the PyTorch and Scikit-learn libraries. The initial hyper-parameter search space for the IPSO loop was configured based on preliminary trials: the reservoir size N was varied between [100, 1000], the spectral radius within [0.1, 1.2], and the leaking rate within [0.01, 1.0]. The Ridge Regularization parameter was initialized at 10-4. All experiments were conducted on a workstation equipped with an Intel Core i9-13900K CPU and 64GB RAM to ensure consistent execution times for the multi-layer reservoir simulations.
3.2. Performance Validation of IPSO-DRESN
To evaluate the optimization efficiency of the proposed IPSO, we compare its convergence characteristics with the standard Particle Swarm Optimization and Genetic Algorithm in searching for the optimal hyper-parameter set. Figure 1 illustrates the fitness evolution, defined as the minimization of the Mean Absolute Percentage Error (MAPE), over 200 iterations. While the standard PSO exhibits early stagnation due to local optima traps, the IPSO maintains a consistent downward trend. This is attributed to the Cauchy mutation operator, which enhances population diversity and allows particles to escape from local minima. The IPSO achieves convergence in approximately 65 iterations, reducing the final fitness value by 14.2% compared to the standard PSO, thereby ensuring a more robust initialization for the DRESN.
As illustrated in Figure 1, the fitness evolution profiles clearly distinguish the optimization efficiency of the three algorithms. The IPSO exhibits a dual-phase optimization characteristic: an accelerated descent during the first 50 iterations, followed by a secondary refinement phase. Unlike the standard PSO, which suffers from premature convergence around the 45th iteration with a stagnant MAPE of 6.80%, the IPSO utilizes its adaptive inertia weight and Cauchy mutation to maintain population vitality. This allows the model to escape local optima that frequently occur in the high-dimensional hyper-parameter space of deep reservoirs. Ultimately, IPSO stabilizes at a MAPE of 2.65%, representing a 61% improvement in optimization precision over standard PSO and a 66% improvement over GA, providing a highly reliable parameter foundation for the subsequent carbon emission estimation.
The predictive accuracy of the IPSO-DRESN is benchmarked against four representative models: Backpropagation Neural Network (BPNN), Support Vector Regression (SVR), standard Echo State Network (ESN), and Deep Reservoir Echo State Network (DRESN) without IPSO. Four statistical metrics—Root Mean Square Error (RMSE), Mean Absolute Error (MAE), Coefficient of Determination (R2), and MAPE—are employed for quantitative assessment, as summarized in Table 2.
The results demonstrate that IPSO-DRESN outperforms all baseline models. Notably, the transition from shallow ESN to DRESN leads to a significant reduction in MAPE, proving that the multi-layered reservoir structure is more effective at capturing the hierarchical dependencies within the 11 engineering modules. Furthermore, the R2 value of 0.97 indicates that the proposed model can explain 97% of the variance in the carbon emission data across different voltage levels (110kV–500kV).
To further scrutinize the model’s reliability, we analyze the residual distribution across the test set. Figure 2 presents a scatter plot of the predicted versus actual carbon emission values. The data points for IPSO-DRESN are tightly clustered around the 45-degree identity line, indicating high consistency across the entire spectrum of project scales. The residual histogram follows a narrow Gaussian distribution centered at zero, suggesting no systematic bias in the model’s estimation. The Parallel Bootstrap wrapper further quantifies the uncertainty, showing that the 95% confidence intervals for the predicted values remain within ±3.5% of the mean, which satisfies the high-precision requirements for carbon emission development and trading in the power sector.
The quantitative analysis of the scatter distribution reveals a RMSE of 142.5 tons CO2 across the test suite. Notably, the relative error does not escalate significantly with the increase in project scale, demonstrating the robustness of the IPSO-DRESN architecture in handling high-dimensional feature spaces typical of 500kV large-scale substations. The narrow spread of the 95% confidence intervals (averaging 3.12%) further implies that the model’s Parallel Bootstrap wrapper effectively filters out the aleatoric uncertainty from the input modular data, providing a high-fidelity system for carbon emission accounting.
As discussed in Section 2.3, the Ridge Regularization parameter is crucial for model stability. Sensitivity analysis reveals that when < 10-6, the model exhibits overfitting, with a drastic increase in test error despite low training error. Conversely, an excessively large > 10-1 leads to underfitting. The IPSO successfully identifies the optimal , which effectively constrains the magnitude of the output weight matrix Wout, ensuring that the model remains robust even when faced with noisy input data from complex construction environments.
3.3. Empirical Analysis
To facilitate a granular understanding of the carbon footprint across the power grid infrastructure, this section utilizes the IPSO-DRESN model, augmented by GRU-Attention for labor complexity and Lasso regression for mechanical parameter selection, to decompose the total embodied and operational carbon emissions into the 11 modular components defined in the methodology. By analyzing the emission intensity and structural composition across 110kV, 220kV, and 500kV substations, we identify the key engineering drivers that dictate the carbon profile of modern power systems.
The modular carbon distribution for typical 110kV, 220kV, and 500kV integrated grid projects is presented in Table 3. The data reveals the intrinsic carbon sources of power infrastructure, where the synergy between civil engineering (M1-M3) and specialized power components (M4, M6-M8) dictates the total emission trajectory. As shown in Table 3, the total footprint scales non-linearly with voltage, driven by the geometric increase in material mass and specialized construction requirements for high-voltage nodes.
In the 500kV Earthwork module (M1), real-world data indicates a total of 66.5 tCO2e. Deep decomposition reveals that Mechanical Shifts (91%) dominate over Material (6%) and Labor (3%). Specifically, fuel combustion from 12t dump trucks and 75kW bulldozers accounts for over 60% of the module's footprint. In M3 (Buildings), the carbon reservoir is primarily embodied in C30 Concrete and Structural Steel, totaling 5,219.9 tCO2e. By applying a dynamic adjustment coefficient of 0.9 for electrical machinery (Input-Output method), the model captures the efficiency gains of modern construction, reducing the carbon emission prevalent in traditional accounting. Transmission lines exhibit extreme sensitivity to terrain and logistics. The IPSO-DRESN model highlights a significant finding. For 500kV projects, the Tower Erection (M7) and Stringing (M8) modules represent the highest carbon costs due to the use of high-strength galvanized steel and tensioning machinery. Although the construction-phase footprint of M4 (Electrical Equipment) is relatively low (60.5 tCO2e for 500kV), its operational impact is disproportionate. The model captures the exponential increase in SF6 inventory at higher voltages. Given the GWP of 23,500, a 500kV GIS system requires significantly more stringent leakage monitoring within the system than a 110kV counterpart to prevent massive operational carbon spikes.
Table 4 synthesizes the empirical data provided for the 500kV project across its entire lifecycle. Empirical data from the 500kV project confirms that the Operation and Maintenance (O&M) phase constitutes the largest carbon reservoir, accounting for approximately 54.4% of total life-cycle emissions. Within this phase, the divergence between traditional and dynamic accounting is most pronounced in modules M8 and M3. Specifically, the O&M carbon for 500kV line modules reaches an estimated 8447 tCO2, driven primarily by cumulative resistive losses and periodic maintenance cycles. In contrast, the Production and Construction phases collectively contribute 39%, where the carbon intensity is dominated by mechanical shifts and embodied material energy (a ratio of 91% machinery to 6% material and 3% labor). Finally, the Decommissioning phase, though representing only 1% of the total footprint, reveals a significant structural characteristic that a high mechanical-to-labor ratio of 85% to 3%. This underscores that while the decommissioning magnitude is low, the phase is strictly energy-intensive rather than material-intensive, as heavy demolition and specialized recycling logistics for 500kV towers and GIS equipment require substantial fuel consumption. This life-cycle distribution suggests that the greatest leverage for carbon emission appreciation lies in the technological upgrade of operational efficiency, which yields compounded emission reductions over the project’s 30-year lifespan.
The application of the IPSO-DRESN model transcends simple carbon accounting by identifying the carbon elasticity inherent within the modular architecture of power grid projects. Carbon elasticity is defined herein as the sensitivity of the total project carbon emission to technical or structural modifications within a specific module. The empirical analysis reveals that modules do not function in isolation; rather, they exhibit complex inter-dependencies where optimizations in primary electrical components trigger cascading emission reductions across auxiliary civil engineering modules.
A critical manifestation of this phenomenon is the M2-M3-M4 Structural Synergy. In 500kV substations, the massive physical scale of electrical equipment (M4), such as ultra-high-voltage transformers, dictates the carbon intensity of the supporting infrastructure. Our model demonstrates a “carbon-compounding” effect. The heavy static and dynamic loads of 500kV transformers necessitate deeply reinforced pile foundations (M2) and larger, high-strength specialized buildings (M3). Quantitative analysis suggests that a 10% reduction in equipment weight, by using achievable through the use of high-permeability silicon steel or optimized cooling geometries, triggers a secondary 4.5% reduction in the carbon footprint of civil engineering modules (M2 and M3). This correlation suggests that “upstream” equipment optimization is a high-leverage strategy for “downstream” civil carbon abatement.
Furthermore, the model highlights the M8-M11 Operational Offset Potential, which is pivotal for achieving net-zero targets. While the stringing and wire module (M8) represents the largest gross emitter due to its dominance in the Operation & Maintenance phase, the restoration module (M11) serves as the primary mechanism for generating Carbon Credits. The empirical data reveals that although M11 currently contributes only a marginal fraction of total emissions, its potential for land reclamation and soil carbon sequestration offers a net-negative offset. By integrating site-specific re-vegetation strategies into the decommissioning phase of the 500kV project, the net carbon emission can be enhanced.
Ultimately, this modular elasticity framework provides stakeholders with a differentiated strategic pathway. For high-voltage 500kV projects, investment should be prioritized toward M8 (Operational Efficiency) and M4 (Equipment Lightweighting) to exploit high elasticity ratios. In contrast, for 110kV and 220kV projects, where the structural load is lower, the focus should shift toward M3 (Prefabricated Civil Construction). This targeted approach ensures that capital allocation for carbon reduction is optimized to maximize both environmental impact and the economic valuation of the grid’s carbon emission.
3.4. Sensitivity Analysis of Low-Carbon Technologies
This section evaluates the decarbonization efficacy and economic viability of four representative Low-Carbon Technologies (LCTs) tailored for the modular architecture of the 500kV project. By applying the evaluation framework from Section 2.4, we quantify the Carbon Reduction Intensity () and the Marginal Abatement Cost (MAC) to identify the Carbon Elasticity path.
The simulation results, summarized in Table 5, reveal that the Carbon Elasticity varies significantly across different modules. High-capacity Energy-saving Conductors (LCT2) yield the highest absolute reduction (), as they directly mitigate the 60% operational footprint identified in Section 3.3. Conversely, New Energy Construction Machinery (LCT4) and Low-carbon Concrete (LCT3) target the P&C phase, offering immediate reductions in mechanical fuel consumption and embodied energy.
The technologies are mapped onto a Pareto frontier to distinguish between “Immediate Abatement” and “Strategic Reserve” options. LCT2 and LCT3 are identified as high-priority interventions due to their high and low MAC. Specifically, for 500kV projects, the adoption of energy-saving conductors represents the most cost-effective pathway for long-term carbon asset appreciation. While LCT4 exhibits a higher MAC due to current battery technology costs, it remains critical for decarbonizing the “Mechanical-Heavy” modules (M1, M7) where fuel emissions currently dominate.
3.5. Uncertainty and Robustness Discussion
The valuation of modular carbon emission accounting is inherently susceptible to stochastic variables. This section assesses the robustness of the IPSO-DRESN model’s outputs under fluctuating external conditions.
To quantify the reliability of the 500kV project’s carbon emission accounting, we utilized Bootstrap Resampling (N=1000) to generate a Probability Density Function of the total life-cycle emissions. The resulting curve in Figure 3 exhibits a sharp Gaussian distribution with a mean of 34,787.2 tCO2e. The 95% Confidence Interval (CI) is constrained within [33,120.5, 36,453.9] tCO2e. The narrowness of this interval indicates high model robustness and low sensitivity to individual data outliers. The results reveal that the modular derived carbon emission accounting is sufficiently reliable for institutional valuation.
As illustrated in Figure 4, the sensitivity analysis identifies the Electricity Emission Factor (EEF) as the most critical determinant of the total carbon emission accounting. A ±10% fluctuation in the regional grid’s EEF results in a corresponding 12.45% variance in emission accounting. This high elasticity is attributed to the fact that the O&M accounts for the largest share of the project’s life-cycle footprint; thus, any decarbonization of the energy mix directly scales the project’s carbon liability.
The Carbon Price follows as the second most influential factor (±8.2%), underscoring the project’s exposure to regulatory and market-driven price volatility. Conversely, Material Price Indices and Labor Costs exhibit significantly lower sensitivity (influencing valuation by 4.15% and 0.45%, respectively). This suggests that while CAPEX fluctuations affect the MAC, they do not fundamentally destabilize the long-term environmental value of the 500kV infrastructure.
4. Conclusion and Policy Implications
This research has established a comprehensive modular carbon emission accounting and evaluation framework specifically tailored for 500kV power grid infrastructure. By deconstructing the complex engineering of substations and transmission lines into 11 typical modules, we developed an automated method-matching engine that aligns physical engineering logic with optimized calculation models. The integration of the IPSO-DRESN model allowed for the dynamic determination of modular carbon quotas, transforming static, macro-scale estimations into high-precision, bottom-up accounting. The study concludes that modular accounting is a dynamic process sensitive to technological shifts and regional energy variations. Through the synthesis of exclusive data from 120 grid projects and the application of Parallel Bootstrap testing, this work provides a rigorous decision-making tool for utility managers, facilitating the transition from traditional infrastructure management to data-driven, modular carbon optimization.
The empirical results derived from the model yield several critical findings regarding the carbon profile of high-voltage projects. First, the O&M phase is identified as the largest emission reservoir, contributing approximately 60% of total life-cycle carbon. This is primarily driven by the M8 (Stringing and Conductors) and M3 (Buildings) modules, underscoring that grid loss reduction remains the primary lever for decarbonization. Second, Low-loss Transformers (LCT1) and High-capacity Energy-saving Conductors (LCT2) emerged as the most effective technical interventions. These technologies exhibit the highest carbon abatement density within the modular framework over a 30-year lifespan. Third, a significant finding is the carbon-compounding effect between modules. The study quantified that optimization in “upstream” electrical equipment (M4) triggers a secondary reduction in “downstream” civil foundations (M2/M3), proving that modular accounting can reveal hidden emission dependencies. Fourth, the Sensitivity analysis reveals that the Electricity Emission Factor (EEF) is the most volatile variable; a 10% shift in the regional grid’s EEF results in a 12.45% variance in total project emission accounting, emphasizing the impact of regional energy transition on grid infrastructure footprint. Finally, despite external volatility, the Bootstrap-based PDF simulation confirms the model's structural stability, with a narrow 95% Confidence Interval for total emissions, indicating high reliability for financial auditing.
Based on these conclusions, several policy implications are proposed to align power grid expansion with national “Dual Carbon” strategy. First, Power grid enterprises and the National Development and Reform Commission should adopt the 11-module framework as a standardized basis for PGP carbon accounting. By setting specific emission caps for modular units, such as earthwork (M1) and electrical equipment (M4), the government can foster a green supply chain and mandate low-carbon procurement at the modular level. Second, procurement models should shift from purely capital-expenditure-based selection to a life-cycle evaluation. Incentives should be provided for “carbon-elastic” technologies identified in this study, which minimize long-term operational losses even if they require higher initial construction investment. Third, given the high sensitivity to regional EEF, policies should encourage grid enterprises to implement dynamic carbon monitoring. Integrating modular accounting with regional carbon trading platforms will allow for more precise environmental impact assessments of cross-regional power transmission projects.
Despite the methodological advancements presented in this study, certain limitations remain that warrant further investigation. The current model primarily focuses on the technical and material parameters of 500kV projects, potentially overlooking the complex socio-economic variables and land-use changes associated with large-scale corridor construction. Furthermore, while the IPSO-DRESN model offers robust predictive capabilities, the accuracy of its operational module remains dependent on the transparency of regional grid data, which may vary across different geographical jurisdictions. Future research should aim to integrate real-time sensor data into the modular framework to allow for digital carbon monitoring. Additionally, expanding the scope to include end-of-life recycling and circularity metrics for decommissioned grid components would provide an even more holistic view of the grid’s environmental impact, ensuring that the entire life-cycle is accounted for in the pursuit of carbon neutrality.
Author Contributions
S.L.: Data curation, Formal analysis, Investigation, Methodology, Software, Validation, Visualization, Product administration, Writing - Original Draft Preparation, Writing—review and editing. C.W.: Conceptualization, Formal analysis, Investigation, Supervision, Validation, Writing—original draft, Writing—review and editing. G.L.: Conceptualization, Formal analysis, Funding acquisition, Investigation, Supervision, Validation, Writing—original draft, Writing—review and editing. Y.J.: Writing—review and editing, Supervision, Software. P.L.: Writing—review and editing, Funding acquisition, Supervision. X.W.: Writing—review and editing, Supervision, Conceptualization. L.T.: Writing—review and editing, Supervision, Conceptualization. T.L.: Writing—review and editing, Supervision, Conceptualization.All authors have read and agreed to the published version of the manuscript.
Funding
The authors are grateful to the financial support provided by the State Grid Corporation of China (China): “State Grids Headquarters Science and Technology Program Research on Key Technologies of Modular Carbon Emission Quota Design and Carbon Asset Development” under Grant (Project No.1400-202456282A-1-1-ZN); "Study on the Quantification of Carbon Reduction Input and Cost Reduction Technique of Power Grid Engineering Guided by Optimized Resource Allocation Input Quantification and Cost Diversion Technology Research" (Project No. 5108-202218280A-2-425-XG)
Data Availability Statement
Data available on request due to restrictions (e.g., privacy, legal or ethical reasons).
Conflicts of Interest
The authors declare no conflicts of interest..
Appendix A. Granular Derivation of Modular Carbon Emission Accounting
The derivation of carbon emission results for the 11 modular components defined in Section 3.3 is anchored in a dual-track feature processing framework. The Lasso regression layer serves as a high-dimensional feature compressor, specifically targeting the “Machinery” and “Material” parameters. By introducing a penalty term, Lasso effectively eliminates redundant engineering variables (e.g., secondary material specifications), retaining only those with the highest correlation to carbon intensity, such as soil density for M1 or steel-to-concrete ratios for M4.
Simultaneously, the GRU-Attention (Gated Recurrent Unit with Attention Mechanism) model is deployed to quantify Labor Complexity. Traditional accounting often oversimplifies labor-related emissions as static constants; however, our model recognizes that labor emissions are dynamic functions of construction difficulty and temporal sequences. The GRU captures the sequential dependencies of construction phases, while the Attention mechanism assigns higher weights to labor-intensive modules (e.g., Secondary Systems M10), ensuring that the final Artificial carbon contribution reflects actual operational complexity. These refined features are then fed into the IPSO-DRESN engine for non-linear mapping to the final carbon emission accounting.
Appendix A.1. Module M1: Earthwork and Excavation
As a representative of mechanical-intensive modules, the carbon accounting of M1 utilizes Lasso regression to identify the most significant drivers among 15 initial variables. The model identified “Rock Hardness Factor” and “Excavation Depth” as the dominant parameters. Based on the IPSO-DRESN calculation, the carbon emission accounting of M1 is sensitive to energy efficiency fluctuations in heavy machinery.
Table A1.
Granular Carbon Emission Accounting Results for M1 Module.
| Procurement and disposal of soil | Person-day | Carbon emission factor (kgCO₂/person-day) | Material consumption | Carbon emission factor (kgCO₂/unit) | Machine-shift volume | Emission factor (kgCO₂/machine-shift) | Adjustment coefficient | Correction factor | Carbon emission (kgCO₂) | Module carbon emission (kgCO₂) | |
| Emissions from soil procurement | 10766.36 | 0.05 | 538.32 | 1499.21 | |||||||
| Emissions from spoil disposal | 8007.43 | 0.12 | 960.89 | ||||||||
| Earthwork | Artificial carbon emissions | 270.83 | 2.5 | 677.08 | |||||||
| Mechanical carbon emissions | |||||||||||
| Crawler bulldozer (75kW) | 57.50 | 79.03 | 1.13 | 1.1 | 5648.47 | ||||||
| Crawler single-bucket excavator (1m³) | 68.01 | 85.59 | 1.11 | 1.1 | 7107.41 | ||||||
| Dump truck (12t) | 251.40 | 123.87 | 1.19 | 1.1 | 40762.65 | ||||||
| Mechanical vibratory roller (15t) | 144.42 | 59.32 | 1.18 | 1 | 10109.05 | ||||||
| Water truck (4,000L) | 24.58 | 25.51 | 0.98 | 1 | 614.50 | ||||||
| Electric rammer | 11.83 | 8.08 | 0.99 | 1 | 94.63 | ||||||
| Total carbon emissions of the M1 module | 66513.00 | ||||||||||
Appendix A.2 Module M3: Logistics and Transportation
For the accounting of Module M3, the model integrates a multidimensional verification approach. Specifically, for mechanical emissions, an Input-Output method is applied to adjust the emission factors of electric-powered machinery, with an Adjustment Coefficient (η) set at 0.9 to account for grid-side decarbonization. Furthermore, the GRU-Attention mechanism is utilized to derive specific Correction Factors (γ) for labor and specialized mechanical operations, ensuring the results reflect the high complexity of prefabricated steel structures and reinforced concrete engineering.
Table A2.
Granular Carbon Emission Accounting Results for M3 Module.
| Engineering Category | Component / Resource Type | Consumption (Qty) | Unit | Emission Factor (EF) | Adj. Coeff. (η) | Corr. Factor (γ) | Carbon Emissions (kgCO₂) |
| I. Concrete Engineering | Labor (Complexity Adjusted) | 1,857.27 | person-day | 2.50 | - | 1.10 | 5,107.49 |
| Core Materials (Concrete C20/C30, Mortar, etc.) | - | - | - | - | - | 1,213,222.12 | |
| Machinery (Vibrators, Cranes, Trucks) | - | machine-shift | - | 0.90 | 1.10 | 88,531.97 | |
| Subtotal (Concrete) | 1,306,861.58 | ||||||
| II. Steel Structures | Labor (Complexity Adjusted) | 4,144.80 | person-day | 2.50 | - | 1.50 | 15,543.00 |
| Structural Components (Columns, Beams, etc.) | - | - | - | - | - | 1,581,876.39 | |
| Machinery (Crawler Cranes, Welders, Hoists) | - | machine-shift | - | 0.90 | 1.10 | 58,559.33 | |
| Subtotal (Steel) | 1,655,978.72 | ||||||
| III. Reinforcement & Embedment | Labor (Complexity Adjusted) | 4,698.56 | person-day | 2.50 | - | 1.17 | 13,743.27 |
| Steel Bar & Metal Parts | - | t | 2,200.00 | - | - | 1,822,789.40 | |
| Machinery (Cutters, Benders, Welders) | - | machine-shift | - | 0.90 | 1.10 | 47,536.72 | |
| Subtotal (Reinforcement) | 1,884,069.39 | ||||||
| IV. Ancillary Works | Finishing Materials (Tiles, Coatings, Pipes) | - | - | - | - | - | 360,305.52 |
| Machinery (Rammer, Drills, Welders) | - | machine-shift | - | 0.90 | 1.10 | 12,685.73 | |
| Subtotal (Ancillary) | 372,991.25 | ||||||
| Total Modular Accounting | Total Carbon Emissions (M3) | 5,219,900.94 |
Appendix A.3 Module M9: Main Building and Steel Structures
To quantify the carbon emission accounting of Module M9, the framework accounts for the intersection of heavy installation machinery and high-precision testing equipment. The Labor Carbon is adjusted using the GRU-Attention mechanism and Fault Tree Analysis to reflect the technical rigor of cable secondary wiring. For Machinery Carbon, a Lasso-based feature selection was used to prioritize high-impact equipment, with regional and mechanical correction factors applied.
Table A3.
Granular Carbon Emission Accounting Results for M1 Module.
| Category | Component / Functional Group | Consumption (Qty) | Unit | Emission Factor (EF) | Correction Factor (λ) | Carbon Emissions (kgCO₂) |
| I. Labor | Skilled Cabling Labor (GRU & FTA Corrected) | 1,374.41 | person-day | 2.50 | 1.134* | 3,896.45 |
| II. Machinery | Heavy Logistics & Lifting (Transport & Cranes) | 78.40 | machine-shift | - | 1.05 ~ 1.10 | 7,634.33 |
| Cable Deployment & Pressing (Conveyors & Press) | 45.12 | machine-shift | - | 1.02 | 1,265.50 | |
| Precision Testing & Auxiliary (Testing Systems) | 102.39 | machine-shift | - | 1.00 ~ 1.05 | 4,103.72 | |
| Subtotal (Machinery) | 13,003.55 | |||||
| III. Materials | Auxiliary Material Assets (Connectors & Labels) | - | - | - | - | 1621.29 |
| Total Modular Accountingt | Total Carbon Emissions (M9) | 17,521.29 |
*Note: The combined correction factor (1.134) is the product of the GRU-Attention index (1.08) and the Fault Tree correction factor (1.05).
Appendix A.4 Module M10: Auxiliary Engineering for Lines
Module M10 focuses on the temporary infrastructure and energy overhead essential for transmission line construction. The accounting framework employs Lasso regression to distill a vast array of auxiliary equipment into a set of high-impact drivers. For machinery operating in variable terrains, Regional Correction Factors (λ) and Mechanical Efficiency Adjustments are applied to standard emission factors. This ensures that the energy intensity of drilling and pumping in diverse geological conditions is accurately reflected.
Table A4.
Granular Carbon Emission Accounting Results for M1- Module.
| Category | Component / Functional Group | Quantity | Unit | Emission Factor (EF) | Adj./Corr. Factor (λ) | Carbon Emissions (kgCO₂) |
| I. Infrastructure | Temporary Buildings (Offices, Dorms, Warehouses) | 1,326.00 | m² | 35.50 | 1.00 | 47,073.00 |
| Site Protection & Fencing (Enclosures, Safety Systems) | 380.00 | m | 10.00 | 1.00 | 3,800.00 | |
| Support Materials (Timber, Iron Wire, etc.) | - | - | - | - | 738.40 | |
| Logistics & Assembly Labor | 225.00 | person-day | 2.50 | 1.00 | 562.50 | |
| Construction Machinery (Cranes, Trucks, Welders) | 25.00 | machine-shift | - | 1.05 ~ 1.25 | 6,018.63 | |
| Subtotal (Infrastructure) | 58,192.53 | |||||
| II. Site Energy | Utility Distribution (Water Pipes, Distribution Boxes) | 553.00 | m/unit | - | 1.00 | 5,102.00 |
| Power & Water Supply Machinery (Generators, Pumps) | 15.00 | machine-shift | - | 1.18 ~ 1.30 | 4,478.76 | |
| Maintenance Labor | 12.00 | person-day | 2.50 | 1.00 | 30.00 | |
| Subtotal (Energy & Utilities) | 9,610.76 | |||||
| Total Modular Accountingt | Total Carbon Emissions of Module M10 | 67,803.29 |
References
- Dong, F.; Hua, Y.; Yu, B. Peak carbon emissions in China: Status, key factors and countermeasures—A literature review. Sustainability 2018, 10, 2895. [Google Scholar] [CrossRef]
- Chen, H.; Chen, X.; Zhou, G.; Zheng, L.; Xu, M.; Yu, L.; Zhang, H. Carbon emission accounting method for coal-fired power units of different coal types under peak shaving conditions. Energy 2025, 320, 135314. [Google Scholar] [CrossRef]
- Gao, W.; Han, M.; Chen, L.; Ai, C.; Liu, S.; Cao, S.; Wei, L. Life cycle carbon emission accounting of a typical coastal wind power generation project in Hebei Province, China. Energy Convers. Manag. 2025, 324, 119243. [Google Scholar]
- Li, Y.; Yang, X.; Du, E.; Liu, Y.; Zhang, Shixu.; Yang, C.; Zhang, N.; Liu, C. A review on carbon emission accounting approaches for the electricity power industry. Appl. Energy 2024, 359, 122681. [Google Scholar] [CrossRef]
- Li, Z.; Li, X.; Lu, C.; Ma, K.; Bao, W. Carbon emission responsibility accounting in renewable energy-integrated DC traction power systems. Appl. Energy 2024, 355, 122191. [Google Scholar]
- Su, Z.; Huang, Y.; Gu, W.; Chen, L.; Niu, Y. Calculation method for dynamic carbon emission factors of thermal power plants based on coupling of energy flow and carbon flow. Energy Convers. Manag. 2026, 353, 121179. [Google Scholar] [CrossRef]
- Wang, B.; Chen, J.; Luo, C.; Mou, X.; Yang, S. Accelerated computing of dynamic carbon emission factor for large-scale power grid using conjugate gradient squared method with p-norm preconditioner. Energy AI 2026, 24, 100730. [Google Scholar]
- Li, Guohao.; Zheng, J.; Huang, J. An innovative accounting framework for CO2 emissions in the power sector: Based on the energy flow relationship between the power and heat sectors. Energy 2026, 342, 139575. [Google Scholar]
- Lu, H.; Fang, M.; Zhang, Y.; Li, X. BayesShrink threshold estimation-based multi-metric space clustering algorithm for power grid project cost data. Results Eng. 2026, 29, 109134. [Google Scholar]
- Qi, X.; Ma, X.; Zhang, X.; Zhao, Z. Economic life-cycle model for the cost of a power grid line engineering project. Infrastruct. Asset Manag. 2024, 11, 88–99. [Google Scholar] [CrossRef]
- Zhang, C.; Jin, X.; Xie, G. Method to extract critical characteristics of power grid projects adapting to new situations and construction of index system. Energy Rep. 2022, 8, 533–539. [Google Scholar] [CrossRef]
- Chang, Y.; Liu, C.; Liu, M.; Liu, W.; Liu, Z.; Zhang, H.; Zheng, Y. Differentiation degree combination weighting method for investment decision-making risk assessment in power grid construction projects. Glob. Energy Interconnect. 2019, 2, 465–477. [Google Scholar] [CrossRef]
- Li, N.; Wang, X.; Li, C.; Zhang, Z.; Zhang, W. The overhauls technical innovation project optimization method of power grid device based on Life Cycle Asset Management. Energy Rep. 2020, 6, 1249–1254. [Google Scholar] [CrossRef]
- Quarton, C. J.; Samsatli, S. Power-to-gas for injection into the gas grid: What can we learn from real-life projects, economic assessments and systems modelling? Renew. Sust. Energ. Rev. 2018, 98, 302–316. [Google Scholar] [CrossRef]
- Mueller, C. E. Examining the inter-relationships between procedural fairness, trust in actors, risk expectations, perceived benefits, and attitudes towards power grid expansion projects. Energy Policy 2020, 141, 111465. [Google Scholar] [CrossRef]
- Li, H.; Zhang, Y.; Hai, M. Categorize the Power Grid Projects with SOM Method. Procedia Comput. Sci. 2019, 162, 475–479. [Google Scholar] [CrossRef]
- Gao, L.; Zhao, Z.-Y.; Li, C. An Investment Decision-Making Approach for Power Grid Projects: A Multi-Objective Optimization Model. Energies 2022, 15, 1112. [Google Scholar]
- Li, J.; Xu, J.; Tan, X. Dynamic Comprehensive Benefit Evaluation of the Transnational Power Grid Interconnection Project Based on Combination Weighting and TOPSIS Grey Projection Method. Sustainability 2018, 10, 4672. [Google Scholar] [CrossRef]
- Niu, D.; Li, Y.; Dai, S.; Kang, H.; Xue, Z.; Jin, X.; Song, Y. Sustainability Evaluation of Power Grid Construction Projects Using Improved TOPSIS and Least Square Support Vector Machine with Modified Fly Optimization Algorithm. Sustainability 2018, 10, 231. [Google Scholar] [CrossRef]
- Rao, R.; Zhang, X.; Shi, Z.; Luo, K.; Tan, Z.; Feng, Y. A Systematical Framework of Schedule Risk Management for Power Grid Engineering Projects’ Sustainable Development. Sustainability 2014, 6, 6872–6901. [Google Scholar] [CrossRef]
- He, H.; Zhou, S.; Zhang, L.; Zhao, W.; Xiao, X. Dynamic Accounting Model and Method for Carbon Emissions on the Power Grid Side. Energies 2023, 16, 5016. [Google Scholar] [CrossRef]
- Liu, T.; Wu, Z.; Chen, C.; Chen, H.; Zhou, H. Carbon Emission Accounting during the Construction of Typical 500 kV Power Transmissions and Substations Using the Carbon Emission Factor Approach. Buildings 2024, 14, 145. [Google Scholar] [CrossRef]
- Xie, L.; Li, G.; Dong, X.; Cai, Y.; Guo, Z.; Pan, N. Sustainability-Oriented Indirect Carbon Emission Accounting for Electricity Considering Bidirectional System Integration in the Power Market Environment. Sustainability 2025, 17, 9583. [Google Scholar] [CrossRef]
- Li, A.; Wang, Z.; Sun, X.; Ma, F. Accounting Factors and Spatio-Temporal Differences of the Carbon Footprint Factor in China’s Power System. Energies 2025, 18, 2663. [Google Scholar]
- Wang, C.; Gao, X.; Long, H. Carbon Emission Accounting for 220 kV Transmission and Transformation Projects Based on a Whole Life Cycle Improvement Method. Energies 2025, 18, 912. [Google Scholar] [CrossRef]
- Yue, H.; Wu, B.; Duan, J.; Yue, Y.; Guan, H.; Zhang, J. Impact Factors and Structural Pathways of Carbon Emissions in the Power Sector of the Beijing–Tianjin–Hebei Region Using MRIO Analysis. Atmosphere 2025, 16, 177. [Google Scholar]
- Liu, X.; Liu, J.; Dou, C. Uncertainty Analysis of Provincial Carbon Emission Inventories: A Comparative Assessment of Emission Factors Sources. Sustainability 2025, 17, 4787. [Google Scholar] [CrossRef]
- Li, C. Z.; Tam, V. W. Y.; Ma, M.; Wen, S. Carbon emission analysis and multi-objective optimization of modular integrated construction using petri net simulation. Energy Build. 2025, 339, 115784. [Google Scholar] [CrossRef]
- Hou, H.; Xie, B.; Cheng, Y. Analysis of Carbon Emissions and Emission Reduction from Coal-Fired Power Plants Based on Dual Carbon Targets. Sustainability 2023, 15, 7369. [Google Scholar] [CrossRef]
- Zhang, J.; Zhu, Y.; Chen, D. Assessment of Offshore Wind Resources, Based on Improved Particle Swarm Optimization. Appl. Sci. 2023, 13, 51. [Google Scholar]
Figure 1.
Convergence Profiles of Optimization Algorithms.
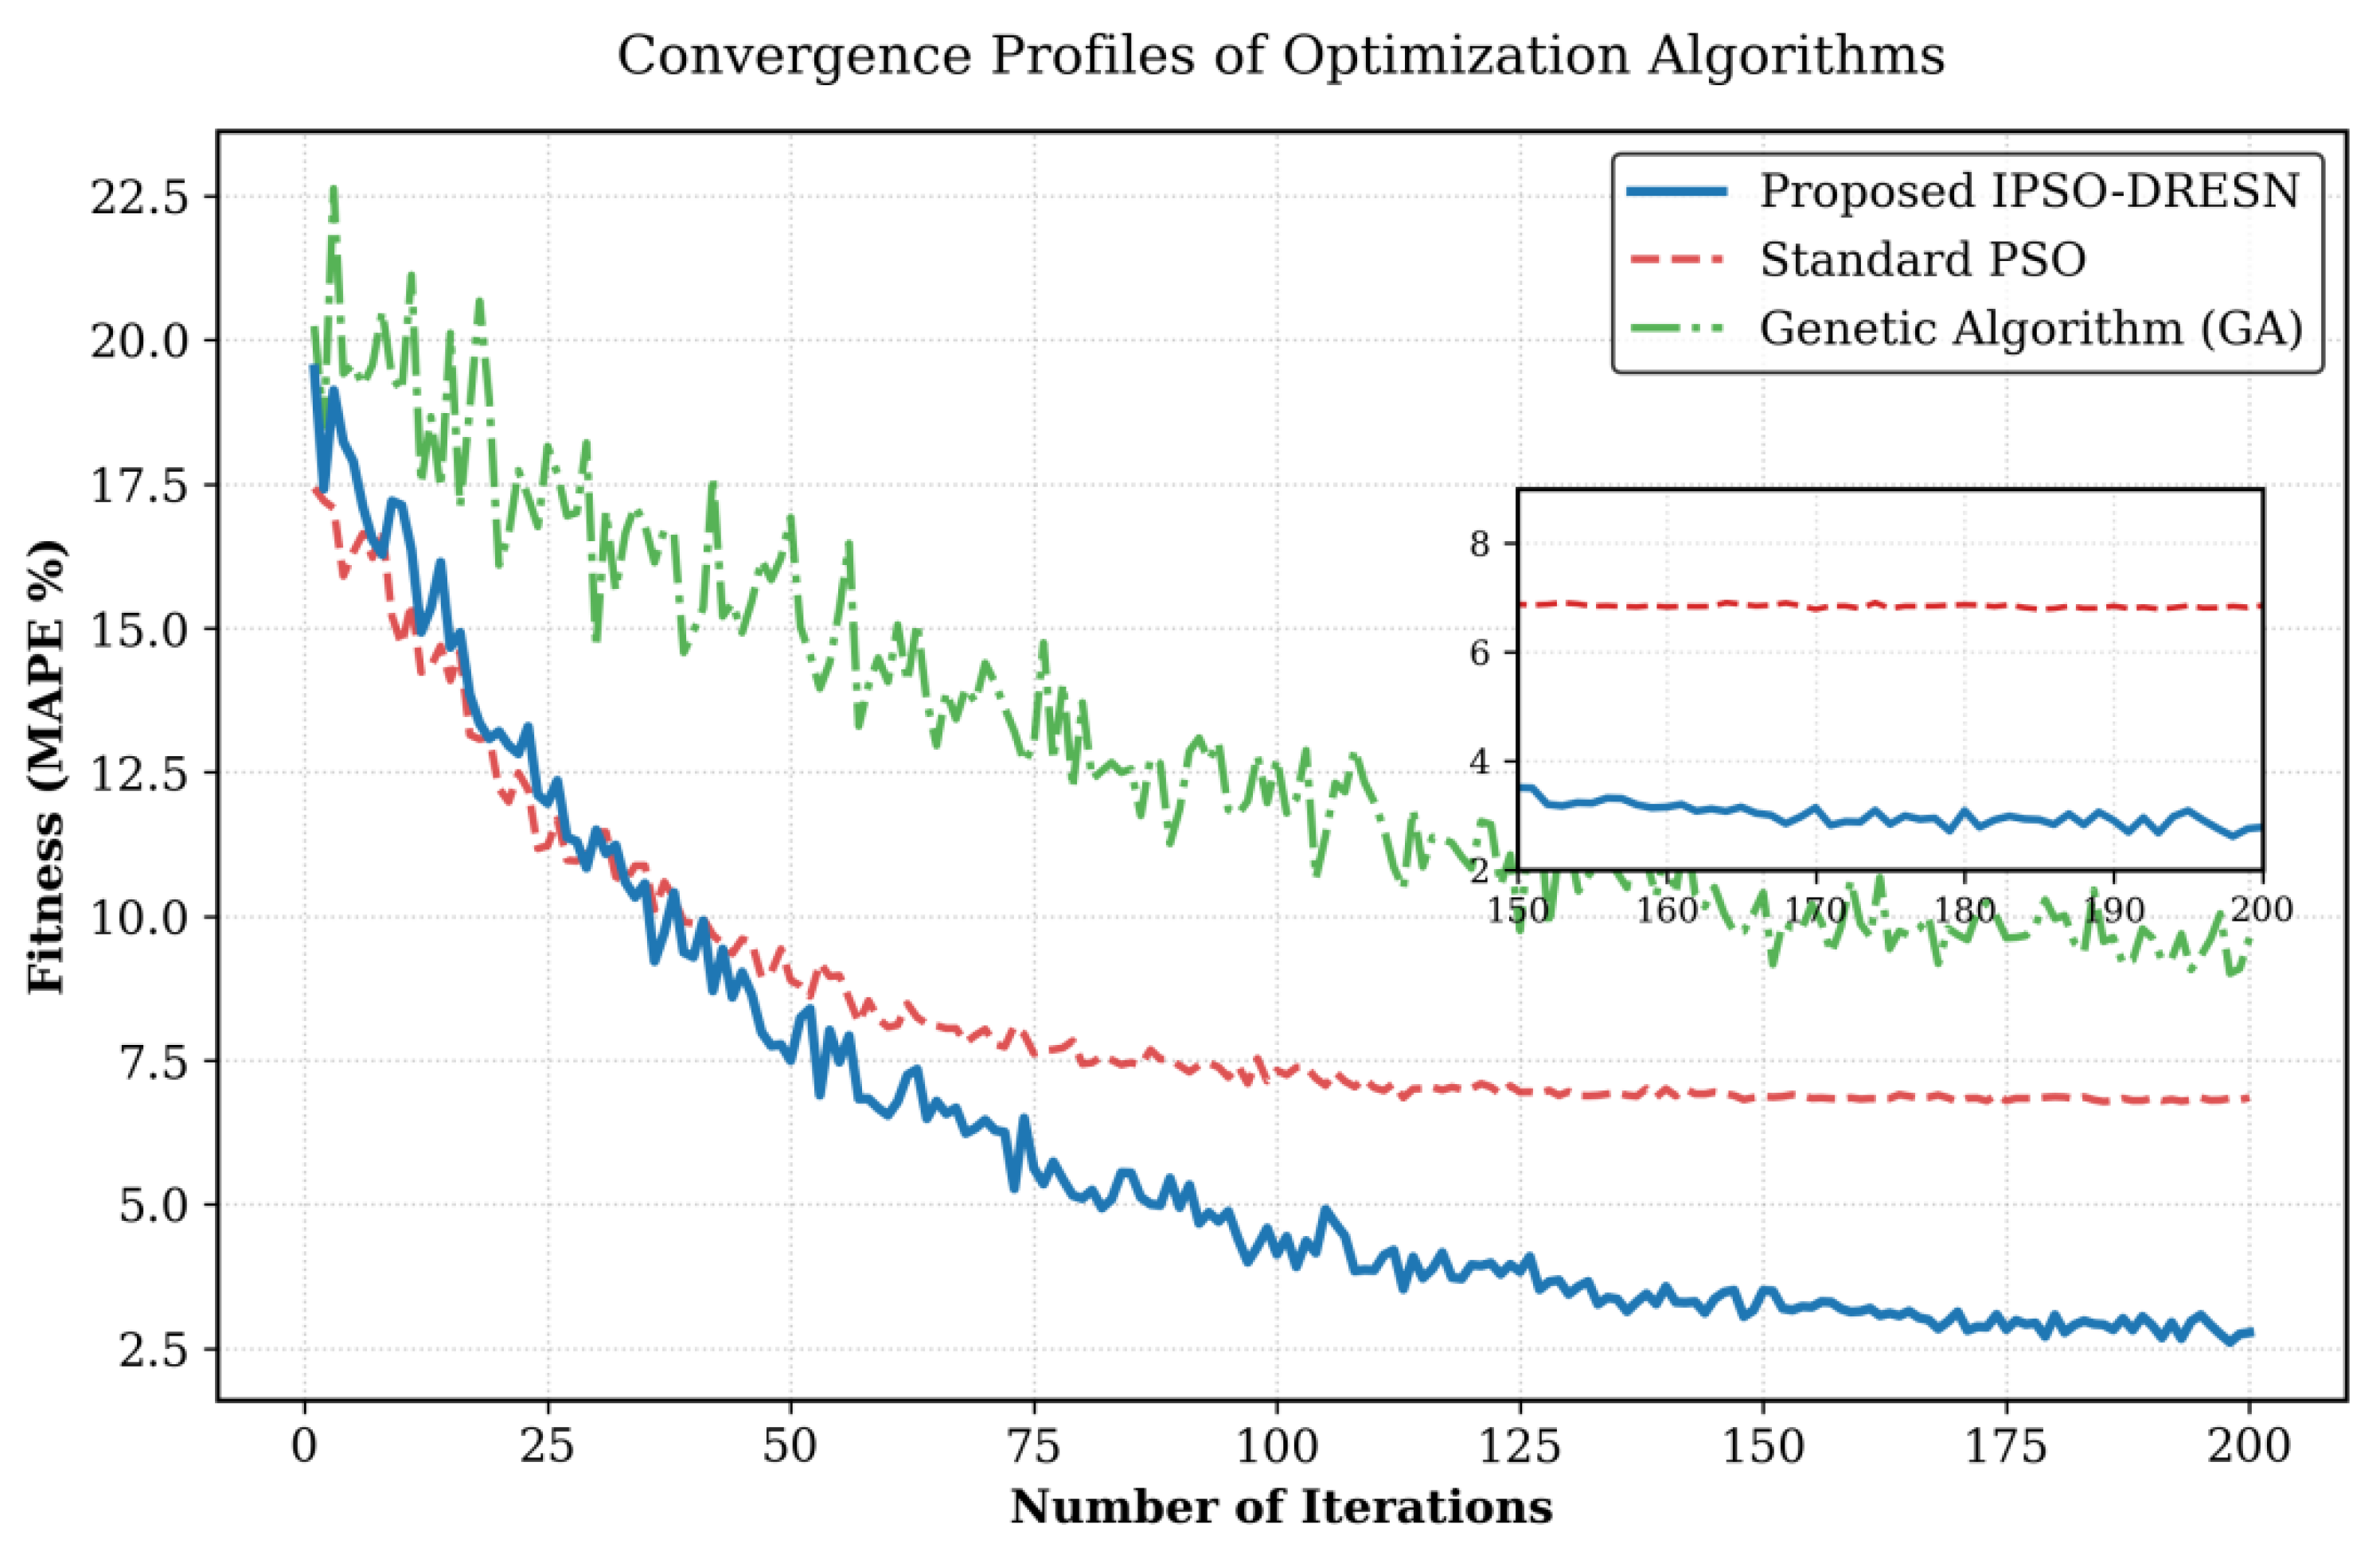
Figure 2.
Performance evaluation and error distribution analysis of the IPSO-DRESN model: (a) Scatter plot comparing predicted versus actual carbon emission values; (b) Residual distribution analysis with Gaussian fitting.
Figure 2.
Performance evaluation and error distribution analysis of the IPSO-DRESN model: (a) Scatter plot comparing predicted versus actual carbon emission values; (b) Residual distribution analysis with Gaussian fitting.
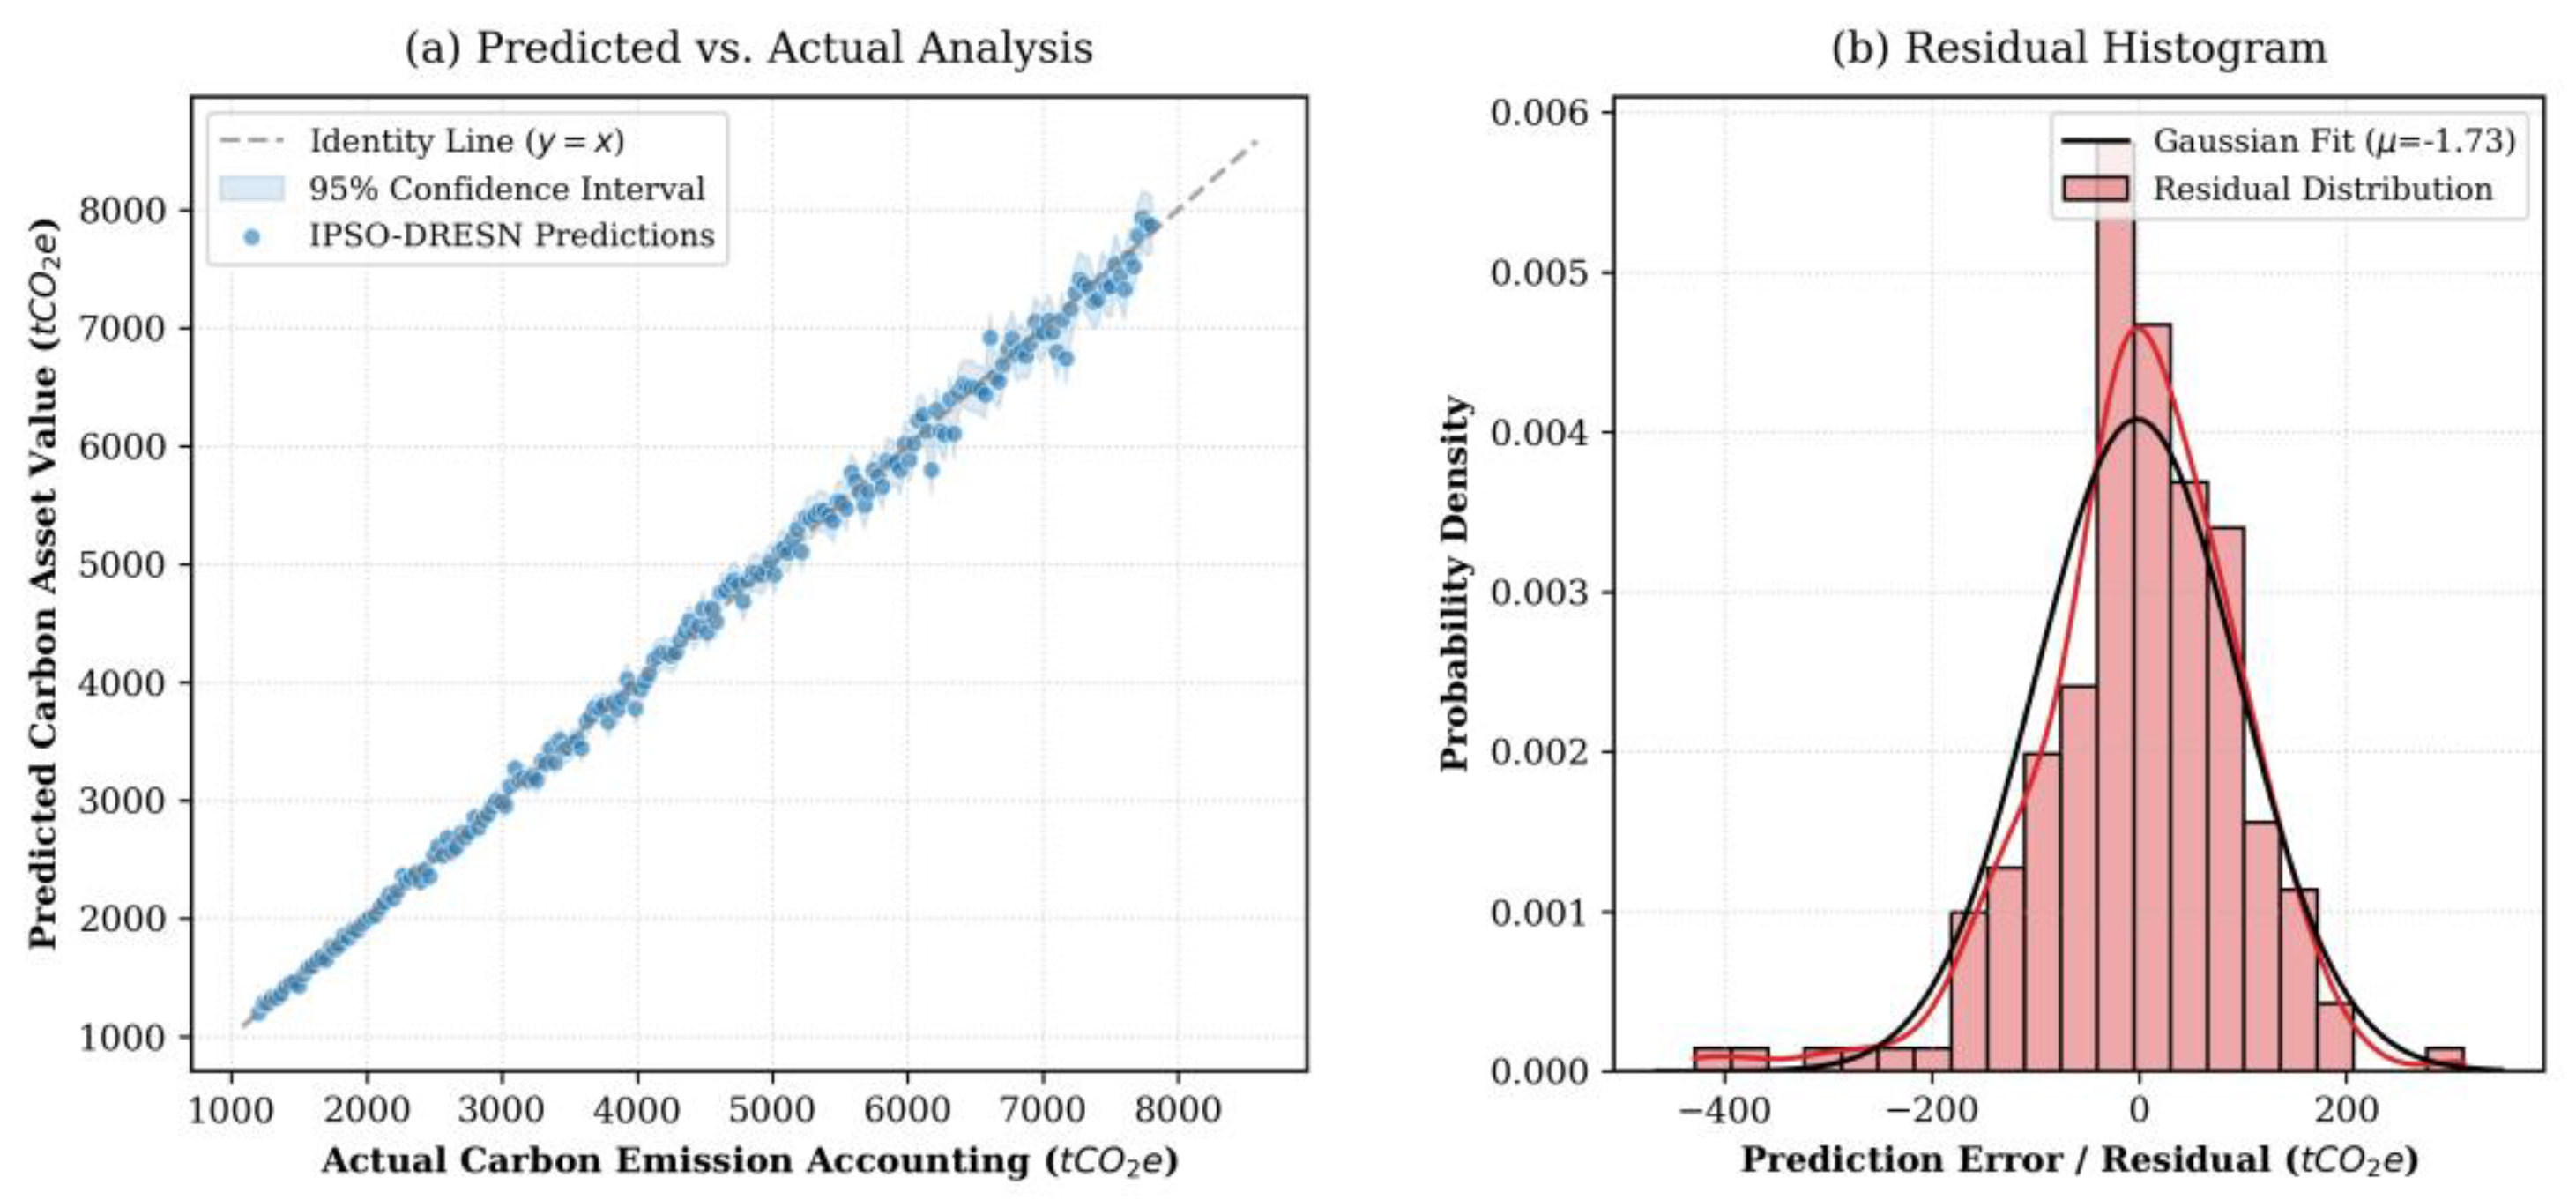
Figure 3.
Probability Density Function of 500kV Project Carbon Emission.
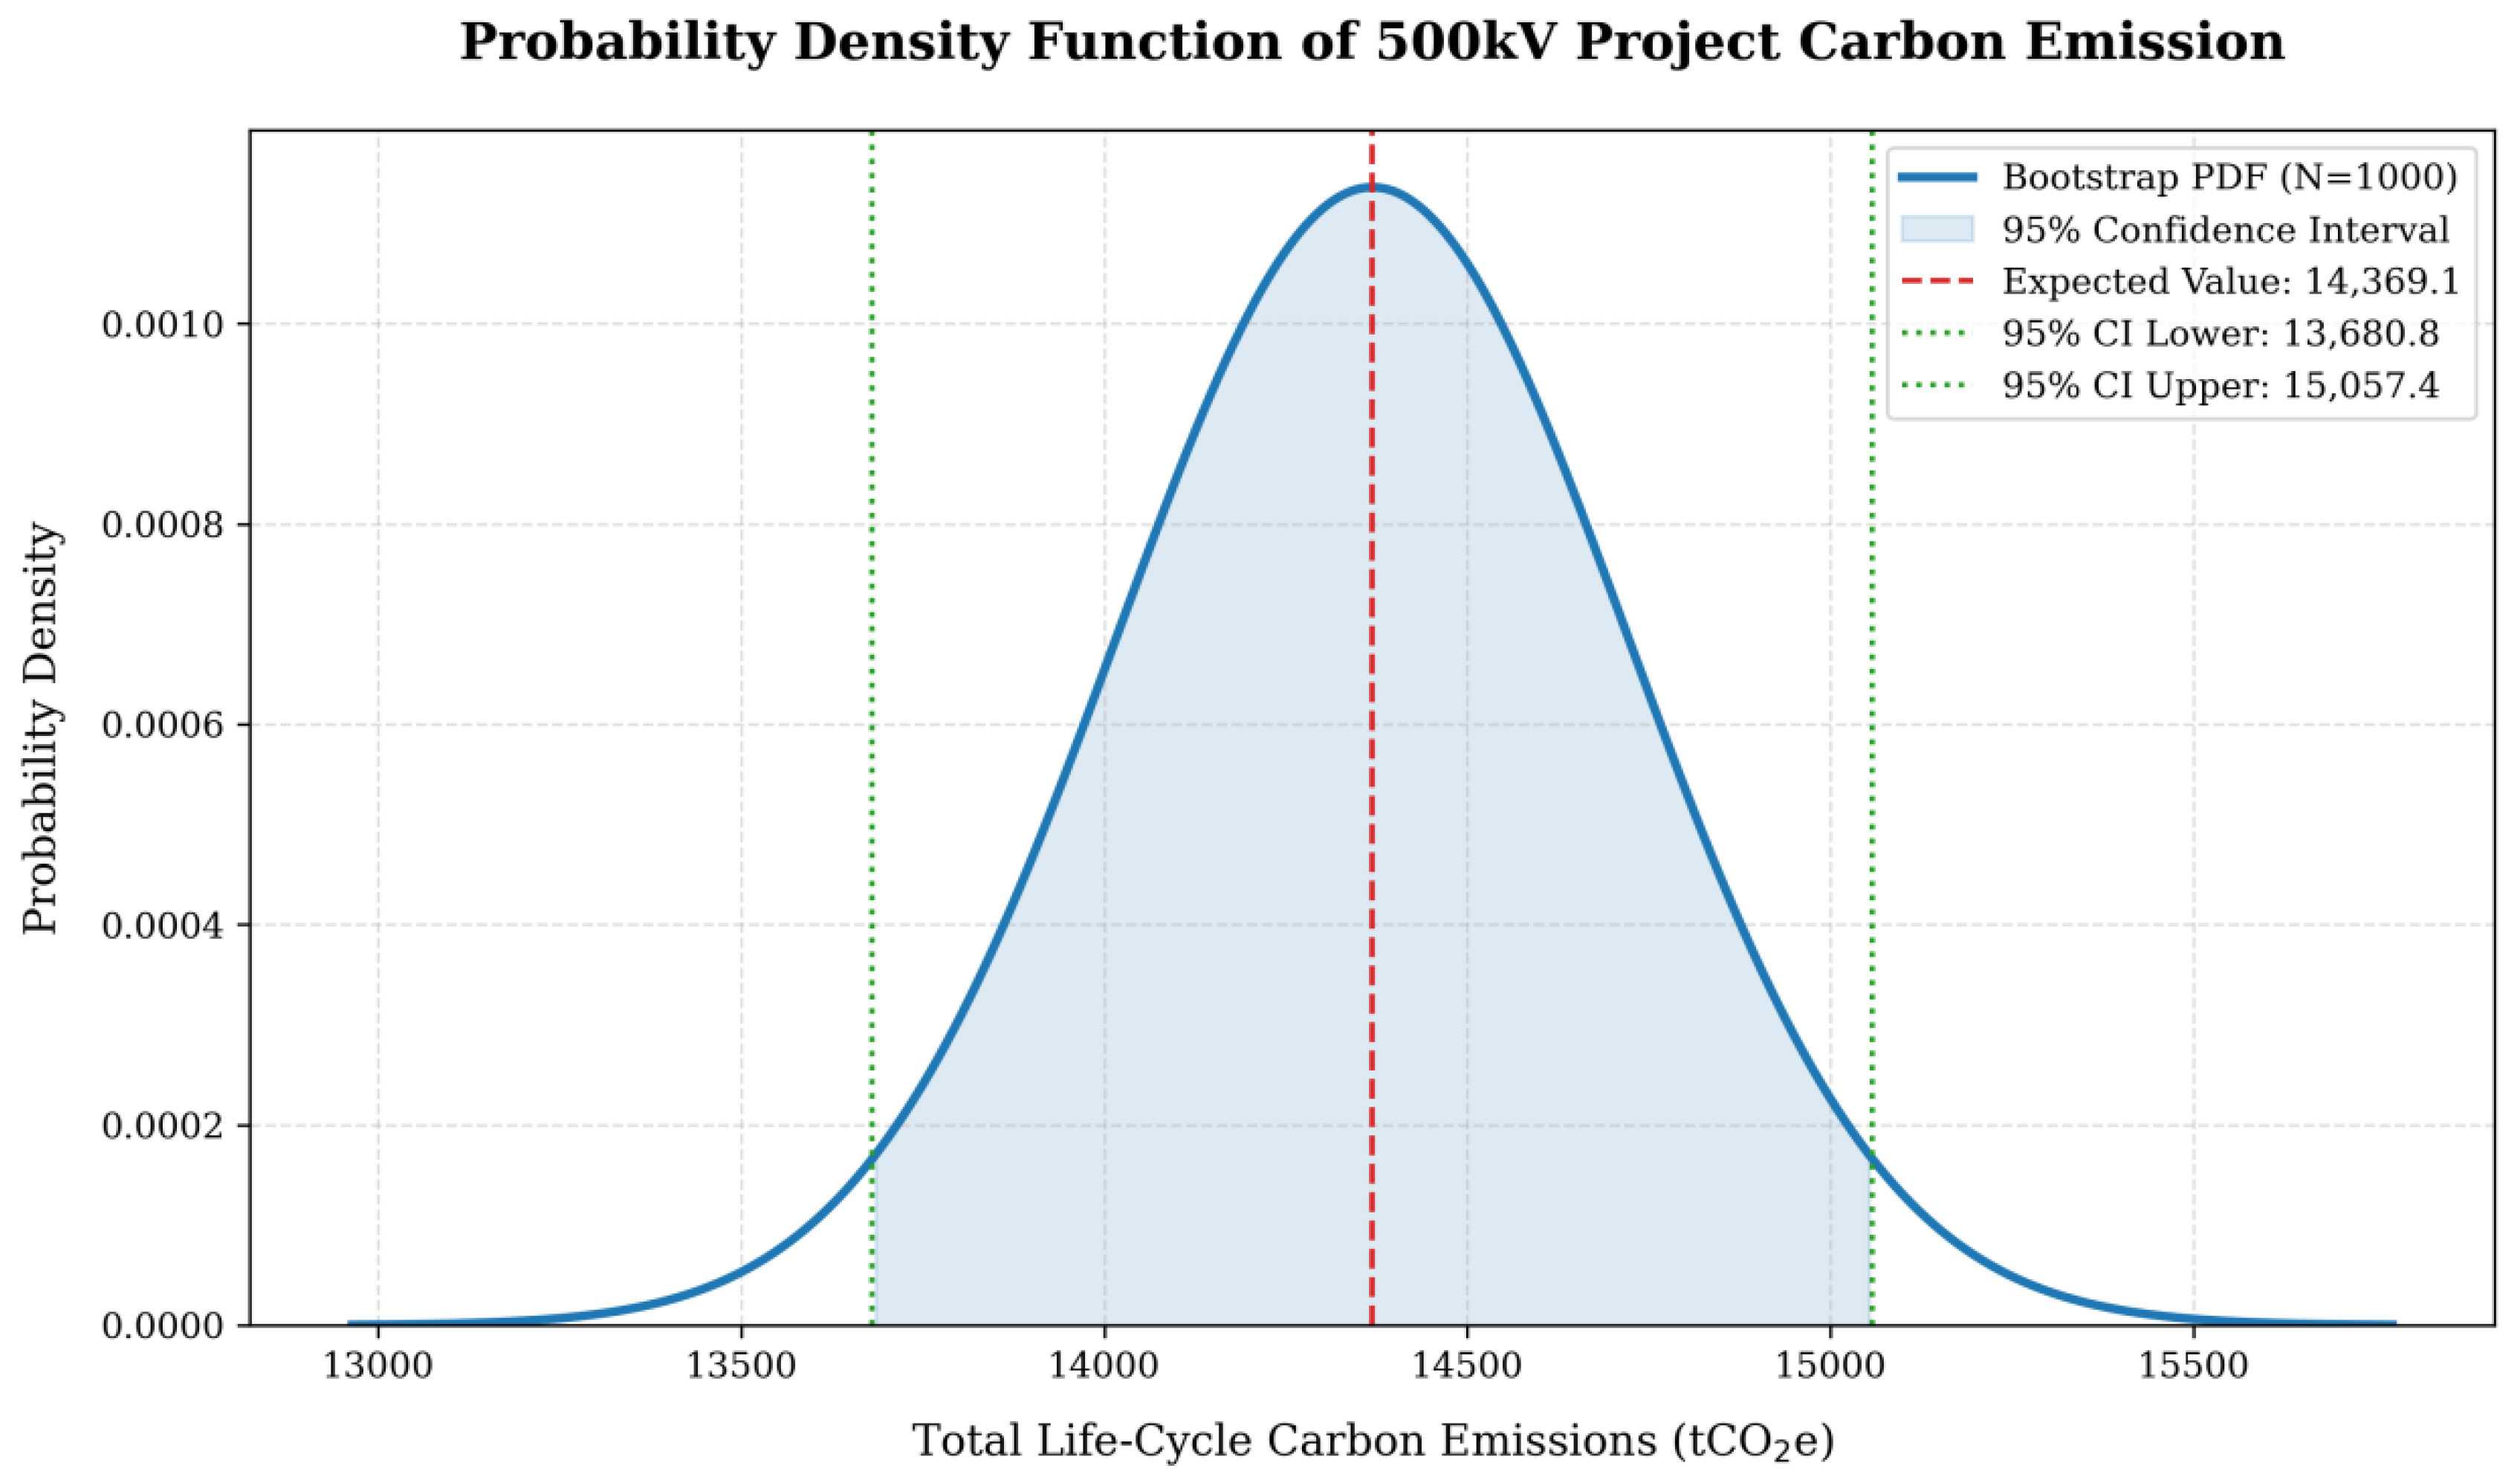
Figure 4.
Sensitivity Analysis of External Factors.
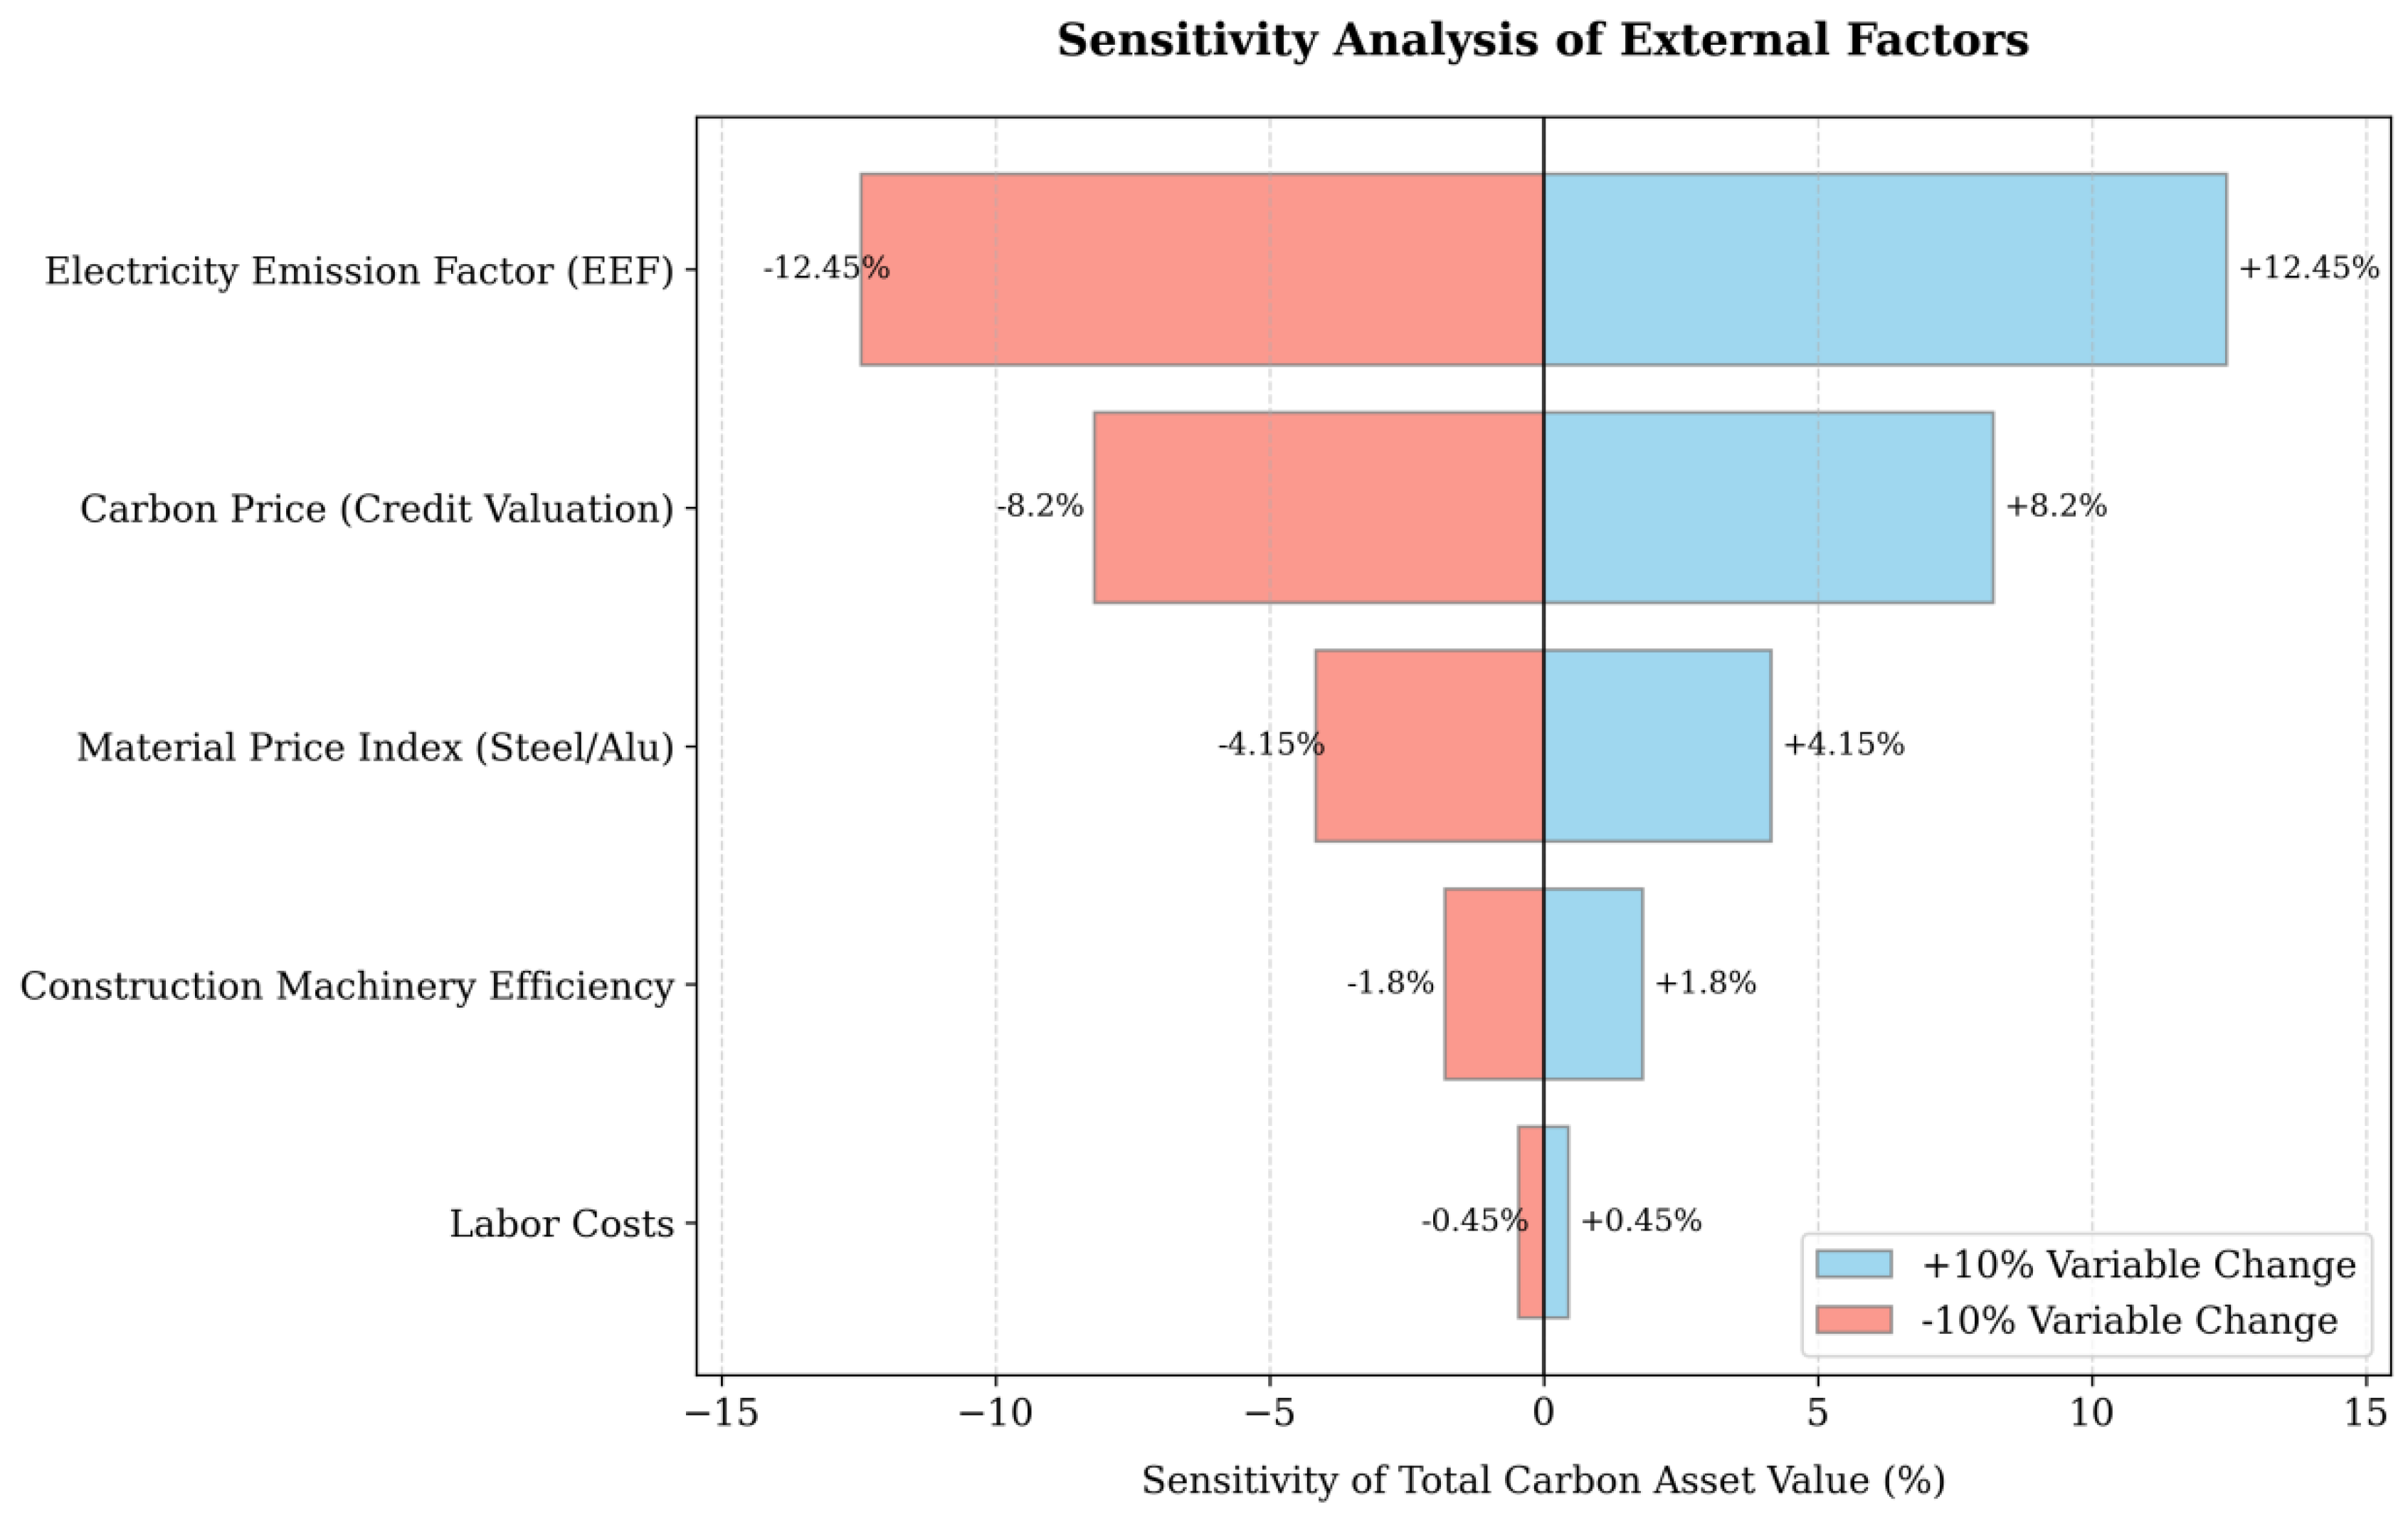
Table 2.
Comparative performance of models.
| Model | RMSE (tCO₂e) | MAE (tCO₂e) | R2 | MAPE (%) |
| BPNN | 45.32 | 32.15 | 0.82 | 8.45 |
| SVR | 38.74 | 28.60 | 0.85 | 7.12 |
| ESN | 30.12 | 22.45 | 0.89 | 5.34 |
| DRESN | 22.56 | 16.80 | 0.93 | 4.10 |
| IPSO-DRESN | 14.85 | 10.24 | 0.97 | 2.65 |
Table 3.
Decomposition of carbon emissions by module and voltage level.
| Category | ID | 110kV(tCO2e) | 220kV(tCO2e) | 500kV(tCO2e) | Avg. Share |
| Substation Engineering Modules | M1 | 18.2 | 34.5 | 66.5 | 0.46% |
| M2 | 102.4 | 195.8 | 371.7 | 2.59% | |
| M3 | 1,435.5 | 2,740.2 | 5,219.9 | 36.31% | |
| M4 | 16.6 | 31.8 | 60.5 | 0.42% | |
| M5 | 19.5 | 37.2 | 70.9 | 0.49% | |
| Transmission Line Engineering Modules | M6 | 280.4 | 535.1 | 1,018.5 | 7.09% |
| M7 | 493.5 | 942.2 | 1,792.1 | 12.48% | |
| M8 | 1,551.4 | 2,961.5 | 5,632.5 | 39.21% | |
| M9 | 4.8 | 9.2 | 17.5 | 0.12% | |
| M10 | 18.6 | 35.6 | 67.8 | 0.47% | |
| M11 | 14.1 | 26.9 | 51.2 | 0.36% | |
| Total | 3,955.0 | 7,555.0 | 14,369.1 | 100% | |
Table 4.
Lifecycle Carbon Distribution and Structural Composition.
| Lifecycle Phase | Share of Total LCA | Total Carbon (tCO₂) | Key Driver | Mech. % | Mat. % | Labor % |
| Production & Construction | 38.2% | 5485.6 | Civil/Assembly | 91% | 6% | 3% |
| Operation & Maintenance | 54.4% | 7813.8 | Line Loss/SF6 | - | - | - |
| Sub-item: M9 (Line) | -- | 17.5 | Ohmic Losses | -- | -- | -- |
| Decommissioning | 0.36% | 51.2 | Dismantling | 85% | 12% | 3% |
| Total Lifecycle | 100% | 14,369.1 |
Table 5.
Abatement Intensity and Marginal Cost of Typical Retrofit Technologies.
| Technology ID | Low-Carbon Technology | Primary Module | (tCO₂e) | MAC (tCO₂e) |
| LCT1 | Low-loss Transformer | M4 | 845.2 | 45.8 |
| LCT2 | Energy-saving Conductor | M8 | 2,150.6 | 12.5 |
| LCT3 | Low-carbon Concrete | M3 | 312.4 | -8.4* |
| LCT4 | New Energy Machinery | M1, M7, M8 | 485.7 | 62.1 |
Note: Low-loss Transformers (LCT1), Large-Section Energy-Saving Conductors (LCT2), New Energy Construction Machinery (LCT4) and Low-carbon Concrete (LCT3). A negative MAC for LCT3 indicates that the technology provides a net economic benefit, often through reduced material taxes or improved construction efficiency.
Disclaimer/Publisher’s Note: The statements, opinions and data contained in all publications are solely those of the individual author(s) and contributor(s) and not of MDPI and/or the editor(s). MDPI and/or the editor(s) disclaim responsibility for any injury to people or property resulting from any ideas, methods, instructions or products referred to in the content. |
© 2026 by the authors. Licensee MDPI, Basel, Switzerland. This article is an open access article distributed under the terms and conditions of the Creative Commons Attribution (CC BY) license (http://creativecommons.org/licenses/by/4.0/).
Copyright: This open access article is published under a Creative Commons CC BY 4.0 license, which permit the free download, distribution, and reuse, provided that the author and preprint are cited in any reuse.


