

Submitted:
01 July 2026
Posted:
02 July 2026
You are already at the latest version
Abstract
The gap between consumers’ intent to buy electric cars and their actual purchasing behavior of petrol cars has motivated researchers to conduct numerous investigations over the last decade. Nevertheless, with the explosive development of the field, bibliographic mapping remains a difficult task. This study combines bibliometric analysis and a PRISMA-oriented systematic review of consumer purchase intentions towards sustainable vehicles. A systematic literature search in Scopus retrieved 1,447 records between 2015 and June 2026, of which 706 empirical studies met the inclusion criteria for qualitative synthesis. Based on performance analysis and science mapping using VOS viewer software, one can conclude that the topic area develops at around 23%, gathers 43,758 citations, and shifts geographically over time. China contributes 418 papers, and India goes from publishing one piece in 2015 to occupying the third position overall. Keywords co-occurrence identifies five research clusters, whereas co-citations show that there are three intellectual bases for the field: behavioral theory, choice modelling, and methodological approaches based on the PLS-SEM framework. The results also emphasize some recurring gaps, namely the lack of a moderating effect of demographic characteristics, personality traits, intention-to-behavior relationship, and longitudinal surveys. This study proposes an eight-point research agenda driven by keyword analysis.
Keywords:
electric vehicles
; purchase intention
; adoption intention
; consumer behaviour
; bibliometric analysis
; PRISMA
; systematic literature review
; VOSviewer
; sustainable mobility
; India
1. Introduction
Among the key contributors of emissions, road transport is an uncommon case wherein its contribution level does not seem to drop; in fact, road transport via personal vehicles is the prime culprit behind the increased pollution levels. Among the possible ways to address this issue are electric cars, which have gained much traction in the recent past, as well as other types of alternative fuel vehicles. Many states around the world have invested considerably in encouraging people to use these alternatives by offering various incentives, such as reduced prices and tax benefits. The global sale of electric cars surpassed 14 million in 2023, with no sign of stopping. However, there is a gap between the intention and usage of these cars in almost all regions.
Research on consumer purchase intentions for sustainable passenger vehicles has expanded accordingly. The expansion has been rapid, scattered across transport, energy, marketing, psychology, and information systems journals, and theoretically promiscuous. Scholars borrow from the theory of planned behavior [2], the technology acceptance model [3], the unified theory of acceptance and use of technology and its consumer extension [4,5], and the diffusion of innovations [6], often welding two or three frameworks together in a single model. The result is a body of work that is rich but difficult to see as a whole.
Earlier reviews exist, and they are good. Rezvani, Jansson and Bodin organised the pre-2015 evidence and proposed a research agenda that the field largely followed [7]. Liao et al. reviewed stated-preference studies of electric vehicle attributes [8]. Singh, Singh and Vaibhav added a meta-analytic reading of adoption factors up to 2019 [9], and Kumar and Alok mapped adoption literature with an eye on sustainability [10]. However, all four predate the period in which most of this literature was written. As shown below, more than 70% of the documents in our corpus appeared after 2020. A review that stops in 2019 misses the post-pandemic surge, the arrival of UTAUT2 and PLS-SEM as default tools, the entry of Indonesia, Vietnam, and India as major producing countries, and the first wave of machine-learning and sentiment analysis studies. None of the earlier reviews combined a transparent, PRISMA-compliant screening protocol with full-corpus science mapping; they were either narrative syntheses or meta-analyses of narrow effect sets.
This study fills this gap. We paired two complementary methods. Bibliometric analysis handles the scale problem by summarizing the performance and intellectual structure of a large corpus through quantitative techniques applied to publication and citation data [11,12,13]. A PRISMA-guided systematic review handles the depth problem by forcing explicit, reproducible decisions about what counts as relevant evidence and supports a content-level synthesis of the screened studies [14]. Together, the two methods allow us to answer four questions. First, how has the field performed in terms of growth, outlets, countries, institutions, and influential works (RQ1)? Second, what are its intellectual foundations and current themes (RQ2)? Third, what are the substantive and methodological gaps (RQ3)? Fourth, where should the next wave of research go (RQ4)?
This study makes four contributions. (1) To our knowledge, this is the first review of the purchase intention literature on sustainable passenger vehicles to combine a PRISMA 2020 protocol with the full bibliometric toolbox of performance analysis, keyword co-occurrence, co-citation, bibliographic coupling, citation, and co-authorship mapping, following the guidelines set out by Donthu et al. [12]. (2) The corpus, 1447 documents through June 2026, is roughly three times larger than any earlier review in this domain and captures the years in which the field actually took shape. (3) We give explicit attention to the geographic redistribution of the field, particularly the rise of India and Southeast Asia, which earlier reviews could not observe. (4) We derive a research agenda that is disciplined by data: every proposed direction is tied either to a demonstrated gap in the screened studies or to a keyword whose late-period growth can be quantified.
The remainder of this paper is organized as follows. Section 2 describes the review design, search, PRISMA screening, and analytical tools. Section 3 reports the performance analysis of the proposed method. Section 4 presents the science mapping of the study. Section 5 synthesizes the screened studies thematically. Section 6 and Section 7 outline the gaps and future agendas, respectively. Section 8 presents the contributions of this study, and Section 9 concludes.
2. Materials and Methods
2.1. Review Design
Our research design was hybrid in nature. Bibliometric methods are used when the sample size is so large that a purely manual assessment is unfeasible, while the goal is to describe the structure of the field; systematic review methods are used when the goal is to evaluate the substantive content of each paper [12,13]. Our sample size of 1447 papers easily exceeds the threshold at which pure manual assessment would become unreasonable, but the way we need to assess the corpus (to establish what determinants are important, what the gaps in literature are) presupposes reading rather than counting. This means that bibliometric analysis will be carried out on the whole corpus, while qualitative synthesis will be based only on the smaller subsample of 706 studies selected under PRISMA criteria.
2.2. Search Strategy
Scopus was chosen as the single-source database. It offers the broadest coverage of the social-science and energy journals in which this literature lives [15], exports the structured metadata that VOSviewer requires, and avoids the format harmonization errors that creep in when multiple databases are merged [12]. The search string combined a vehicle block with an intention block in the titles, abstracts, and keywords:
(“electric vehicle*” OR “electric car*” OR “hybrid vehicle*” OR “new energy vehicle*” OR “sustainable vehicle*” OR “green vehicle*”) AND (“purchase intention*” OR “adoption intention*” OR “behavio* intention*” OR “consumer behavio*” OR “willingness to pay” OR “consumer acceptance”).
The search was conducted on June 11, 2026. The results were limited to English-language articles and conference papers published from 2015 onwards, the year of the Paris Agreement and of the field-defining review by Rezvani et al. [7], across the 14 Scopus subject areas in which relevant work appears (engineering, social sciences, energy, environmental science, business, economics, psychology, and related fields). The query returned 1447 records, all of which were exported with full bibliographic detail, abstracts, keywords and cited references.
2.3. PRISMA Screening
Screening followed the PRISMA 2020 statement [14]. Figure 1 shows the flow. First, three duplicate records were removed. At the screening stage we excluded 257 conference papers, one record without a usable abstract and one non-substantive editorial record, leaving 1185 journal articles for eligibility assessment. Conference papers were retained in the bibliometric corpus, where they contribute legitimately to maps of the field’s structure, but were excluded from the qualitative synthesis because their peer review and reporting depth vary too widely for content-level comparison.
Eligibility was assessed against four criteria, summarised in Table 1. A study had to (a) address consumer purchase intention, adoption intention, behavioral intention, willingness to pay or acceptance, (b) concern sustainable passenger vehicles (battery electric, hybrid, plug-in hybrid, fuel-cell, or other new-energy four-wheelers), (c) be an empirical or substantive conceptual contribution rather than a purely technical optimization exercise, and (d) study consumers rather than fleets. Applying these rules excluded 479 articles: 388 with no consumer intention focus, 45 restricted to two- or three-wheelers, 19 on heavy-duty, freight, or fleet contexts, and 27 on charging operations, vehicle-to-grid scheduling, or comparable technical problems. The qualitative synthesis therefore rests on 706 studies. Two authors screened independently; disagreements (under 4% of records) were resolved by discussion with the third author.
2.4. Analytical Procedure
Performance analysis used standard publication and citation metrics computed from the cleaned export: total publications, total and average citations, and constituent-level counts for sources, authors, institutions, and countries [12]. Science mapping was performed using VOSviewer 1.6.20 [16]. Four techniques were used. Keyword co-occurrence used all keywords with full counting to expose the field’s thematic structure. Co-citation of cited references, which treats two works as related when a third cites them together [17], was used to recover their intellectual foundations. Bibliographic coupling, which links documents sharing references [18], was restricted to 820 documents with at least five citations and used to identify current research fronts. Finally, co-authorship analysis applied a five-document threshold, which 44 of the corpus’s 4193 authors met. Author names and keyword variants (for example, “consumer behavior” and “consumer behaviour”) were harmonized through a thesaurus file before mapping. Affiliation strings were manually cleaned so that each author had a single valid country, as recommended for Scopus exports [12].
3. Performance Analysis
3.1. Growth of the Field
Figure 2 illustrates the annual output, which can be described as a trajectory of research productivity broken into three stages. From 2015 to 2019, the number of papers published varied from 27 to 69 per year; during this period, the Chinese database of literature was developed, and canonical theories were imported to China. In 2020-2022, the number of publications almost doubled from 74 to 140 per year. Beginning in 2022, publication activity skyrocketed, and the number of articles reached 163 in 2023, 233 in 2024, and 311 in 2025, implying an average annual increase of 23% for the entire observation period. The 162 papers cited by 11 June 2026 suggest that this year will be ahead of 2025. To date, this body of literature has accumulated 43,758 citations, which means that each article receives on average 31 citations.
3.2. Leading Sources
The top ten most prolific publications are listed in Table 2. Two publication logics exist simultaneously. The transport and economics-related journals, mainly Transportation Research Part D and Part A, are less prolific publications but are highly cited: Part D has an average citation per article of approximately 92, and Part A has around 93 citations on average. High-volume open-access journals, with Sustainability as the main player, account for the majority of the articles but have a lower impact on average. The World Electric Vehicle Journal was ranked third in terms of volume, with 54 articles, all of which were published in recent years, showing its development into the perfect fit for practical research from the consumer perspective.
3.3. Countries and Institutions
The number of documents produced per country is presented in Table 3. China tops the list, producing 418 documents, or almost 29% of the corpus, which is not surprising considering its role as the world’s leading new energy vehicle producer and the political atmosphere fostering natural experiments since 2014. The United States ranked next with 183 documents. The surprising element is India, which contributes 179 publications and ranks third, although it only produced one document in 2015. Indian publications reached 49 in 2024 and have sustained this rate ever since, mirroring FAME schemes and the broader trend towards electricity in transport [19,20]. Malaysian, Indonesian, Thai, and Vietnamese institutions provide more than 215 publications, indicating that much of the writing in the next ten years will occur in South and Southeast Asia. Institutional productivity is spread, with the lead held by China’s University of Science and Technology, which contributed 17 papers, while Universiti Sains Malaysia and Bina Nusantara University are tied for second place with 14 papers each.
3.4. Authors and Collaboration
The set comprises 4193 distinct authors, and the distribution of authorship was sparse at the upper end, with the most prolific individual being Y. Wang authored 26 papers, while only 44 others authored five or more papers. The co-authorship graph (see Section 4.4), which confirms this data, points to a discipline consisting of many temporary small groups rather than a few long-lived research teams. Prolific authors gravitate towards the Chinese policy evaluation line (S. Wang, D. Zhao, J. Li et al., authors of some of the highly cited papers [21,22,23,24]), as well as the Jiangsu University team studying Ghanaian and Chinese consumers.
3.5. Most Influential Documents
Table 4 presents the top ten cited publications. The study conducted by Rezvani et al. stands out from the pack with an impressive citation rate of 1106 [7]; not only was it seminal for setting the research agenda, but all following empirical studies included it in their introduction sections. The other nine items can be easily distinguished between the two traditions, which will be identified by science mapping. One tradition is psychological, focusing on extended TPB models and perception-based measures for consumers in China [21,23,25,26,27] and Malaysia [28]. The second is economic and policy-oriented, comprising conjoint and stated-preference studies of subsidies and attribute valuations [29], policy instruments [22,24], and the green versus price and range issues raised by Degirmenci and Breitner [30]. Two technical studies on battery costs and demand-response [31,32] were included because the key words included willingness to pay references; however, the papers were influential in adjacent areas.
4. Science Mapping
4.1. Keyword Co-Occurrence: The Thematic Structure
Figure 3 shows the keyword co-occurrence network, and Table 5 lists the most frequent author keywords. “Electric vehicles,” “purchase intention” (160 author-keyword occurrences), “consumer behavior” (134 after harmonizing spelling variants), and “willingness to pay” (77) form the connective tissue. Five thematic clusters are visible around them.
The red cluster is the behavioral core: purchase intention, adoption intention, theory of planned behavior, technology acceptance model, attitude, perceived risk, environmental concern, and structural equation modelling co-occur tightly. This is the survey-and-SEM tradition, and it is the largest cluster by the node count. The green cluster gathers the economics of choice: willingness to pay, discrete choice experiments and analysis, consumer preferences, subsidy systems, and contingent valuation, with Germany and plug-in hybrids as recurrent context terms. The blue cluster is technological, organized around charging infrastructure, electric vehicle charging, batteries, renewable energy, and optimization; it borders the consumer literature rather than belonging to it, and most of its documents were screened out of the qualitative synthesis. The yellow cluster links consumer attitude to the policy-making vocabulary: government, policy, carbon emission, incentive policies, with demographic markers (female, adult, middle aged) attached, evidence that demographics enter this literature mainly as sample descriptors rather than as theorized variables. The purple cluster is the youngest and the most interesting for what comes next: machine learning, artificial intelligence, sentiment analysis, online reviews, data mining, and sales co-occur here, marking the arrival of computational approaches that mine owner-generated text instead of administering questionnaires.
4.2. Co-Citation: The Intellectual Foundations
Figure 4 illustrates the co-citation network of the references. The study yielded three main findings. First, the most central node in the network is the article by Egbue and Long [33], published in 2012 on the attitudes and barriers of consumers; it links every cluster together because it is cited by both economists and psychologists. Second, Ajzen’s [2] Theory of Planned Behavior features as an extensively used co-cited anchor that is applied in more than one cluster simultaneously, both due to variation in reference strings and due to the importance of this theory for different communities; both factors apply in our case. Finally, there is a canon of methodology that includes widely discussed articles such as the Fornell and Larcker criteria [34] and Hair et al.’s guide on PLS-SEM [35].
Interpreting the clusters: the green and blue blocks represent the behavioral theory foundation – planned behavior theory, technology acceptance model, diffusion of innovations [6], perceived value; the red block represents the consumer preference tradition, including discrete choice models [36] and incentives [37]; finally, the yellow cluster represents the native research tradition with some empirical foundations [21,33]. This means that the field has been built around theories from outside, methodologies from other places, and has little empirical tradition of its own – though it is forming.
4.3. Bibliographic Coupling: The Research Fronts
The bibliographic coupling of the 820 documents with at least five citations (Figure 5) recovers the field’s present-day fronts. The blue cluster gathers the early intention models and reviews, with Rezvani et al. [7] and Wang et al. [21] as the largest nodes. The red cluster is the preference-and-policy front: Helveston et al. [29], Muratori and Rizzoni [32], Berckmans et al. [31], and the willingness-to-pay literature that grew around them. The green cluster, the largest and most recent, holds the global wave of extended-model studies: Degirmenci and Breitner in Germany [30], Asadi et al. in Malaysia [28], Eccarius and Lu in Taiwan, Keszey’s systematic extension work, and the dense crop of 2020–2024 emerging market studies. A smaller yellow group sits between the blue and green regions, and a peripheral purple fringe holds energy system papers loosely coupled to the rest. The structure says something simple and useful: the field’s growth is occurring in the green cluster, which is to say in model-extension studies set in new national contexts.
4.4. Citation and Co-Authorship Networks
Analysis of direct citations inside the corpus (Figure 6) produces a relatively sparse network with two new hub articles: Salari’s synthesis of the technology readiness index with environmental values [38] and Liao’s analysis of intentions during the post-subsidy period in China [39], each forming the center of a small cluster consisting of papers written between 2023 and 2026. This is quite telling. There are many citations of basic works in this field, but few citations of newer papers. This pattern is common in the literature, where authors conduct independent replication experiments without consulting each other.
This is even clearer in the co-authorship analysis. Out of the 4193 co-authors identified, only 44 crossed the five-publication line, while the largest group in the connected component consisted of only four authors (Figure 7): Obuobi, Nketiah, Song, and Adu-Gyamfi, a team from Jiangsu University examining consumer behaviors in China and Ghana. Forty of the 44 prolific co-authors had no collaborative links. For such a large body of almost 1500 publications, this level of fragmentation is quite remarkable and explains the replication without cumulative growth reported in the next section.
5. Thematic Synthesis of the Screened Literature
5.1. Theoretical Perspectives
The 706 screened studies leaned overwhelmingly on a handful of frameworks. The theory of planned behavior [2] is the workhorse, present in roughly one study in three either alone or in extended form; “theory of planned behavior” alone appears 55 times as an author keyword, and its constructs (attitude, subjective norms, perceived behavioral control) appear in many more. The technology acceptance model [3] is the second pillar, usually extended with perceived risk, environmental concerns, or incentive variables [24]. UTAUT and especially UTAUT2 [4,5] are the growth stocks: UTAUT2 barely existed in this literature before 2021 and now appears in a steady stream of studies, particularly from India and Southeast Asia [20]. Theoretical contestation is rare. Models are combined, almost never pitted against each other, and falsification is essentially absent. The field is expanding, but seldom tests are conducted.
5.2. Psychological Determinants
Across contexts, attitude is the most consistent proximal predictor of intention, and environmental concern is the most consistent distal predictor, operating mainly through attitude [21,26,28]. Perceived risk depresses intention wherever it is measured, with range and battery anxiety as its sharpest components [24]. The evidence on subjective norms is genuinely mixed: it is strong in some collectivist samples [21] and insignificant in others, including Huang and Ge’s Beijing respondents [27], suggesting moderation by something the field has not yet pinned down. Hedonic and symbolic motives (non-functional values, in Han et al. ’s phrase) matter more than early functional models assumed [23]. In contrast, personality is nearly untouched: He, Zhan, and Hu’s demonstration that personality traits condition perception effects [26] and Salari’s technology-readiness synthesis [38] remain rare exceptions rather than the start of a stream.
5.3. Economic and Policy Determinants
Economics-flavored studies tell a less comfortable story than psychology-flavored studies. The purchase price and total ownership cost dominate the stated preferences in most choice experiments [8,29]. Financial incentives raise intention in some designs [22,37] but not in others. Wang et al. found that financial incentive policy had no significant effect on adoption intention once knowledge and risk were modelled [24]. Huang and Ge found that monetary incentives mattered in Beijing, while non-monetary privileges did not [27]. Liao’s post-subsidy evidence suggests that the policy question is shifting from whether subsidies work to what happens when they are withdrawn [39]. Degirmenci and Breitner’s finding that environmental performance can outweigh price and range in shaping attitudes [30] sits in productive tension with the choice experiment consensus, and the tension has never been properly resolved; the two traditions measure different things (attitudinal antecedents versus trade-off behavior) and rarely read each other.
5.4. Infrastructure and Technology Attributes
Issues of charging availability, range, and charging time appear again as the limiting factors in nearly all countries considered [8,33]. The relatively new literature on this topic introduces an additional nuance. First, infrastructure works partially through psychological means: facilitating conditions and perception of control transfer some of this influence. Consequently, there may be a dissonance between actual infrastructure and the extent of confidence in it. Second, battery concerns are being transformed into a discussion of longevity, cost of replacements, and resale value, themes that link consumer research to circular economy concerns evident from the latter period keyword clusters.
5.5. Socio-Demographics
All empirical literature mentions age, gender, income and educational level and virtually none performs any theory-informed tests on them. When demographic variables were included as predictors, the results varied: positive relationships occurred with education and income, age had mixed effects and gender had weak ones. The yellow keyword cluster seen in Figure 3 indicates socio-demographic terms in relation to the attitude-policies domain in a descriptive, not a moderator role. Moderation analysis, including multi-group SEM by income groups, household sizes, and ownership or urbanity, was found in less than 1% of the 706 screened papers.
5.6. The Geography of Evidence, and the Indian Stream
China remains the reference context; its policy churn keeps producing natural experiments, and its studies anchor the citation structure [21,22,25]. The most consequential development since 2020 is the diversification of settings. The Indian stream illustrates both the promise and limits of the new wave. Early exploratory work [40] gave way to a rapid sequence of model-based studies: extended TPB [41], extended TAM with incentive moderation [19], integrated UTAUT with environmental concern, risk, and government support [20], attitude-mediation designs [42], willingness-to-pay estimation [43], stimulus–organism–response framing [44], motive studies [45], and hydrogen-vehicle extensions [46]. The volume is impressive. The variety is not: nearly all of these are cross-sectional urban surveys analysed with SEM, concentrated in metropolitan samples, with demographic moderation and actual purchase behaviour left untouched. India now produces an eighth of the world’s output in this field, while its EV share of four-wheeler sales remains in low single digits; the mismatch between research volume and behavioral insight is precisely where the next contributions lie.
6. Research Gaps
Reading the 706 screened studies against the maps in Section 4 yielded seven gaps. We state them bluntly because the literature has a habit of listing limitations that it then ignores.
G1. Geographic mismatch. South Asia, Africa, and Latin America remain thin relative to their share of future vehicle demand. India’s output has surged, but it is concentrated in Delhi-NCR and a few metros; tier-2 and tier-3 cities and rural buyers, who will decide mass adoption, are nearly invisible. The same holds for Indonesia and Vietnam, outside their capitals.
G2. Demographics without moderation. Age, gender, income, education, family size, occupation, and existing vehicle ownership are collected everywhere and theorized almost nowhere. Multigroup tests of whether the determinants of intention differ across these segments are rare, leaving policy targeting without an evidence base.
G3. The personality vacuum. Beyond a handful of studies [26,38], stable individual differences such as personal innovativeness, openness, or risk propensity are missing from intention models, despite consistent hints that they condition how perceptions translate into intention.
G4. The intention–behavior gap is unmeasured. Intention is the dependent variable in the overwhelming majority of studies; however, decades of psychological evidence show that intentions convert to behavior imperfectly [47]. Studies linking stated intention to registration data, dealership outcomes, or panel-tracked purchases are almost non-existent in this corpus.
G5. Methodological monocultures. The cross-sectional questionnaire analysed with covariance- or PLS-based SEM is the field’s default to a degree the keyword data make embarrassing: PLS-SEM went from zero pre-2020 author-keyword occurrences to 16 in 2023–2026. Longitudinal, experimental, and quasi-experimental designs are scarce, as is qualitative depth.
G6. Segment blind spots. The used-EV market, household second-car decisions, and total cost of ownership perception over the vehicle’s life have barely been studied, even though resale value and battery degradation now surface repeatedly in consumer worry lists.
G7. Fragmented community. The co-authorship evidence (Section 4.4) shows a field of isolated teams. Without durable collaborations or coordinated multi-country instruments, results accumulate side by side instead of building on each other.
7. Future Research Agenda
The agenda below pairs each direction with the evidence that motivates it, either a gap above or a keyword whose late-period growth we measured (Section 4.1).
F1. From intention to behavior: Panel designs that re-contact respondents after 12–24 months and linkages to registration or dealership data would finally quantify the conversion rate that the entire literature presumes (addresses G4).
F2. Demographic and personality moderation by design. Studies should be powered and sampled for multi-group analysis from the outset, treating income tier, family size, gender, occupation and personal innovativeness as focal moderators rather than control variables (G2, G3). The doctoral framework underlying the present review, which models demographic moderation and personality antecedents of intention for Delhi-NCR consumers, is one concrete example.
F3. Post-subsidy and policy withdrawal studies. As incentive schemes sunset in China, India, and Europe, quasi-experimental evaluations of withdrawal effects [39] will matter more than another cross-sectional incentive-perception survey (G5).
F4. Owner-generated data. The purple keyword cluster (sentiment analysis, machine learning, online reviews) points to a complementary evidence stream: mining owner forums, e-commerce reviews, and social media to measure satisfaction, worry, and advocacy at scale, then validating survey constructs against it.
F5. Circular-economy consumer research. Battery second life, degradation transparency, warranty design, and resale-value assurance are rising consumer concerns with almost no intention research attached; “circular economy” entered the keyword list only after 2022 (G6).
F6. Beyond the metros. Sampling frames that reach tier-2 and tier-3 cities, rural households, and first-time buyers in South and Southeast Asia would correct the urban skew that currently limits external validity (G1).
F7. Theory testing, not just theory blending. Competitive model tests (TPB versus UTAUT2 versus value-based models on the same sample), preregistration, and replication across countries would convert the field’s breadth into cumulative knowledge (G5, G7).
F8. Coordinated multi-country instruments are also used. A shared core questionnaire administered across emerging markets, on the model of comparative consumer studies in other domains, would exploit the field’s geographic spread instead of merely repeating it (G7).
8. Contributions of the Study
8.1. Contribution to the Literature
This review makes four substantive contributions to the literature. First, it replaces outdated maps with current ones. The most recent comprehensive syntheses in this field closed their searches in 2019 or earlier [7,8,9,10]. Because more than 70% of the corpus analyzed here was published after 2020, the present study is, in effect, the first full account of the field as it actually exists. Second, it documents structural facts that no prior review could report: the 23% compound growth rate, the redistribution of output toward India and Southeast Asia, the five-cluster thematic architecture, the three intellectual pillars recovered by co-citation, and the extreme collaboration fragmentation revealed by the co-authorship network (the largest connected component of four authors in a literature of 4193). Each of these is a new empirical finding about the field itself, derived from the data rather than asserted. Third, the review consolidates the evidence on determinants in a way that exposes genuine disagreements instead of smoothing them over, most notably the split verdict on financial incentives [24,27,37] and the unresolved tension between attitudinal and choice-experiment traditions [29,30]. Fourth, the seven gaps and eight agenda items are individually anchored either to counts from the screened studies or to measured keyword growth, which gives future researchers a defensible, evidence-based starting point rather than a wish list of topics.
8.2. Methodological Contribution
This study offers a fully integrated approach to hybrid methodology in this area: one database search, one data set, two methods of analysis, the PRISMA 2020 selection flowchart [14], with everything entering the meta-qualitative analysis, and the whole Donthu toolset [12], including performance analysis and five different science mapping techniques, being applied to the entire database. Previous reviews in this area chose either qualitative or science mapping analysis; applying both in turn to a common dataset allows the former to contextualize the latter and vice versa. The criterion-based, counted and accounted exclusions process may be used as a template for adjacent reviews in literature on two-wheelers, fleets, or charging behavior.
8.3. Practical and Policy Contribution
From a manufacturer’s perspective, this study shows where customer loyalty is created: charging guarantees, battery transparency, and the resale value of vehicles are consistent themes, but incentives can be considered unpredictable tools. From the policymakers’ point of view, particularly in countries like India and Southeast Asia, where ambitious targets are proposed and there is scant literature beyond the cities, the paper makes clear where the gaps in the research are in terms of consumer categories and research questions. It highlights the potential need to evaluate the withdrawal of incentives based on the post-subsidy findings [39]. For Ph.D. candidates and supervisors, this provides both an agenda and a thesis topic menu.
9. Conclusions
This review set out to map a literature that had outgrown its previous maps. Combining a PRISMA-screened systematic review of 706 studies with bibliometric analysis of the full 1447-document corpus, we can answer the four questions posed at the outset. On performance (RQ1): the field has grown at about 23% annually since 2015, gathered 43,758 citations, found its high-impact home in the transport-economics journals and its high-volume home in open-access sustainability outlets, and shifted geographically toward Asia, with India now third in world output. On structure (RQ2): five thematic clusters organise the keyword space, and the intellectual foundations rest on three pillars: behavioural theory, choice modelling, and the PLS-SEM methodological canon, with Egbue and Long’s barrier analysis and Rezvani’s review as the field’s own connective landmarks. On gaps (RQ3): seven are documented, the most consequential being untested demographic moderation, the missing personality stream, the unmeasured intention–behaviour link and a methodological monoculture of cross-sectional SEM surveys. On direction (RQ4): an eight-point agenda, each item tied to measured evidence, points the way.
Two implications deserve emphasis. For researchers, the marginal value of another extended-TPB survey in another city is now low; the marginal value of a panel study, a moderation-designed sample or a policy-withdrawal evaluation is high. For policymakers and manufacturers, the synthesis cautions against treating incentive perception as a reliable lever (the evidence is split) and for investing in the things consumers consistently reward: charging confidence, battery transparency and credible resale value.
Limitations apply. The corpus is Scopus-only and English-only, which undercounts Chinese-, Indonesian- and Hindi-language work; citation counts lag and disadvantage 2024–2026 papers; the eligibility screen, though rule-based and double-checked, involves judgement at the margins; and bibliometric clusters describe structure, not quality. None of these alters the central picture: a decade-old field, growing fast, theoretically settled to a fault, and ready for a second act that measures behaviour rather than restating intention.
Author Contributions
Conceptualisation, R.K. and N.R.; methodology, R.K. and S.K.; software and data curation, R.K.; formal analysis, R.K.; validation, N.R. and S.K.; writing—original draft preparation, R.K.; writing—review and editing, N.R. and S.K.; supervision, N.R. and S.K. All authors have read and agreed to the published version of the manuscript.
Funding
This research received no external funding.
Data Availability Statement
The bibliographic data analysed in this study were retrieved from the Scopus database (Elsevier) and are available from the corresponding author on reasonable request, subject to the database licence terms.
Conflicts of Interest
The authors declare no conflicts of interest.
References
- International Energy Agency. Global EV Outlook 2024: Moving towards Increased Affordability; IEA: Paris, France, 2024. [Google Scholar]
- Ajzen, I. The theory of planned behavior. Organ. Behav. Hum. Decis. Process. 1991, 50, 179–211. [Google Scholar] [CrossRef]
- Davis, F.D. Perceived usefulness, perceived ease of use, and user acceptance of information technology. MIS Q. 1989, 13, 319–340. [Google Scholar] [CrossRef] [PubMed]
- Venkatesh, V.; Morris, M.G.; Davis, G.B.; Davis, F.D. User acceptance of information technology: Toward a unified view. MIS Q. 2003, 27, 425–478. [Google Scholar] [CrossRef]
- Venkatesh, V.; Thong, J.Y.L.; Xu, X. Consumer acceptance and use of information technology: Extending the unified theory of acceptance and use of technology. MIS Q. 2012, 36, 157–178. [Google Scholar] [CrossRef]
- Rogers, E.M. Diffusion of Innovations, 5th ed.; Free Press: New York, NY, USA, 2003. [Google Scholar]
- Rezvani, Z.; Jansson, J.; Bodin, J. Advances in consumer electric vehicle adoption research: A review and research agenda. Transp. Res. Part D. Transp. Environ. 2015, 34, 122–136. [Google Scholar] [CrossRef]
- Liao, F.; Molin, E.; van Wee, B. Consumer preferences for electric vehicles: A literature review. Transp. Rev. 2017, 37, 252–275. [Google Scholar] [CrossRef]
- Singh, V.; Singh, V.; Vaibhav, S. A review and simple meta-analysis of factors influencing adoption of electric vehicles. Transp. Res. Part D. Transp. Environ. 2020, 86, 102436. [Google Scholar] [CrossRef]
- Kumar, R.R.; Alok, K. Adoption of electric vehicle: A literature review and prospects for sustainability. J. Clean. Prod. 2020, 253, 119911. [Google Scholar] [CrossRef]
- Pritchard, A. Statistical bibliography or bibliometrics? J. Doc. 1969, 25, 348–349. [Google Scholar]
- Donthu, N.; Kumar, S.; Mukherjee, D.; Pandey, N.; Lim, W.M. How to conduct a bibliometric analysis: An overview and guidelines. J. Bus. Res. 2021, 133, 285–296. [Google Scholar] [CrossRef]
- Zupic, I.; Čater, T. Bibliometric methods in management and organization. Organ. Res. Methods 2015, 18, 429–472. [Google Scholar] [CrossRef]
- Page, M.J.; McKenzie, J.E.; Bossuyt, P.M.; Boutron, I.; Hoffmann, T.C.; Mulrow, C.D.; Shamseer, L.; Tetzlaff, J.M.; Akl, E.A.; Brennan, S.E.; et al. The PRISMA 2020 statement: An updated guideline for reporting systematic reviews. BMJ 2021, 372, n71. [Google Scholar] [CrossRef] [PubMed]
- Mongeon, P.; Paul-Hus, A. The journal coverage of Web of Science and Scopus: A comparative analysis. Scientometrics 2016, 106, 213–228. [Google Scholar] [CrossRef]
- van Eck, N.J.; Waltman, L. Software survey: VOSviewer, a computer program for bibliometric mapping. Scientometrics 2010, 84, 523–538. [Google Scholar] [CrossRef] [PubMed]
- Small, H. Co-citation in the scientific literature: A new measure of the relationship between two documents. J. Am. Soc. Inf. Sci. 1973, 24, 265–269. [Google Scholar] [CrossRef]
- Kessler, M.M. Bibliographic coupling between scientific papers. Am. Doc. 1963, 14, 10–25. [Google Scholar] [CrossRef]
- Jaiswal, D.; Kaushal, V.; Kant, R.; Singh, P.K. Consumer adoption intention for electric vehicles: Insights and evidence from Indian sustainable transportation. Technol. Forecast. Soc. Change 2021, 173, 121089. [Google Scholar] [CrossRef]
- Jain, N.K.; Bhaskar, K.; Jain, S. What drives adoption intention of electric vehicles in India? An integrated UTAUT model with environmental concerns, perceived risk and government support. Res. Transp. Bus. Manag. 2022, 42, 100730. [Google Scholar] [CrossRef]
- Wang, S.; Fan, J.; Zhao, D.; Yang, S.; Fu, Y. Predicting consumers’ intention to adopt hybrid electric vehicles: Using an extended version of the theory of planned behavior model. Transportation 2016, 43, 123–143. [Google Scholar] [CrossRef]
- Wang, S.; Li, J.; Zhao, D. The impact of policy measures on consumer intention to adopt electric vehicles: Evidence from China. Transp. Res. Part A Policy Pract. 2017, 105, 14–26. [Google Scholar] [CrossRef]
- Han, L.; Wang, S.; Zhao, D.; Li, J. The intention to adopt electric vehicles: Driven by functional and non-functional values. Transp. Res. Part A Policy Pract. 2017, 103, 185–197. [Google Scholar] [CrossRef]
- Wang, S.; Wang, J.; Li, J.; Wang, J.; Liang, L. Policy implications for promoting the adoption of electric vehicles: Do consumer’s knowledge, perceived risk and financial incentive policy matter? Transp. Res. Part A Policy Pract. 2018, 117, 58–69. [Google Scholar] [CrossRef]
- Lin, B.; Wu, W. Why people want to buy electric vehicle: An empirical study in first-tier cities of China. Energy Policy 2018, 112, 233–241. [Google Scholar] [CrossRef]
- He, X.; Zhan, W.; Hu, Y. Consumer purchase intention of electric vehicles in China: The roles of perception and personality. J. Clean. Prod. 2018, 204, 1060–1069. [Google Scholar] [CrossRef]
- Huang, X.; Ge, J. Electric vehicle development in Beijing: An analysis of consumer purchase intention. J. Clean. Prod. 2019, 216, 361–372. [Google Scholar] [CrossRef]
- Asadi, S.; Nilashi, M.; Samad, S.; Abdullah, R.; Mahmoud, M.; Alkinani, M.H.; Yadegaridehkordi, E. Factors impacting consumers’ intention toward adoption of electric vehicles in Malaysia. J. Clean. Prod. 2021, 282, 124474. [Google Scholar] [CrossRef]
- Helveston, J.P.; Liu, Y.; Feit, E.M.; Fuchs, E.; Klampfl, E.; Michalek, J.J. Will subsidies drive electric vehicle adoption? Measuring consumer preferences in the U.S. and China. Transp. Res. Part A Policy Pract. 2015, 73, 96–112. [Google Scholar] [CrossRef]
- Degirmenci, K.; Breitner, M.H. Consumer purchase intentions for electric vehicles: Is green more important than price and range? Transp. Res. Part D. Transp. Environ. 2017, 51, 250–260. [Google Scholar] [CrossRef]
- Berckmans, G.; Messagie, M.; Smekens, J.; Omar, N.; Vanhaverbeke, L.; Van Mierlo, J. Cost projection of state of the art lithium-ion batteries for electric vehicles up to 2030. Energies 2017, 10, 1314. [Google Scholar] [CrossRef]
- Muratori, M.; Rizzoni, G. Residential demand response: Dynamic energy management and time-varying electricity pricing. IEEE Trans. Power Syst. 2016, 31, 1108–1117. [Google Scholar] [CrossRef]
- Egbue, O.; Long, S. Barriers to widespread adoption of electric vehicles: An analysis of consumer attitudes and perceptions. Energy Policy 2012, 48, 717–729. [Google Scholar] [CrossRef]
- Fornell, C.; Larcker, D.F. Evaluating structural equation models with unobservable variables and measurement error. J. Mark. Res. 1981, 18, 39–50. [Google Scholar] [CrossRef]
- Hair, J.F.; Risher, J.J.; Sarstedt, M.; Ringle, C.M. When to use and how to report the results of PLS-SEM. Eur. Bus. Rev. 2019, 31, 2–24. [Google Scholar] [CrossRef]
- Train, K.E. Discrete Choice Methods with Simulation, 2nd ed.; Cambridge University Press: Cambridge, UK, 2009. [Google Scholar]
- Sierzchula, W.; Bakker, S.; Maat, K.; van Wee, B. The influence of financial incentives and other socio-economic factors on electric vehicle adoption. Energy Policy 2014, 68, 183–194. [Google Scholar] [CrossRef]
- Salari, N. Electric vehicles adoption behaviour: Synthesising the technology readiness index with environmentalism values and instrumental attributes. Transp. Res. Part A Policy Pract. 2022, 164, 60–81. [Google Scholar] [CrossRef]
- Liao, Y. Intention of consumers to adopt electric vehicle in the post-subsidy era: Evidence from China. Int. J. Sustain. Transp. 2022, 16, 647–659. [Google Scholar] [CrossRef]
- Mishra, S.; Malhotra, G. Is India ready for e-mobility? An exploratory study to understand e-vehicles purchase intention. Theor. Econ. Lett. 2019, 9, 376–391. [Google Scholar] [CrossRef]
- Shalender, K.; Sharma, N. Using extended theory of planned behaviour (TPB) to predict adoption intention of electric vehicles in India. Environ. Dev. Sustain. 2021, 23, 665–681. [Google Scholar] [CrossRef]
- Khurana, A.; Kumar, V.V.R.; Sidhpuria, M. A study on the adoption of electric vehicles in India: The mediating role of attitude. Vision 2020, 24, 23–34. [Google Scholar] [CrossRef]
- Bansal, P.; Kumar, R.R.; Raj, A.; Dubey, S.; Graham, D.J. Willingness to pay and attitudinal preferences of Indian consumers for electric vehicles. Energy Econ. 2021, 100, 105340. [Google Scholar] [CrossRef]
- Upadhyay, N.; Kamble, A. Examining Indian consumer pro-environment purchase intention of electric vehicles: Perspective of stimulus–organism–response. Technol. Forecast. Soc. Change 2023, 189, 122344. [Google Scholar] [CrossRef]
- Sahoo, D.; Harichandan, S.; Kar, S.K.; Sreejesh, S. An empirical study on consumer motives and attitude towards adoption of electric vehicles in India: Policy implications for stakeholders. Energy Policy 2022, 165, 112941. [Google Scholar] [CrossRef]
- Kar, S.K.; Bansal, R.; Harichandan, S. An empirical study on intention to use hydrogen fuel cell vehicles in India. Int. J. Hydrogen Energy 2022, 47, 19999–20015. [Google Scholar] [CrossRef]
- Sheeran, P.; Webb, T.L. The intention–behavior gap. Soc. Personal. Psychol. Compass 2016, 10, 503–518. [Google Scholar] [CrossRef]
Figure 1.
PRISMA 2020 flow diagram of the identification, screening, and inclusion processes. The full corpus (n = 1447) was used for bibliometric analysis, and the screened subset (n = 706) was used for qualitative synthesis.
Figure 1.
PRISMA 2020 flow diagram of the identification, screening, and inclusion processes. The full corpus (n = 1447) was used for bibliometric analysis, and the screened subset (n = 706) was used for qualitative synthesis.
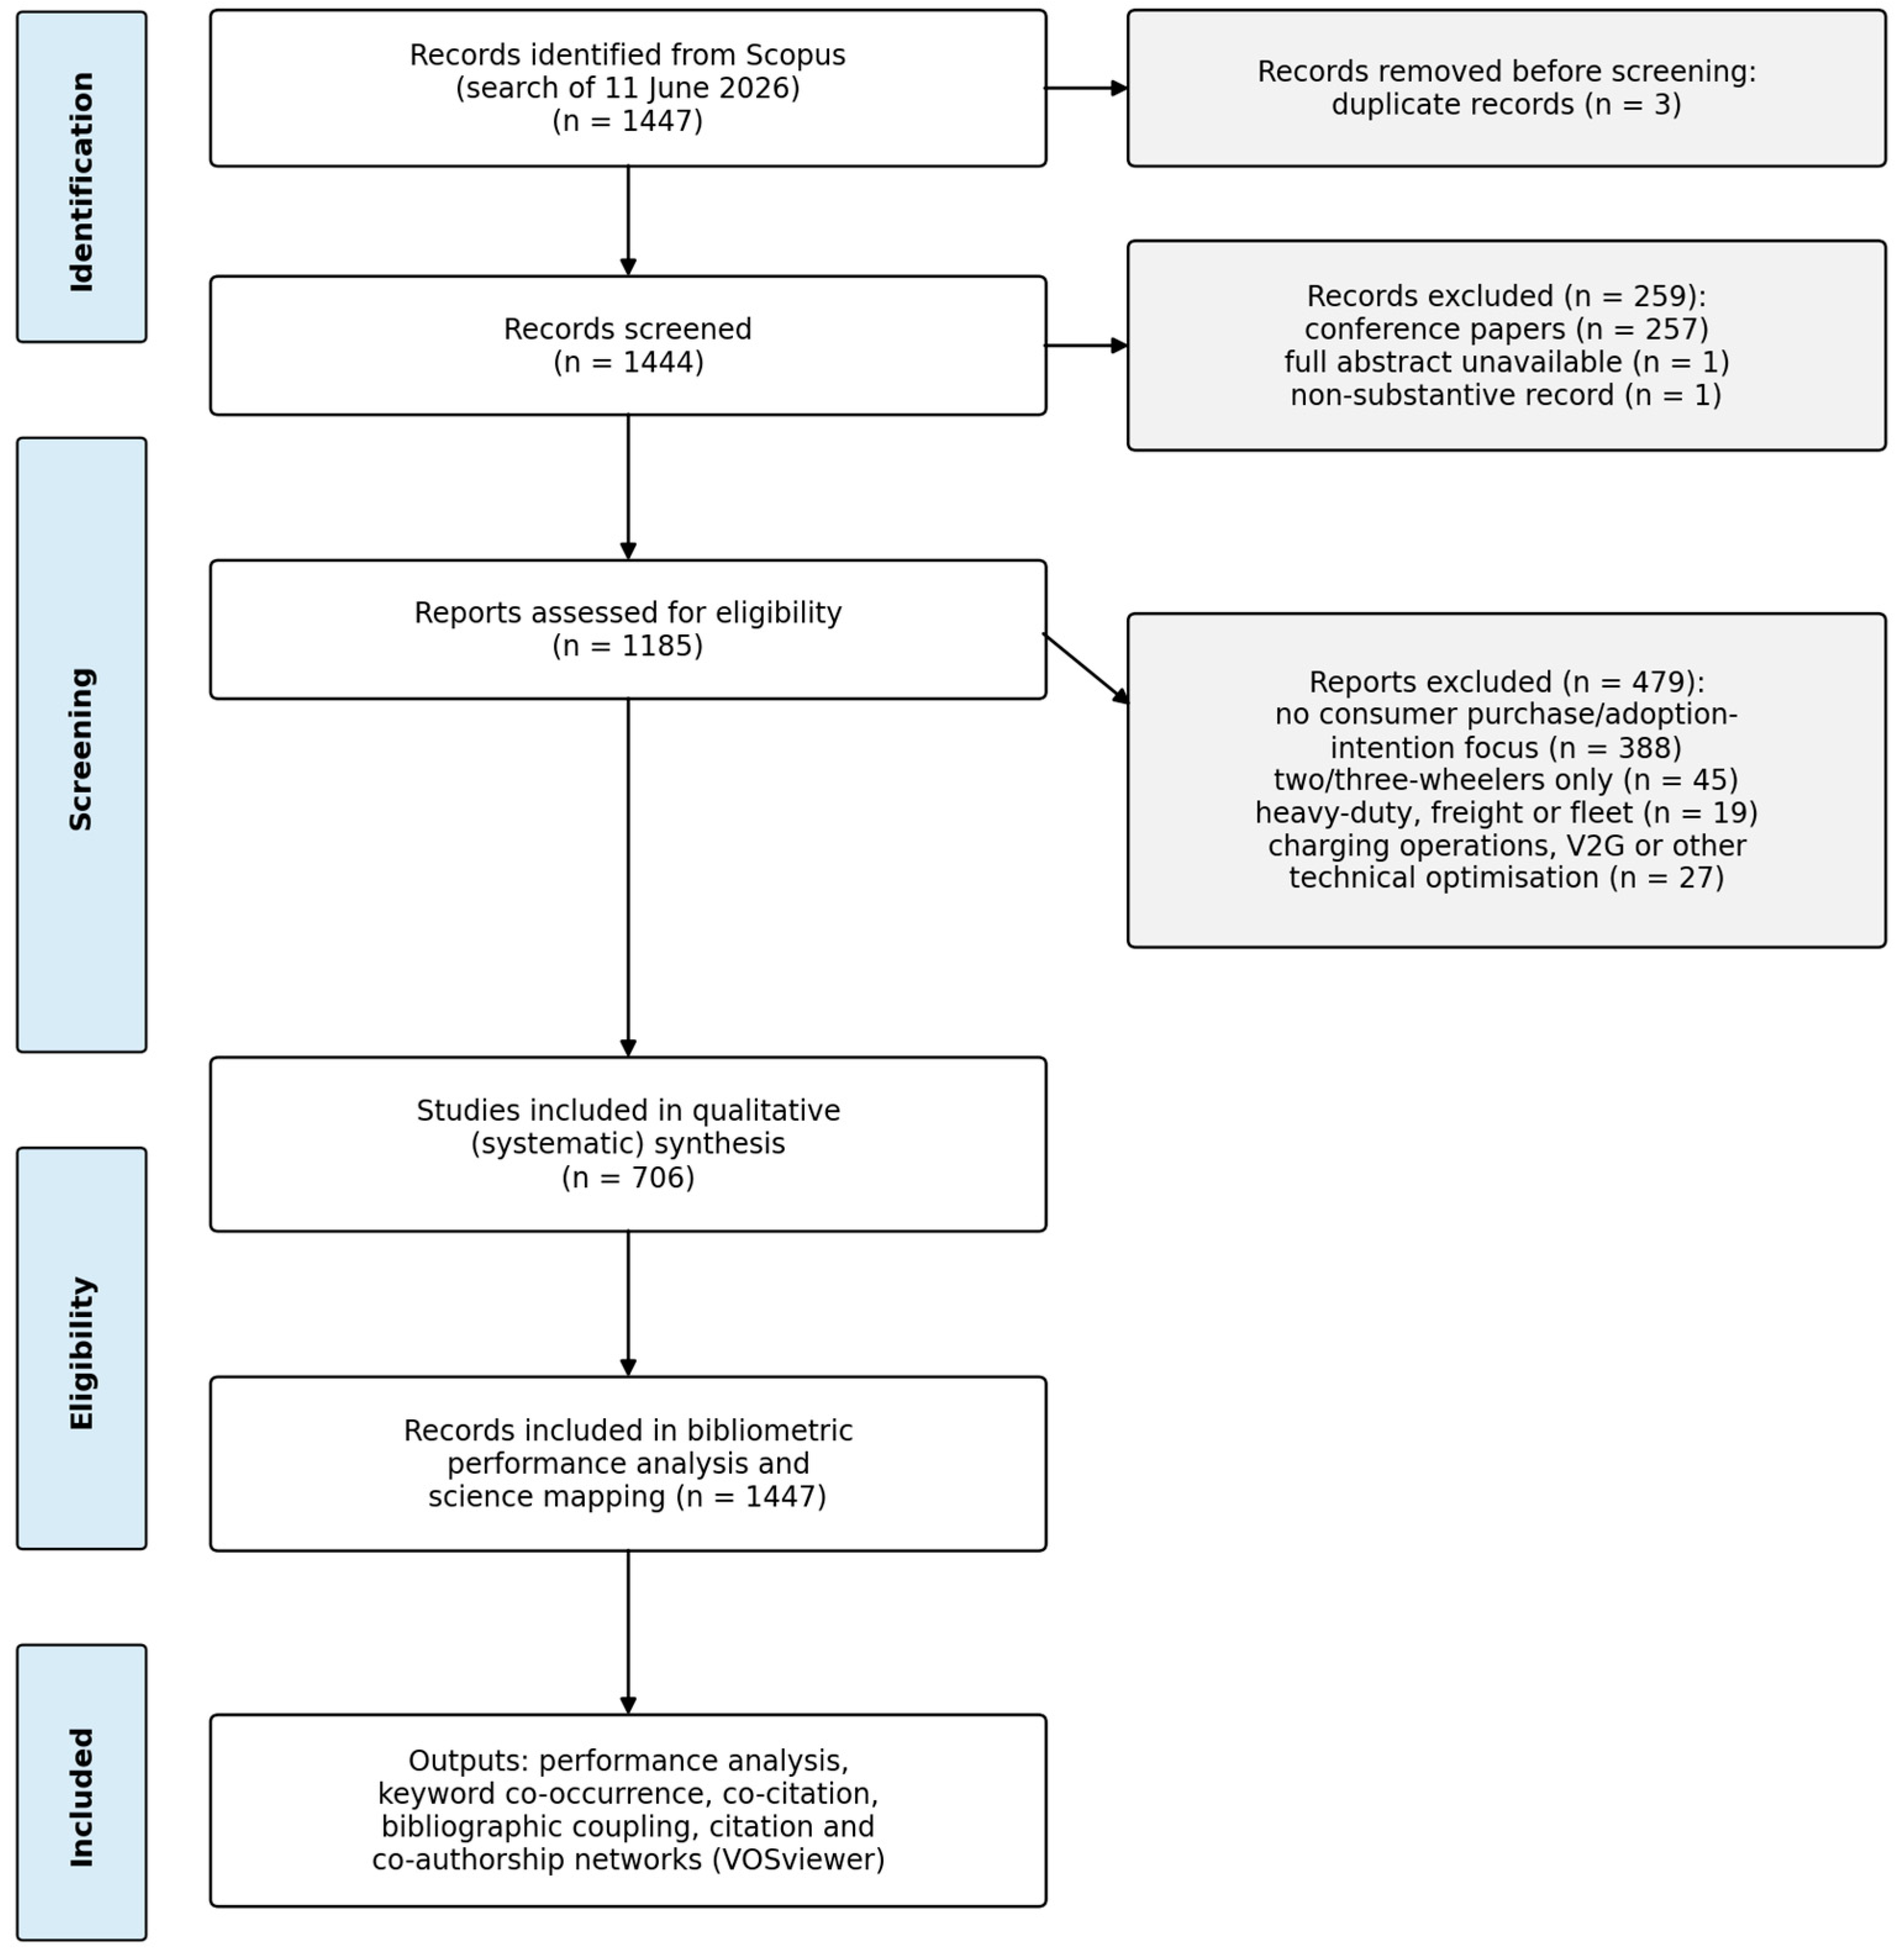
Figure 2.
Annual scientific production, 2015–2026 (n = 1447). The 2026 bar covers publications indexed until June 11, 2026.
Figure 2.
Annual scientific production, 2015–2026 (n = 1447). The 2026 bar covers publications indexed until June 11, 2026.
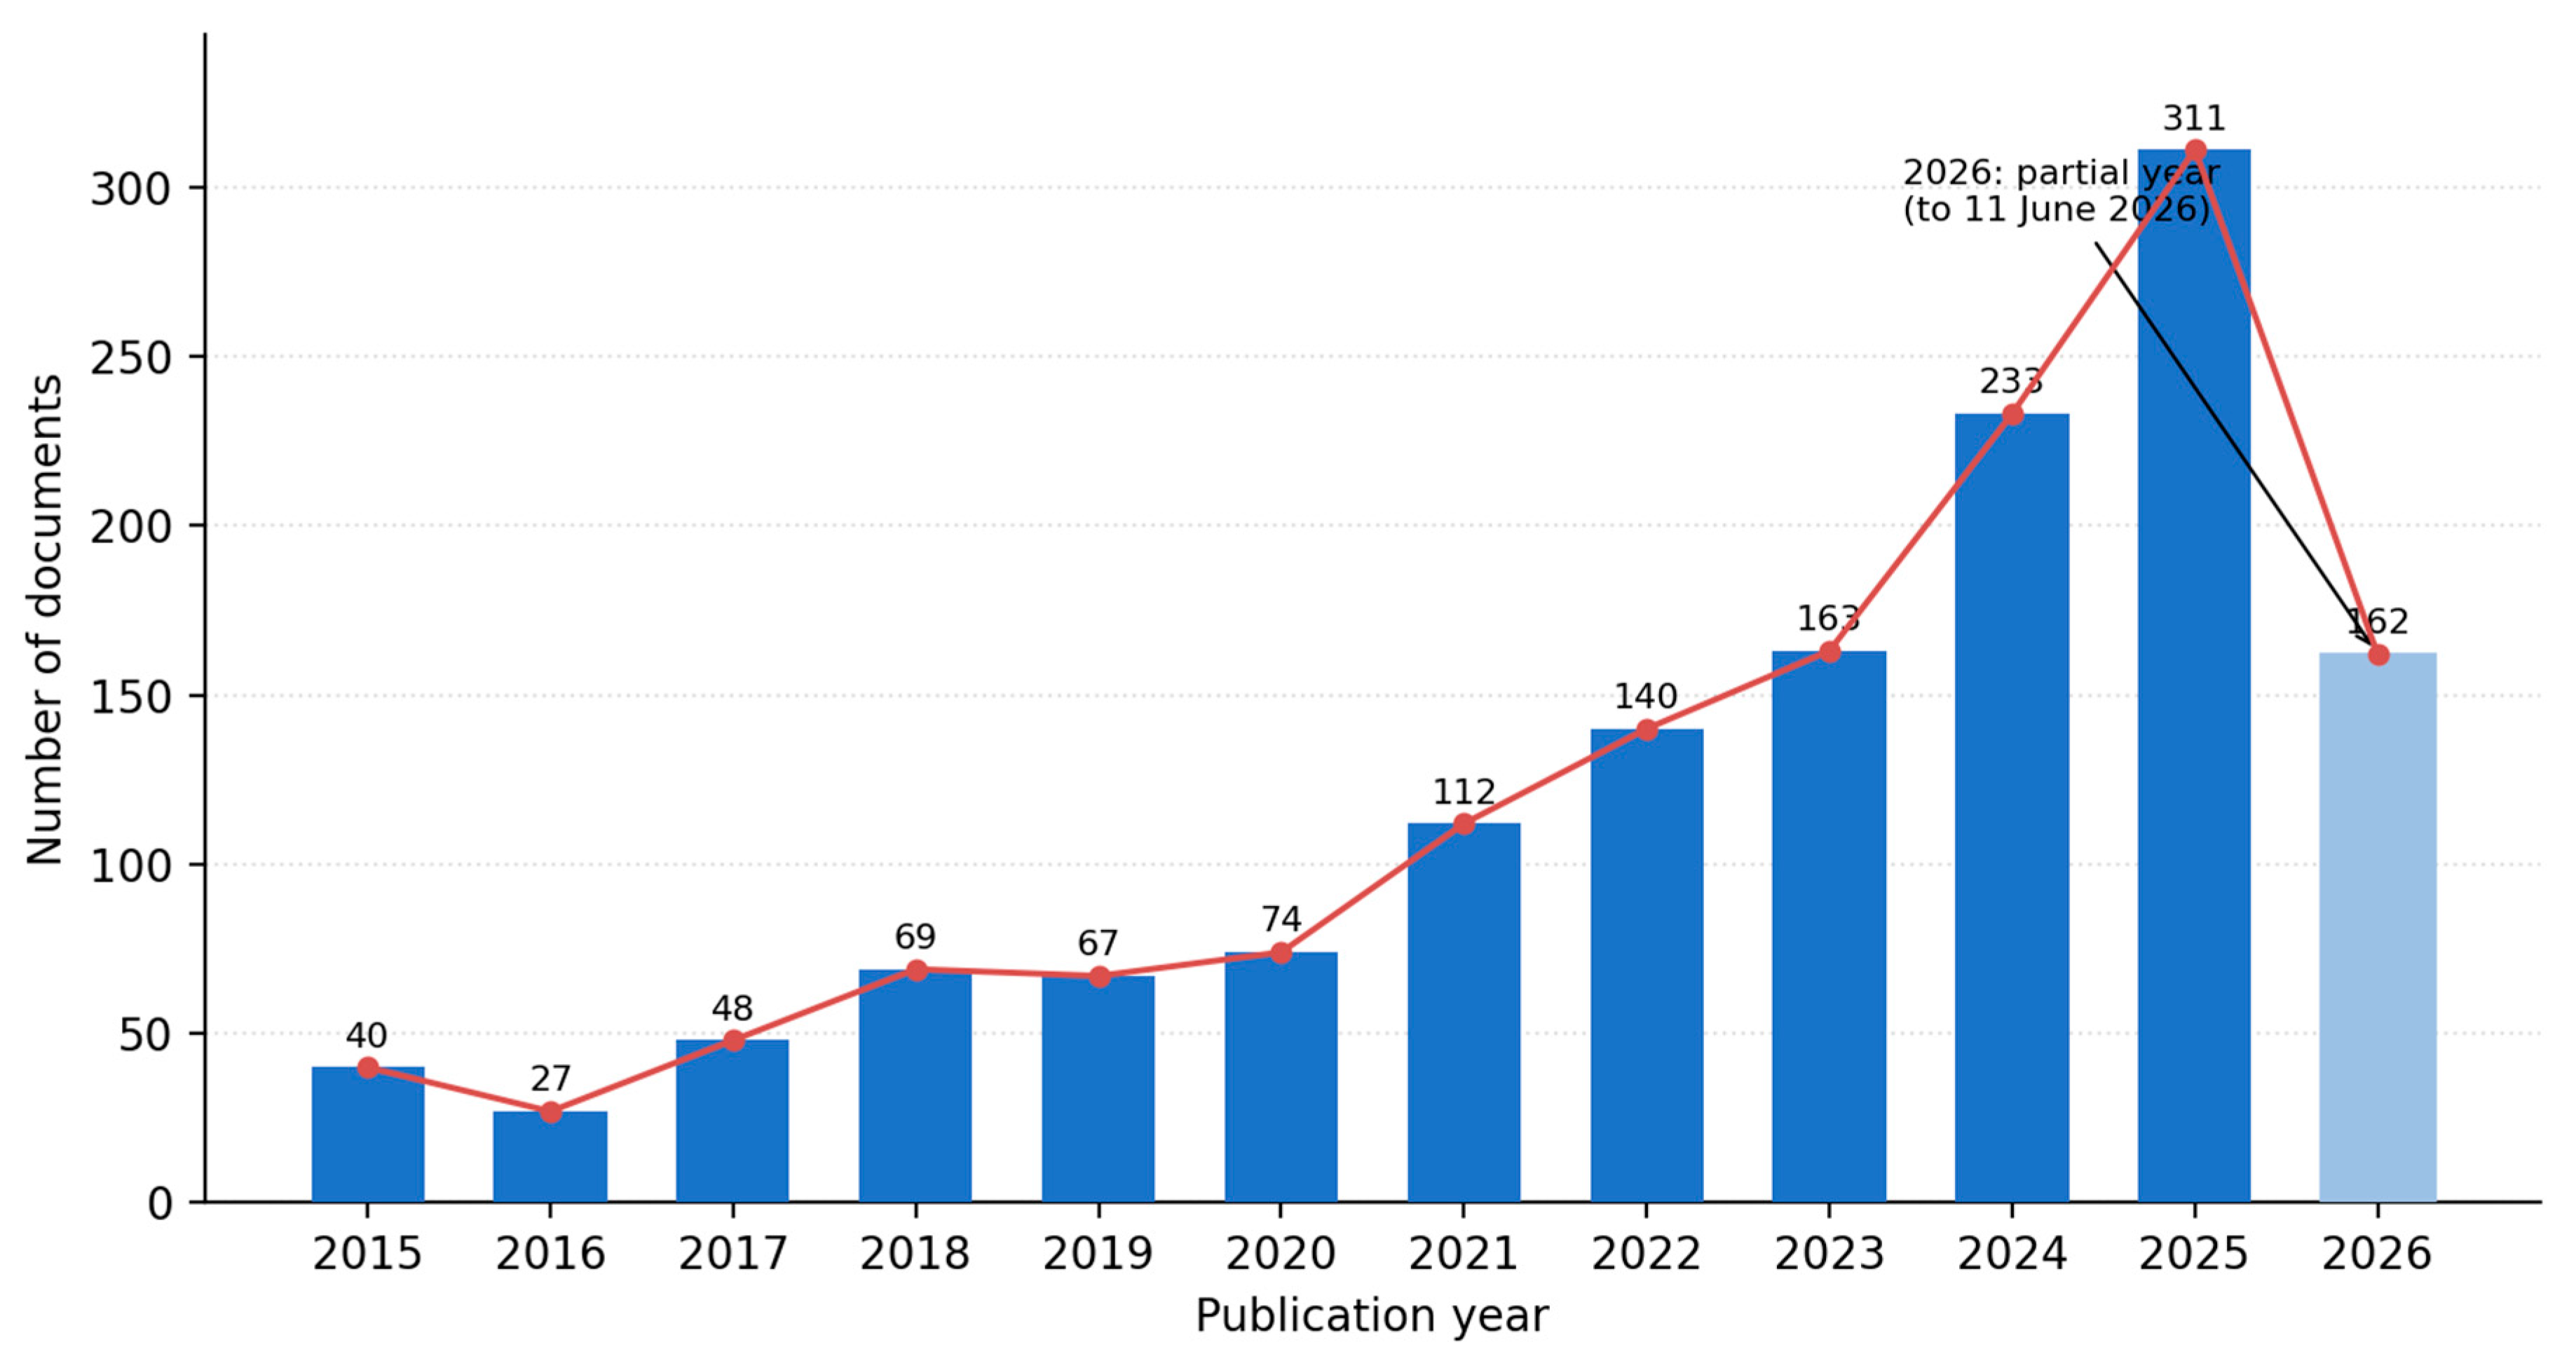
Figure 3.
Keyword co-occurrence network (all keywords, full counting, VOSviewer). The node size reflects the occurrence, colors colours mark the thematic clusters.
Figure 3.
Keyword co-occurrence network (all keywords, full counting, VOSviewer). The node size reflects the occurrence, colors colours mark the thematic clusters.
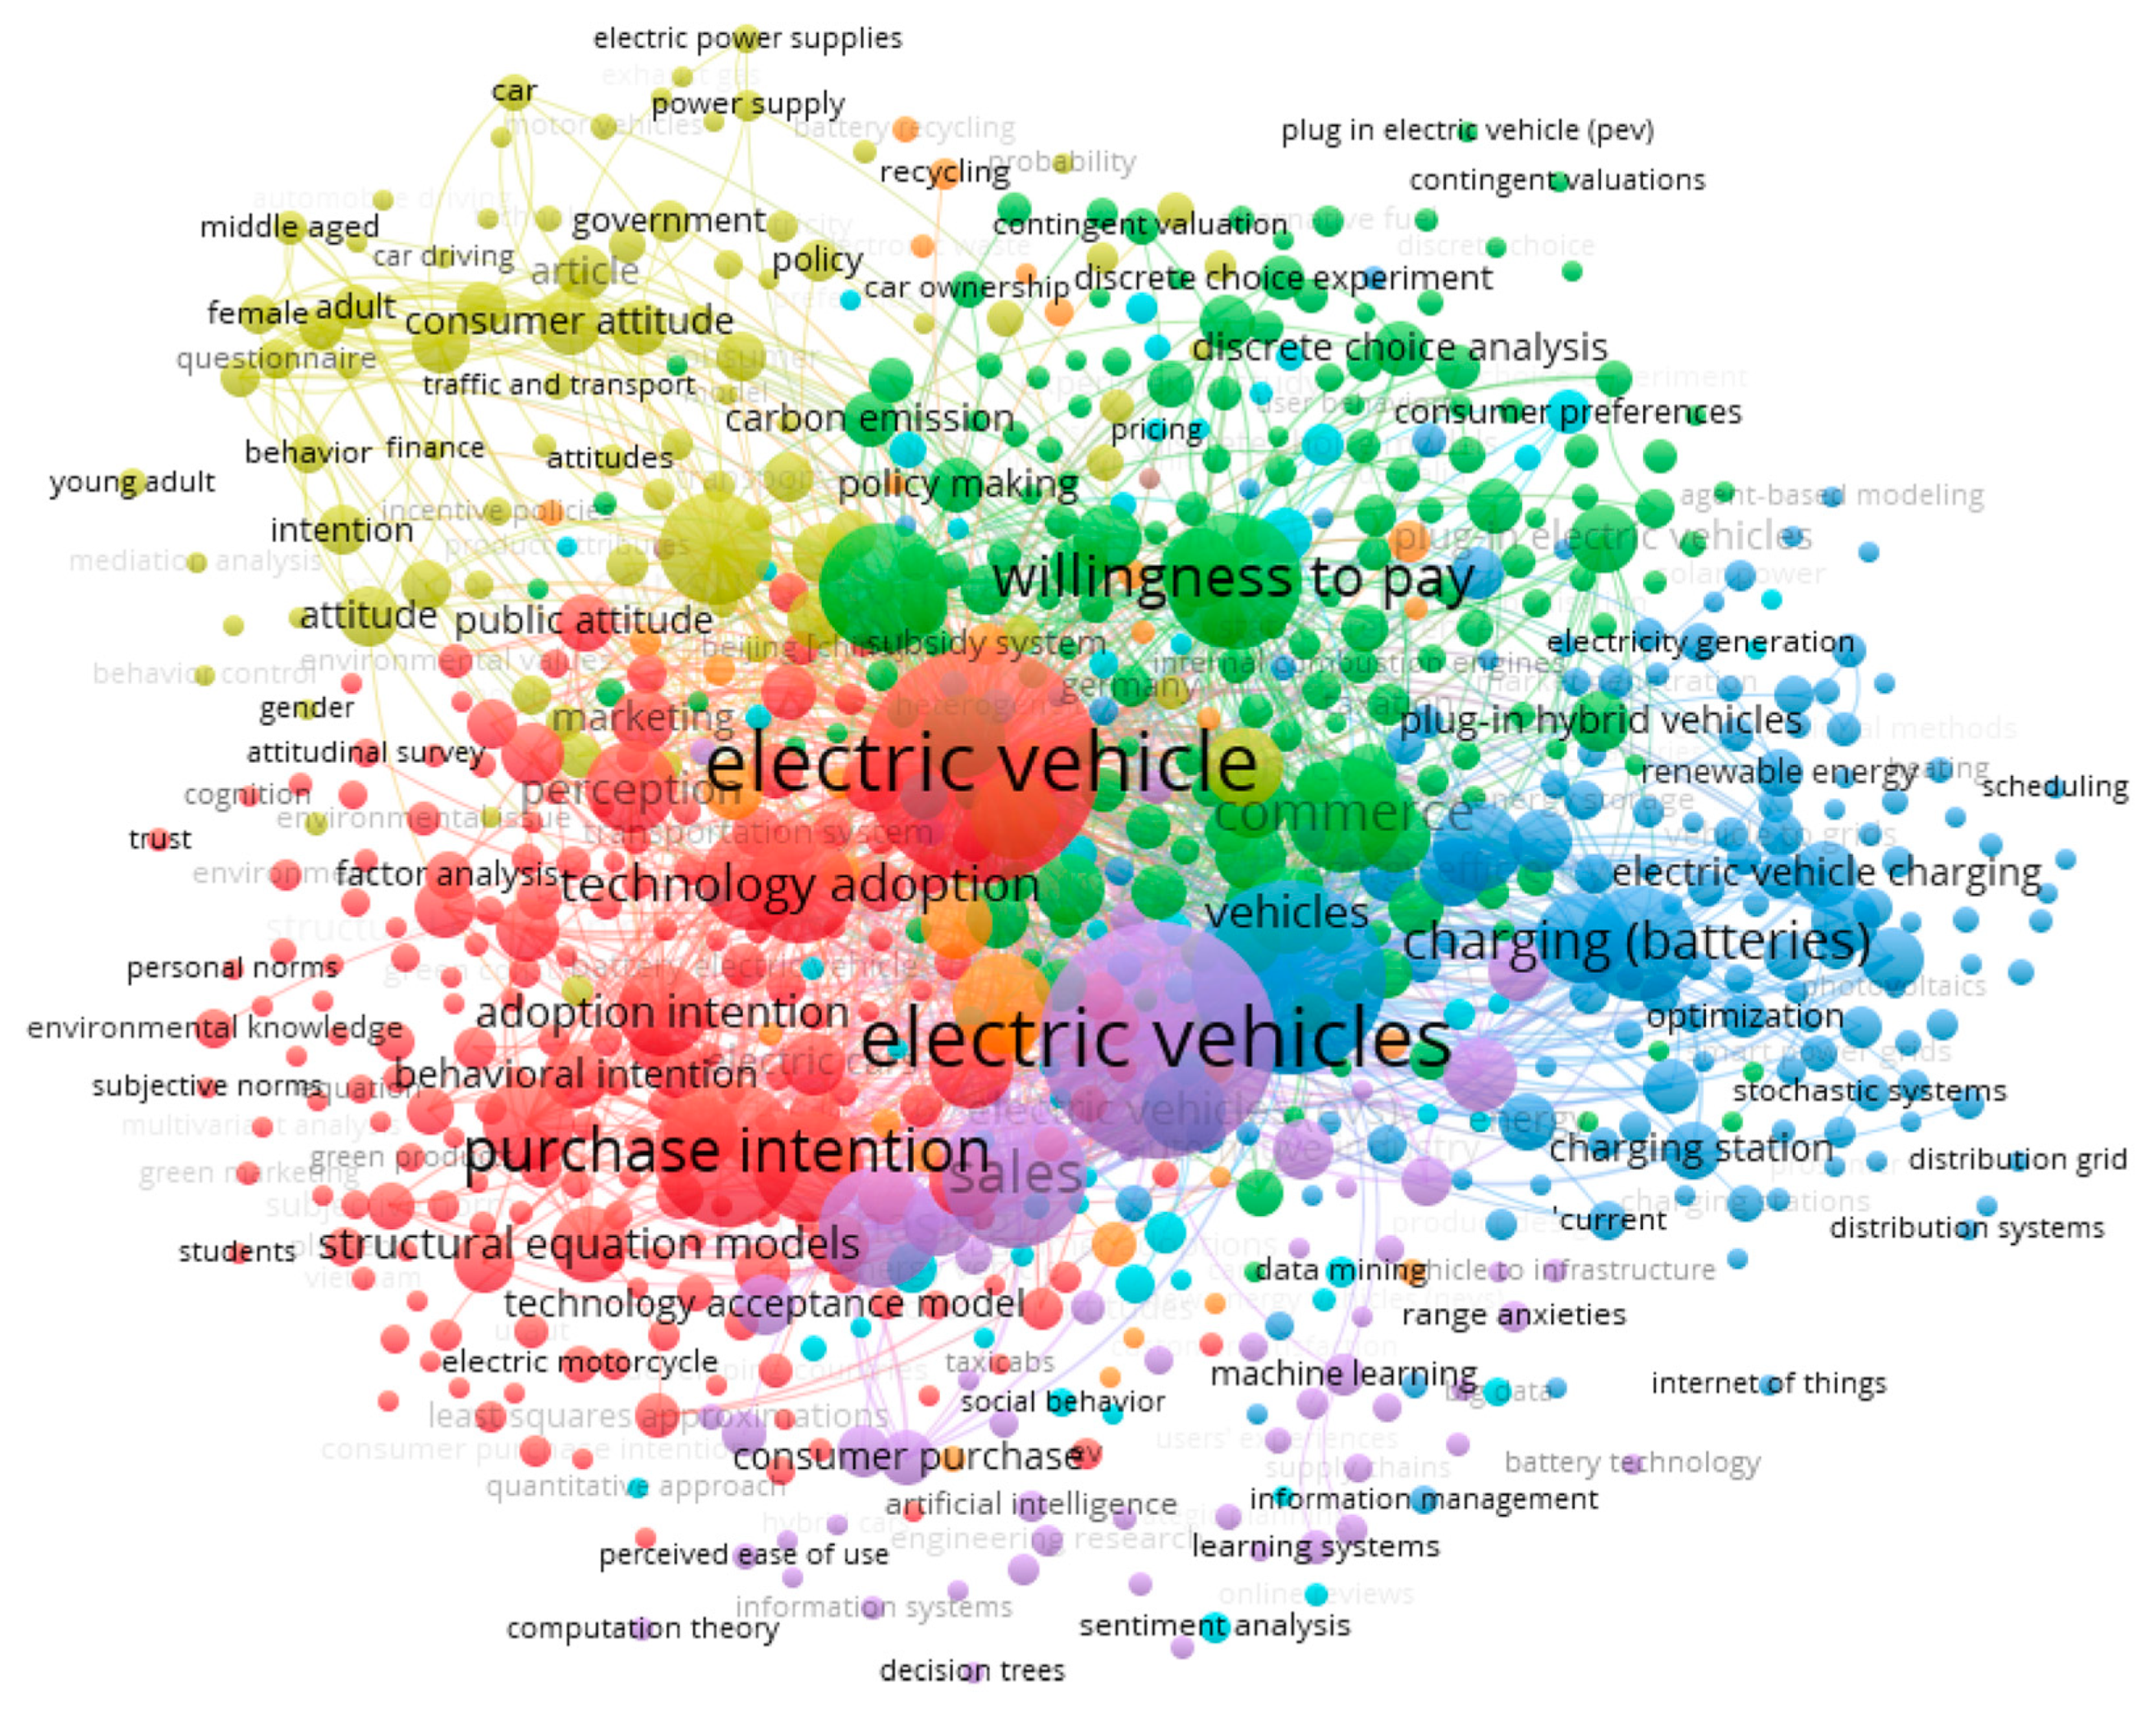
Figure 4.
Co-citation network of cited references (full counting, VOSviewer). Egbue and Long (2012) and Ajzen (1991) occupy bridging positions.
Figure 4.
Co-citation network of cited references (full counting, VOSviewer). Egbue and Long (2012) and Ajzen (1991) occupy bridging positions.
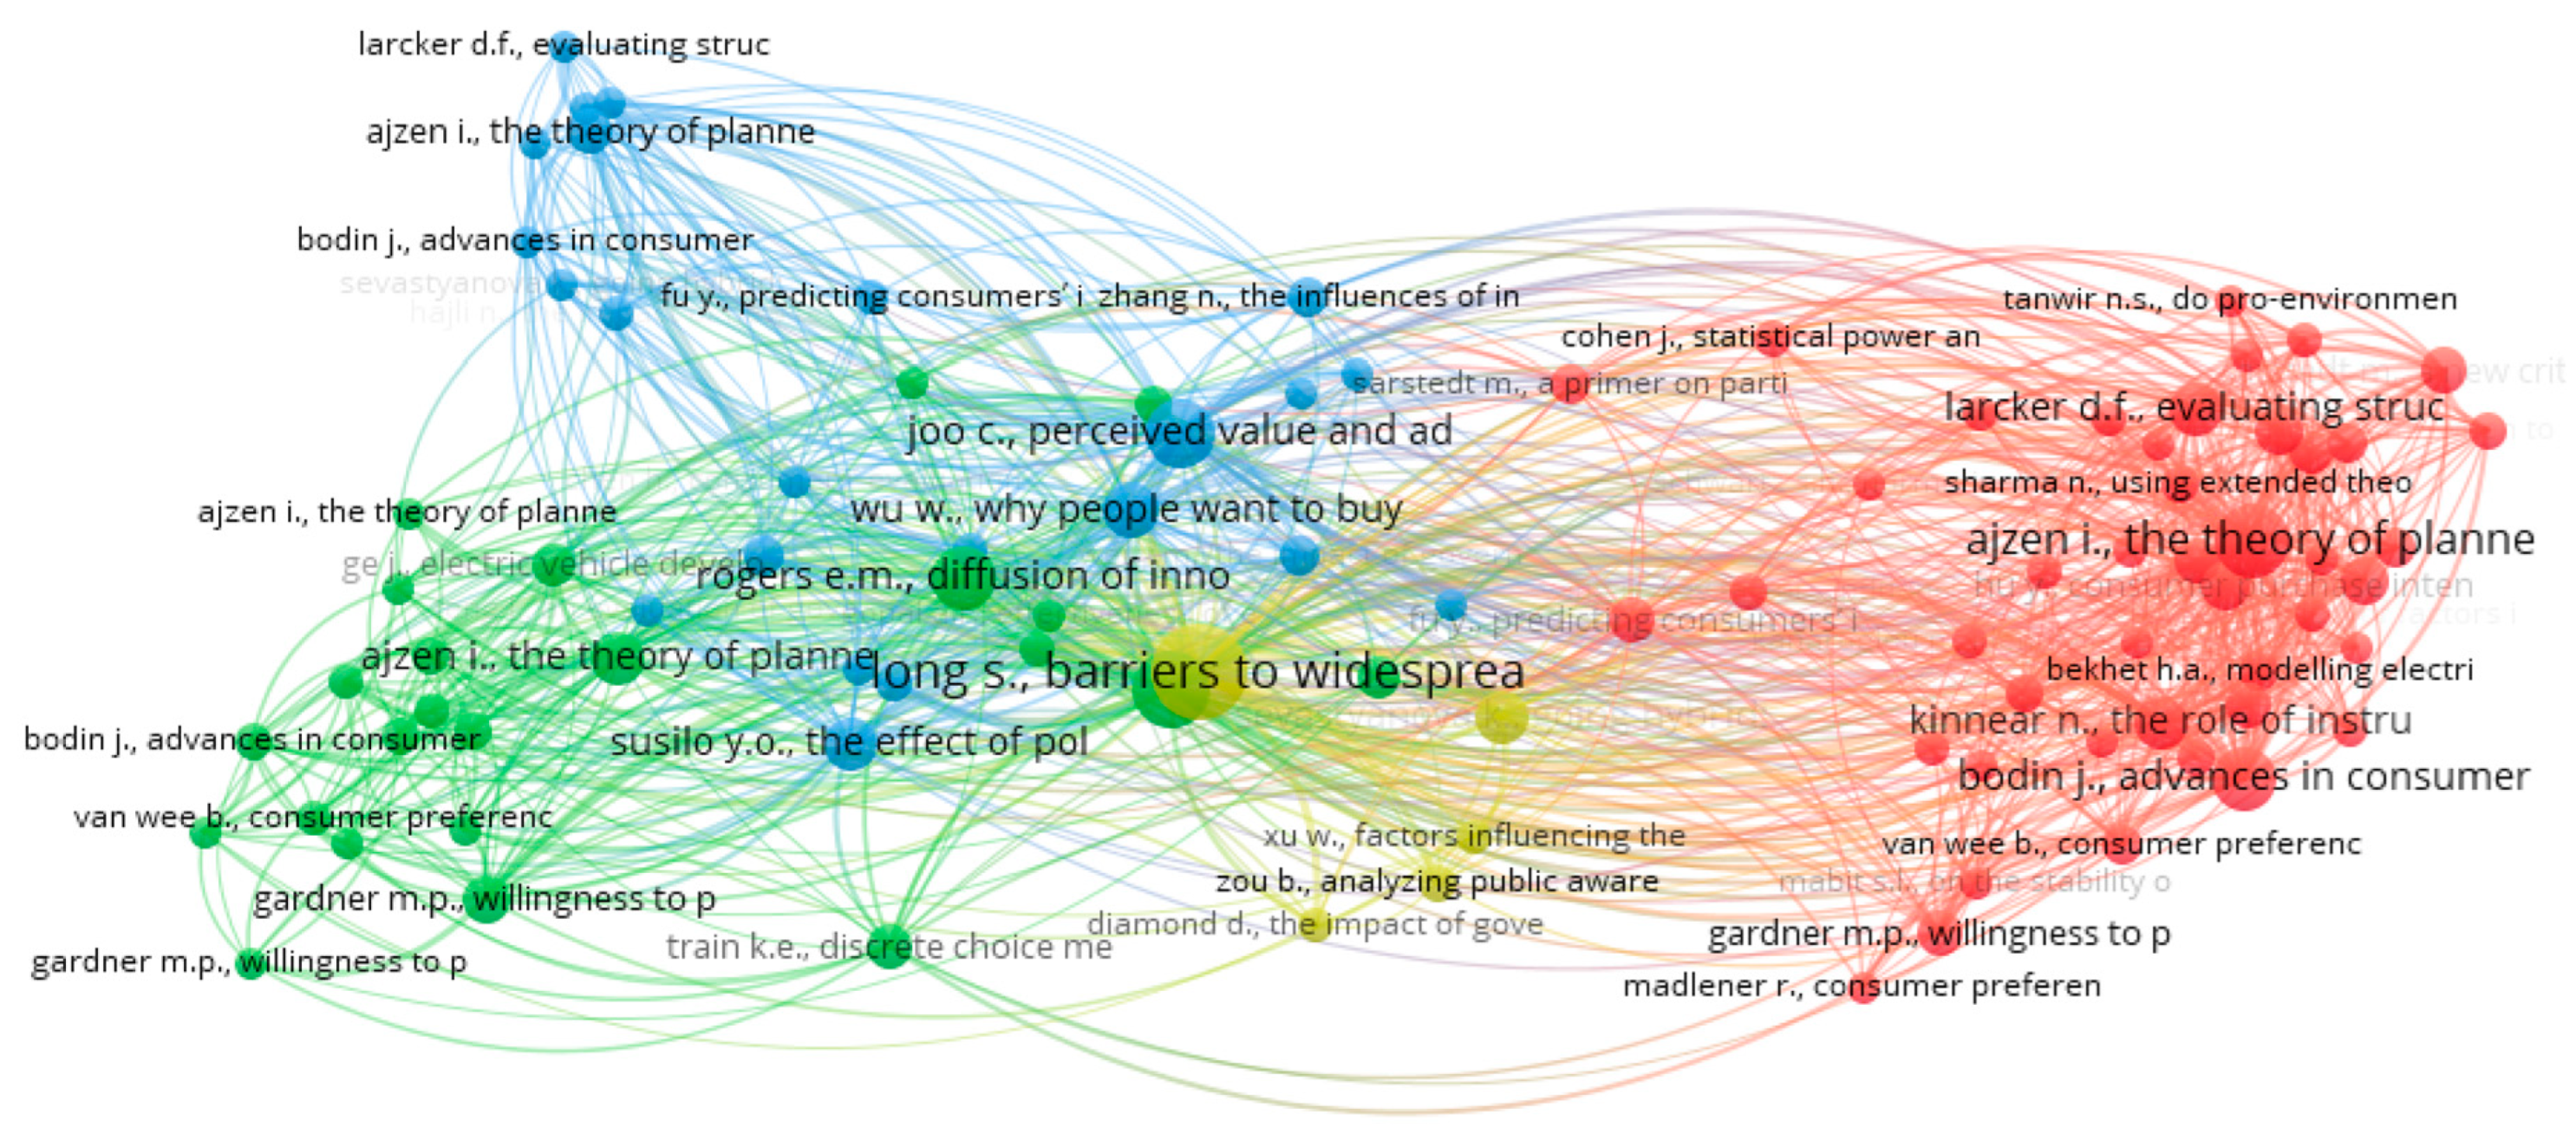
Figure 5.
Bibliographic coupling network of documents (minimum five citations; 820 of 1447 documents). The clusters correspond to the research fronts.
Figure 5.
Bibliographic coupling network of documents (minimum five citations; 820 of 1447 documents). The clusters correspond to the research fronts.
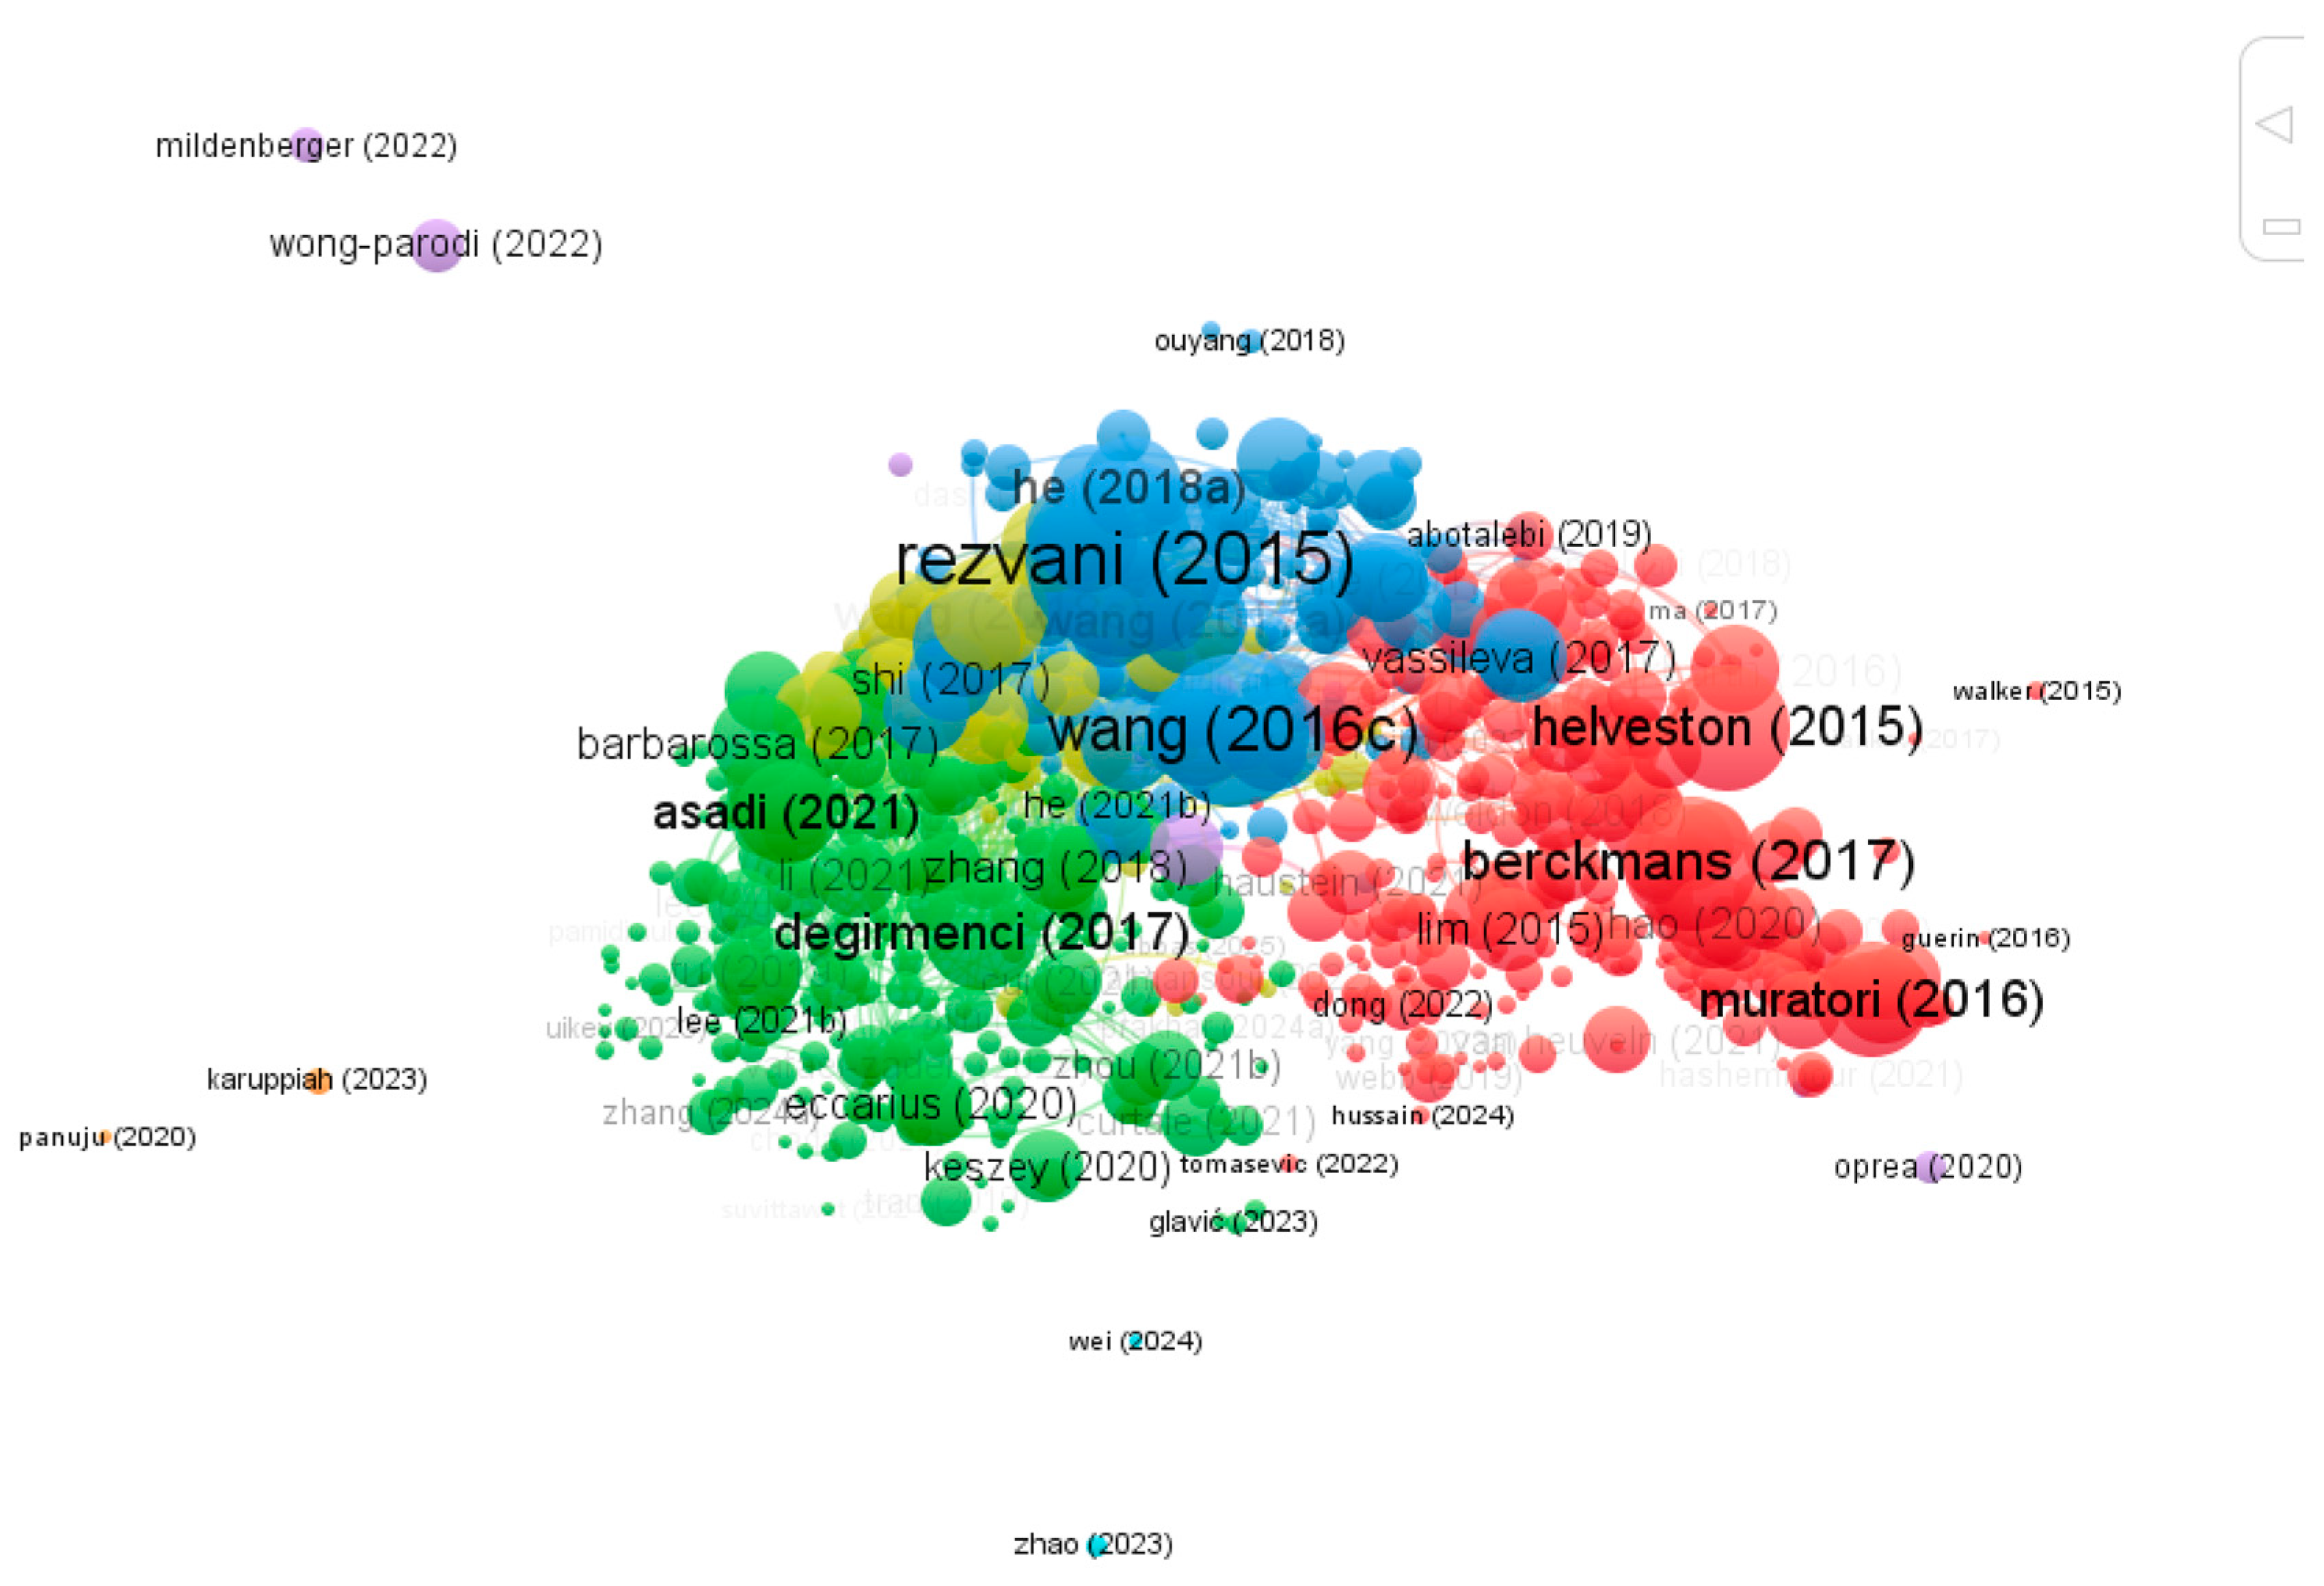
Figure 6.
Citation network of corpus documents, showing the two recent citation hubs around Salari (2022) and Liao (2022).
Figure 6.
Citation network of corpus documents, showing the two recent citation hubs around Salari (2022) and Liao (2022).
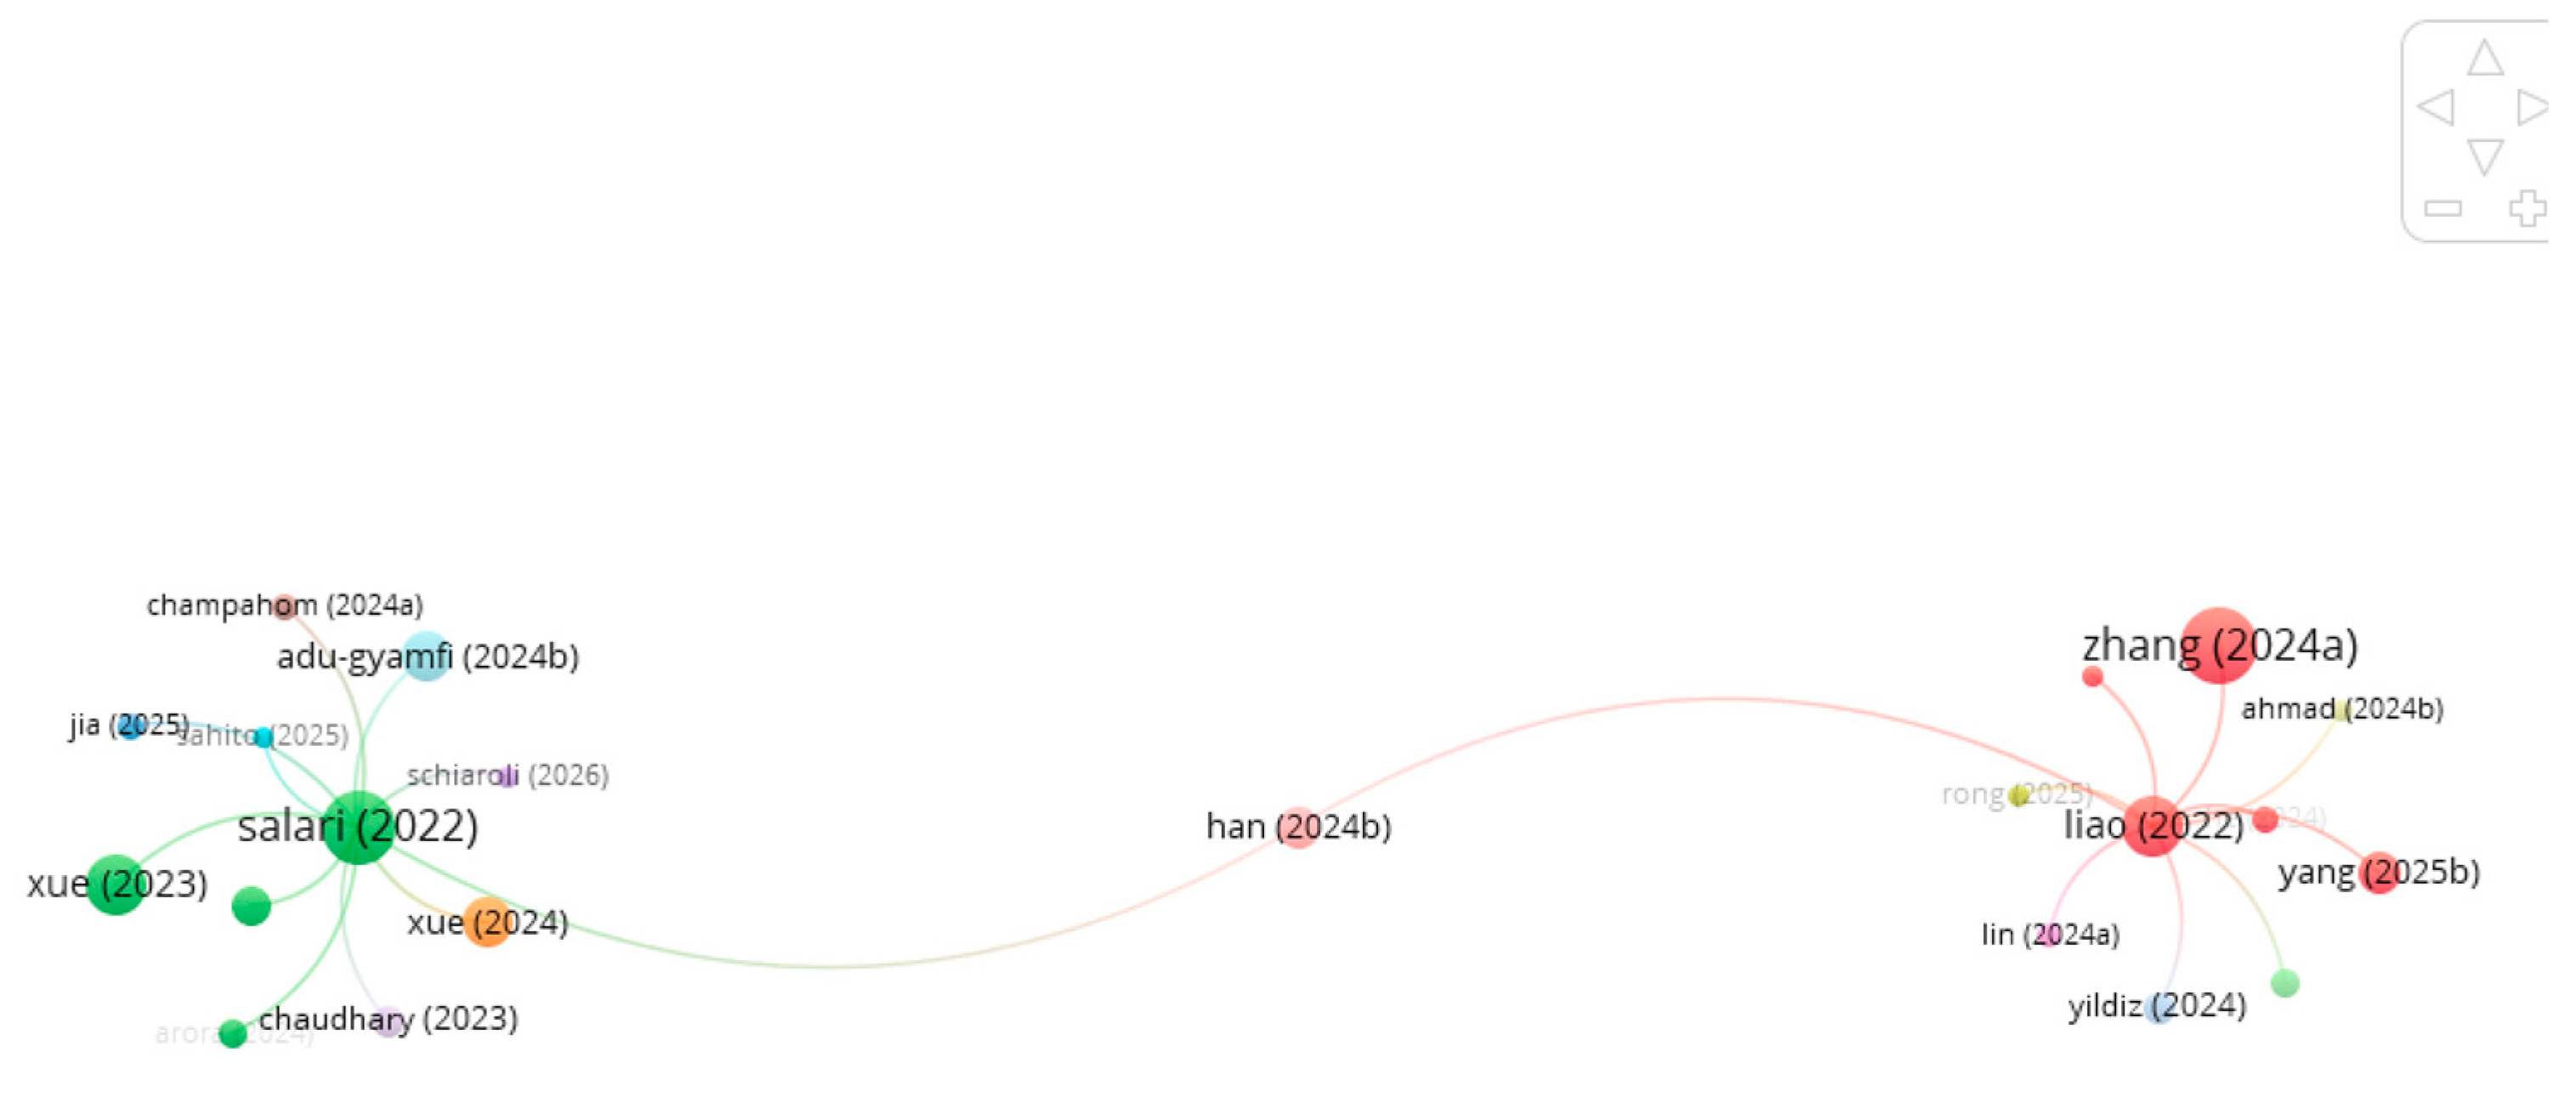
Figure 7.
Largest connected component of the co-authorship network (authors with ≥ 5 documents).
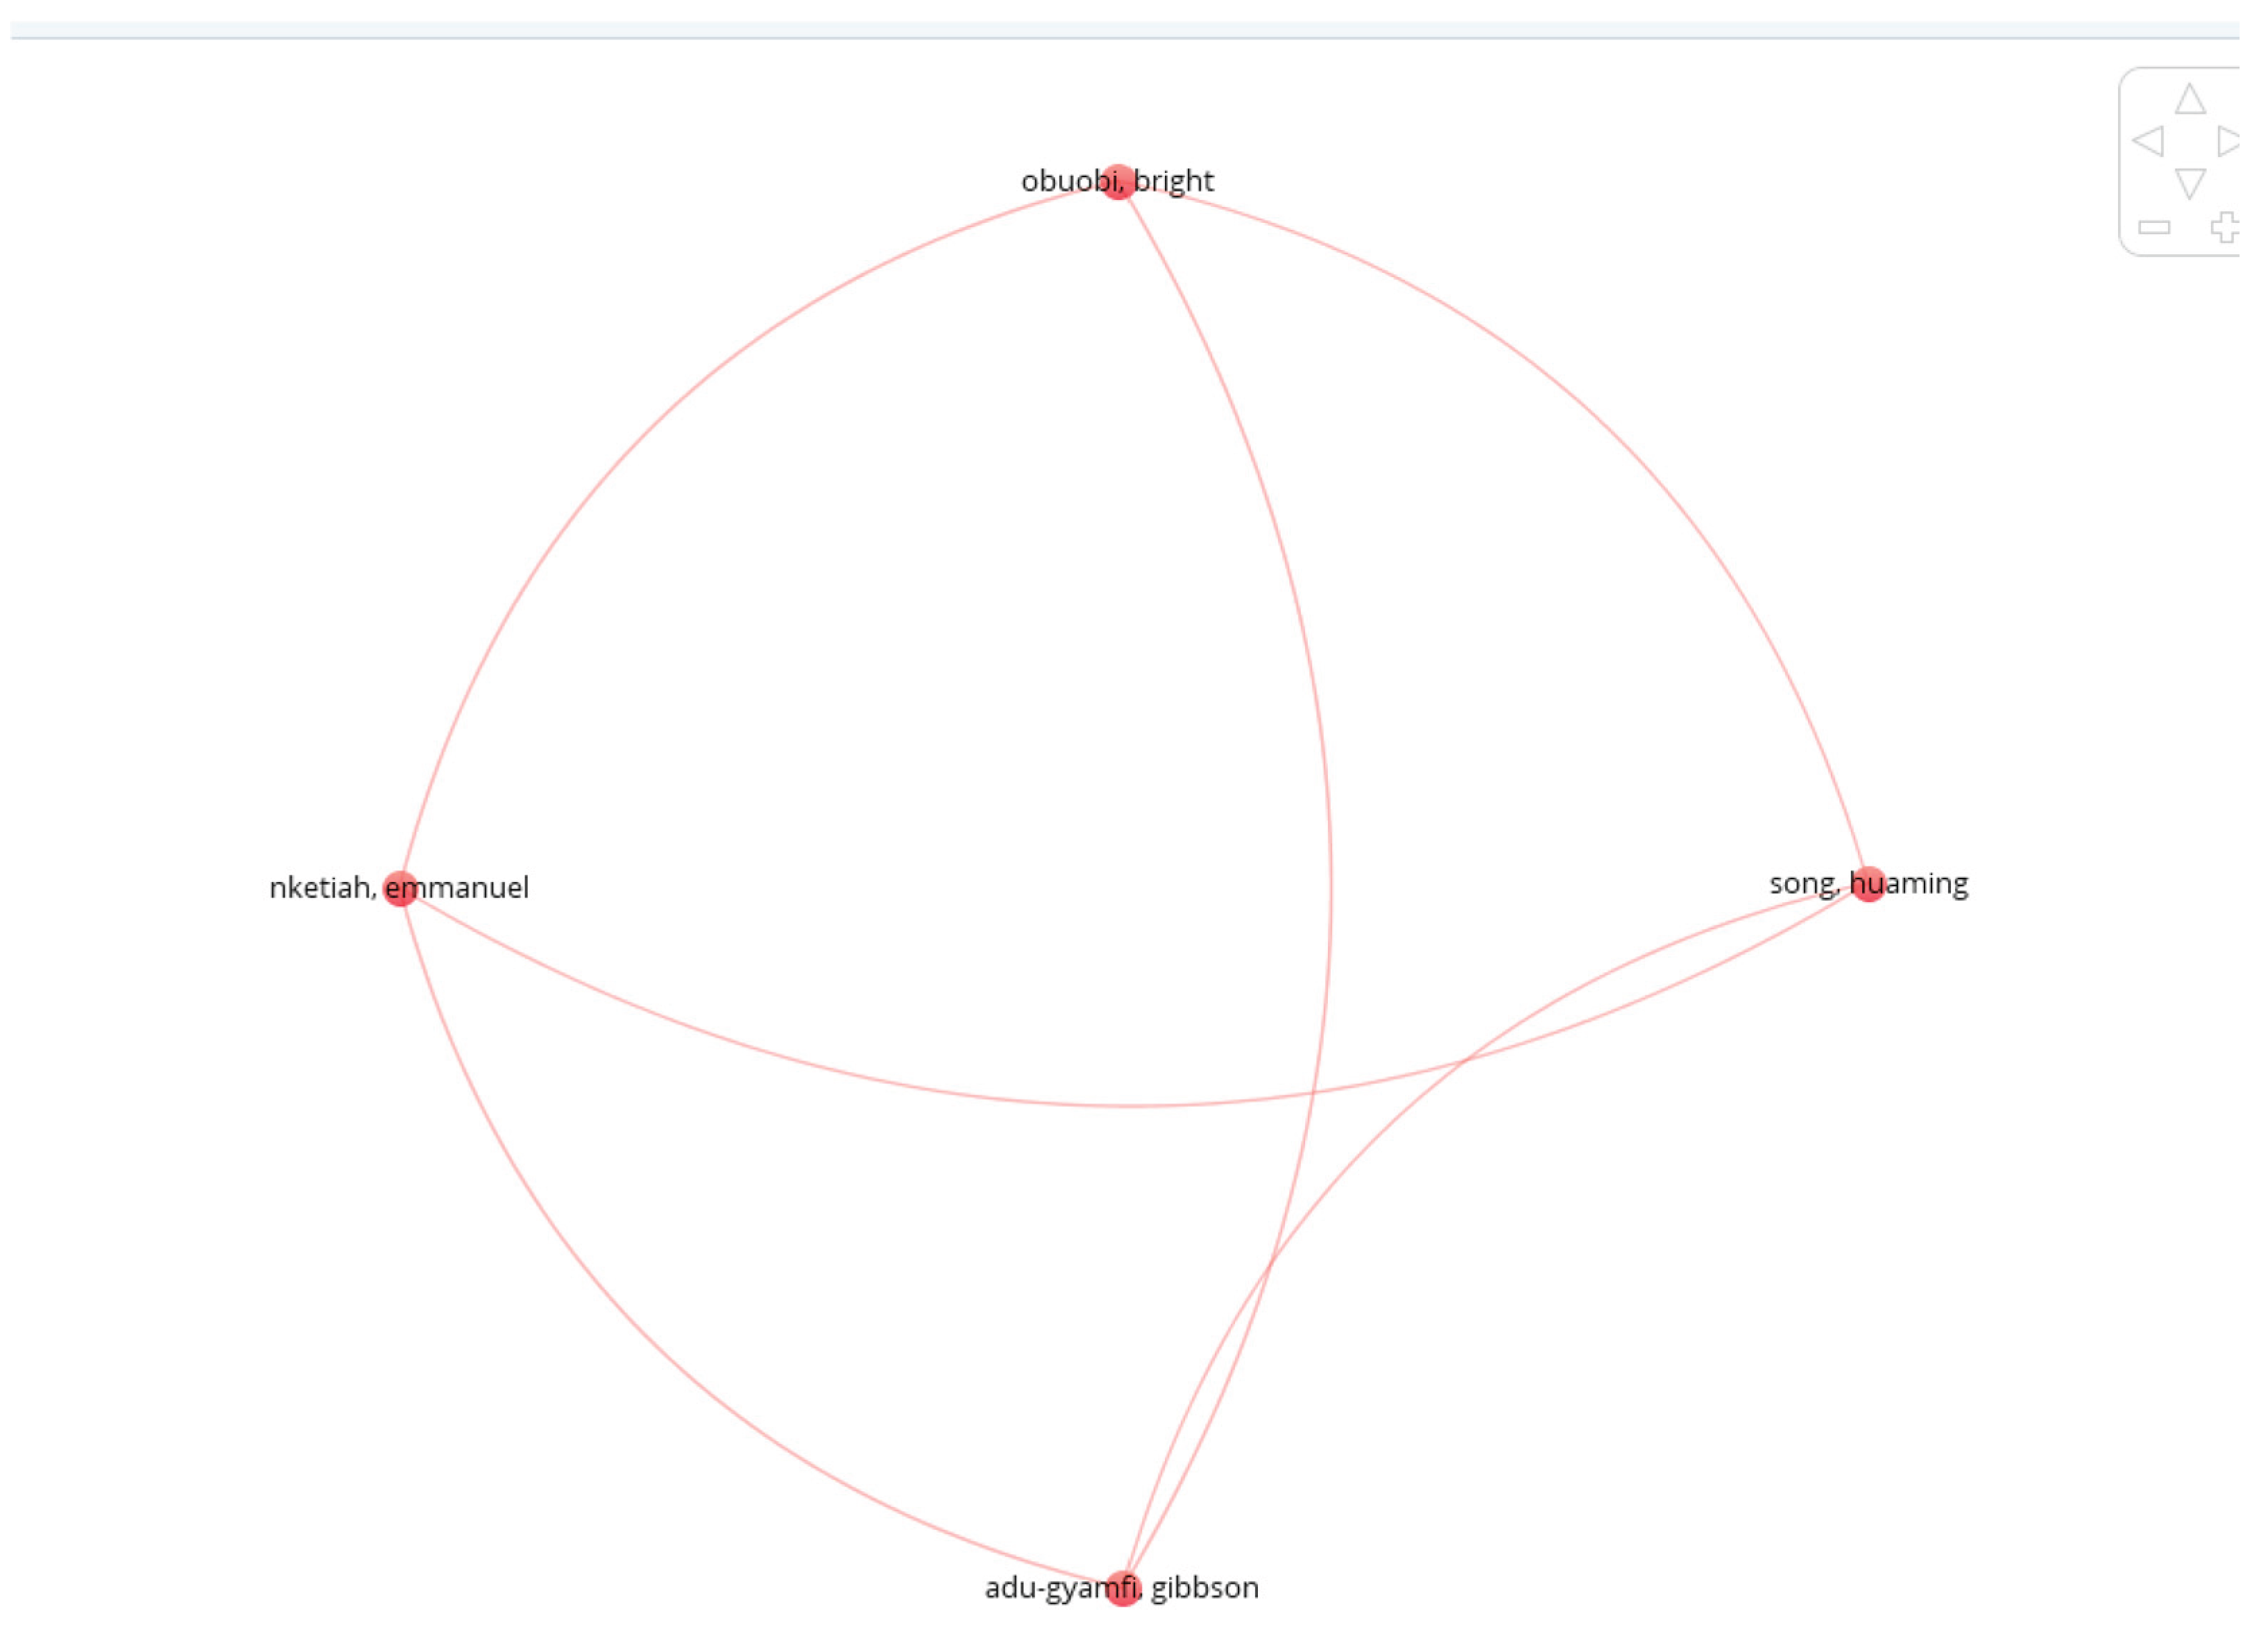

Table 1.
Inclusion and exclusion criteria were applied at the eligibility stage.
| Criterion | Included | Excluded |
| Focus | Consumer purchase/adoption/behavioural intention, willingness to pay, acceptance | Technology performance, life-cycle assessment, charging optimisation, V2G scheduling |
| Vehicle segment | Passenger four-wheelers: BEV, HEV, PHEV, FCEV, other new-energy vehicles | Two- and three-wheelers only; buses, trucks, freight, commercial fleets |
| Unit of analysis | Individual consumers and households | Fleet operators, firms, grid operators |
| Document type | Peer-reviewed journal articles, 2015–June 2026, English | Conference papers (kept for bibliometrics only), editorials, errata |
Table 2.
Ten most productive sources, with total publications (TP), total citations (TC) and citations per publication (C/P).
Table 2.
Ten most productive sources, with total publications (TP), total citations (TC) and citations per publication (C/P).
| Rank | Source | TP | TC | C/P |
| 1 | Sustainability | 80 | 2326 | 29.1 |
| 2 | Transportation Research Part D: Transport and Environment | 67 | 6155 | 91.9 |
| 3 | World Electric Vehicle Journal | 54 | 483 | 8.9 |
| 4 | Transportation Research Part A: Policy and Practice | 54 | 5045 | 93.4 |
| 5 | Energy Policy | 43 | 2873 | 66.8 |
| 6 | Journal of Cleaner Production | 42 | 4051 | 96.5 |
| 7 | Transport Policy | 36 | 987 | 27.4 |
| 8 | Energies | 19 | 877 | 46.2 |
| 9 | Energy | 18 | 1210 | 67.2 |
| 10 | International Journal of Sustainable Transportation | 18 | 551 | 30.6 |
Table 3.
The ten most productive countries (TP = total publications; share of corpus).
| Rank | Country | TP | Share |
| 1 | China | 418 | 28.9% |
| 2 | United States | 183 | 12.7% |
| 3 | India | 179 | 12.4% |
| 4 | United Kingdom | 93 | 6.4% |
| 5 | Malaysia | 78 | 5.4% |
| 6 | Germany | 75 | 5.2% |
| 7 | Indonesia | 65 | 4.5% |
| 8 | South Korea | 63 | 4.4% |
| 9 | Australia | 52 | 3.6% |
| 10 | Thailand | 44 | 3.0% |
Table 4.
Ten most cited documents in the corpus.
| Rank | Study | Year | Source | Citations |
| 1 | Rezvani et al. [7] | 2015 | Transp. Res. Part D | 1106 |
| 2 | Wang et al. [21] | 2016 | Transportation | 677 |
| 3 | Berckmans et al. [31] | 2017 | Energies | 512 |
| 4 | Helveston et al. [29] | 2015 | Transp. Res. Part A | 470 |
| 5 | Wang et al. [24] | 2018 | Transp. Res. Part A | 385 |
| 6 | Muratori and Rizzoni [32] | 2016 | IEEE Trans. Power Syst. | 379 |
| 7 | Degirmenci and Breitner [30] | 2017 | Transp. Res. Part D | 378 |
| 8 | Singh et al. [9] | 2020 | Transp. Res. Part D | 373 |
| 9 | Wang, Li and Zhao [22] | 2017 | Transp. Res. Part A | 344 |
| 10 | Huang and Ge [27] | 2019 | J. Clean. Prod. | 339 |
Note: Citation counts are indexed in Scopus on June 11, 2026.
Table 5.
Most frequent author keywords (occurrences ≥ 40, after harmonizing spelling variants).
| Keyword | Occurrences | Keyword | Occurrences |
| electric vehicle(s) | 556 | new energy vehicles | 82 |
| purchase intention | 160 | willingness to pay | 77 |
| consumer behaviour | 134 | adoption intention | 63 |
| theory of planned behavior | 55 | sustainability | 55 |
| environmental concern | 41 | sustainable transportation | 40 |
Disclaimer/Publisher’s Note: The statements, opinions and data contained in all publications are solely those of the individual author(s) and contributor(s) and not of MDPI and/or the editor(s). MDPI and/or the editor(s) disclaim responsibility for any injury to people or property resulting from any ideas, methods, instructions or products referred to in the content. |
© 2026 by the authors. Licensee MDPI, Basel, Switzerland. This article is an open access article distributed under the terms and conditions of the Creative Commons Attribution (CC BY) license (http://creativecommons.org/licenses/by/4.0/).
Copyright: This open access article is published under a Creative Commons CC BY 4.0 license, which permit the free download, distribution, and reuse, provided that the author and preprint are cited in any reuse.


