

Submitted:
01 July 2026
Posted:
02 July 2026
You are already at the latest version
Abstract
Syntaxin-1 (Stx1), a core neuronal SNARE protein, regulates membrane docking and fusion during neurotransmitter release. Although Stx1 clustering is widely observed at presynaptic active zones and in neuroendocrine cells, how Stx1 isoforms and lipid interactions organize the plasma membrane prior to fusion remains unclear. Here, we performed MARTINI coarse-grained molecular dynamics (cgMD) simulations of 1–10 copies of the juxtamembrane and transmembrane domains (JMD–TMDs) of Stx1A and Stx1B embedded in plasma membrane models to investigate membrane lipid disorder, Stx1 JMD–TMD clustering dynamics, and regulation by Stx1 TMD palmitoylation and phosphatidylinositol 4,5-bisphosphate (PIP2). Stx1 JMD–TMD regions induced local lipid disorder primarily through hydrophobic mismatch, with Stx1A producing stronger and more spatially extended perturbations than Stx1B. The magnitude of local lipid disorder remained largely independent of clustering and TMD palmitoylation, whereas palmitoylation spatially restricted and PIP2 depletion broadened the radial extent of membrane perturbation. Stx1 proteins spontaneously formed protein-density-dependent oligomers, with PIP2 depletion and palmitoylation suppressing higher-order oligomerization. Together, these findings support a model in which hydrophobic mismatch, palmitoylation, and PIP2 cooperatively regulate membrane organization and Stx1 clustering, thereby modulating transitions toward membrane environments permissive for SNARE-mediated fusion.
Keywords:
Syntaxin 1 isoforms
; JMD-TMD clustering
; lipid disorder
; palmitoylation
; PIP2 depletion
; Stx1 JMD-PIP2 sequestration
; membrane fusion
; neurotransmitter release
1. Introduction
Exocytosis, including neurotransmitter release, hormone secretion, and postsynaptic receptor trafficking, is mediated through coordinated membrane docking, priming, and membrane fusion events [1,2]. These processes are essential for maintaining neuronal communication, synaptic plasticity, and endocrine homeostasis [3]. In neurons, membrane fusion is primarily driven by the SNARE machinery, in which Syntaxin-1 (Stx1), a plasma membrane-anchored SNARE protein, interacts with SNAP25 and Synaptobrevin-2 (Syb2) to assemble the SNARE complex under regulation by Munc18 and Munc13 [4,5,6]. Because of its central role in organizing fusion sites, Stx1 contributes to establishment of plasma membrane active zones where vesicle docking and membrane fusion occur [7].
The Stx1 family contains two major neuronal isoforms, Stx1A and Stx1B. Stx1A has been extensively investigated in vitro, in vivo, and in silico and has served as a model system for understanding SNARE-mediated membrane fusion [8,9]. In contrast, Stx1B, although functionally redundant in part, has received substantially less mechanistic investigation despite its important physiological roles. Genetic deletion or knockdown of Stx1B causes reduced spontaneous neurotransmitter release, impaired fast evoked release, and decreased postnatal survival [10,11,12,13,14].
Despite extensive studies on the molecular mechanisms of membrane fusion, how Stx1 isoforms regulate upstream fusion processes such as membrane organization, docking, and SNARE assembly remains incompletely understood. In particular, Stx1 clustering has been observed in multiple experimental studies [7,15,16,17,18,19,20] as well as in an in silico study [21], where cluster formation occurs spontaneously and depends on local Stx concentration. In addition, Stx1A JMD was applied to induce formation of PIP2 domains recruiting Munc13 [22]. However, the functional significance of Stx1 clustering, potentially regulated by polyanionic phosphatidylinositol 4,5-bisphosphate (PIP2) [15,19,20,23], remains controversial. Some studies suggest that Stx1 clustering promotes vesicle docking and membrane fusion by organizing active membrane domains [16,19,20], whereas others propose that Stx1 clusters function as reservoir-like assemblies from which Stx molecules dissociate during SNARE complex assembly [15,23].
More recently, a hypothesis proposed by the Josep Rizo laboratory suggested that the JMD–TMD regions of Syb2 and Stx1 may facilitate membrane fusion through detergent-like membrane perturbation effects [24,25]. In this model, local membrane disorder induced by SNARE transmembrane regions promotes transient exposure of hydrophobic lipid tails to the surrounding environment, thereby facilitating hydrophobic contacts between opposing membranes and promoting stalk formation during fusion initiation. Consistent with this idea, previous studies have shown that hydrophobic mismatch between transmembrane domains and lipid bilayers can induce local membrane disorder [26], and computational studies further suggest that transmembrane-domain-induced membrane thinning lowers the energetic barrier for membrane fusion [27]. Together, these observations raise the possibility that local membrane disorder generated by SNARE transmembrane regions may contribute directly to membrane fusion initiation.
To investigate how Stx1 isoforms regulate membrane disorder and clustering behavior, and to examine how Stx1 TMD palmitoylation and PIP2 presence modulate these processes, we performed MARTINI cgMD simulations using systems containing 1, 2, 4, 6, 8, or 10 copies of the Stx1A or Stx1B JMD–TMD region embedded in a ~20 × 20 nm² plasma membrane containing ~1,500 lipids. To specifically investigate membrane organization mediated by the JMD–TMD region, the SNARE domain (SND) and Habc domain were excluded to reduce system complexity.
Our simulations revealed Stx1 JMD–TMD regions induce local membrane lipid disorder primarily through hydrophobic mismatch, with Stx1A generating stronger and more spatially extended membrane perturbations than Stx1B. The magnitude of local lipid disorder remained largely independent of palmitoylation, and PIP2 depletion. Stx1 proteins spontaneously formed oligomeric assemblies once sufficient protein density was reached, with clustering behavior regulated by both PIP2 presence and palmitoylation. Presence of PIP2 promoted clustering and palmitoylation suppressed higher-order oligomerization. Stx1B further exhibited a modestly greater propensity for oligomerization than Stx1A. Together, these findings support a unified framework in which hydrophobic mismatch, palmitoylation, and electrostatic lipid interactions cooperatively regulate membrane organization, Stx1 clustering dynamics, and transitions between reservoir-like assemblies and fusion-competent SNARE states during membrane fusion.
2. Results
2.1. Stx1 Induces Local Lipid Disorder
To investigate whether the Stx1 JMD–TMD region induces local lipid disorder relative to distal bulk membrane lipids, we constructed simulation systems containing a single Stx1A or Stx1B JMD–TMD embedded in a ~20 × 20 nm² plasma membrane containing ~1,500 lipids (Figure 1a). For each system, n = 10 independent simulations of 2 μs duration were performed to ensure robust statistical sampling. Additional details regarding system construction and simulation protocols are provided in the Materials and Methods section.
To quantify lipid ordering, we used the lipid order parameter as
where 〈 〉 denotes averaging over all selected lipids, and is the angle between the lipid hydrophobic vectors formed by the second and third lipid beads for phospholipids (marked by the purple arrow and green arrow for the two hydrophobic tails, respectively, in Figure 1a, left) and the membrane normal (z-axis) for every selected lipid. [21]. For cholesterol a similar definition was used but the lipid hydrophobic vector was defined by connecting the R5 and ROH beads for cholesterols (the blue arrow in Figure 1a).
Stx1-bound lipids were defined using a cutoff distance of nm at time , whereas all lipids in the membrane were included to calculate the bulk lipid order parameter. Similarly, the Stx1 TMD tilting order parameter was calculated from the angle between the membrane normal and the vector fitted to the backbone beads of the Stx1 TMD.
Higher S2 values indicate more ordered and tightly packed lipid or TMD conformations, whereas lower S2 values indicate increased tilting away from the membrane normal and greater exposure of hydrophobic regions to the surrounding environment.
The averaged trajectories from the n = 10 simulations showed no systematic temporal drift in either local or global lipid ordering parameters or in the Stx1 TMD tilting order parameter (Figure 1b), indicating that the systems were well equilibrated preceding the production simulations.
Analysis of the final averaged lipid ordering parameters (Figure 1c, Table S1) revealed that lipids bound to Stx1 were substantially more disordered than bulk membrane lipids (0.314 ± 0.011 vs. 0.435 ± 0.001 for Stx1A and 0.357 ± 0.013 vs. 0.437 ± 0.001 for Stx1B; both p < 0.0002 from paired t-test). In contrast, no significant differences were observed between the bulk lipid order parameters and the Stx1A/Stx1B TMD tilting order parameters, indicating that Stx1A and Stx1B primarily induce localized lipid disorder without substantially altering global membrane ordering.
Importantly, lipids surrounding Stx1A were significantly more disordered than those surrounding Stx1B, with a ~ 1.137 ± 0.057-fold reduction in the local lipid order parameter (p < 0.05, Mann–Whitney U test). Then we estimated the tilting order parameters as equation 2 in method section and found that Stx1A and Stx1B exhibited similar TMD tilting order parameters. So the stronger lipid disordering induced by Stx1A is unlikely to result from differences in TMD tilting dynamics. For further details, please see Table S1.
Instead, the enhanced lipid disordering induced by Stx1A likely arises from a larger hydrophobic mismatch between the Stx1A TMD and the plasma membrane, whereas Stx1B contains an additional C-terminal residue (L288) that may reduce this mismatch. Consistent with this interpretation, radial analyses of lipid ordering revealed that lipid order parameters approached bulk membrane values (less than 5% related decrease) only at distances greater than ~2.7 nm from the Stx1A JMD–TMD, whereas this recovery occurred at ~1.4 nm for Stx1B (Figure 1d). For more information, please see Table S2.
These observations were further supported by log2(Fold change) related to the bulk membrane value as a function of ranges of radial distances (Figure 1e). Together, these results indicate that increased TMD–membrane hydrophobic mismatch promotes both stronger and longer-range lipid disorder surrounding the Stx1 JMD–TMD region. For more information, please see Table S3.
2.2. Palmitoylation Spatially Restricts Lipid Disorder Whereas PIP2 Depletion Broadens the Radial Range of Membrane Perturbation
Stx1 palmitoylation has been implicated in spontaneous neurotransmitter release [28] whereas PIP2 interactions are known to regulate Ca²⁺-dependent membrane fusion [29]. To investigate whether these factors influence Stx1-induced membrane disorder, we analyzed local lipid order parameters and Stx1 TMD tilting order parameters in single-copy Stx1A and Stx1B systems. Neither palmitoylation nor PIP2 depletion significantly altered local lipid order parameters or TMD tilting order parameters (Figure 2a, b; all p > 0.05). These observations further support the notion that local membrane disorder primarily arises from hydrophobic mismatch between the Stx1 TMD and the hydrophobic core of the plasma membrane.
To further characterize the spatial extent of membrane perturbation, we analyzed the log2(fold change) of local lipid order parameters relative to bulk membrane values as a function of radial distance from the Stx1 JMD–TMD region.
For single-copy Stx1A systems, palmitoylation reduced the fold change of the lipid disorder from up to ~3.8 nm away from the Stx1A JMD–TMD, whereas PIP2 depletion did not alter the radial extent of the lipid disorder region (Figure 2C, top). These observations suggest that palmitoylation spatially confines membrane perturbations, whereas PIP2 depletion weakens membrane packing and allows lipid disorder to propagate over longer distances from the Stx1A JMD–TMD region.
For single-copy Stx1B systems, palmitoylation produced little effect on the radial extent of lipid disorder, whereas PIP2 depletion expanded the extent of relative disordering range to ~3.2 nm (Figure 2C, bottom).
Together, these results indicate that neither palmitoylation nor PIP2 depletion substantially altering the magnitude of local lipid disorder. However, palmitoylation restricts the spatial extent of Stx1A lipid disorder region but not Stx1B, whereas PIP2 depletion expands the extent of lipid disorder region around Stx1B but not Stx1A, indicating that the alteration of the extent of Stx1 lipid disorder region by palmitoylation and PIP2 depletion is isoform specific.
2.3. Multiple Copies of Stx1 JMD–TMD Spontaneously Form Clusters
Next, we investigated whether multiple copies of the Stx1 JMD–TMD region spontaneously cluster within the plasma membrane, potentially generating local Stx reservoirs prior to SNARE complex assembly and membrane docking.
To examine clustering behavior at different protein concentrations, systems containing 2, 4, 6, 8, or 10 copies of Stx1 JMD–TMD were embedded in ~20 × 20 nm² plasma membranes (Figure 3a). Representative clustering dynamics from a simulation containing 10 copies of Stx1A are shown in Figure 3b. Clusters were defined as connected groups of Stx1 JMD–TMD molecules whose minimum backbone pairwise distances were ≤1.0 nm.
Small oligomers formed rapidly after the start of the simulations (Figure 3b). Dimers and trimers appeared within tens of nanoseconds and subsequently associated into larger oligomeric assemblies. However, cluster formation was highly dynamic, with repeated association and dissociation events occurring throughout the trajectory. Intermediate-sized oligomers frequently merged, separated, and reorganized before eventually forming larger assemblies. After prolonged sampling, oligomers containing all 10 Stx1A molecules were occasionally observed and ultimately became stabilized near the end of the simulation.
These observations suggest that Stx1 JMD–TMD clustering is reversible and hierarchical, proceeding from monomers to dimers and trimers, followed by assembly into intermediate-sized oligomers and, under sufficiently high protein density, larger cluster states, consistent with ref. [7].
This behavior is consistent with the time courses of the fraction of Stx1 JMD–TMD molecules participating in clusters, , the maximum cluster size, , and the mean cluster size, (Figure 3c). The fraction of Stx1 molecules participating in clusters increased rapidly and reached high values within approximately 100 ns (Figure 3c, left), indicating rapid formation of low-order oligomers. In contrast, larger oligomers formed more slowly and exhibited substantial fluctuations over time, as reflected by the intermittent trajectories of the maximum and mean cluster sizes (Figure 3c, middle and right). These fluctuations indicate continual association and dissociation of higher-order oligomers. Large oligomeric assemblies became increasingly visible after approximately 1.5 μs, suggesting that formation of extensive Stx1 clusters occurs through progressive hierarchical assembly rather than direct aggregation of isolated monomers.
2.4. Stx1 JMD–TMD Clustering Increases with Protein Concentration
We next examined how Stx1 JMD–TMD clustering depends on protein concentration. Average trajectories of the fraction of Stx1 molecules participating in clusters , the maximum cluster size , and the mean cluster size , revealed progressive hierarchical assembly for both Stx1A and Stx1B (Figure 4a).
Stable dimers were rarely observed in systems containing only two copies of Stx1 JMD–TMD. In contrast, systems containing at least four copies rapidly formed dimers and trimers within the first few hundred nanoseconds, followed by slower growth into larger oligomeric assemblies. Consistent with the representative trajectory shown in Figure 3, cluster growth exhibited two distinct phases: a rapid initial assembly phase dominated by low-order oligomers and a slower maturation phase characterized by association and reorganization of pre-existing clusters. Increasing Stx1 copy number accelerated cluster formation and promoted the emergence of larger oligomeric assemblies.
Quantitative analysis of the final 100 ns of the simulations demonstrated a strong protein-concentration dependence of clustering (Figure 4b). For Stx1A, the fraction of molecules participating in clusters increased progressively with copy number, reaching 91.3% ± 3.1% at 10 copies of Stx1A. Similar behavior was observed for Stx1B (93.5% ± 1.8%). The maximum cluster size and mean cluster size also increased with increasing protein concentration for both isoforms, indicating progressive assembly of larger oligomeric states at higher membrane densities. There were no significant differences in oligomerization between Stx1A and Stx1B (Figure S1).
Together, these results indicate that Stx1 JMD–TMD oligomerization is strongly dependent on protein concentration and proceeds through progressive hierarchical assembly of increasingly larger oligomeric states. Protein concentration appears to be the primary determinant of clustering behavior, whereas isoform-specific differences are comparatively modest, if any.
2.5. Palmitoylation and PIP2 Depletion Suppress Higher-Order Oligomerization More Strongly in Stx1A than in Stx1B
Next, we investigated how TMD palmitoylation and membrane PIP2 regulate Stx1 JMD–TMD clustering. Representative simulations containing 10 copies of Stx1A revealed that both palmitoylation and PIP2 depletion suppressed formation of large oligomeric assemblies (Figure 5a, movie S3-S4). In the palmitoylated system, a trimer and two dimers were observed near the end of the simulation, whereas only two dimers remained in the PIP2-depleted membrane. These observations suggest that both perturbations inhibit higher-order oligomerization, with PIP2 depletion producing the stronger effect.
This behavior was consistent with the average clustering trajectories (Figure 5b and Figure S2a). In palmitoylated Stx1A systems, rapid formation of low-order oligomers was preserved, but subsequent growth into larger assemblies was attenuated. In contrast, PIP2 depletion largely abolished the slow-growth phase associated with maturation of higher-order oligomers, indicating a stronger suppression of cluster expansion.
Quantitative analysis of the final 100 ns of the simulations confirmed these observations (Figure 5c). Palmitoylation significantly reduced the mean cluster size at 8 and 10 copies of Stx1A and decreased both clustering fraction and maximum cluster size at 8 copies. However, little effect was observed at ≤6 copies, suggesting that palmitoylation primarily suppresses assembly of higher-order oligomers rather than formation of dimers and trimers.
PIP2 depletion produced a substantially stronger phenotype. Significant reductions in clustering fraction, maximum cluster size, and mean cluster size were observed once systems contained at least six copies of Stx1A. At 10 copies, the maximum cluster size was reduced to approximately three molecules, indicating that formation of oligomers larger than trimers was strongly inhibited in the absence of PIP2.
Protein-concentration-dependent analysis further revealed that the suppressive effects of both palmitoylation and PIP2 depletion could be partially overcome at high Stx1A concentrations (Figure S2b), indicating that increased local protein density promotes clustering even under conditions unfavorable for oligomerization.
In contrast, Stx1B exhibited substantially greater resistance to both perturbations (Figure 5d and Figure S2c). Palmitoylation produced little reduction in clustering fraction or maximum cluster size and only decreased mean cluster size at 10 copies. PIP2 depletion significantly reduced clustering metrics only at selected protein concentrations, while clustering behavior at 8 copies remained largely comparable to that of wild-type Stx1B. Notably, clustering properties of Stx1B approached saturation at 8 copies, whereas Stx1A continued to increase between 8 and 10 copies.
Together, these results indicate that both palmitoylation and PIP2 depletion suppress formation of higher-order Stx1 oligomers, but these effects are substantially stronger for Stx1A than for Stx1B. The enhanced resistance of Stx1B to oligomerization suppression may reflect intrinsic differences in the C-terminal region of the transmembrane domain and suggests isoform-specific regulation of membrane organization.
2.6. Multiple Copies of Stx1 Do Not Substantially Alter Local Lipid Disorder Induced by Individual JMD–TMD Regions
Finally, we investigated whether increasing Stx1 JMD–TMD copy number alters the magnitude of local membrane disorder generated by individual proteins. Because Stx1 fragments spontaneously formed oligomeric assemblies at higher protein densities, we asked whether clustering itself modifies local membrane organization or TMD dynamics.
To address this question, we repeated the analyses of local lipid order parameters and Stx1 TMD tilting order parameters for systems containing 1–10 copies of Stx1A or Stx1B (Figure 6a, b; Table S1). Despite pronounced differences in clustering behavior across protein concentrations (Figure 3, Figure 4 and Figure 5), both the local lipid order parameter and the Stx1 TMD tilting order parameter remained largely unchanged with increasing Stx1 copy number. Although several pairwise comparisons reached statistical significance, the corresponding changes in local lipid disorder were very small (generally <10%). Consistent with this observation, Kruskal–Wallis tests detected no significant overall effect of copy number on local lipid disorder for either Stx1A or Stx1B (p = 0.196 and p = 0.220, respectively). Likewise, no overall copy-number dependence was observed for Stx1 TMD tilting disorder (Figure 6b).
A similar pattern was observed in palmitoylated and PIP2-depleted systems (Figure S3). In PIP2-depleted Stx1A membranes, modest fluctuations in local lipid order parameters (~10%) were observed across copy numbers, whereas TMD tilting remained unchanged. However, these variations were substantially smaller than the differences observed between Stx1 isoforms and did not exhibit a monotonic dependence on protein concentration.
Together, these results indicate that Stx1 clustering does not substantially alter the magnitude of local membrane disorder generated by individual JMD–TMD regions. Instead, local lipid disorder appears to be an intrinsic property of the Stx1 JMD–TMD region that remains largely robust to changes in protein density, palmitoylation state, and clustering behavior.
2.7. Clustering Promotes Spatial Overlap of Local Membrane Perturbation Fields
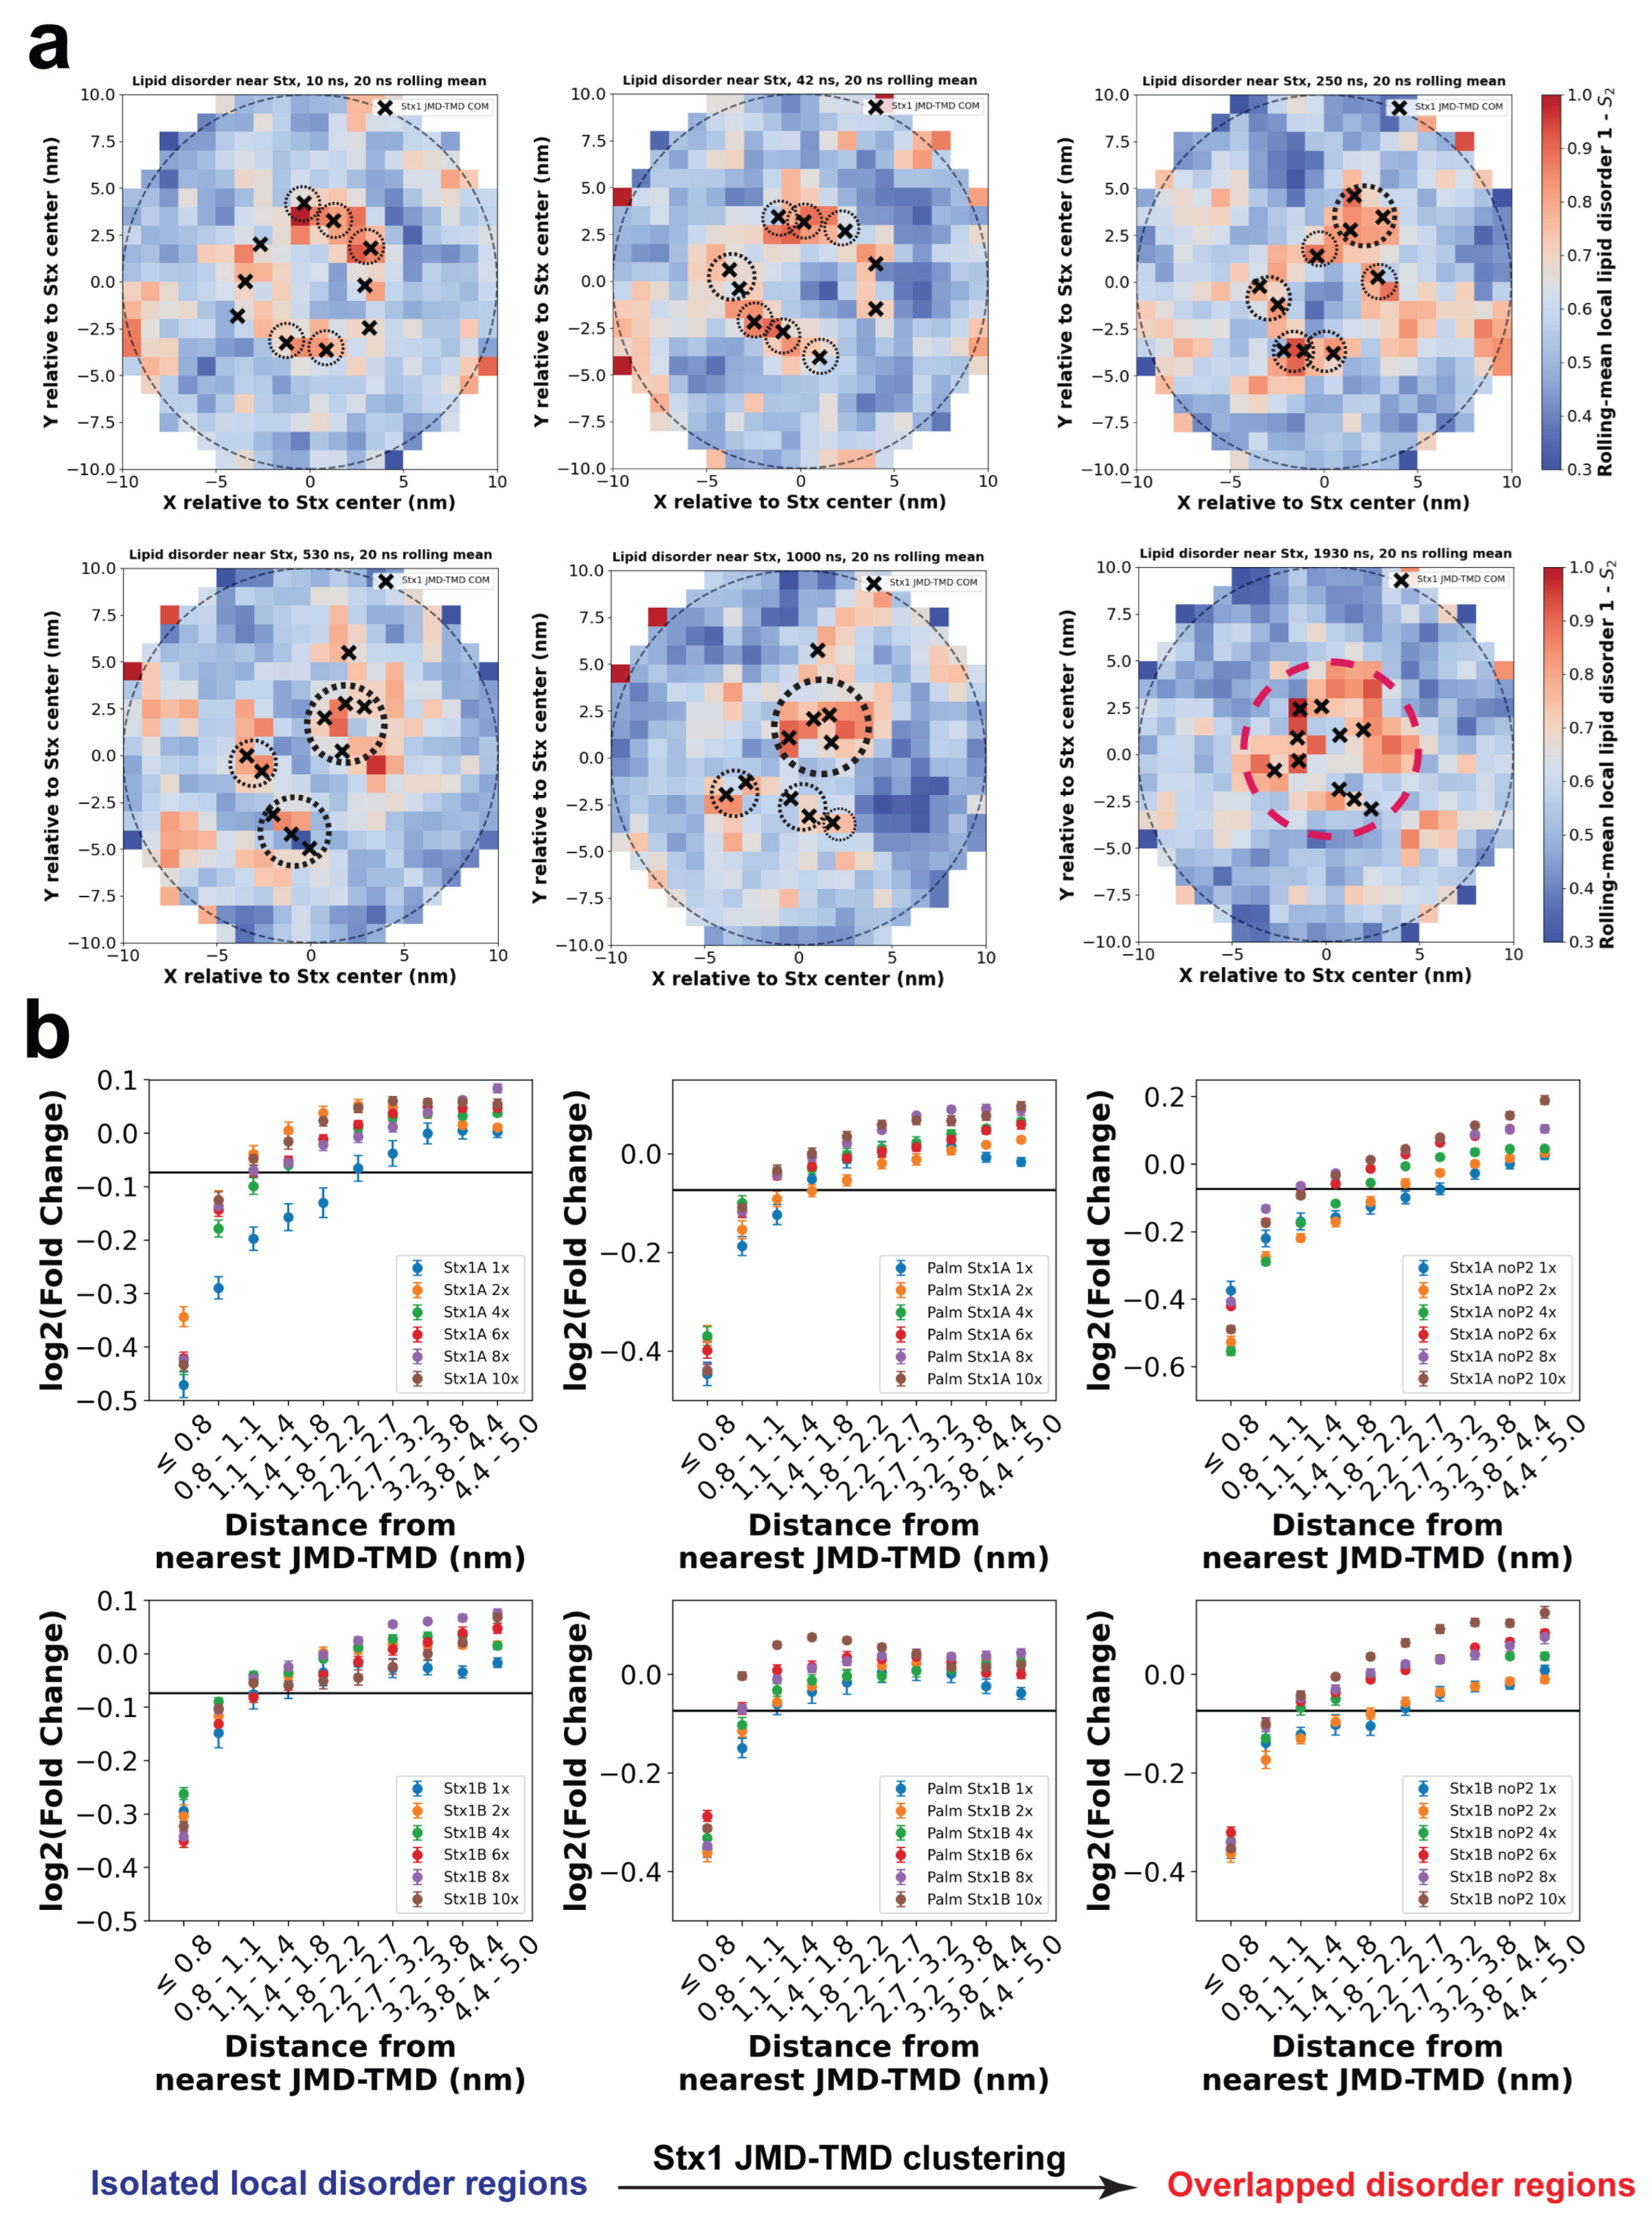
Analysis of the spatial distribution of lipid disorder during the clustering process revealed that the localized membrane perturbations generated by individual Stx1A JMD–TMD regions became increasingly concentrated as oligomerization progressed (Figure 7a). As the proteins assembled hierarchically into larger clusters, neighboring regions of elevated lipid disorder increasingly overlapped, producing a confined membrane region with increased overlap of local disorder surrounding the protein assembly.
To quantify this effect, we calculated the log2(fold change) of local lipid order parameters relative to bulk membrane values as a function of radial distance from the nearest Stx1 JMD–TMD region (Figure 7b). Increasing the number of Stx1A copies progressively shortened the apparent radial extent of detectable lipid disorder to approximately 1.1–1.4 nm and converged with the increased protein copies. This observation is consistent with increasing spatial overlap of neighboring perturbation fields and local reorganization of membrane packing within Stx1A clusters. In contrast, increasing the copy number of Stx1B produced little additional reduction in the radial disordering range, consistent with the more localized membrane perturbation generated by individual Stx1B JMD–TMD regions. Similar trends were observed for palmitoylated Stx1 and for Stx1 in PIP2-depleted membranes, although the absolute radial ranges differed between conditions.
Together, these observations suggest that Stx1 clustering primarily reorganizes the spatial distribution of membrane disorder rather than increasing the magnitude of local lipid disorder generated by individual JMD–TMD regions. These findings further support the conclusion that local membrane perturbation is predominantly determined by hydrophobic mismatch between the Stx1 transmembrane domain and the surrounding lipid bilayer, whereas clustering concentrates these local perturbations into confined membrane regions without cooperatively enhancing TMD tilting or local lipid disorder.
3. Discussion
3.1. Local Lipid Disorder Induced by Hydrophobic Mismatch of the Stx1 JMD–TMD Region May Facilitate Stalk Formation During Membrane Fusion
Our simulations indicate that the local lipid disorder surrounding the Stx1 JMD–TMD region primarily arises from hydrophobic mismatch between the Stx1 TMD and the hydrophobic core of the plasma membrane and is further modulated by electrostatic JMD–PIP2 interactions. Several observations support this conclusion.
First, the magnitude of local lipid disorder was largely insensitive to Stx1 copy number, clustering state, TMD palmitoylation, PIP2 depletion, and mutations that weaken JMD–PIP2 interactions. Similarly, these perturbations did not substantially alter the Stx1 TMD tilting order parameter (Figure 1, Figure 2 and Figure 6). In contrast, Stx1A alone consistently induced stronger local lipid disorder than Stx1B. Because Stx1B contains an additional C-terminal residue (L288) within the TMD, which reduces the hydrophobic mismatch, we conclude that hydrophobic mismatch is a major driving force underlying local membrane disorder surrounding the Stx1 JMD–TMD region.
How might these local membrane perturbations contribute to membrane fusion? A recent model proposed by the Joseph Rizo laboratory suggests that the JMD–TMD regions of SNARE proteins may function in a detergent-like manner to facilitate exposure of lipid tails and thereby catalyze stalk formation during membrane fusion [24,25]. Such a mechanism would likely be promoted by local lipid disorder, in which lipids deviate from tightly packed conformations aligned parallel to the membrane normal and transiently expose hydrophobic acyl chains to the surrounding environment.
Based on our simulations, we propose that clustered Stx molecules at the active zone may collectively generate a locally disordered membrane environment surrounding the SNARE assembly. During vesicle docking and SNARE complex zippering, close membrane apposition between the vesicle and plasma membrane could allow these locally disordered regions to promote hydrophobic tail exposure from both membranes, thereby lowering the energetic barrier for stalk nucleation.
Interestingly, because the magnitude of local lipid disorder induced by individual Stx1 JMD–TMD regions remained largely unchanged across different clustering conditions. Increasing Stx copy number may primarily expand the spatial extent of the disordered membrane rim rather than increasing the disordering strength of individual proteins. Such cooperative enlargement of membrane-disordered regions may facilitate formation of fusion intermediates required for membrane mergers.
3.2. The Additional C-Terminal Leucine in Stx1B May Facilitate Higher-Order Clustering and Cooperative Fusion Activity
Our simulations further show that, compared to Stx1A, Stx1B is less sensitive to TMD palmitoylation, inducing restriction of the spatial extent of membrane perturbation, whereas it exhibits a stronger dependence on membrane PIP₂ content (Figure 2c). Interestingly, the radial distribution of lipid disorder surrounding palmitoylated Stx1A closely resembles that of non-palmitoylated Stx1B, while palmitoylation produces only modest changes in the radial membrane perturbation profile of Stx1B. These observations suggest that Stx1B may intrinsically adopt a membrane organization state similar to that induced by palmitoylation in Stx1A. This parallels the experimental observations that Stx1B supports spontaneous release better than Stx1A [11], however, this deficiency of Stx1A is overcome when Stx1A TMD is palmitoylated [28], although the functional significance of this similarity remains to be established experimentally.
Consistent with these membrane properties, Stx1B also exhibited a modest but reproducible tendency toward larger oligomeric assemblies than Stx1A under intermediate protein-density conditions, particularly in palmitoylated membranes and under PIP₂ depletion (Figure 5Figure 5, S2). Although the difference in mean cluster size between Stx1A and Stx1B under the six-copy condition did not reach statistical significance (Figure S1), the average cluster size of six-copy Stx1B was comparable to that observed for eight-copy Stx1B, suggesting an intrinsic tendency toward higher-order oligomerization.
A plausible structural explanation is that the additional C-terminal residue L288 in Stx1B better supports hydrophobic packing interactions that stabilize oligomeric assemblies. Because L288 is located near the membrane interface, it may strengthen local packing interactions and partially buffer membrane perturbations induced by palmitoylation or altered membrane electrostatics, thereby increasing the structural robustness of Stx1B oligomers under diverse membrane conditions.
Such clustering differences may have important functional implications for membrane fusion. Cooperative assembly of multiple SNARE complexes has long been proposed to enhance force generation during membrane merger [16,30]. In this context, the greater propensity of Stx1B to maintain higher-order oligomeric assemblies may facilitate local concentration and coordination of multiple SNARE complexes within confined membrane regions, thereby promoting cooperative membrane deformation and potentially lowering the energetic barrier for membrane fusion.
Spontaneous neurotransmitter release has been implicated in synaptic maturation, circuit refinement, and neuronal development [31,32]. Although the present simulations do not directly address exocytotic kinetics, the distinct clustering behavior of Stx1B may provide a structural framework for isoform-specific regulation of membrane organization and SNARE assembly. Together, these observations suggest that subtle differences in membrane interactions between Stx1 isoforms may influence the balance between reservoir-like clustering and fusion-competent membrane organization, thereby contributing to functional specialization during neurotransmitter release.
3.3. Palmitoylation May Limit Higher-Order Stx1 JMD–TMD Oligomerization and Promote Release from Reservoir-like Assemblies
Previous experimental studies have suggested that Stx proteins can form clustered membrane reservoirs prior to SNARE complex assembly and membrane docking [15,23]. To prevent formation of non-productive SNARE assemblies containing multiple Stx molecules and SNAP25 [33], Munc18 is thought to keep Stx proteins in a closed conformation [2]. A recent study suggests that Munc18 may prevent assembly of Stx oligomers and promote formation of fusion-competent SNARE complexes [15].
Our simulations raise the possibility that palmitoylation may also contribute to regulation of Stx reservoir dynamics. Specifically, palmitoylation suppressed formation of higher order oligomers for Stx1A, although for Stx1B the mean cluster size was significantly lower only at 10 copies (Figure 5). These observations suggest that palmitoylation disfavors formation or stabilization of large Stx oligomeric assemblies.
Combined with our previous findings that Stx1A palmitoylation promotes upright conformations of the Stx SNARE domain (SND) and facilitates SNARE assembly [34], we propose that palmitoylation may coordinately regulate both membrane organization and SNARE complex availability.
One possible interpretation is that palmitoylation shifts the equilibrium away from large reservoir-like Stx assemblies and toward smaller oligomer states that are more accessible for productive SNARE complex formation. In this model, palmitoylation would potentially promote efficient transition from inactive Stx reservoirs to active SNARE assembly pathways.
Such a mechanism may also help to explain previous observations linking Stx1A TMD palmitoylation to support spontaneous neurotransmitter release [28], although direct experimental validation will be required to establish the relationship between palmitoylation-dependent oligomer regulation and exocytotic activity.
3.4. Limitations and Future Directions
Several limitations of the present study should be acknowledged.
First, our simulations employed the MARTINI v2.1 coarse-grained force field to access longer timescales and larger membrane systems without prohibitively increasing computational cost. Although this approach enables efficient exploration of collective membrane organization and protein clustering dynamics, coarse-grained representations inevitably sacrifice chemical resolution and simplify intra- and intermolecular interactions compared with atomistic simulations [5].
Second, the Stx1 JMD was modeled predominantly in a helical conformation based on our previous work. The conformational stability and structural dynamics of the JMD, together with the molecular origin of hydrophobic mismatch-induced membrane perturbation, should be further validated using atomistic molecular dynamics simulations and complementary experimental approaches.
Third, to specifically investigate membrane organization mediated by the JMD–TMD region, the Habc domain and SNARE domain (SND) were excluded from the simulations. Consequently, the present study isolates the intrinsic membrane-organizing properties of the JMD–TMD region but does not capture additional structural constraints and regulatory interactions present in full-length Stx1 or assembled SNARE complexes.
Finally, the present analysis focused on fundamental descriptors of Stx1 oligomerization, including the fraction of proteins participating in clusters, maximum cluster size, and mean cluster size. More comprehensive characterization of cluster dynamics, including cluster lifetime distributions, cluster area, spatial morphology, fusion and fission events, and temporal evolution of individual oligomers, remains to be investigated. Furthermore, because the simulations were limited to 2 μs, the observed clustering behavior primarily reflects early-stage oligomerization dynamics at the simulated protein densities.
Future work will therefore focus on multiscale characterization of Stx-mediated membrane organization. Atomistic simulations will be performed to validate JMD secondary structure and TMD-induced membrane perturbation, whereas larger-scale coarse-grained simulations will investigate reservoir-like Stx assemblies and their regulation by palmitoylation and membrane lipid composition. In parallel, machine-learning and deep-learning approaches will be developed to quantify cluster morphology, spatial coverage, lifetime distributions, and dynamic remodeling, providing a more comprehensive description of Stx clustering and its transitions toward fusion-competent membrane organization. Future studies will further investigate how JMD electrostatic interactions and membrane lipid organization regulate the spatial overlap of local membrane perturbation fields within Stx clusters and how these emergent membrane properties contribute to SNARE assembly and early membrane fusion intermediates.
4. Materials and Methods
4.1. Stx1 Based Models
MARTINI coarse-grained molecular dynamics (CGMD) simulations were performed using 1, 2, 4, 6, 8 or 10 copies of the Stx1A JMD–TMD region (residues 256–288) or Stx1B JMD–TMD region (residues 255–288) embedded in a plasma membrane model with the same lipid composition as described previously [34].
The atomistic reference structure of Stx1A was obtained from our previous study [35]. Initial Stx1B structures were generated by substituting residues that differ from Stx1A (Figure 1A) using PyMOL [36], thereby preserving identical backbone conformations and equivalent initial geometries across isoforms.
For Stx1B variants containing additional C-terminal residues, the missing residues were appended by aligning the final five residues of the AlphaFold-predicted structure to the Stx1A reference structure in PyMOL.
4.2. CG Model Conversion and MD Simulations
All atomistic Stx models were converted into MARTINI coarse-grained representations using the MARTINI 2.1 force field and a modified version of martinize_CYP.py (v2.5), as described previously [34]. The script simultaneously generated the corresponding topology (.itp) files.
Membrane self-assembly and production simulations were performed following protocols described previously [34,37] to generate systems whose box size is ~ 202015 nm3. For each Stx construct multiple copies of Stx proteins were generated by duplicating and rotationally arranging the proteins around the membrane normal with angular intervals of 360°/N, where N = 1, 2, 4, 6, 8 or 10.
Plasma membrane systems were self-assembled for each Stx copy number using the same membrane composition described previously [35,37]. For PIP2-depleted simulations, all PIP2 molecules were replaced with phosphatidylserine (PS).
For each initial condition, n = 10 independent simulations of 2 μs duration were performed to ensure robust conformational sampling.
4.3. MD Simulation Parameters
All simulations were performed using GROMACS version 2024 [38] in Bridges-2 high performing super computer [39].
During the 1 ns equilibration phase, a Berendsen thermostat (310 K) and Berendsen barostat (1 bar) with coupling constants (τ) of 1.0 ps were applied with a timestep of 0.01 ps. Production simulations employed a velocity-rescale thermostat (310 K, τ = 1.0 ps) together with a semi-isotropic Parrinello–Rahman barostat (1 bar, τ = 12.0 ps) with a timestep of 0.02 ps.
The neighbor list was updated every 20 steps using a Verlet-buffer tolerance of 0.005. For each initial condition, n = 10 independent simulations with different random seeds were performed for 2 μs. Trajectory frames were saved every 1 ns.
Additional simulation details are provided in the Data Availability section.
4.4. Analysis
4.4.1. Trajectory Preprocessing
Following the 2 μs production simulations, all trajectories were preprocessed using GROMACS to reconstruct fragmented molecules across periodic boundary conditions and remove water molecules and ions for subsequent analyses.
4.4.2. Lipid Selection for Binding and Disorder Analysis
Lipids were selected if the minimum distance between any lipid bead and any bead of any Stx protein was within a cutoff distance for a given simulation frame. The total number of selected lipids was defined as: where forand otherwise. The number of Stx-bound lipids was defined as .
4.4.3. Stx1 Tilting Ordering Parameters
The orientational order parameter of the Stx1 JMD–TMD region was defined as:
where is the tilt angle between the vector fit to all of the backbone beads of the TMD residues of the ith Stx1 JMD–TMD fragment and the membrane normal at time t, and 〈 〉 denotes averaging over all Stx1 molecules in the simulation system. For simulations containing a single Stx1 JMD–TMD molecule, was calculated directly from the tilt angle of that molecule without ensemble averaging.
4.4.4. Lipid Disorder Parameter and Bulk Lipid Disorder Parameter Calculation
For each selected lipid except cholesterol, the angle between the vector formed by the second and third lipid beads and the membrane normal (z-axis) was calculated. Each lipid except cholesterol contributes two values. For cholesterol, was defined using the vector connecting the R5 and ROH beads.
The lipid disorder parameter was defined as:
where 〈 〉 denotes averaging over all selected lipids at time .
The bulk lipid disorder parameter was defined as:
For each simulation, was calculated at 0.8, 1.1, 1.4, 1.8, 2.2, 2.7, 3.2, 3.8, 4.4and
5 nm.
The lipid disorder parameter for the annular rim region was calculated as:
where and represent the inner and outer radial boundaries of the rim region, respectively.
4.4.5. Stx Pairwise Distance Calculation and Multiple Cluster Definition
For simulations containing multiple Stx proteins, pairwise distances were calculated for every protein pair at each simulation frame. The pairwise distance was defined as the minimum contact distance between any backbone (BB) beads of two Stx proteins.
For each trajectory, pairwise distances were stored as matrices with dimensions: (n_frames, n_stx, n_stx).
A Stx cluster was defined as a group containing more than one Stx protein with pairwise distances ≤ 1.0 nm. For each frame, the following quantities were calculated: 1.) the total number of clustered Stx proteins , finally yielding the fraction of Stx formed cluster and 2.) the maximum number of Stx proteins in a cluster 3.) the average number of Stx proteins in a cluster , where is the number of clusters made of i Stx JMD-TMDs at time . Number of monomers was included.
4.4.6. Statistics
All quantities are reported as mean ± SEM together with the corresponding sample size (N). Averaging was performed over trajectory frames collected after 1900 ns, during which no substantial temporal drift was observed. All error bars: SEM.
Individual data points represent values obtained from each of the n = 10 independent simulations.
Statistical comparisons between pairs of groups were performed using the Mann–Whitney U test in SciPy package, and the corresponding p values are reported in the figures. Comparison of multiple groups together were performed using Kruskal test in SciPy package and the p values were reported in figure captions. Pearson correlations were calculated by comparing quantities with number of Stx in simulations and p-value from statistical significance of the correlations were also calculated by pearsonr function from SciPy package.
4.4.7. Analysis Software
Trajectory analyses were performed in Python using MDTraj [40]. Statistical analyses were conducted using SciPy. Figures were generated using Matplotlib, Seaborn, and statannotations. For more information, please visit Data availability section.
5. Conclusions
In summary, our MARTINI coarse-grained molecular dynamics simulations demonstrate that local membrane disorder induced by the Stx1 JMD–TMD region is primarily governed by hydrophobic mismatch and remains largely independent of Stx clustering state. Although palmitoylation does not substantially alter the magnitude of local lipid disorder, it spatially restricts the radial extent of membrane perturbation, producing a more localized membrane organization that resembles that of Stx1B. In contrast, PIP₂ depletion broadens the disorder field while simultaneously suppressing higher-order oligomerization, indicating distinct roles of lipid modification and membrane electrostatics in regulating Stx membrane organization.
Our simulations further show that PIP₂ depletion and TMD palmitoylation suppresses the formation of higher-order oligomers, potentially shifting Stx assemblies toward smaller, fusion-competent states. Stx1B exhibits a modestly greater propensity for oligomerization than Stx1A, consistent with isoform-specific differences in membrane organization and clustering behavior.
Together, these findings support a unified model in which hydrophobic mismatch establishes local membrane perturbation, while palmitoylation and PIP₂ interactions spatially tune membrane organization and clustering dynamics, thereby regulating the transition of Stx assemblies from reservoir-like clusters toward membrane environments permissive for SNARE complex assembly and membrane fusion.
Supplementary Materials
The following supporting information can be downloaded at the website of this paper posted on Preprints.org. Supporting information and Movie S1-S3.
Author Contributions
All authors designed the project, performed MD simulations, analyzed data and writing the manuscript.
Funding
This research was funded by NIGMS, R35GM139608, to ML and by the University of Miami. All computation resources were funded by Bridges2 supercomputer from NSF ACCESS Allocation, BIO250149, to DA.
Institutional Review Board Statement
Not applicable.
Informed Consent Statement
Not applicable.
Data Availability Statement
All files required to reproduce the simulations and analyses described in this study, including starting structures, topology files, molecular dynamics parameter files, processed datasets, and analysis scripts, will be made publicly available upon publication in the https://zenodo.org/records/20513726. Because the trajectory(.xtc) files are too large to be deposited in the public repository but can be obtained from the corresponding author upon reasonable request.
Acknowledgments
Not applicable.
Conflicts of Interest
The authors declare no conflicts of interest.
Declaration of generative AI and AI-assisted technologies in the writing process
During the preparation of this work, the first author used ChatGPT to improve language and readability. After using this tool/service, the author(s) reviewed and edited the content as needed and took full responsibility for the content of the publication.
Abbreviations
The following abbreviations are used in this manuscript:
| CG | Coarse grain |
| MD | Molecular dynamics |
| Stx | Syntaxin |
| JMD | Juxtamembane domain |
| TMD | Transmembrane domain |
| SND | SNARE domain |
| Palm Stx1 | Palmitoylated Stx1 |
| PIP2 | phosphatidylinositol 4,5-bisphosphate |
| noP2 | PIP2 depletion |
References
- Rothman, J. E. The principle of membrane fusion in the cell (Nobel lecture). Angew. Chem. Int. Ed. 2014, 53, 47. [Google Scholar] [CrossRef]
- Südhof, T. C., The Molecular Machinery of Neurotransmitter Release (Nobel Lecture). Angew. Chem. Int. Ed. 2014, 53((47)), 12696–12717. [CrossRef] [PubMed]
- Wu, L. G.; Hamid, E.; Shin, W.; Chiang, H. C. Exocytosis and endocytosis: modes, functions, and coupling mechanisms. Annu Rev. Physiol. 2014, 76, 301–31. [Google Scholar] [CrossRef] [PubMed]
- An, D.; Lindau, M. Exploring the structural dynamics of the vesicle priming machinery. Biochem Soc. Trans. 2024, 52((4)), 1715–1725. [Google Scholar] [CrossRef] [PubMed]
- An, D.; Sharma, S.; Lindau, M. Using multiscale molecular dynamics simulations to explore the fusion machinery underlying neurotransmitter release. Q. Rev. Biophys. 2025, 58, e14. [Google Scholar] [CrossRef] [PubMed]
- Wang, S.; Li, Y.; Gong, J.; Ye, S.; Yang, X.; Zhang, R.; Ma, C. Munc18 and Munc13 serve as a functional template to orchestrate neuronal SNARE complex assembly. Nat. Commun. 2019, 10((1)), 69. [Google Scholar] [CrossRef] [PubMed]
- Ullrich, A.; Böhme, M. A.; Schöneberg, J.; Depner, H.; Sigrist, S. J.; Noé, F. Dynamical organization of syntaxin-1A at the presynaptic active zone. PLoS Comput. Biol. 2015, 11((9)), e1004407. [Google Scholar] [CrossRef] [PubMed]
- Rizo, J. Molecular Mechanisms Underlying Neurotransmitter Release. Annu Rev. Biophys. 2022, 51((1)), 377–408. [Google Scholar] [CrossRef] [PubMed]
- Zhang, Y. L.; Hughson, F. M. Chaperoning SNARE Folding and Assembly. Annu Rev. Biochem 2021, 90, 581–603. [Google Scholar] [CrossRef] [PubMed]
- Kofuji, T.; Fujiwara, T.; Sanada, M.; Mishima, T.; Akagawa, K. HPC-1/syntaxin 1A and syntaxin 1B play distinct roles in neuronal survival. J. Neurochem 2014, 130((4)), 514–525. [Google Scholar] [CrossRef] [PubMed]
- Mishima, T.; Fujiwara, T.; Sanada, M.; Kofuji, T.; Kanai-Azuma, M.; Akagawa, K. Syntaxin 1B, but not syntaxin 1A, is necessary for the regulation of synaptic vesicle exocytosis and of the readily releasable pool at central synapses. PLoS ONE 2014, 9((2)), e90004. [Google Scholar] [CrossRef] [PubMed]
- Arancillo, M.; Min, S. W.; Gerber, S.; Münster-Wandowski, A.; Wu, Y. J.; Herman, M.; Trimbuch, T.; Rah, J. C.; Ahnert-Hilger, G.; Riedel, D.; Südhof, T. C.; Rosenmund, C. Titration of Syntaxin1 in Mammalian Synapses Reveals Multiple Roles in Vesicle Docking, Priming, and Release Probability. J. Neurosci. 2013, 33((42)), 16698–16714. [Google Scholar] [CrossRef] [PubMed]
- Wu, Y. J.; Tejero, R.; Arancillo, M.; Vardar, G.; Korotkova, T.; Kintscher, M.; Schmitz, D.; Ponomarenko, A.; Tabares, L.; Rosenmund, C. Syntaxin 1B is important for mouse postnatal survival and proper synaptic function at the mouse neuromuscular junctions. J. Neurophysiol. 2015, 114((4)), 2404–2417. [Google Scholar] [CrossRef] [PubMed]
- Vardar, G.; Chang, S. W.; Arancillo, M.; Wu, Y. J.; Trimbuch, T.; Rosenmund, C. Distinct Functions of Syntaxin-1 in Neuronal Maintenance, Synaptic Vesicle Docking, and Fusion in Mouse Neurons. J. Neurosci. 2016, 36((30)), 7911–7924. [Google Scholar] [CrossRef] [PubMed]
- Pei, Q.; Chen, Q. X.; Tian, Z. Q.; Zhu, L.; Chen, Y.; Gong, J. H.; Wang, S.; Xiang, Y. J.; Khamo, J. S.; Fan, J. Q.; Rong, Y.; Yu, Y.; Qin, Y. Y.; Wu, S. P.; Faragalla, Y.; Cao, P.; Zhang, K.; Lai, Y.; Wu, L. G.; Ma, C.; Yang, X. F.; Diao, J. J. Munc18 modulates syntaxin phase separation to promote exocytosis. Nat. Neurosci. 2025. [Google Scholar] [CrossRef] [PubMed]
- Gandasi, N. R.; Barg, S. Contact-induced clustering of syntaxin and munc18 docks secretory granules at the exocytosis site. Nat. Commun. 2014, 5((1)), 3914. [Google Scholar] [CrossRef] [PubMed]
- Barg, S.; Knowles, M.; Chen, X.; Midorikawa, M.; Almers, W. Syntaxin clusters assemble reversibly at sites of secretory granules in live cells. Proc. Natl. Acad. Sci. 2010, 107((48)), 20804–20809. [Google Scholar] [CrossRef] [PubMed]
- Tokumaru, H.; Umayahara, K.; Pellegrini, L. L.; Ishizuka, T.; Saisu, H.; Betz, H.; Augustine, G. J.; Abe, T. SNARE complex oligomerization by synaphin/complexin is essential for synaptic vesicle exocytosis. Cell 2001, 104((3)), 421–432. [Google Scholar] [CrossRef] [PubMed]
- Honigmann, A.; Van Den Bogaart, G.; Iraheta, E.; Risselada, H. J.; Milovanovic, D.; Mueller, V.; Müllar, S.; Diederichsen, U.; Fasshauer, D.; Grubmüller, H. Phosphatidylinositol 4, 5-bisphosphate clusters act as molecular beacons for vesicle recruitment. Nat. Struct. Mol. Biol. 2013, 20((6)), 679–686. [Google Scholar] [CrossRef] [PubMed]
- van den Bogaart, G.; Meyenberg, K.; Risselada, H. J.; Amin, H.; Willig, K. I.; Hubrich, B. E.; Dier, M.; Hell, S. W.; Grubmuller, H.; Diederichsen, U.; Jahn, R. Membrane protein sequestering by ionic protein-lipid interactions. Nature 2011, 479((7374)), 552–5. [Google Scholar] [CrossRef] [PubMed]
- Sharma, S.; Lindau, M. t-SNARE Transmembrane Domain Clustering Modulates Lipid Organization and Membrane Curvature. J. Am. Chem. Soc. 2017, 139((51)), 18440–18443. [Google Scholar] [CrossRef] [PubMed]
- Li, F.; Radhakrishnan, A.; Gautam, S.; Diaz, G.; Sundaram, R. V. K.; Coleman, J.; Zheng, H.; Grushin, K.; Chavent, M.; Rothman, J. E. Synaptic transmission: Munc13 assembles onto PI (4, 5) P2-rich domains into trimers that cooperate to capture vesicles. Proc. Natl. Acad. Sci. 2026, 123((7)), e2523347123. [Google Scholar] [PubMed]
- Li, M.; Oh, T.-J.; Fan, H.; Diao, J.; Zhang, K. Syntaxin clustering and optogenetic control for synaptic membrane fusion. J. Mol. Biol. 2020, 432((17)), 4773–4782. [Google Scholar] [CrossRef] [PubMed]
- Rizo, J.; Chattopadhyay, M.; Wosztyl, A.; Xu, J. The local detergent model of SNARE-mediated membrane fusion. J. Cell Sci. 2026, 139((2)), jcs264344. [Google Scholar] [CrossRef] [PubMed]
- Rizo, J.; Sari, L.; Jaczynska, K.; Rosenmund, C.; Lin, M. M. Molecular mechanism underlying SNARE-mediated membrane fusion enlightened by all-atom molecular dynamics simulations. Proc. Natl. Acad. Sci. U S A 2024, 121((16)), e2321447121. [Google Scholar] [CrossRef] [PubMed]
- Milovanovic, D.; Honigmann, A.; Koike, S.; Göttfert, F.; Pähler, G.; Junius, M.; Müllar, S.; Diederichsen, U.; Janshoff, A.; Grubmüller, H. Hydrophobic mismatch sorts SNARE proteins into distinct membrane domains. Nat. Commun. 2015, 6((1)), 5984. [Google Scholar] [CrossRef] [PubMed]
- Smirnova, Y. G.; Risselada, H. J.; Müller, M. Thermodynamically reversible paths of the first fusion intermediate reveal an important role for membrane anchors of fusion proteins. P Natl. Acad. Sci. USA 2019, 116((7)), 2571–2576. [Google Scholar] [CrossRef] [PubMed]
- Vardar, G.; Salazar-Lazaro, A.; Zobel, S.; Trimbuch, T.; Rosenmund, C. Syntaxin-1A modulates vesicle fusion in mammalian neurons via juxtamembrane domain dependent palmitoylation of its transmembrane domain. Elife 2022, 11. [Google Scholar] [CrossRef] [PubMed]
- Omar-Hmeadi, M.; Gandasi, N. R.; Barg, S. PtdIns (4, 5) P2 is not required for secretory granule docking. Traffic 2018, 19((6)), 436–445. [Google Scholar] [CrossRef] [PubMed]
- Jahn, R.; Cafiso, D. C.; Tamm, L. K. Mechanisms of SNARE proteins in membrane fusion. Nat. Rev. Mol. Cell Biol. 2024, 25((2)), 101–118. [Google Scholar] [CrossRef] [PubMed]
- Andreae, L. C.; Burrone, J. The role of spontaneous neurotransmission in synapse and circuit development. J. Neurosci. Res. 2018, 96((3)), 354–359. [Google Scholar] [PubMed]
- Kavalali, E. T. The mechanisms and functions of spontaneous neurotransmitter release. Nat. Rev. Neurosci. 2015, 16((1)), 5–16. [Google Scholar] [PubMed]
- Misura, K. M.; Gonzalez, L. C.; May, A. P.; Scheller, R. H.; Weis, W. I. Crystal structure and biophysical properties of a complex between the N-terminal SNARE region of SNAP25 and syntaxin 1a. J. Biol. Chem. 2001, 276((44)), 41301–41309. [Google Scholar] [CrossRef] [PubMed]
- An, D.; Sharma, S.; Lindau, M. Syntaxin 1A transmembrane domain palmitoylation induces a fusogenic conformation. Biophys. J. 2025, 124((22)), 3948–3965. [Google Scholar] [CrossRef] [PubMed]
- Sharma, S.; Lindau, M. Molecular mechanism of fusion pore formation driven by the neuronal SNARE complex. Proc. Natl. Acad. Sci. U S A 2018, 115((50)), 12751–12756. [Google Scholar] [CrossRef] [PubMed]
- DeLano, W. L. Pymol: An open-source molecular graphics tool. CCP4 Newsl. Protein Crystallogr. 2002, 40((1)), 82–92. [Google Scholar]
- Sharma, S.; Kim, B. N.; Stansfeld, P. J.; Sansom, M. S.; Lindau, M. A Coarse Grained Model for a Lipid Membrane with Physiological Composition and Leaflet Asymmetry. PLoS ONE 2015, 10((12)), e0144814. [Google Scholar] [CrossRef] [PubMed]
- Lemkul, J. A. Introductory Tutorials for Simulating Protein Dynamics with GROMACS. J. Phys. Chem. B 2024, 128((39)), 9418–9435. [Google Scholar] [CrossRef] [PubMed]
- Brown, S. T.; Buitrago, P.; Hanna, E.; Sanielevici, S.; Scibek, R.; Nystrom, N. A. Bridges-2: A Platform for Rapidly-Evolving and Data Intensive Research. In Practice and Experience in Advanced Research Computing 2021; Pearc 2021 2021. [Google Scholar] [CrossRef]
- McGibbon, R. T.; Beauchamp, K. A.; Harrigan, M. P.; Klein, C.; Swails, J. M.; Hernandez, C. X.; Schwantes, C. R.; Wang, L. P.; Lane, T. J.; Pande, V. S. MDTraj: A Modern Open Library for the Analysis of Molecular Dynamics Trajectories. Biophys. J. 2015, 109((8)), 1528–32. [Google Scholar] [CrossRef] [PubMed]
Figure 1.
Stx1A induces stronger and broader local lipid disorder than Stx1B. (a) Representative simulation snapshot of a Stx1A JMD–TMD embedded in a plasma membrane at 1999 ns. Red: Stx1A TMD backbone beads; Cyan: Stx1A JMD backbone beads; brown: phospholipid PO4 beads; pink: representative head group beads of PIP2 interacting with the Stx1A JMD-TMD; purple and green: two lipid tails in the PIP2 molecule; blue: representative cholesterol interacting with Stx1A JMD-TMD. Orange: the second and the third beads of the two lipid tails in the PIP2 molecule and the ROH and R5 beads in the cholesterol molecule; Purple, green and blue arrows: vector connected by orange beads to calculate related to the membrane normal (dash line). Each lipid except cholesterol contributes two because of two lipid tails. For cholesterol, only one was calculated. Red arrow: vector of TMD to calculate TMD tilting angle (b) Average trajectories of the local lipid order parameter for Stx-bound lipids (left), bulk membrane lipid order parameter calculated from all lipids in the simulation box (middle), and Stx1 TMD tilting order parameter (right) from n = 10 simulations of Stx1A (blue) and Stx1B (orange). Shaded regions indicate mean ± SD. (c) Averaged local lipid order parameters for local Stx-bound lipids (left), bulk membrane lipid order parameters (middle), and Stx1 TMD tilting order parameters (right) calculated from the final 100 ns of the simulations. Individual dots represent values from independent simulations. P-values were calculated using the Mann–Whitney U test. All statistics were listed in Table S1. (d) Radial analysis of lipid order parameters as a function of the distance from the Stx1 JMD–TMD region. The red horizontal line indicates the bulk membrane lipid order parameter. All statistics are listed in Table S2. (e) log2(Fold change) values related to the bulk lipid ordering parameters at different radial distances with the bulk membrane lipid order parameter using the last 100 ns of all n=10 simulations. Stx1B-induced lipid disorder became indistinguishable from bulk membrane ordering beyond ~1.4 nm from the Stx1 JMD–TMD region, whereas Stx1A-induced lipid disorder extended to ~2.7 nm, indicating an approximately twofold broader disordering range. Black line: Fold change of 95% of the bulk lipid ordering parameters. All statistics were listed in Table S3. Error bars: mean ± SEM.
Figure 1.
Stx1A induces stronger and broader local lipid disorder than Stx1B. (a) Representative simulation snapshot of a Stx1A JMD–TMD embedded in a plasma membrane at 1999 ns. Red: Stx1A TMD backbone beads; Cyan: Stx1A JMD backbone beads; brown: phospholipid PO4 beads; pink: representative head group beads of PIP2 interacting with the Stx1A JMD-TMD; purple and green: two lipid tails in the PIP2 molecule; blue: representative cholesterol interacting with Stx1A JMD-TMD. Orange: the second and the third beads of the two lipid tails in the PIP2 molecule and the ROH and R5 beads in the cholesterol molecule; Purple, green and blue arrows: vector connected by orange beads to calculate related to the membrane normal (dash line). Each lipid except cholesterol contributes two because of two lipid tails. For cholesterol, only one was calculated. Red arrow: vector of TMD to calculate TMD tilting angle (b) Average trajectories of the local lipid order parameter for Stx-bound lipids (left), bulk membrane lipid order parameter calculated from all lipids in the simulation box (middle), and Stx1 TMD tilting order parameter (right) from n = 10 simulations of Stx1A (blue) and Stx1B (orange). Shaded regions indicate mean ± SD. (c) Averaged local lipid order parameters for local Stx-bound lipids (left), bulk membrane lipid order parameters (middle), and Stx1 TMD tilting order parameters (right) calculated from the final 100 ns of the simulations. Individual dots represent values from independent simulations. P-values were calculated using the Mann–Whitney U test. All statistics were listed in Table S1. (d) Radial analysis of lipid order parameters as a function of the distance from the Stx1 JMD–TMD region. The red horizontal line indicates the bulk membrane lipid order parameter. All statistics are listed in Table S2. (e) log2(Fold change) values related to the bulk lipid ordering parameters at different radial distances with the bulk membrane lipid order parameter using the last 100 ns of all n=10 simulations. Stx1B-induced lipid disorder became indistinguishable from bulk membrane ordering beyond ~1.4 nm from the Stx1 JMD–TMD region, whereas Stx1A-induced lipid disorder extended to ~2.7 nm, indicating an approximately twofold broader disordering range. Black line: Fold change of 95% of the bulk lipid ordering parameters. All statistics were listed in Table S3. Error bars: mean ± SEM.
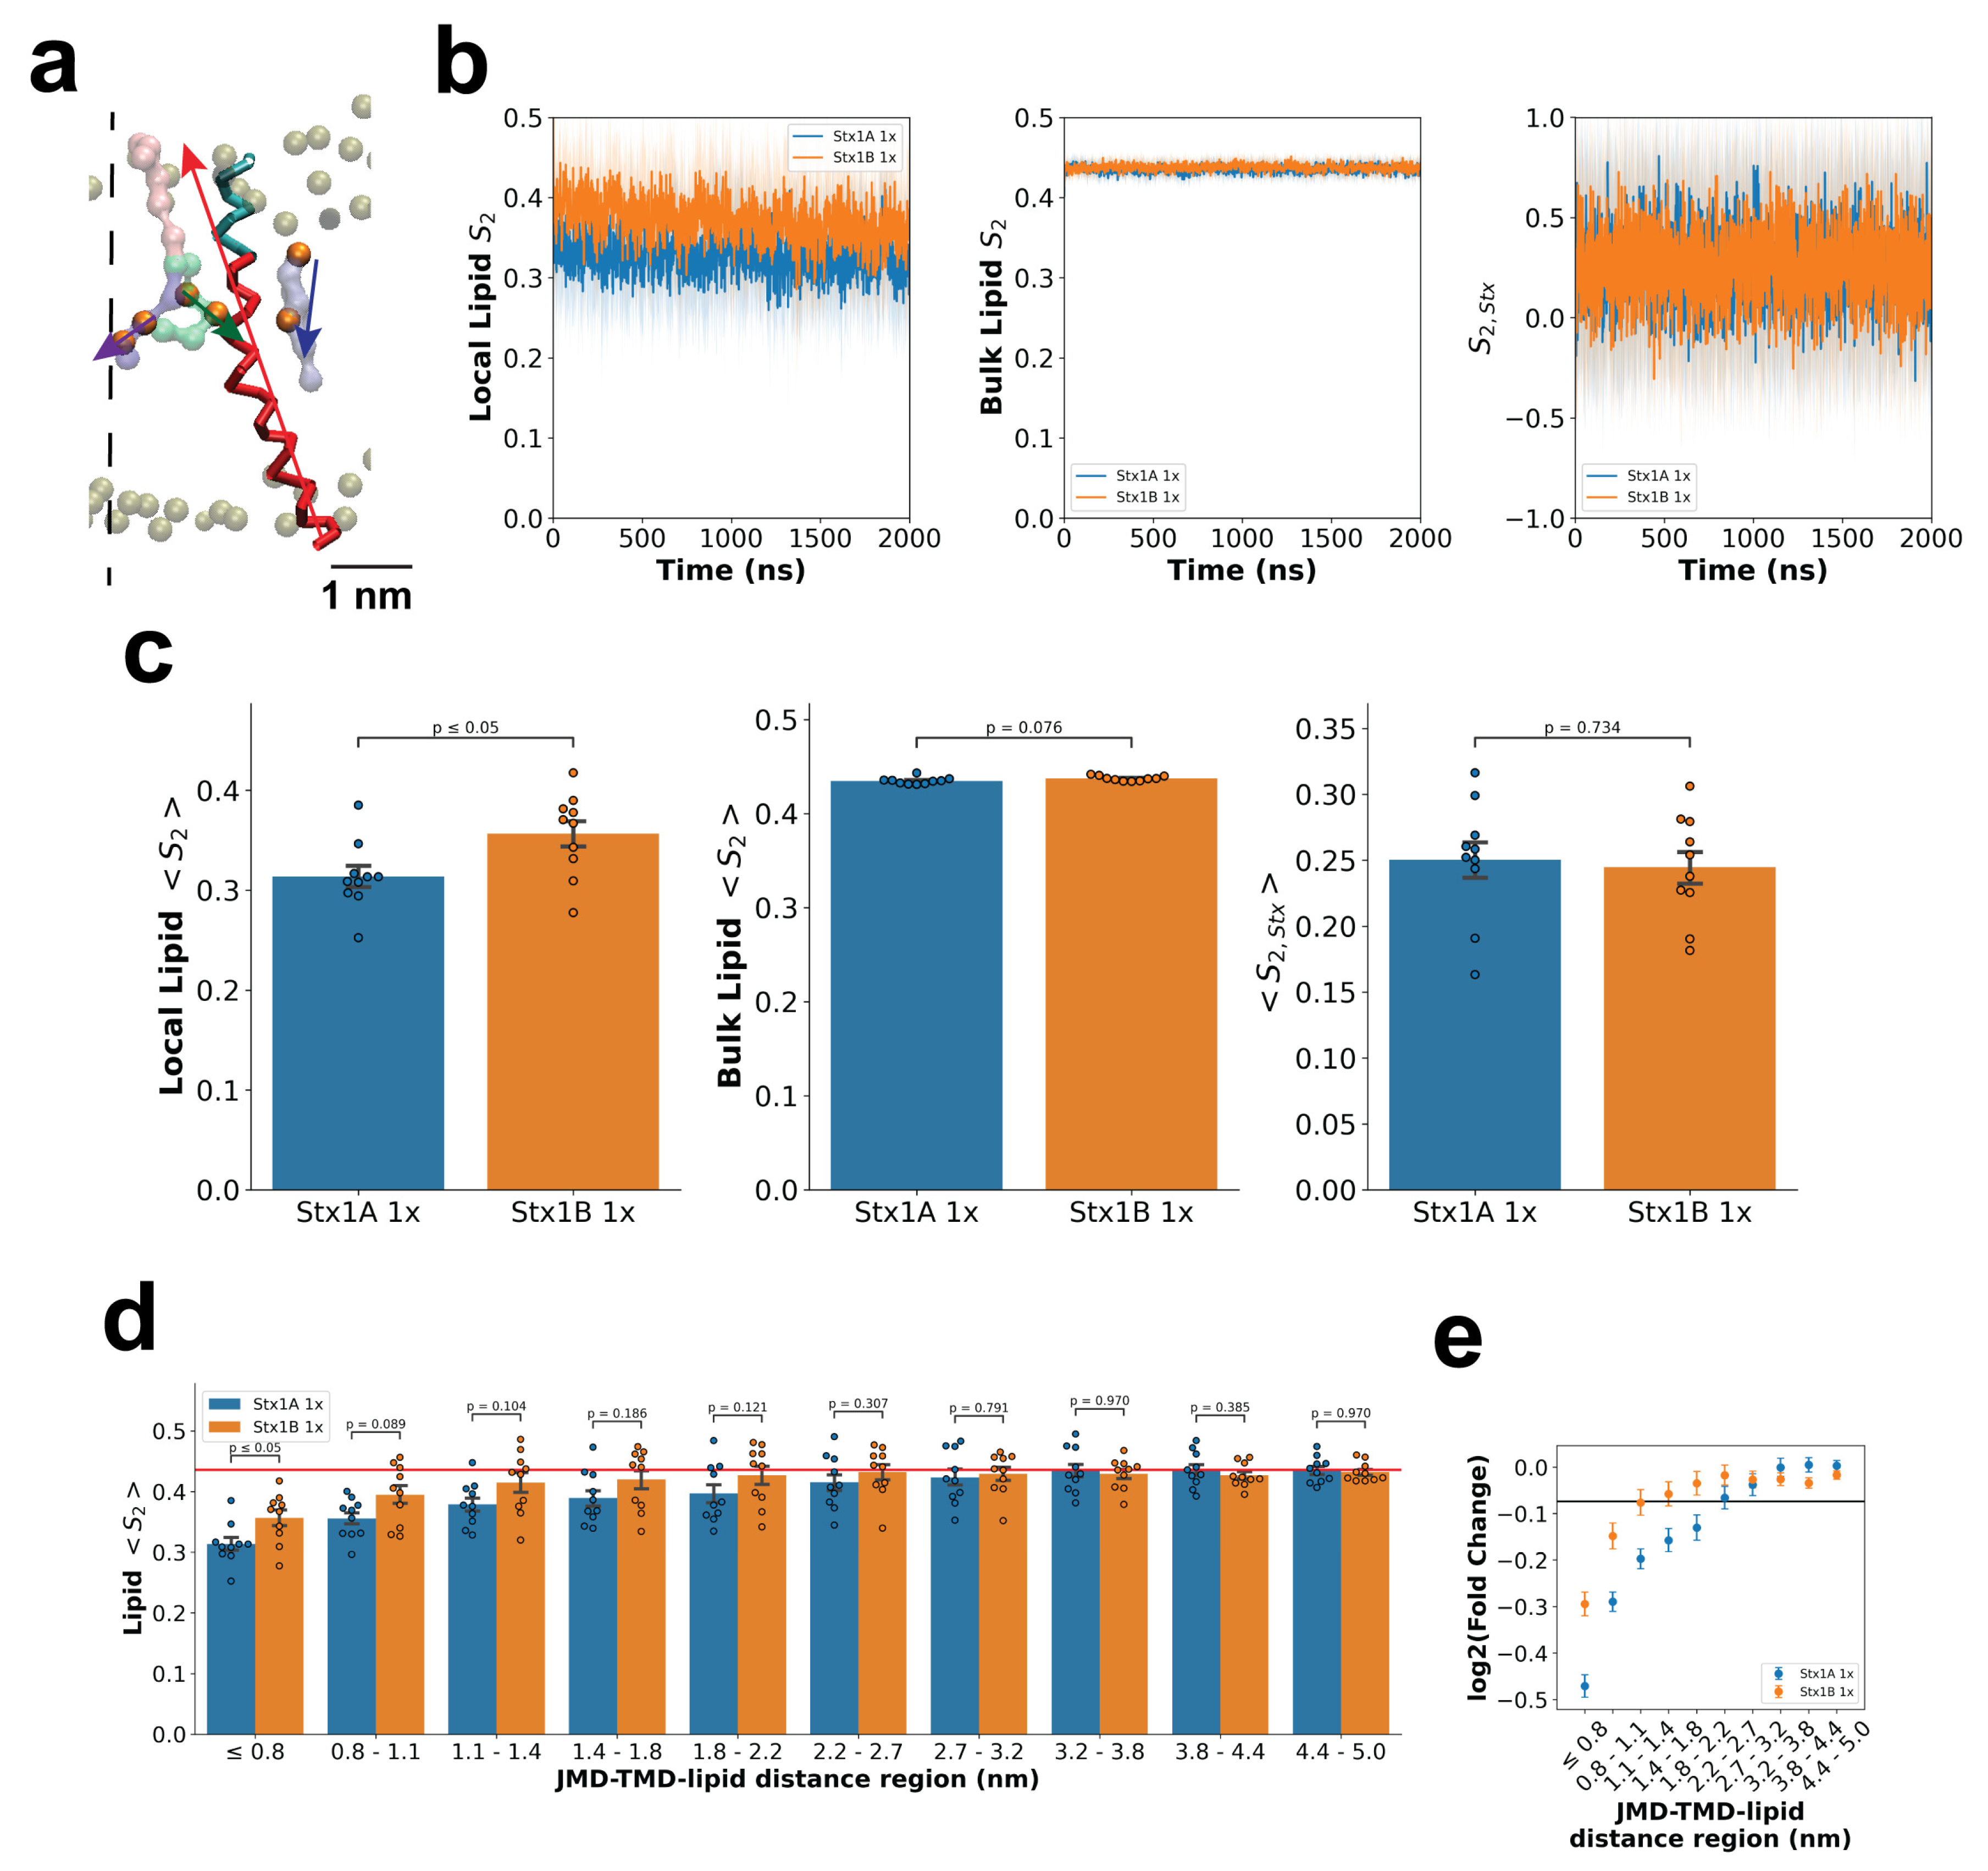
Figure 2.
Palmitoylation and PIP2 depletion primarily alter the spatial extent rather than the magnitude of Stx1-induced lipid disorder. (a) Average local lipid order parameters of Stx-bound lipids calculated from the final 100 ns of the simulations. (b) Average Stx1 TMD tilting order parameters calculated from the final 100 ns of the simulations. Individual dots represent values from independent simulations. P values in (a, b) were calculated using the Mann–Whitney U test. All statistics are provided in Table S1. (c) Log2(fold change) of local lipid order parameters relative to bulk membrane values as a function of radial distance from the Stx1 JMD–TMD region, calculated from the final 100 ns of all n = 10 simulations. Palmitoylation reduced the radial extent of detectable lipid disorder surrounding Stx1A from ~3.8 nm to ~2.2 nm but produced little effect on Stx1B. In contrast, PIP2 depletion expanded the radial extent of lipid disorder to ~3.2 nm for Stx1B but not Stx1A. The black horizontal line indicates the average of S2 is 95% of the bulk membrane lipid order parameters. All statistics are provided in Table S3. Error bars: mean ± SEM.
Figure 2.
Palmitoylation and PIP2 depletion primarily alter the spatial extent rather than the magnitude of Stx1-induced lipid disorder. (a) Average local lipid order parameters of Stx-bound lipids calculated from the final 100 ns of the simulations. (b) Average Stx1 TMD tilting order parameters calculated from the final 100 ns of the simulations. Individual dots represent values from independent simulations. P values in (a, b) were calculated using the Mann–Whitney U test. All statistics are provided in Table S1. (c) Log2(fold change) of local lipid order parameters relative to bulk membrane values as a function of radial distance from the Stx1 JMD–TMD region, calculated from the final 100 ns of all n = 10 simulations. Palmitoylation reduced the radial extent of detectable lipid disorder surrounding Stx1A from ~3.8 nm to ~2.2 nm but produced little effect on Stx1B. In contrast, PIP2 depletion expanded the radial extent of lipid disorder to ~3.2 nm for Stx1B but not Stx1A. The black horizontal line indicates the average of S2 is 95% of the bulk membrane lipid order parameters. All statistics are provided in Table S3. Error bars: mean ± SEM.
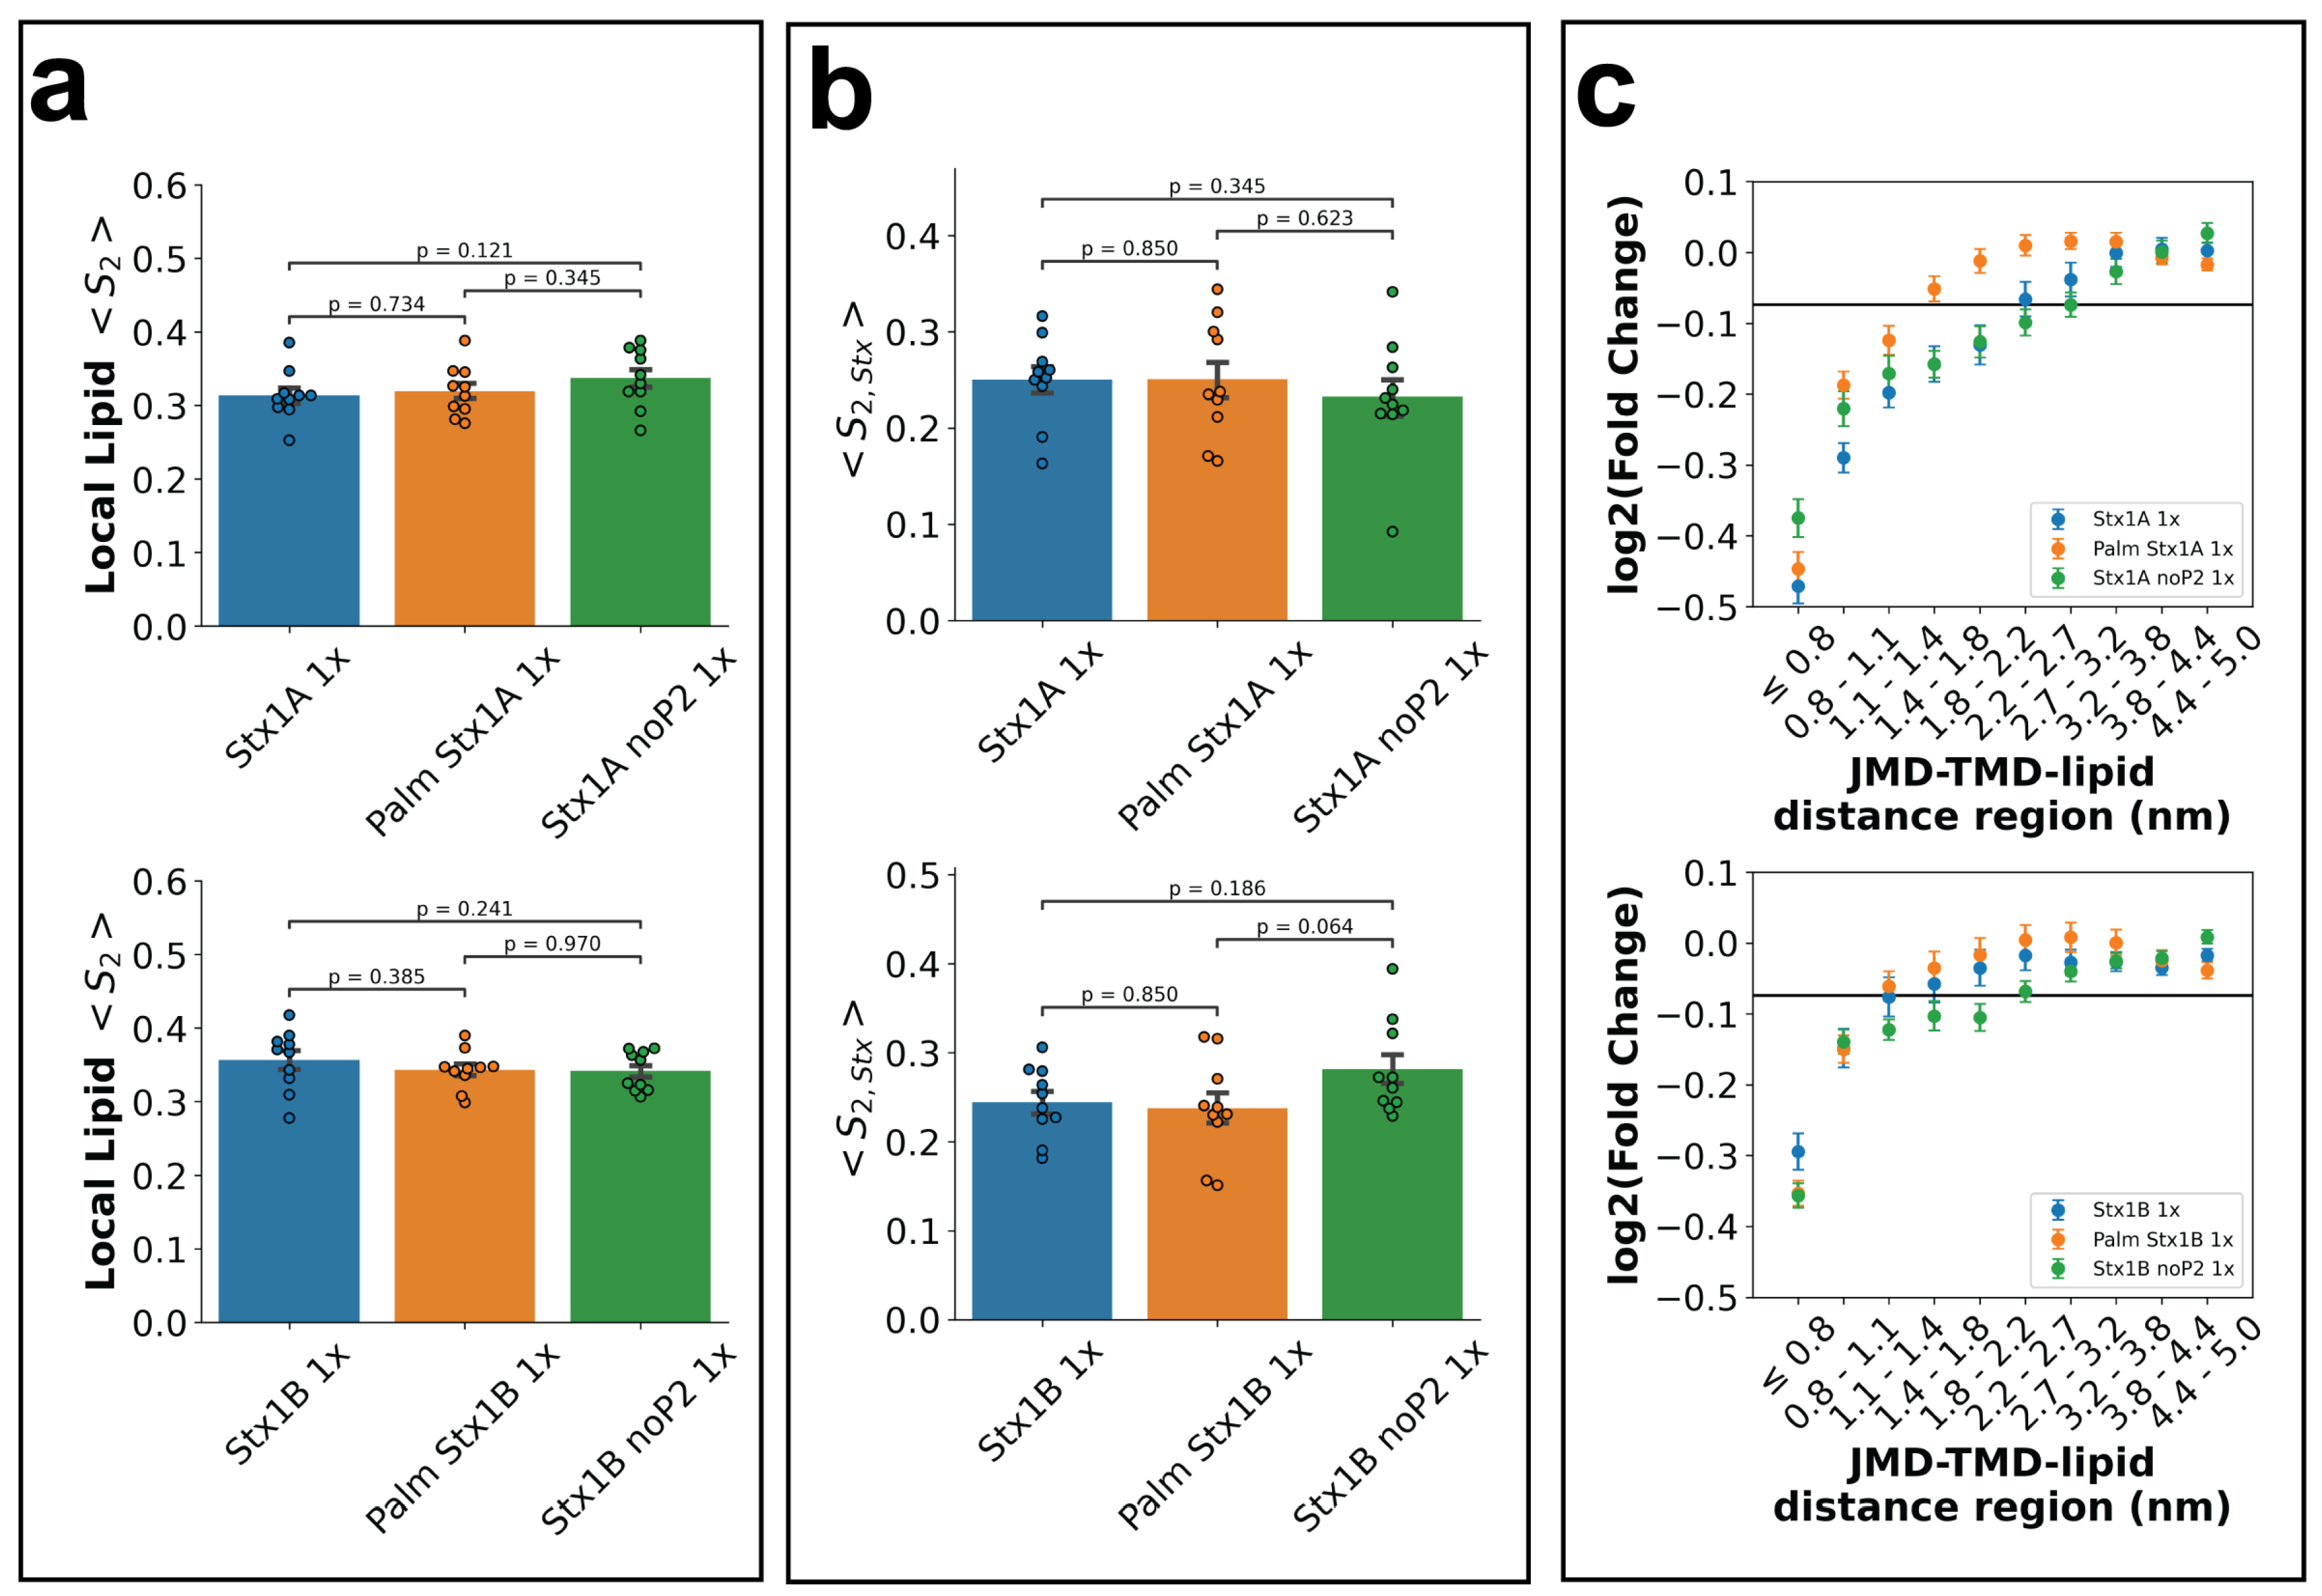
Figure 3.
Stx1 JMD–TMD fragments spontaneously assemble into dynamic oligomeric clusters. (a) Initial configurations of systems containing 2, 4, 6, and 8 copies of Stx1A JMD–TMD embedded in ~20 × 20 nm² plasma membrane models. Proteins were initially distributed within a circular region (~6 nm diameter) to facilitate observation of clustering dynamics while avoiding immediate formation of large oligomers. Red: Stx1A JMD–TMD; brown: lipid phosphate (PO4) beads. (b) Representative clustering trajectory from a simulation containing 10 copies of Stx1A JMD–TMD. Pairs of Stx1 JMD–TMDs were considered connected when the minimum backbone pairwise distance was ≤1.0 nm. Clusters identified from these pairwise contacts are outlined, and numbers indicate cluster size. Additional clustering dynamics are shown in Movie S1. (c) Time courses of the fraction of Stx1 JMD–TMD molecules participating in clusters , the maximum cluster size , and the mean cluster size for the simulation shown in (b). Scale bars: 5 nm.
Figure 3.
Stx1 JMD–TMD fragments spontaneously assemble into dynamic oligomeric clusters. (a) Initial configurations of systems containing 2, 4, 6, and 8 copies of Stx1A JMD–TMD embedded in ~20 × 20 nm² plasma membrane models. Proteins were initially distributed within a circular region (~6 nm diameter) to facilitate observation of clustering dynamics while avoiding immediate formation of large oligomers. Red: Stx1A JMD–TMD; brown: lipid phosphate (PO4) beads. (b) Representative clustering trajectory from a simulation containing 10 copies of Stx1A JMD–TMD. Pairs of Stx1 JMD–TMDs were considered connected when the minimum backbone pairwise distance was ≤1.0 nm. Clusters identified from these pairwise contacts are outlined, and numbers indicate cluster size. Additional clustering dynamics are shown in Movie S1. (c) Time courses of the fraction of Stx1 JMD–TMD molecules participating in clusters , the maximum cluster size , and the mean cluster size for the simulation shown in (b). Scale bars: 5 nm.
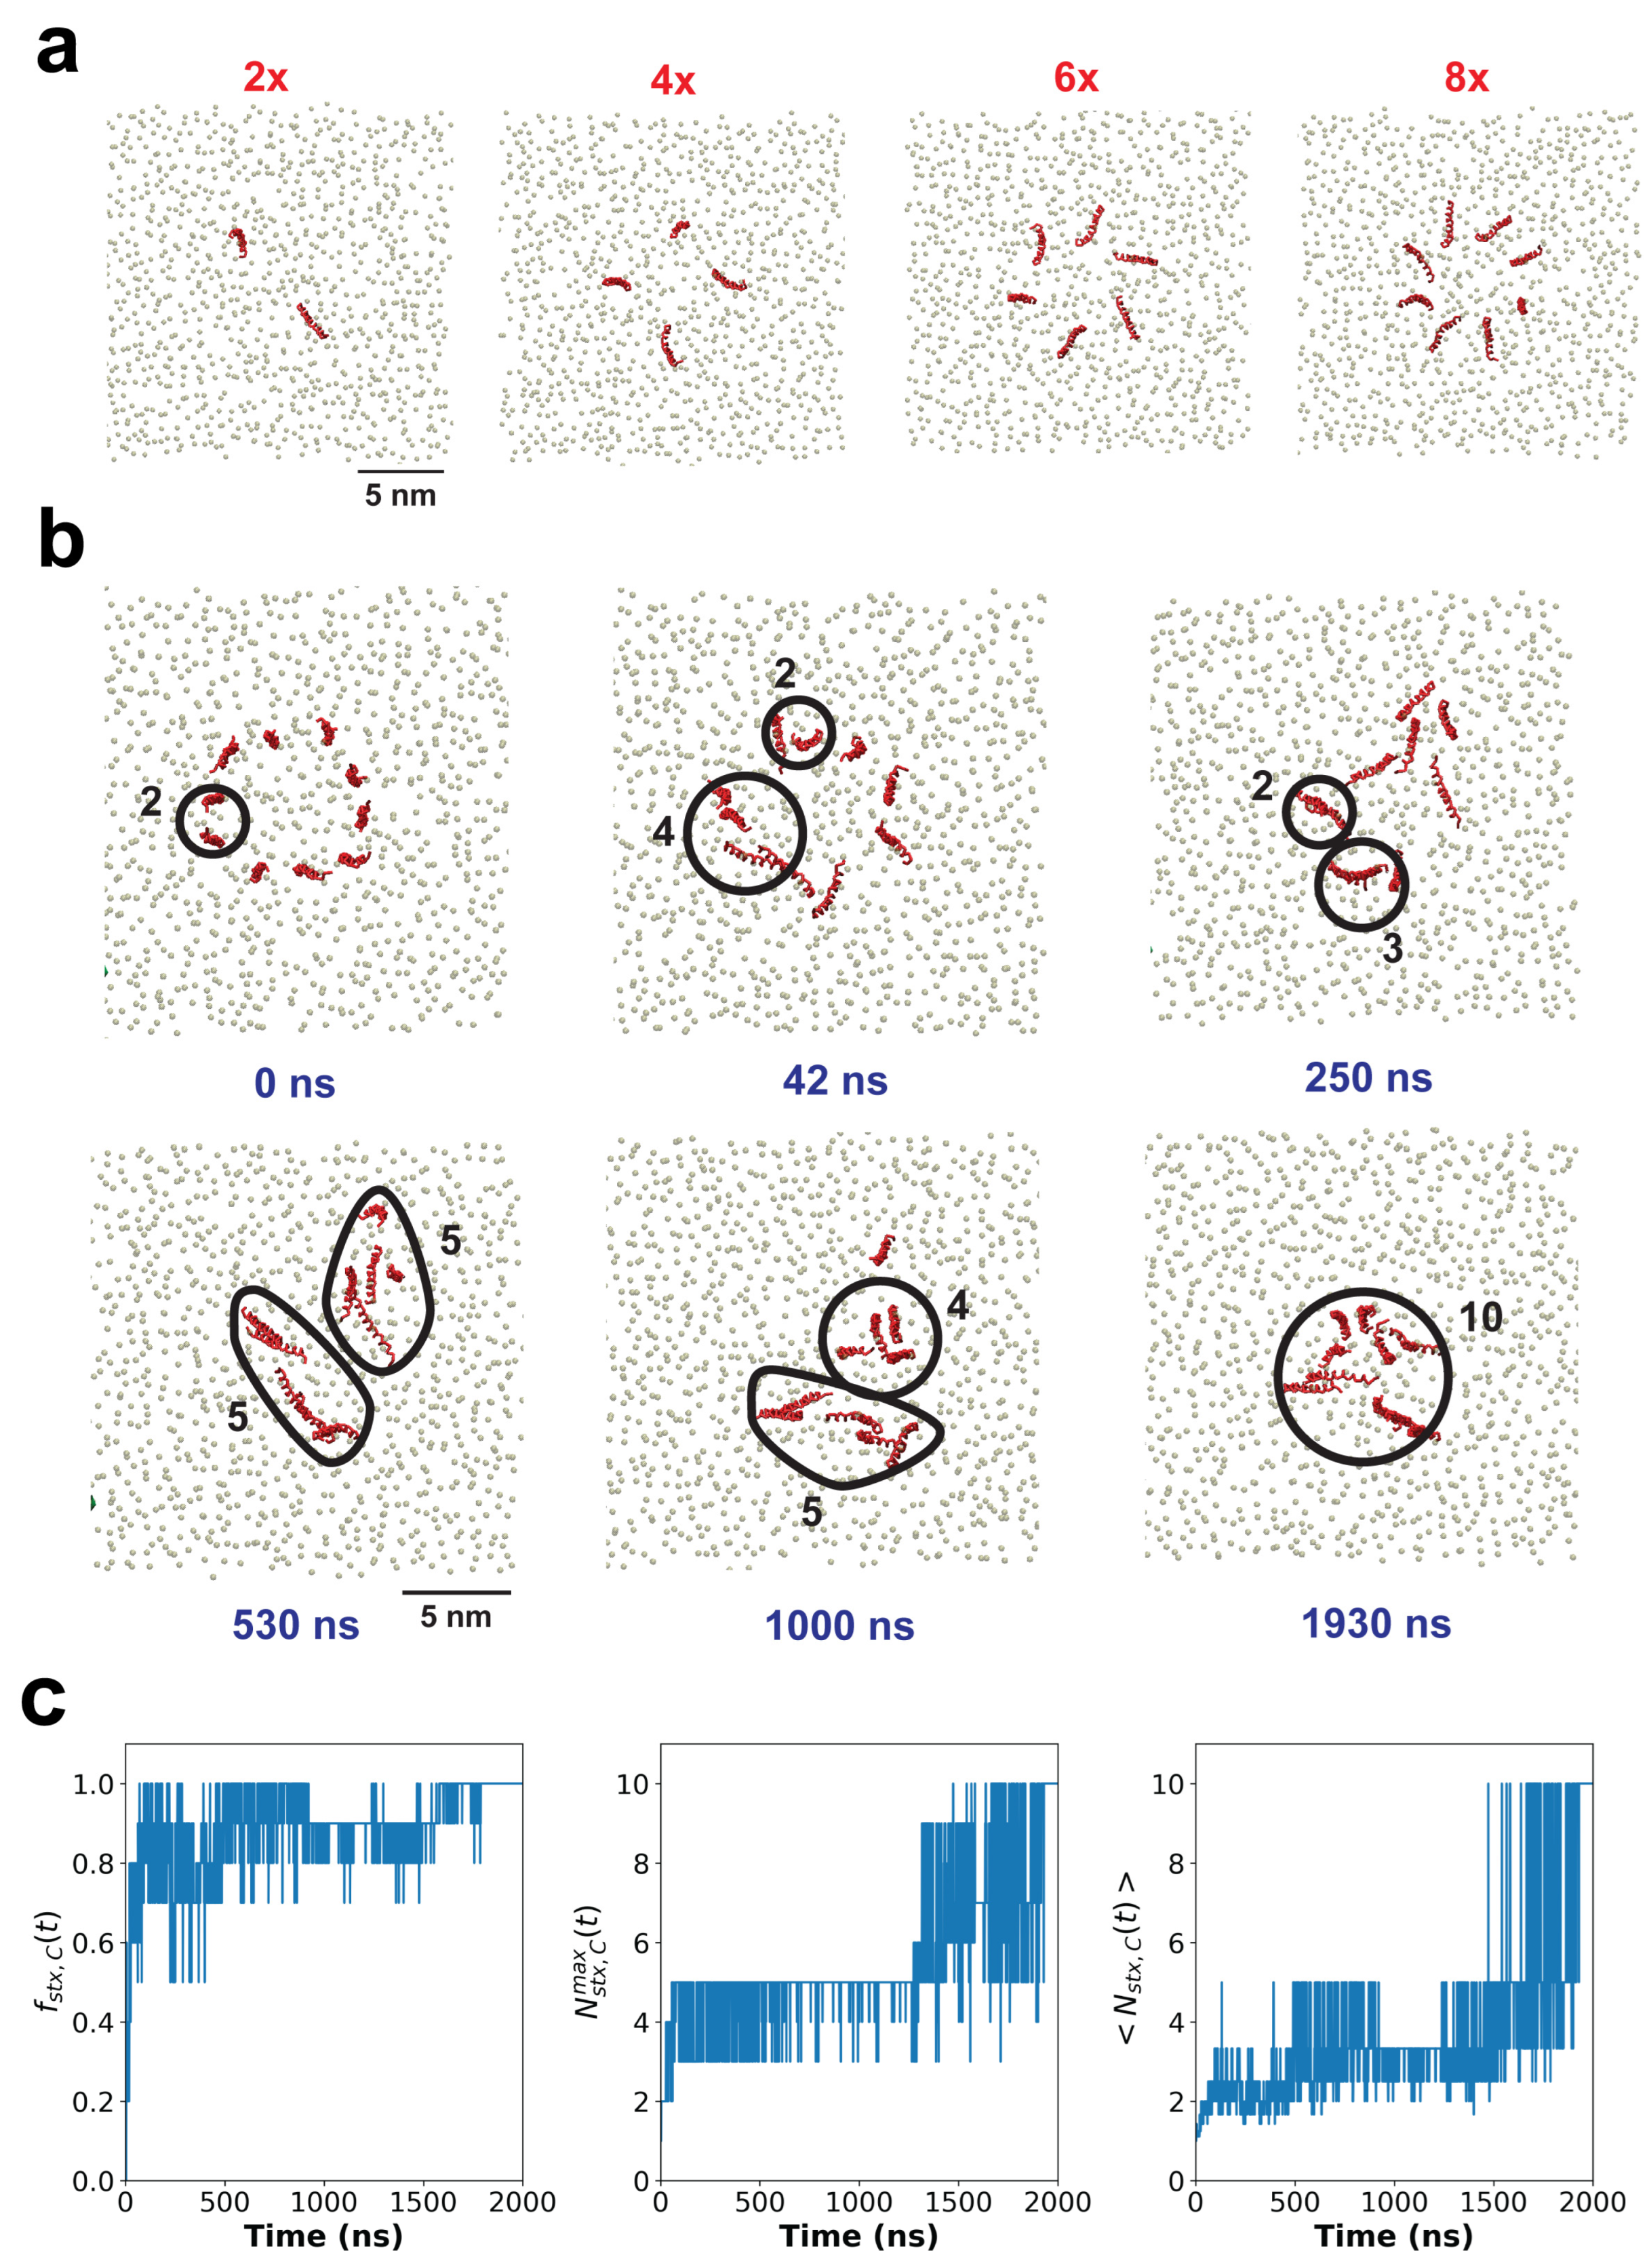
Figure 4.
Stx1 JMD–TMD clustering increases with protein density. (a) Average trajectories from n = 10 simulations showing the fraction of Stx1 JMD–TMD molecules participating in clusters , the maximum cluster size , and the mean cluster size for systems containing 2, 4, 6, 8, and 10 copies of Stx1A or Stx1B. Higher-order oligomerization emerged when at least four copies of Stx1 JMD–TMD were present in the membrane. Cluster growth proceeded progressively through hierarchical assembly of smaller oligomers. Shaded regions indicate mean ± SD. (b) Final values of the fraction of Stx1 molecules participating in clusters, maximum cluster size, and mean cluster size calculated from the last 100 ns of n = 10 simulations. Individual dots represent independent simulations. Error bars: mean ± SEM. P values were calculated using the Mann–Whitney U test. All statistics are provided in Table S4.
Figure 4.
Stx1 JMD–TMD clustering increases with protein density. (a) Average trajectories from n = 10 simulations showing the fraction of Stx1 JMD–TMD molecules participating in clusters , the maximum cluster size , and the mean cluster size for systems containing 2, 4, 6, 8, and 10 copies of Stx1A or Stx1B. Higher-order oligomerization emerged when at least four copies of Stx1 JMD–TMD were present in the membrane. Cluster growth proceeded progressively through hierarchical assembly of smaller oligomers. Shaded regions indicate mean ± SD. (b) Final values of the fraction of Stx1 molecules participating in clusters, maximum cluster size, and mean cluster size calculated from the last 100 ns of n = 10 simulations. Individual dots represent independent simulations. Error bars: mean ± SEM. P values were calculated using the Mann–Whitney U test. All statistics are provided in Table S4.
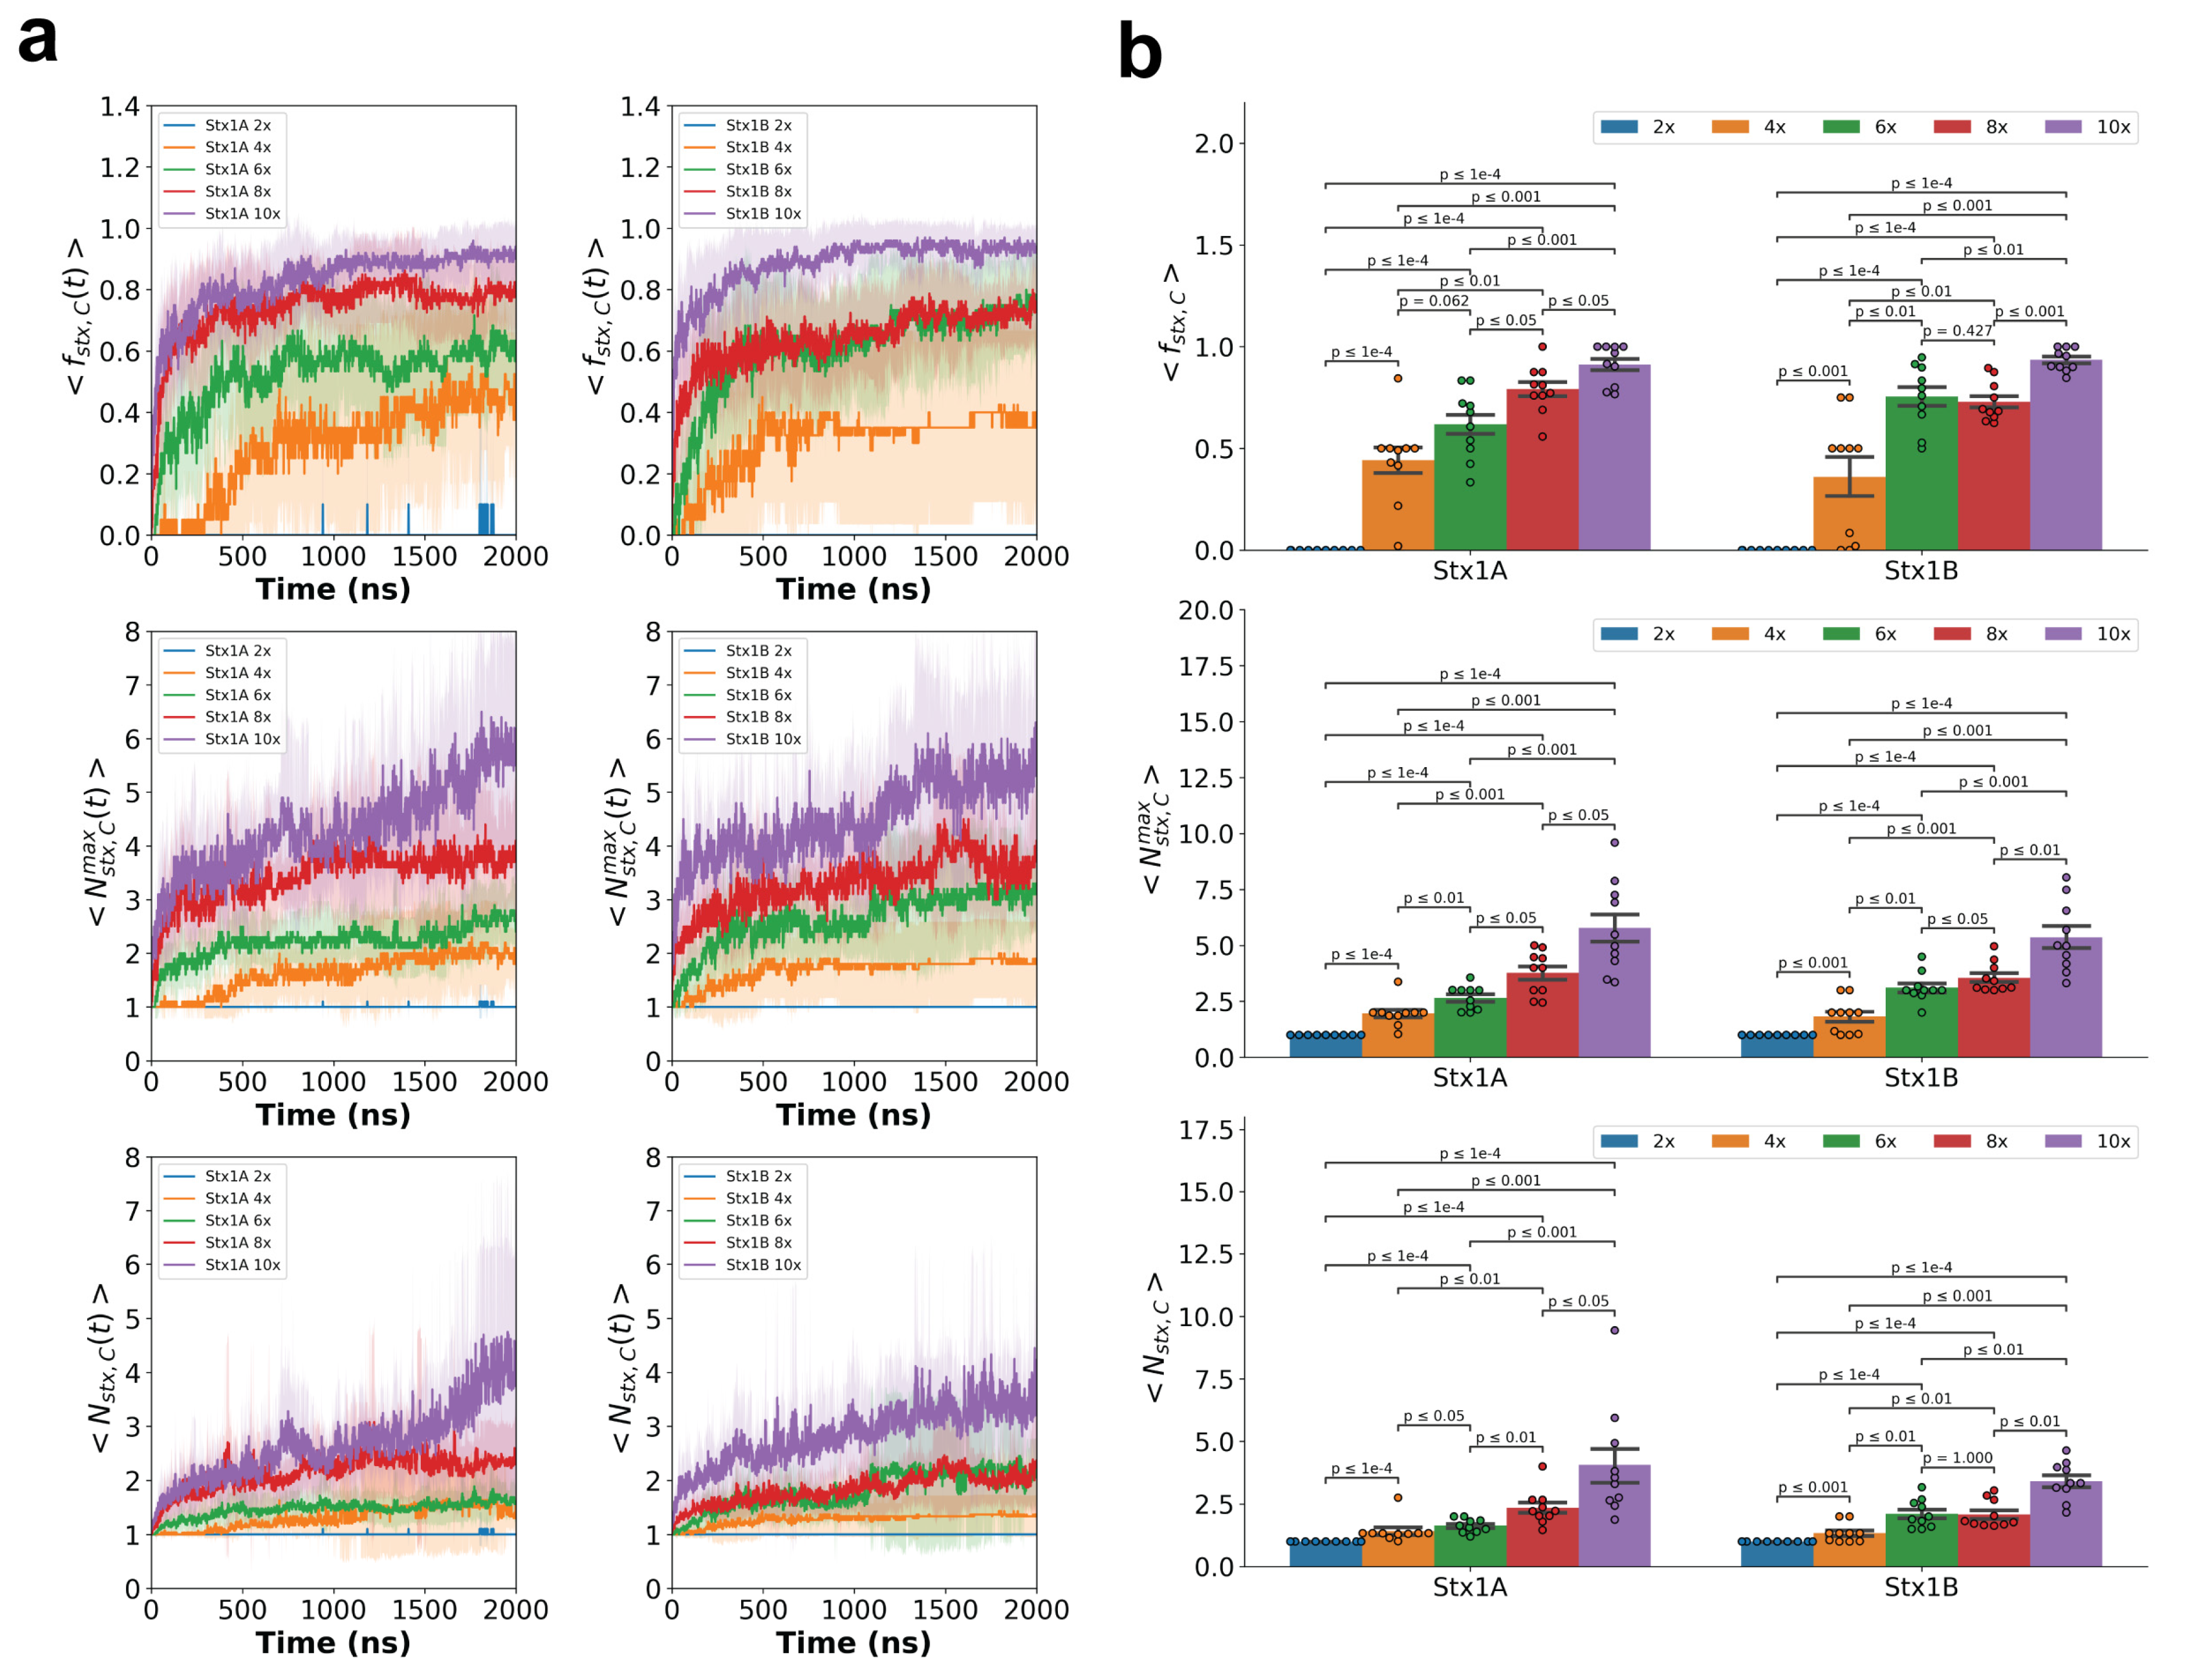
Figure 5.
Palmitoylation and PIP2 depletion limit formation of higher-order Stx1 clusters. (a) Representative final clustering states of simulations containing 10 copies of palmitoylated Stx1A (Palm Stx1A) or Stx1A in PIP2-depleted membranes (Stx1A noP2). Red: Stx1 JMD–TMD; brown: lipid phosphate (PO4) beads; gray: palmitoyl chains. Scale bar: 5 nm. For more visualization, please see movie S2 and movie S3. (b) Average trajectories from n = 10 simulations showing the fraction of Stx1 molecules participating in clusters , the maximum cluster size , and the mean cluster size , for systems containing 2, 4, 6, 8, and 10 copies of Palm Stx1A or Stx1A in PIP2-depleted membranes. Shaded regions indicate mean ± SD. (c, d) Final values of the fraction of Stx1 molecules participating in clusters, maximum cluster size, and mean cluster size calculated from the final 100 ns of n = 10 simulations for Stx1A (c) and Stx1B (d). Individual dots represent independent simulations. Error bars indicate mean ± SEM. P values were calculated using the Mann–Whitney U test. All statistics are provided in Table S4.
Figure 5.
Palmitoylation and PIP2 depletion limit formation of higher-order Stx1 clusters. (a) Representative final clustering states of simulations containing 10 copies of palmitoylated Stx1A (Palm Stx1A) or Stx1A in PIP2-depleted membranes (Stx1A noP2). Red: Stx1 JMD–TMD; brown: lipid phosphate (PO4) beads; gray: palmitoyl chains. Scale bar: 5 nm. For more visualization, please see movie S2 and movie S3. (b) Average trajectories from n = 10 simulations showing the fraction of Stx1 molecules participating in clusters , the maximum cluster size , and the mean cluster size , for systems containing 2, 4, 6, 8, and 10 copies of Palm Stx1A or Stx1A in PIP2-depleted membranes. Shaded regions indicate mean ± SD. (c, d) Final values of the fraction of Stx1 molecules participating in clusters, maximum cluster size, and mean cluster size calculated from the final 100 ns of n = 10 simulations for Stx1A (c) and Stx1B (d). Individual dots represent independent simulations. Error bars indicate mean ± SEM. P values were calculated using the Mann–Whitney U test. All statistics are provided in Table S4.
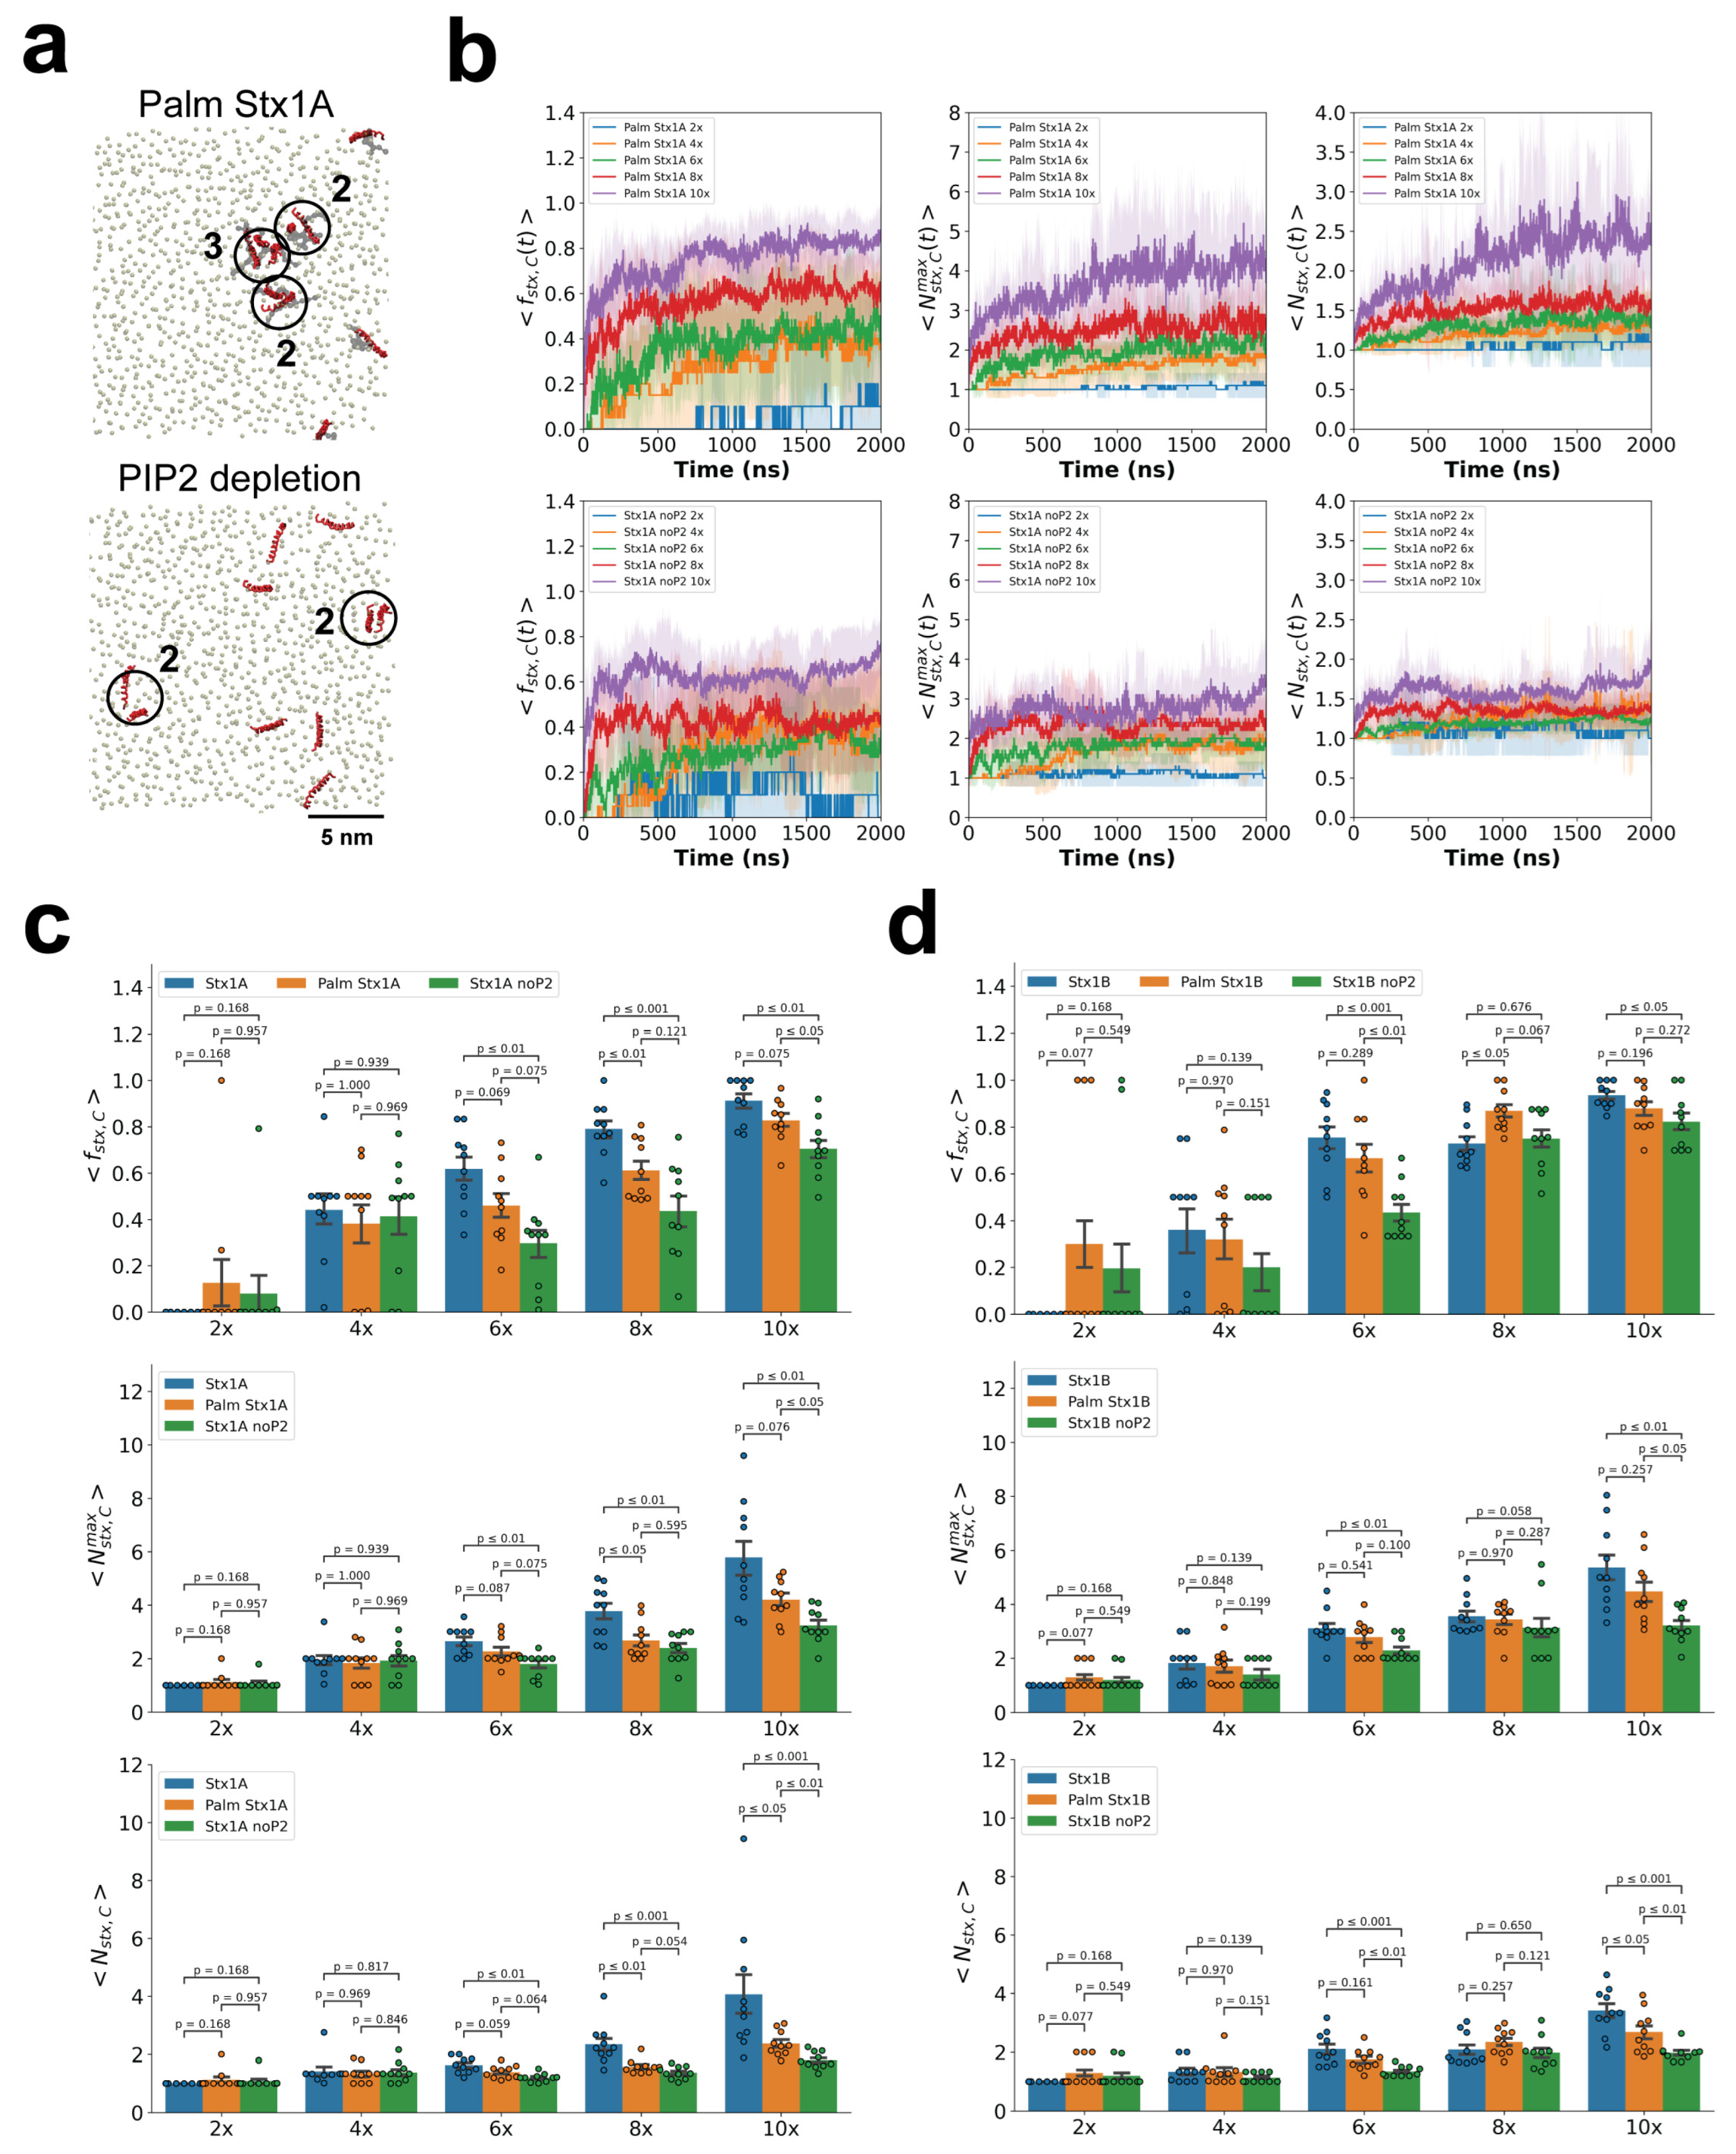
Figure 6.
Lipid disorder induced by individual Stx1 JMD–TMD regions is largely independent of protein copy number. (a) Final local lipid order parameters surrounding Stx1A and Stx1B JMD–TMD regions in systems containing 1, 2, 4, 6, 8, or 10 copies of Stx1 fragments. Values were calculated from the final 100 ns of n = 10 simulations. Increasing Stx1 copy number produced only minor changes in local lipid disorder. (b) Final Stx1 TMD tilting order parameters for the corresponding systems. TMD tilt remained largely unchanged across different protein copy numbers. Individual dots represent independent simulations. P values were calculated using the Mann–Whitney U test.
Figure 6.
Lipid disorder induced by individual Stx1 JMD–TMD regions is largely independent of protein copy number. (a) Final local lipid order parameters surrounding Stx1A and Stx1B JMD–TMD regions in systems containing 1, 2, 4, 6, 8, or 10 copies of Stx1 fragments. Values were calculated from the final 100 ns of n = 10 simulations. Increasing Stx1 copy number produced only minor changes in local lipid disorder. (b) Final Stx1 TMD tilting order parameters for the corresponding systems. TMD tilt remained largely unchanged across different protein copy numbers. Individual dots represent independent simulations. P values were calculated using the Mann–Whitney U test.
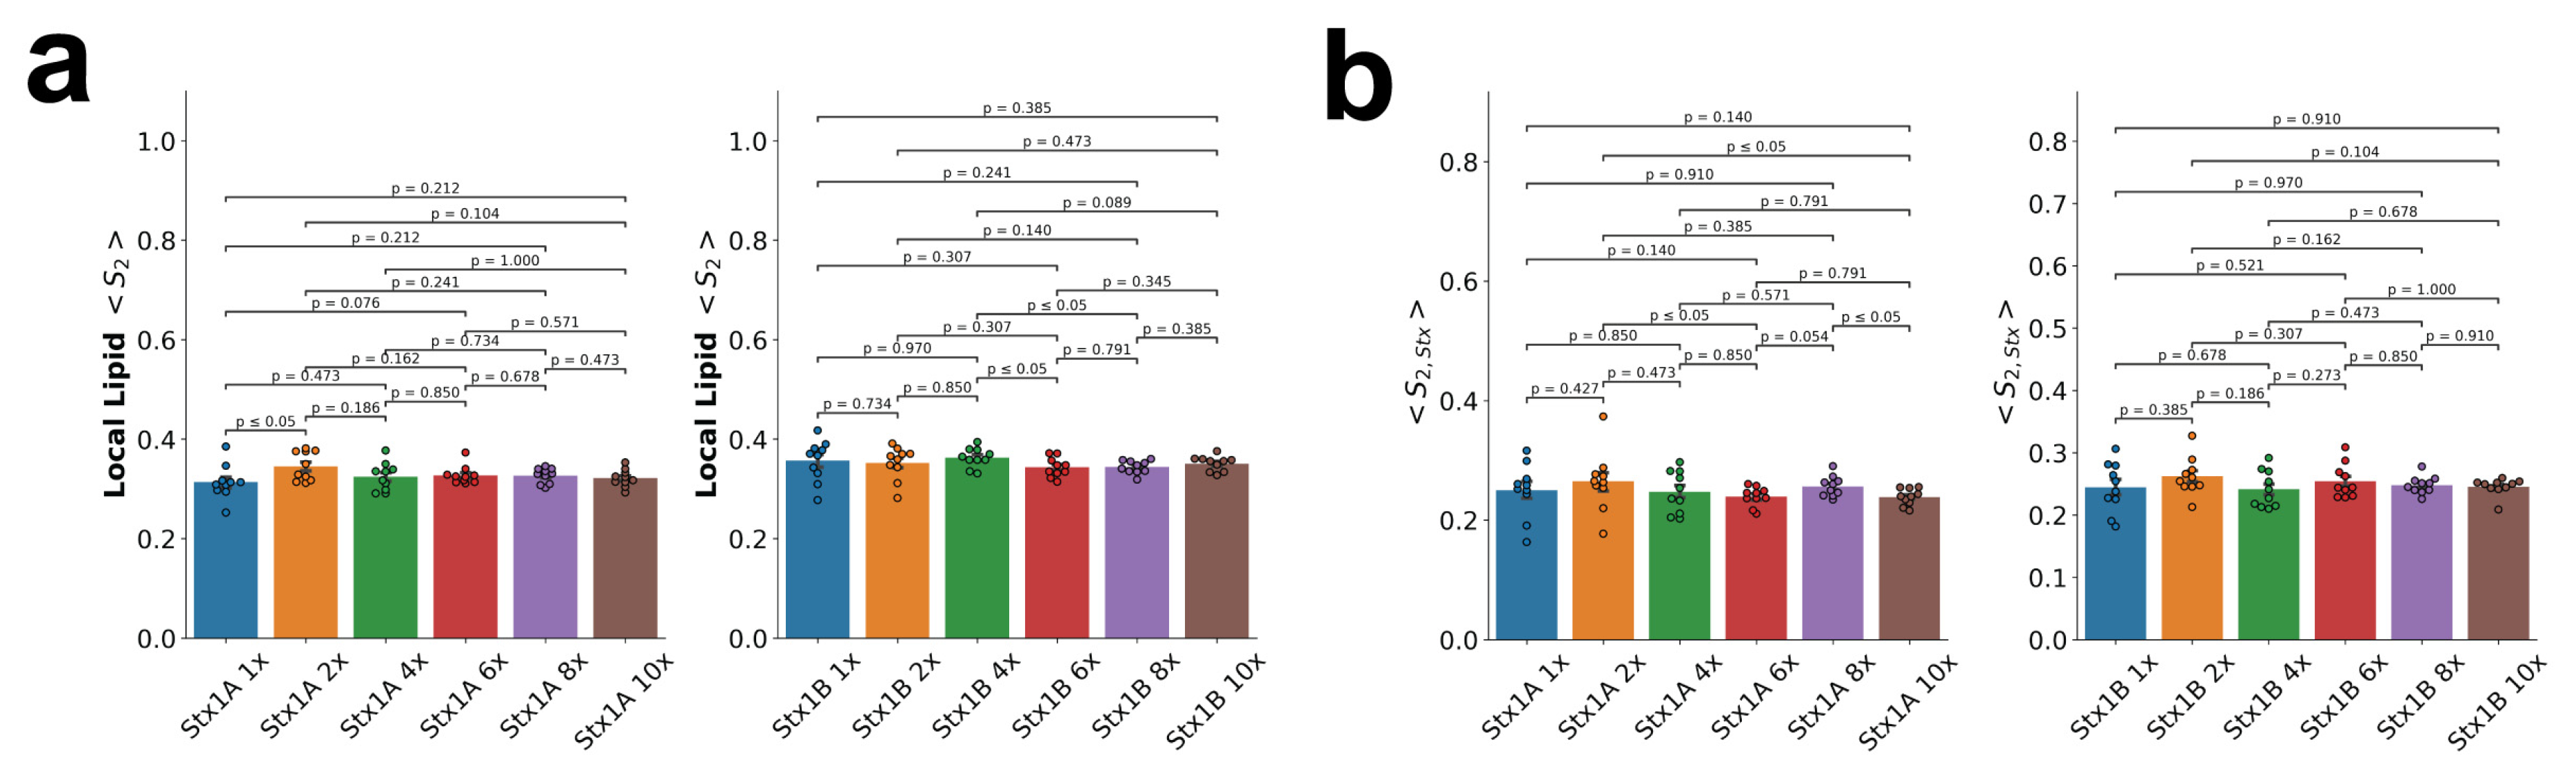
Figure 7.
Clustering promotes overlap of local membrane perturbation fields generated by Stx1 JMD–TMD regions. (a) Representative lipid-disorder heatmaps from a simulation containing 10 copies of Stx1A JMD–TMD. The snapshots correspond to the frames shown in Figure 4B. Black crosses indicate the center-of-mass positions of individual Stx1A JMD–TMD regions. Dash circles: lipid disorder regions. As Stx1A molecules progressively assemble into oligomeric clusters, their localized membrane perturbation fields increasingly overlap, resulting in the emergence of a confined membrane disorder zone marked by the red dash circle. All heatmaps are displayed using the same color scale. Lipid disorder was calculated as 1−S2 using a 20 ns rolling average (±10 ns around each frame), and only lipids located within 10 nm of the center of mass of the 10 Stx1A JMD–TMD molecules were included. (b) Radial profiles of membrane lipid disorder for increasing copy numbers of Stx1A, palmitoylated Stx1A, PIP2-depleted Stx1A, Stx1B, palmitoylated Stx1B, and PIP2-depleted Stx1B. Increasing protein density progressively shortens the apparent spatial extent of membrane perturbation, consistent with increasing overlap of neighboring perturbation fields rather than an increase in the magnitude of local lipid disorder. Error bars represent SEM. Increasing protein density progressively confines membrane perturbation into a localized disorder zone through spatial overlap of neighboring perturbation fields, rather than through cooperative amplification of membrane disorder around individual Stx molecules.
Figure 7.
Clustering promotes overlap of local membrane perturbation fields generated by Stx1 JMD–TMD regions. (a) Representative lipid-disorder heatmaps from a simulation containing 10 copies of Stx1A JMD–TMD. The snapshots correspond to the frames shown in Figure 4B. Black crosses indicate the center-of-mass positions of individual Stx1A JMD–TMD regions. Dash circles: lipid disorder regions. As Stx1A molecules progressively assemble into oligomeric clusters, their localized membrane perturbation fields increasingly overlap, resulting in the emergence of a confined membrane disorder zone marked by the red dash circle. All heatmaps are displayed using the same color scale. Lipid disorder was calculated as 1−S2 using a 20 ns rolling average (±10 ns around each frame), and only lipids located within 10 nm of the center of mass of the 10 Stx1A JMD–TMD molecules were included. (b) Radial profiles of membrane lipid disorder for increasing copy numbers of Stx1A, palmitoylated Stx1A, PIP2-depleted Stx1A, Stx1B, palmitoylated Stx1B, and PIP2-depleted Stx1B. Increasing protein density progressively shortens the apparent spatial extent of membrane perturbation, consistent with increasing overlap of neighboring perturbation fields rather than an increase in the magnitude of local lipid disorder. Error bars represent SEM. Increasing protein density progressively confines membrane perturbation into a localized disorder zone through spatial overlap of neighboring perturbation fields, rather than through cooperative amplification of membrane disorder around individual Stx molecules.
Disclaimer/Publisher’s Note: The statements, opinions and data contained in all publications are solely those of the individual author(s) and contributor(s) and not of MDPI and/or the editor(s). MDPI and/or the editor(s) disclaim responsibility for any injury to people or property resulting from any ideas, methods, instructions or products referred to in the content. |
© 2026 by the authors. Licensee MDPI, Basel, Switzerland. This article is an open access article distributed under the terms and conditions of the Creative Commons Attribution (CC BY) license (http://creativecommons.org/licenses/by/4.0/).
Copyright: This open access article is published under a Creative Commons CC BY 4.0 license, which permit the free download, distribution, and reuse, provided that the author and preprint are cited in any reuse.


