

Submitted:
01 July 2026
Posted:
02 July 2026
You are already at the latest version
Abstract
Commercial format diversity serves as a key indicator reflecting the health and resilience of the commercial structure in rail transit station areas. This study focuses on the rail transit station areas in Shanghai, integrates multi-source geospatial data with Partial Least Squares Structural Equation Modeling (PLS-SEM), and systematically examines the differential influence paths of six categories of factors—urban form, location, facility configuration, passenger flow, land rent, and commercial spatial form—on commercial format diversity between urban core and suburban areas. Multi-group analysis (MGA) is further used to test whether path coefficients differ across concentric zones around stations. The findings are as follows: (1)Passenger flow characteristics are the primary determinant of commercial format diversity and serve as a key mediator through which most other factors (except location) exert their effects. Location characteristics, particularly the distance to the rail transit station, primarily play a moderating role. Urban form characteristics function as the “spatial framework” providing a fundamental regulatory influence, with significant interaction effects with station distance. (2)In urban core areas, the temporal rhythm of passenger flow dominates: weekday passenger flow positively influences commercial evenness, while weekend passenger flow exacerbates uneven distribution, forming a self-balancing regulatory network. In suburban areas, an initial increase followed by a decrease is observed, with an “optimal synergistic zone” existing approximately 600–1000 m from stations where rail transit and other public service facilities jointly promote commercial format diversity. (3)Land rent mainly affects the number of format categories rather than their evenness or dominance. These findings reveal systematic differences in the influence paths of commercial format diversity between urban core and suburban rail transit station areas, as well as the distance-dependent zonal variation patterns of these effects, providing empirical evidence for differentiated spatial design in the context of station-city integration.
Keywords:
urban rail transit
; station-city integration
; commercial formats
; diversity
; influence pathway
1. Introduction
The relationship between urban rail transit and the everyday life of urban residents has long been a central topic in urban studies, planning, and design. Since the 1990s, the concept of transit-oriented development (TOD) has advocated an urban development model that organically integrates transit hubs with employment, commercial, residential, and other functions [1]. In East Asia, rail transit stations have gradually evolved from single-purpose transport nodes toward station-building integration, station-city integration, and even station-city-people integration [2]. The integration of rail transit and urban life has shifted from an initial emphasis on transport efficiency to a deeper concern with human activity patterns and quality of life. In this process, commercial space in rail transit station areas serves as a key carrier through which transit stations and urban functions are deeply integrated, undertaking the important task of efficiently transforming high-capacity passenger flows into sustainable commercial flows and daily-life flows [3,4,5]. However, the key to this transformation is not simply to increase commercial floor area, but to build a healthy, diverse, and resilient commercial format structure. Before and after the opening of rail transit, commercial types in station areas usually undergo self-organized adjustment, and this process varies markedly across central, suburban, community-oriented, and other types of station areas [6]. When the adjustment of commercial outlets in station areas lags behind and fails to match commercial rents and passenger flows, problems such as low conversion efficiency from passenger flow to commercial consumption and low occupancy rates in shopping centers may arise. It is therefore necessary to examine the mechanisms shaping the commercial format structure of station-area commerce.
Since the beginning of the twenty-first century, large-scale urban expansion and urban rail transit construction in China have advanced simultaneously in megacities and large cities. By the end of 2025, 54 Chinese cities had opened 343 urban rail transit lines, with a total operating mileage of 11,710.3 km, and 15 cities had operating mileage exceeding 300 km. In these cities, rail transit has become deeply embedded in residents’ daily lives and has become a key force reshaping urban spatial structure and commercial patterns. Shanghai began constructing its modern rail transit system as early as 1990 and started exploring TOD-oriented development in the late 1990s. It currently operates 21 lines, with a total operating mileage of 906 km, 523 stations, and an annual average daily passenger volume of 10.15 million, placing both its network scale and passenger flow among the largest worldwide. At present, urban development in China is shifting from large-scale construction toward refined operation and sustainable value extraction [7,8], and commercial development in urban rail transit station areas has attracted extensive attention from government, academia, and the market. Owing to the scale and complexity of its rail transit network, Shanghai provides an ideal empirical setting for studying station-area commerce in Chinese cities and offers insights for TOD development in other high-density urban contexts worldwide.
Among the multiple dimensions used to characterize the structure of commercial types, commercial format diversity—namely, the richness and distributional balance of commercial formats within a station area—is a fundamental attribute of the commercial structure and an important indicator of the health and resilience of the commercial ecosystem. Taking rail transit station areas in Shanghai as the research object, this study systematically analyzes the influencing factors, influence pathways, and distance-based zonal differences of commercial format diversity in station areas, thereby providing an empirical basis for understanding the formation and evolution mechanisms of station-area commercial format diversity and offering evidence for the design and optimization of station-area commercial space.
2. Materials and Methods
2.1. Study Area and Research Hypotheses
The spatial boundary of a rail station influence area can be defined in multiple ways. The influence of rail transit stations on residential prices generally does not exceed 2 miles (approximately 3.22 km), whereas the premium effect on commercial real estate is usually limited to a range of 400-800 m [9]. Considering residents’ willingness to walk to and from rail transit stations, this study takes the area within 3 km around stations as the research scope, examines the influence paths of station-area urban form on commercial format diversity through concentric zones, and proposes four groups of hypotheses:
(1) Studies on the determinants of commercial types emphasize the systematic effects of multiple factors, including location, supporting facilities, and passenger-flow resources [10,11]. Development in rail transit station areas also needs to consider the combined effects of urban form, land-use mix, and accessibility to transit stations [12,13,14,15]. Accordingly, Hypothesis 1 is proposed: station-area urban form characteristics, locational characteristics, facility configuration characteristics, passenger flow characteristics, land rent characteristics, and spatial characteristics of commercial organization directly affect commercial format diversity.
(2) Passenger flow volume, passenger flow balance, station-area passenger flow vitality, and route choice are important considerations in research on station-area urban form [16,17], and passenger flow characteristics also constitute the basis of commercial development. Accordingly, Hypothesis 2 is proposed: urban form characteristics and other characteristics may indirectly affect commercial format diversity through passenger flow characteristics.
(3) Rail transit construction has a significant premium effect on surrounding land rents. High-rent locations are often associated with commercial format agglomeration; however, excessively high rents may also produce commercial gentrification, continuously displacing small-scale, low-margin daily-life retail and convenience services [18]. Accordingly, Hypothesis 3 is proposed: urban form characteristics and other characteristics may indirectly affect commercial format diversity through land rent characteristics.
(4) Considering that distance to the rail transit station may moderate the effects of other influencing characteristics, Hypothesis 4 is proposed: as one dimension of location characteristics, distance to the rail transit station may not only directly or indirectly affect station-area commercial format diversity and other influencing factors, but may also change the strength or direction of the effects of other factors on station-area commercial format diversity.
Based on the four hypotheses above, the hypothetical model is constructed as shown in Figure 1.
2.2. Research Methods and Analytical Framework
This study uses structural equation modeling (SEM) for path analysis to reveal the direct and indirect effects of multidimensional factors on commercial format diversity. Because the model contains multiple latent variables and mediating paths, and because the data may deviate from normality, partial least squares structural equation modeling (PLS-SEM) is adopted. This method does not rely on the assumption of normal distribution and can effectively handle complex causal relationships, making it suitable for exploratory research and consistent with the data characteristics of this study. The research framework is shown in Figure 2.
Using ArcGIS Pro, this study establishes a sampling grid, acquires relevant geographic information data, filters sampling points according to data completeness, and conducts multiple GIS analyses and data-processing procedures.
First, the overall models for the urban core and the suburban area are validated separately. Previous work by the research team suggests that one of the major differences between central urban and suburban station areas is that the urban core contains a large number of overlapping rail transit station influence areas [19]. Therefore, the central urban and suburban samples are classified according to the number of urban rail transit stations within 1.2 km of each sampling point. Sampling points with no more than one station are assigned to the suburban dataset, whereas those with more than two stations are assigned to the central urban dataset (Figure 3). For the suburban dataset, data within 1200 m around stations are selected for overall model validation so that they correspond to the maximum 1200 m range in the urban core and ensure comparability. The overall model validation for the central urban and suburban datasets is conducted three times for each area, using the three commercial format diversity indicators as dependent variables. The differences in influence paths are then observed, and suitable commercial format diversity indicators are selected for comparing the overall models between the central urban and suburban datasets and for subsequent analyses.
Second, in the validation stage of the zonal influence-path models, zones are defined according to the actual sample sizes in the data analysis. Taking 400 m around stations as the baseline, the urban core is divided outward in 100 m increments, whereas the suburban area is divided in 200 m increments. The data are grouped cumulatively; for example, in the urban core, the first group includes samples within 400 m, the second group includes samples within 500 m, the third group includes samples within 600 m, and so forth, with each subsequent group containing all samples in the previous group. This cumulative grouping method preserves the spatial accumulation effect of the samples, allowing inter-zone comparisons to reflect the continuous process generated by spatial range expansion rather than isolated comparisons among independent spatial bands. It therefore focuses on the continuous distance-dependent characteristics of station-area spatial effects. The SEM validation and calculation procedures include necessary steps such as factor loading tests, Cronbach’s alpha tests, composite reliability tests, significance tests of standardized path coefficients (P tests), and model adjustment based on these tests.
Finally, multi-group analysis (MGA) is conducted. To overcome the limitation of traditional group-by-group comparisons, which rely only on numerical changes in path coefficients and cannot determine whether differences are statistically significant, this study uses permutation-based MGA to conduct pairwise comparisons of path coefficients among zones, with 5000 permutations. Before MGA, measurement invariance of composite models (MICOM) is tested for the data in each zone to ensure that the same constructs are measured comparably across zonal samples. For multi-indicator constructs, at least configural invariance and compositional invariance must be established. For single-indicator constructs, the composition is always a single-indicator weight (100%) across groups; therefore, compositional invariance is theoretically assumed and these constructs can be directly included in subsequent comparisons. In the permutation test results, if the P value for a between-group difference in a path coefficient is less than 0.05, the path is considered to differ significantly between the two zones. On this basis, paths with significant inter-zonal differences are identified and interpreted in relation to the trajectories of path-coefficient change.
2.3. Data Acquisition and Indicator Selection
The urban form characteristics examined in this study mainly include road network characteristics, land-use type characteristics, land-use mix characteristics, development intensity characteristics, and green environment characteristics. The data are primarily derived from OpenStreetMap.
commercial format diversity is calculated using Gaode map’s POI data. Based on the Gaode map’s POI classification system, these POI data are overlaid with other dimensional feature data in a GIS platform. Clustering is conducted according to the distribution of different commercial types across the feature dimensions, and the results are adjusted with reference to standards such as the Industrial Classification for National Economic Activities (GB/T 4754-2017) and Classification of Retail Formats (GB/T 18106-2021). The final classification contains 49 detailed commercial types (Figure 4). This study measures diversity using three indicators: number of commercial types, Shannon index, and Simpson index. The number of commercial types is sensitive to the presence or absence of commercial types; the Shannon index accounts for both richness and evenness and generally emphasizes the balance of the quantitative distribution; and the Simpson index is particularly sensitive to dominant types, with higher values indicating greater concentration.
Facility configuration characteristics and spatial characteristics of commercial organization are determined binarily according to the presence or absence of relevant facility POIs within a specified range around each sampling point. A value of 1 is assigned if such facilities are present, and 0 otherwise. Candidate ranges of 200 m, 400 m, and 800 m are tested, and the resulting indicators are correlated with other key indicators, such as passenger flow characteristics and land rent characteristics. The buffer size that showed stronger and more consistent correlations with the key variables was retained for the final specification.
In SEM modeling, multicollinearity among latent variables must be avoided. Therefore, based on correlation and factor analyses, facility configuration characteristics are divided into four latent variables: city-level public service facilities, community-level public service facilities, tertiary Grade-A hospitals, and major attractions. Among land-use proportions, the highly collinear commercial-service land and business/office land variables are combined into the Commercial Land-Use Proportion indicator.
3. Results
3.1. Direct Influence Paths and Differences Between Central Urban and Suburban Areas
First, the overall fit quality of each model is evaluated. For the central urban and suburban datasets, structural equation models are constructed using the three commercial format diversity indicators—number of commercial types, Shannon index, and Simpson index—as dependent variables. All models pass the collinearity diagnosis (VIF < 5) and the reliability and validity tests. The model fit indicators and evaluation results are shown in Table 2.
In terms of model fit, the SRMR values of the saturated models range from 0.054 to 0.072, all below the recommended threshold of 0.08 [20]. The SRMR values of the estimated models range from 0.100 to 0.105, which are slightly higher than the conservative threshold of 0.08 but remain within the more permissive boundary of 0.10 [21]. Overall, the model fit satisfies the prerequisite conditions for subsequent path analysis.
In terms of explanatory power, the models exhibit the highest explanatory power for the number of commercial types, reaching a moderate level. The explanatory power for the Shannon index is lower, but in exploratory research an R2 value of 0.20 is already considered informative [20]. The explanatory power for the Simpson index is the weakest. This gradient suggests that the effects of multidimensional factors on commercial format diversity are mainly reflected in the expansion of the coverage of commercial types, whereas their regulatory effects on the concentration of dominant types are relatively limited.
The main influence-path results for the three commercial format diversity indicators in the central urban and suburban datasets are shown in Table 3.
The two datasets exhibit the following common patterns:
(1) Public service and commercial facilities mainly increase the number of commercial types. Variables such as community-level public service facilities and shopping malls have stronger positive effects on the number of commercial types than on commercial format diversity or commercial format dominance. This indicates that the introduction of public service and commercial facilities first addresses the presence or absence of commercial types, whereas their influence on the evenness of the commercial format structure is relatively delayed.
(2) Land rent characteristics suppress the number of commercial types while promoting dominance concentration. Land rent has a negative effect on the number of commercial types in both areas (urban core: -0.157; suburban area: -0.147), whereas it has a positive effect on commercial format dominance (urban core: +0.041; not significant in the suburban area). This supports the phenomenon of commercial gentrification: high rents force certain commercial types to exit, while the remaining commercial types concentrate toward high-paying categories, thereby increasing dominance. The effect of land rent on commercial format diversity is not significant in either area, suggesting that the simultaneous effects of type reduction and dominance concentration offset each other in the Shannon index or cannot be effectively captured statistically.
(3) Weekday passenger flow volume has a positive effect on all indicators. Weekday passenger flow positively affects all three commercial format diversity indicators, although the focus of its effect varies by area.
In addition, local location and industrial land-use proportion show weak negative effects on all three indicators of commercial format diversity, whereas development intensity and residential land-use proportion show positive effects.
The core differences between the central urban and suburban areas are as follows:
(1) Fundamental differences in passenger-flow effects.
In the urban core, weekday passenger flow has the strongest effect on commercial format diversity (+0.487), whereas its effect on the number of commercial types is relatively weak (+0.179). This suggests that weekday commuting passenger flow does not mainly add new commercial types, but rather makes the scale of existing commercial types more balanced. The negative effect of weekend passenger flow on commercial format diversity is also the most pronounced (-0.352), whereas its effect on the number of commercial types is even slightly positive (+0.125). This indicates that weekend passenger flow may marginally increase the number of commercial types, but consumption demand is highly concentrated in a small number of dominant types, such as leisure dining and entertainment, thereby intensifying the uneven distribution of commercial types. In the suburban area, weekday passenger flow has the strongest effect on commercial format dominance (+0.294), exceeding its effects on the number of commercial types (+0.236) and commercial format diversity (+0.189). This shows that the role of suburban passenger flow differs fundamentally from that in the urban core. Against the background of a relatively weak commercial base and insufficient commercial format supply in suburban station areas, limited weekday passenger flow first promotes the expansion of a few dominant commercial types, such as fast food and convenience stores, rather than the comprehensive and balanced development of all commercial types.
(2) Differentiation in the station-distance effect.
In the suburban area, distance to the rail transit station has a strong negative effect on the number of commercial types (-0.254) and almost no effect on commercial format dominance (+0.011). Combined with its negative effect on commercial format diversity (-0.066) and near-zero effect on dominance, this indicates that as distance from the rail transit station increases, the overall scale of commercial types declines. However, this decline is relatively even across commercial types and has not yet produced a differentiated pattern in which certain types are preferentially displaced or one type monopolizes the remaining market.
(3) Opposite directions in the effects of land-use mix and commercial land use.
In the urban core, macro location has a positive effect on the number of commercial types (+0.117) but a negative effect on commercial format diversity (-0.060), indicating that although the urban core contains many commercial types, their distribution is uneven, possibly because of high rents and homogeneous competition. The proportion of commercial and commercial land use has a positive effect on the number of commercial types (+0.220) but a weak negative effect on commercial format diversity (-0.059), suggesting that commercial land expansion mainly increases quantity and that newly added commercial types are concentrated in a few categories, with limited improvement in evenness. In the suburban area, development intensity has positive effects on all three indicators, with diminishing magnitudes (number of commercial types > Shannon index > Simpson index). This indicates that high development intensity increases quantity and improves evenness without intensifying monopoly, contrasting with the homogenizing effect of high development intensity in the urban core. In the suburban model, the path from land-use mix to commercial format diversity is negative for the number of commercial types (-0.084) but positive for commercial format dominance (+0.079). A possible reason is that land-use mix in Shanghai’s suburban station areas often takes the form of comprehensive development by a single actor and external organizational control over commercial types. Although this may increase the number of certain commercial types, it does not produce as many commercial types as long-term self-organization in street-front commerce within residential neighborhoods. This suggests that mixed land use does not necessarily lead to diversified commercial types.
Beyond the three differences above, the central urban and suburban areas also differ systematically in several respects. The effect of community-level public service facilities on commercial format diversity is stronger in the suburban area (number of commercial types: +0.429) than in the urban core (+0.262), indicating a higher marginal contribution of public service facilities in suburban areas. Macro location has a negative effect on commercial format diversity in the urban core (-0.060) but a positive effect in the suburban area (+0.093), suggesting that proximity to the core area in the central urban context can increase the number of commercial types but may undermine distributional evenness through high rents and homogeneous competition. In contrast, improved macro location in suburban areas increases both quantity and evenness without yet producing the side effects of excessive agglomeration. The negative effect of weekend passenger flow balance on commercial format dominance is stronger in the suburban area (-0.124) than in the urban core (-0.041), indicating that balanced suburban passenger-flow distribution is more critical for preventing commercial format monopoly. The more concentrated passenger flow is in specific time periods or locations, the more easily the already fragile suburban commercial format structure tends toward a small number of leading commercial types.
3.2. Indirect Influence Paths and Differences Between Central Urban and Suburban Areas
The previous section hypothesized the mediating roles of passenger flow volume, passenger flow balance, and land rent characteristics in the influence paths of commercial format diversity. This section further examines the indirect effects of each primary characteristic indicator on commercial format diversity in the central urban and suburban datasets. The results are shown in Table 4.
In both the central urban and suburban areas, the indirect influence paths show the following common patterns:
(1) City-level public service facilities are the strongest common source of indirect effects in both areas. In both the central urban and suburban areas, city-level public service facilities generate positive indirect effects on all three diversity indicators through weekday passenger flow volume, and this path ranks among the top two indirect paths in the Shannon-index models for each area. As strong destination-oriented attractors, city-level public service facilities, such as convention and exhibition facilities, cultural exhibition venues, and sports venues, effectively draw weekday passenger flow and thereby promote the development of surrounding commercial types.
(2) Macro location has a negative indirect effect on diversity through weekday passenger flow. The path from macro location to weekday passenger flow volume to diversity shows a consistent negative effect on all three indicators in both areas. This indicates that proximity to the urban center may increase total weekday passenger flow, but this type of passenger flow tends to concentrate in a small number of commercial clusters, thereby undermining the balanced distribution of commercial types.
(3) Tertiary Grade-A hospitals, community-level public service facilities, and development intensity generate positive indirect effects through weekday passenger flow volume. These factors have positive indirect effects on diversity through weekday passenger flow volume in both areas, with consistent directions. This suggests that these facilities and development characteristics have a generally positive indirect promotional effect on commercial format diversity across different areas.
(4) Indirect paths mediated by land rent are significant only for the number of commercial types. In both the central urban and suburban areas, all indirect paths using land rent characteristics as a mediator take the number of commercial types as the dependent variable, whereas their effects on the Shannon index and Simpson index are not significant. This indicates that the indirect transmission mechanism of land rent mainly operates at the level of commercial format entry and exit and does not exert a significant indirect effect on the evenness or dominance of the proportional structure among commercial types.
Compared with the suburban area, the indirect paths in the urban core are more complex in both magnitude and mediating structure. The specific differences are as follows:
(1) Differences in the mediating role of passenger flow characteristics. The urban core forms a dual-track mediating network of weekday passenger flow and weekend passenger flow. The numbers of paths mediated by these two types of passenger flow are similar, and positive and negative effects are intertwined. In contrast, the suburban area is highly concentrated in a single weekday-passenger-flow channel, with only one path mediated by weekend passenger flow. This suggests that the suburban weekend consumption market has not yet formed an effective indirect transmission capacity.
(2) City-level public service facilities in the urban core regulate weekday and weekend passenger flow characteristics in opposite directions. This indicates that, on weekdays, the passenger flows and commercial activities generated by the normal operation of such facilities—such as convention and exhibition facilities, cultural exhibition venues, large sports venues, vocational schools, and higher-education institutions—tend to complement each other temporally and contribute to the balanced development of commercial types. On weekends, however, the passenger flows generated by these facilities highly overlap with peak commercial consumption periods, causing passenger flow to concentrate more easily in a few dominant commercial types within station areas and thereby intensifying the uneven distribution of commercial types.
(3) Macro location and local location show indicator differentiation in the urban core but remain consistent in the suburban area. In the urban core, macro location generates complex mixed effects in the Shannon-index model: it has a positive effect through weekend passenger flow (+0.110) but a negative effect through weekday passenger flow (-0.106). In the suburban area, by contrast, the directions of the effects of macro location are consistent across indicators, whether mediated by weekday or weekend passenger flow: through weekday passenger flow, it has negative effects on all three indicators (-0.067 to -0.105), whereas through weekend passenger flow it has a positive effect only on the Simpson index (+0.063). This difference indicates that the influence of macro location in the urban core is highly differentiated by passenger-flow period, while in the suburban area the effect direction is relatively unified because the mediating channel is more singular.
(4) The mediating transmission chain of land rent characteristics is more diverse in the urban core, where different dimensions of passenger flow balance can indirectly affect the number of commercial types through the land-rent gradient. Land-rent-mediated paths are more abundant in the urban core, where four indirect paths mediated by land rent are identified, all with the number of commercial types as the dependent variable. Their antecedents include macro location, weekday and weekend passenger flow balance, and shopping malls. In the suburban area, only two such paths are observed: macro location to land rent to the number of commercial types, and weekend passenger flow balance to land rent to the number of commercial types.
3.3. Zonal Differences in Influence Paths Between Central Urban and Suburban Areas
This study selects commercial format diversity (Shannon index) as the core measure for analyzing zonal differences. The Shannon index integrates the dimensions of number of commercial types and commercial format dominance, thereby providing a more comprehensive reflection of the health of the commercial format structure. In the preceding analysis, it is also highly sensitive to indicators such as the temporal rhythm of passenger flow. Although the number of commercial types is the most sensitive to spatial intervention and facility configuration and is an effective indicator for identifying whether different factors affect the presence or absence of commercial types, it cannot reflect the quantitative proportional relationships among commercial types. commercial format dominance focuses on changes in the concentration of dominant types and is particularly useful for identifying whether a commercial type tends toward monopoly. However, in this study, the adjusted R2 of the corresponding model is within an unacceptable range, indicating that further refinement is needed in the analysis of dominant commercial types.
For each zone in the urban core (cumulative 100 m increments) and suburban area (cumulative 200 m increments), the PLS algorithm and bootstrap resampling (5000 resamples) are applied. Permutation-based MGA is then conducted for adjacent zones and the first and last zones. Influence paths with between-group P values below 0.05 are identified as paths with significant zonal changes, and their interpretations are combined with the trajectories of path coefficients across zones.
As shown in Table 5, for the central urban dataset, MGA identifies six paths that change significantly as the zones expand (two direct paths and four indirect paths). All of them display monotonic and smooth trajectories, indicating that the essence of zonal differences in the urban core is the gradient attenuation of effect intensity or its approach to a limiting value, rather than a qualitative change in the structure of influence paths. Only the interaction path between distance to the rail transit station and residential land use decreases monotonically from 0.078 at 400 m to -0.058 at 1200 m and crosses zero at 600 m. This indicates that the positive contribution of residential land-use proportion around central urban rail transit stations to commercial format diversity is concentrated within approximately 500-600 m of stations. The reason why residential land use and station distance form a positive synergy in the inner zones but become a negative constraint in outer zones may be that residential land use in the near-station zones (400-500 m) is usually closely interwoven with station-area commercial space and represents the area with the highest degree of station-city integration. Residents’ daily consumption needs therefore promote commercial format diversity around stations. In the outer zones (>600 m), residential land is more likely to be purely residential and less connected to station-area commerce. Residents may prefer nearby consumption rather than traveling to the station area, and a higher residential land-use proportion also implies less space for commercial development, which is not conducive to the presence of diverse commercial types.

Table 5.
Cumulative zonal changes in influence-path coefficients in the urban core.
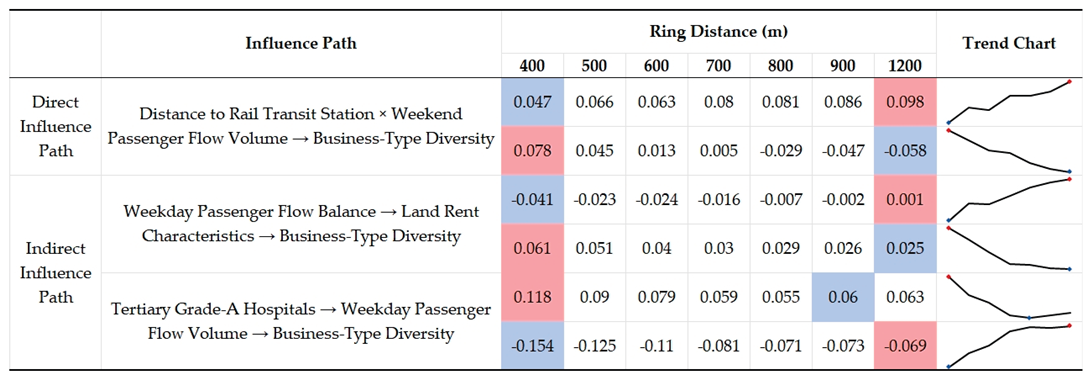 |
Note: Only significant paths are shown (P <= 0.05 in MGA and absolute path coefficient >= 0.03). Blue denotes the minimum value and red denotes the maximum value.
Table 6.
Cumulative zonal changes in influence-path coefficients in the suburban area.
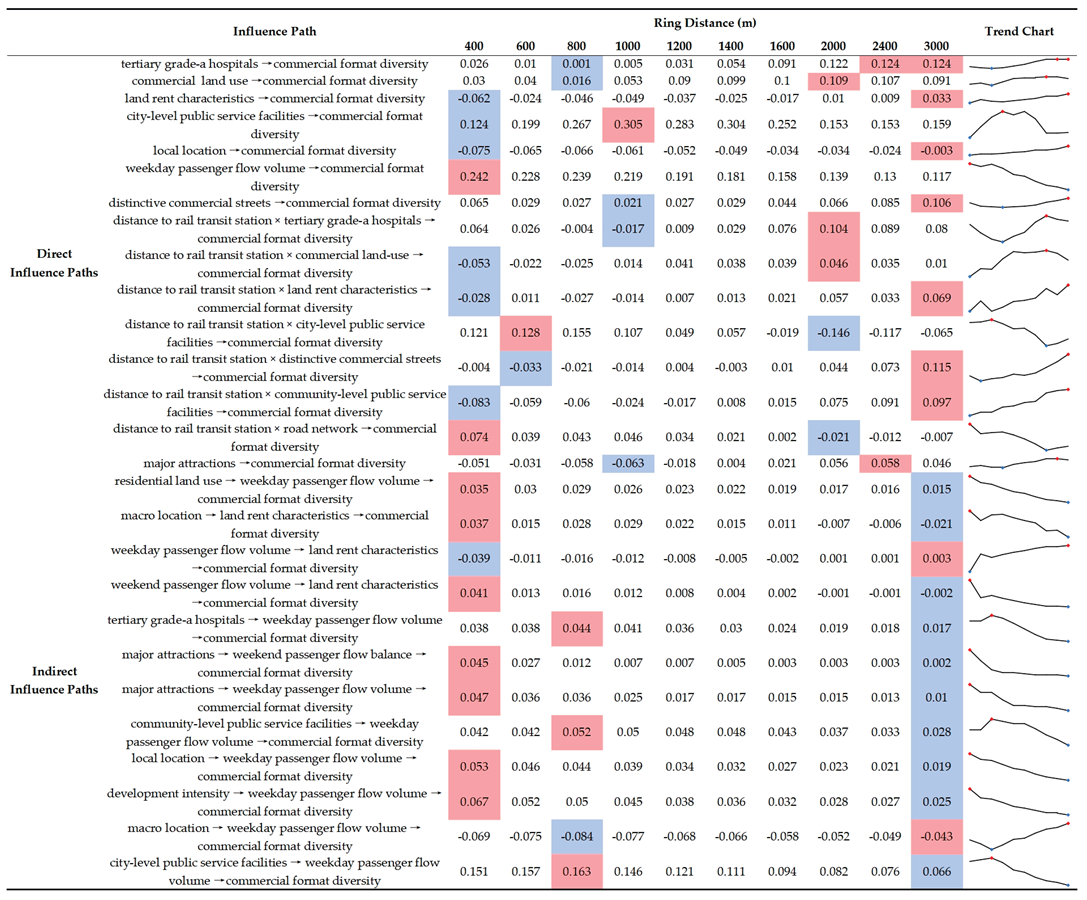 |
Note: Only significant paths are shown (P <= 0.05 in MGA and absolute path coefficient >= 0.03). Blue denotes the minimum value and red denotes the maximum value.
In the suburban area, as many as 27 influence paths change significantly as the zones expand. Several paths exhibit a unimodal pattern, increasing first and then decreasing. These include the direct effect of city-level public service facilities on commercial format diversity, the interaction effect between distance to the rail transit station and city-level public service facilities, and the indirect effects of tertiary Grade-A hospitals, city-level public service facilities, and community-level public service facilities on commercial format diversity through weekday passenger flow volume. These findings indicate that an optimal synergistic zone exists approximately 600-1000 m from suburban stations, where the interaction between public service facility configuration and rail transit has a positive effect on commercial format diversity. Although direct paths such as tertiary Grade-A hospitals to commercial format diversity and distance to the rail transit station x tertiary Grade-A hospitals to commercial format diversity reach their minimum values in the 800-1000 m range, their path coefficients are very small. This suggests that, as public service facilities, their influence on commercial format diversity is more likely to be realized indirectly through the mediation of passenger flow.
Another important phenomenon in the suburban area is that many influence paths cross zero as zones expand. Eleven paths, including land rent characteristics to diversity, distance to the rail transit station x land rent to diversity, distance to the rail transit station x community-level public service facilities to diversity, and major attractions to diversity, reverse direction within the 1200-1600 m range. This indicates that the essence of suburban zonal differences is a transformation of mechanisms. Near-station areas primarily rely on passenger-flow injection from rail transit and the spatial synergy of public service facilities to drive commercial format diversity. In outer zones, commercial format diversity shifts toward a driving mode centered on localized important facilities, such as tertiary Grade-A hospitals and distinctive commercial streets, as well as residential supporting services.
4. Conclusions and Discussion
Taking rail transit station areas in Shanghai as the research object, this study uses multi-source geospatial data and structural equation modeling to systematically examine the influencing factors, influence pathways, and distance-based zonal differences of commercial format diversity. The main conclusions are as follows:
(1) Among the factors affecting commercial format diversity in rail transit station areas, passenger flow characteristics are the primary determinant and the key mediator through which most factors other than location exert their effects. Location characteristics, especially distance to the rail transit station, mainly function as moderating variables by altering the direction and strength of the effects of other factors on commercial format diversity. Land rent characteristics directly transmit the gentrification effect and intensify the homogenization of near-station commercial types in the urban core. Urban form characteristics serve as a spatial framework and exert a fundamental regulatory role, with significant interaction effects involving station distance. Among facility configuration characteristics, community-level public service facilities and spatial characteristics of commercial organization have significant direct effects on commercial format diversity under specific conditions.
(2) The influence paths of station-area commercial format diversity show systematic differences between central urban and suburban areas. In terms of direct effects, the urban core is dominated by the temporal rhythm of passenger flow: weekday passenger flow has a strong positive effect on the Shannon index, whereas weekend passenger flow has a strong negative effect, indicating that the temporal attribute of passenger flow directly determines the direction of change in commercial format evenness. The suburban area is dominated by public service facilities and station distance, and the influencing factors first operate at the level of the presence or absence of commercial types, forming a quantity-driven mode. In terms of indirect effects, the urban core forms a complex transmission network with weekday and weekend passenger flow volumes as dual mediators, through which the same factor can exert differentiated effects on commercial format diversity via passenger flows at different times. The suburban area, by contrast, relies heavily on a single weekday-passenger-flow channel; the mediating effect of weekend passenger flow is highly limited, and most factors operate mainly through direct paths, with indirect effects playing only an auxiliary role. In both areas, the indirect transmission mechanism of land rent is confined to the entry and exit of commercial types—with the number of commercial types as the dependent variable—and is not significant for either the Shannon index or the Simpson index. The regional difference lies only in the greater number of land-rent-mediated paths in the urban core than in the suburban area.
(3) The three diversity indicators have distinct applicability. The number of commercial types is the most sensitive to spatial intervention and facility configuration and is therefore the preferred indicator for identifying presence-or-absence issues, but it cannot reflect quantitative proportional relationships among commercial types. The Simpson index is most sensitive to changes in the concentration of dominant types; however, in this study, its adjusted R2 is within an unacceptable range. The Shannon index integrates richness and evenness and is most sensitive to the structural effects of the temporal rhythm of passenger flow; it is therefore used as the core measurement indicator in this study. The three indicators have different emphases and are not interchangeable; they should be selected according to the research question or used together to cross-validate findings.
(4) An optimal synergistic zone that promotes commercial format diversity exists approximately 600-1000 m from suburban stations. Within this zone, the direct effect of city-level public service facilities and their interaction with station distance both reach peak values. Outside this zone, the effect intensity first declines and then may turn negative. The reversal of many paths in the 1200-1600 m range marks a key threshold zone in which the mechanisms affecting suburban station areas transform from near-station dominance to outer-zone dominance. Inner zones (400-800 m) mainly rely on the spatial synergy between rail transit passenger flow and city-level public service facilities to drive commercial format diversity. Outer zones (2000-3000 m) no longer depend on the synergy between rail transit stations and city-level public service facilities, but instead shift toward a new driving mode centered on localized facilities, such as tertiary Grade-A hospitals and distinctive commercial streets, and residential supporting services. The urban core presents a simplified pattern of monotonic attenuation, indicating that its zonal differences reflect gradient attenuation in effect intensity rather than qualitative changes in influence-path structure.
These findings suggest several implications for optimizing commercial space in rail transit station areas. Station-city integrated development should adopt differentiated strategies in response to zonal variation. In the inner zones (0-600 m), priority should be given to fast-paced and highly convenient commercial combinations to strengthen the efficient conversion of transit passenger flows into commercial consumption. In the middle zones (600-1000 m), where the commercial structure is most adaptable, emphasis should be placed on fostering spatial synergies between city-level public service facilities and commercial uses to maximize the combined effects of multiple factors. In the outer zones (>1200 m), neighborhood-serving commerce should be oriented toward residential support services and localized facilities. In urban cores, flexible commercial interfaces should be designed in accordance with the temporal rhythm of passenger flows: weekday strategies should address the balanced needs of commuting passengers, whereas weekend strategies should direct destination-oriented passenger flows toward more diverse commercial offerings. In suburban areas, priority should be given to improving the spatial coupling between community-level public service facilities and residential land use, strengthening pedestrian connections among rail transit stations, community centers, educational facilities, and distinctive commercial streets, and leveraging the positive moderating effect of station distance to enhance commercial diversity.
Author Contributions
Conceptualization, Minfeng Yao and Zhijunjie Zhai; methodology, Zhijunjie Zhai and Minfeng Yao; data curation, Zhijunjie Zhai; formal analysis, Zhijunjie Zhai; investigation, Zhijunjie Zhai; software, Zhijunjie Zhai, Qi Zhang and Lingqiao Zhang; validation, Qi Zhang; supervision, Minfeng Yao; writing—original draft preparation, Zhijunjie Zhai; writing—review and editing, Minfeng Yao. All authors have read and agreed to the published version of the manuscript.
Funding
This research was funded by National Natural Science Foundation of China General Program (52278061) “Research on the Evaluation and Enhancement Strategies of Urban Functional Diversity in Rail Transit Station Areas for the Goal of Integrated Station-City Development”.
Conflicts of Interest
The authors declare no conflicts of interest.
References
- Calthorpe, P. The Next American Metropolis: Ecology, Community, and the American Dream; Guo, L., Trans.; China Architecture & Building Press: Beijing, China, 2009, pp. 43,77–82.
- Nikken Sekkei Ltd Station-City Integrated Development Research Association. Station-City Integrated Development II: The Charm of TOD46; Liaoning Science and Technology Publishing House: Shenyang, China, 2019, pp. 188–191.
- Nikken Sekkei Ltd Station-City Integrated Development Research Association. Station-City Integrated Development: A New Generation of Transit-Oriented City Construction; China Architecture & Building Press: Beijing, China, 2014, pp. 176–180.
- Zhuang, X.; Zhang, L.; Lu, J. Past-Present-Future: Urban Spatial Succession and Transition of Rail Transit Station Zones in Japan. Int. J. Environ. Res. Public Health 2022, 19, 13633. [CrossRef]
- Farnes, K.; Hurst, N.; Wong, W.W.; Wilkinson, S. An Exploratory Study on the Benefits of Transit Orientated Development (TOD) to Rail Infrastructure Projects. Smart Sustain. Built Environ. 2025, *14*, 310–325. [CrossRef]
- Yu, Y.; Gong, Q.; Yao, X. Self-Organizing Evolution of Commercial Space in Subway Station Areas; China Architecture & Building Press: Beijing, China, 2020, pp. 83–230.
- China Association of Metros. 2024 Annual Statistics and Analysis Report on Urban Rail Transit; China Association of Metros: Beijing, China, 2025.
- China Business Network. New Urban Rail Operating Mileage in the First Three Quarters Reached 491.67 km, Up 31.06% Year-on-Year. Available online: http://www.cb.com.cn/index/show/zj/cv/cv135325701260 (accessed on 10 October 2025).
- Debrezion, G.; Pels, E.; Rietveld, P. The Impact of Railway Stations on Residential and Commercial Property Value: A Meta-Analysis. J. Real Estate Financ. Econ. 2007, 35 , 161–180. [CrossRef]
- Guy, F. Small, Local and Cheap? Walkable and Car-oriented Retail in Competition. Spat. Econ. Anal. 2013, 8 , 425–442. [CrossRef]
- Cambe, J.; D’Silva, K.; Noulas, A.; et al. Modelling Cooperation and Competition in Urban Retail Ecosystems with Complex Network Metrics. Preprint 2021, arXiv:2104.13981. [CrossRef]
- Lin, S.H.; Ho, C.Y.; Lu, S.Y.; et al. The Determinants of Passengers’ Consumption Motivation at High-Speed Rail Stations. Systems 2022, 10 , 45. [CrossRef]
- Li, X.Y.; Han, T.; Ma, Y.; et al. Evaluation Method and System Construction of Station-City Integration in Subway Station Areas Based on Commercial Vitality Enhancement: A Case Study of the “Green Heart” Project in Beijing Sub-Center. Chin. Overseas Archit. 2021, 18–23. [CrossRef]
- Liu, X.; Chen, X.H.; Pan, H.X. From “Station-City Integration” to “Corridor Integration”: A Theoretical Framework and Model Optimization for TOD Development from the Perspective of Flow Space. Urban Plan. Forum 2024, 34–40. [CrossRef]
- Wang, Z.H. Research on Spatial Agglomeration Characteristics of Commercial Outlets in Rail Transit Station Areas: A Case Study of the Osaka Midosuji Line. Master’s Thesis, Huaqiao University, Xiamen, China, 2025. DOI not available.
- Ma, C.Q.; Zhang, S.; Chen, Q.; et al. Characteristics and Vulnerability of Rail Transit Networks from the Perspective of Passenger Flow. J. Traffic Transp. Eng. 2020, 20 , 208–216. [CrossRef]
- Liu, J.F.; Sun, F.L.; Bai, Y.; et al. Passenger Route Choice Model and Algorithm for Urban Rail Transit. J. Transp. Syst. Eng. Inf. Technol. 2009, 9 , 81–86. [CrossRef]
- Yang, Q.; Liu, Y.; Yang, L.C. Commercial Gentrification in China and Its Distribution, Development, and Correlates: The Case of Chengdu. Front. Environ. Sci. 2022, *10*, 992092. [CrossRef]
- Zhang, Y.K.; Yao, M.F.; Wang, Z.H.; et al. The Impact of Built Environment on Passenger Flow Distribution in Overlapping Areas of Adjacent Rail Transit Stations. In Proceedings of the 5th Conference on Computational Design 2024; Computational Design Professional Committee of Architectural Society of China, College of Architecture and Urban Planning, Tongji University, Eds.; School of Architecture, Huaqiao University: Xiamen, China, 2024; pp. 197–205.
- Hu, L.T.; Bentler, P.M. Cutoff Criteria for Fit Indexes in Covariance Structure Analysis: Conventional Criteria versus New Alternatives. Struct. Equ. Model. 1999, *6*, 1–55. [CrossRef]
- Henseler, J.; Hubona, G.; Ray, P.A. Using PLS Path Modeling in New Technology Research: Updated Guidelines. Ind. Manag. Data Syst. 2016, 116 , 2–20. [CrossRef]
Figure 1.
Hypothetical model of the influence paths from station-area urban form to commercial format diversity.
Figure 1.
Hypothetical model of the influence paths from station-area urban form to commercial format diversity.
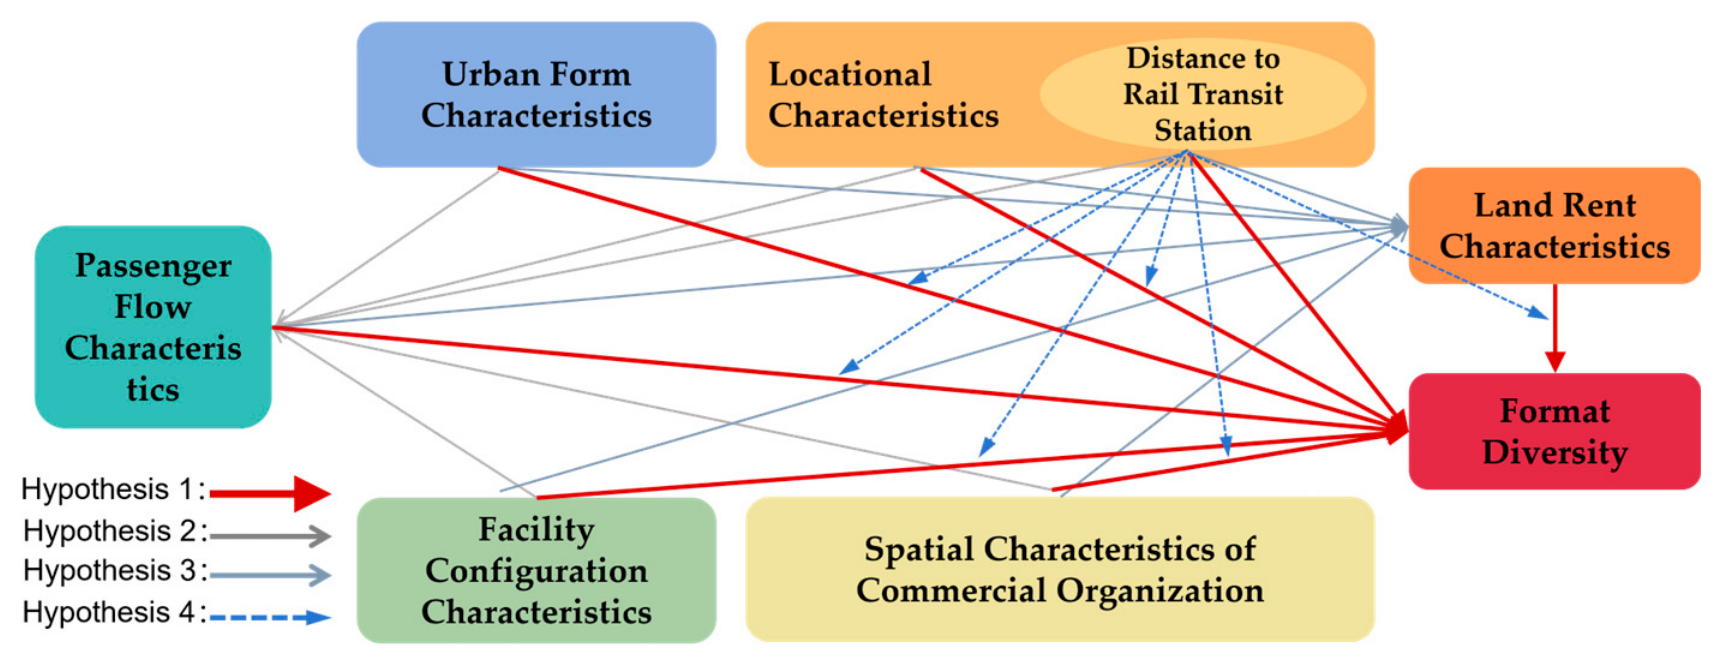
Figure 2.
Research framework.
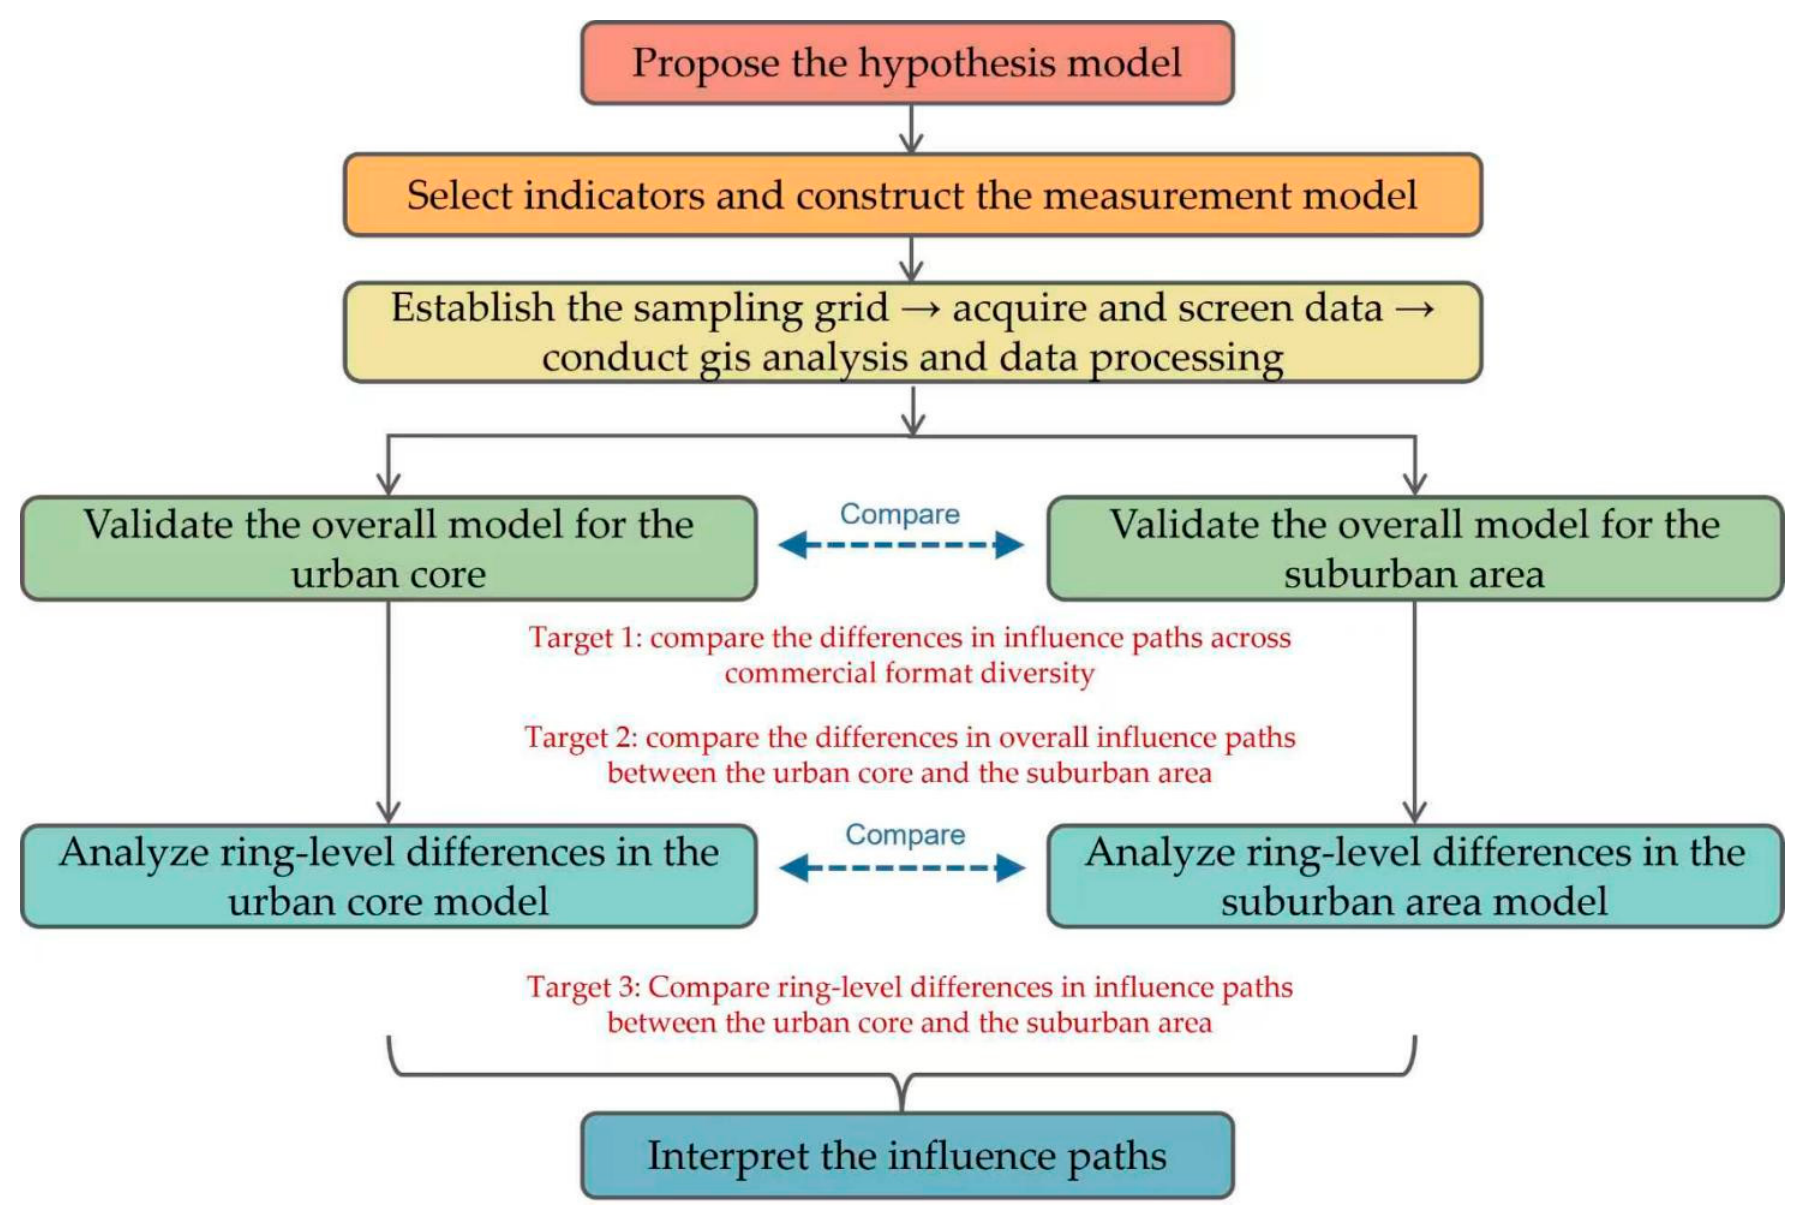
Figure 3.
Distribution of filtered sampling points and classification into central urban and suburban areas.
Figure 3.
Distribution of filtered sampling points and classification into central urban and suburban areas.
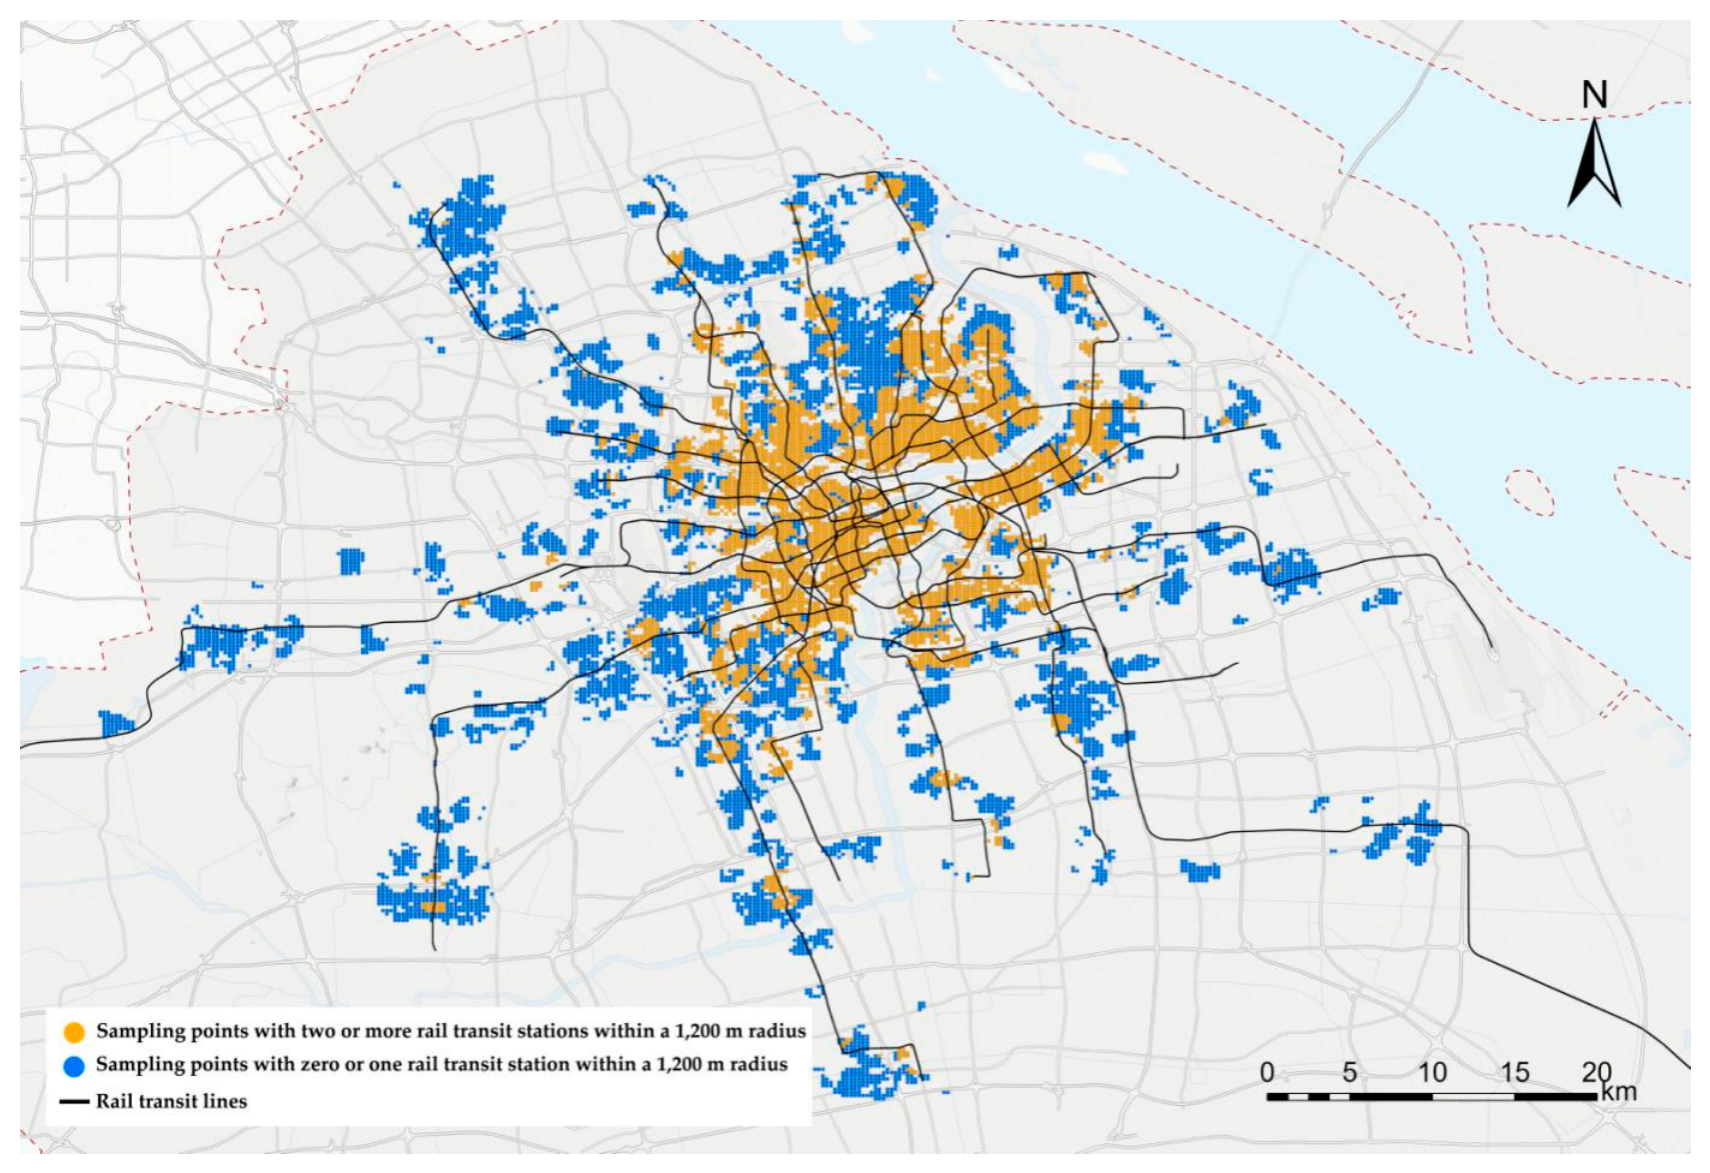
Figure 4.
Correspondence between the station-area commercial format classification and the original Gaode map’s POI classification.
Figure 4.
Correspondence between the station-area commercial format classification and the original Gaode map’s POI classification.

Figure 5.
Measurement model for the influence paths from station-area urban form to commercial format diversity.
Figure 5.
Measurement model for the influence paths from station-area urban form to commercial format diversity.
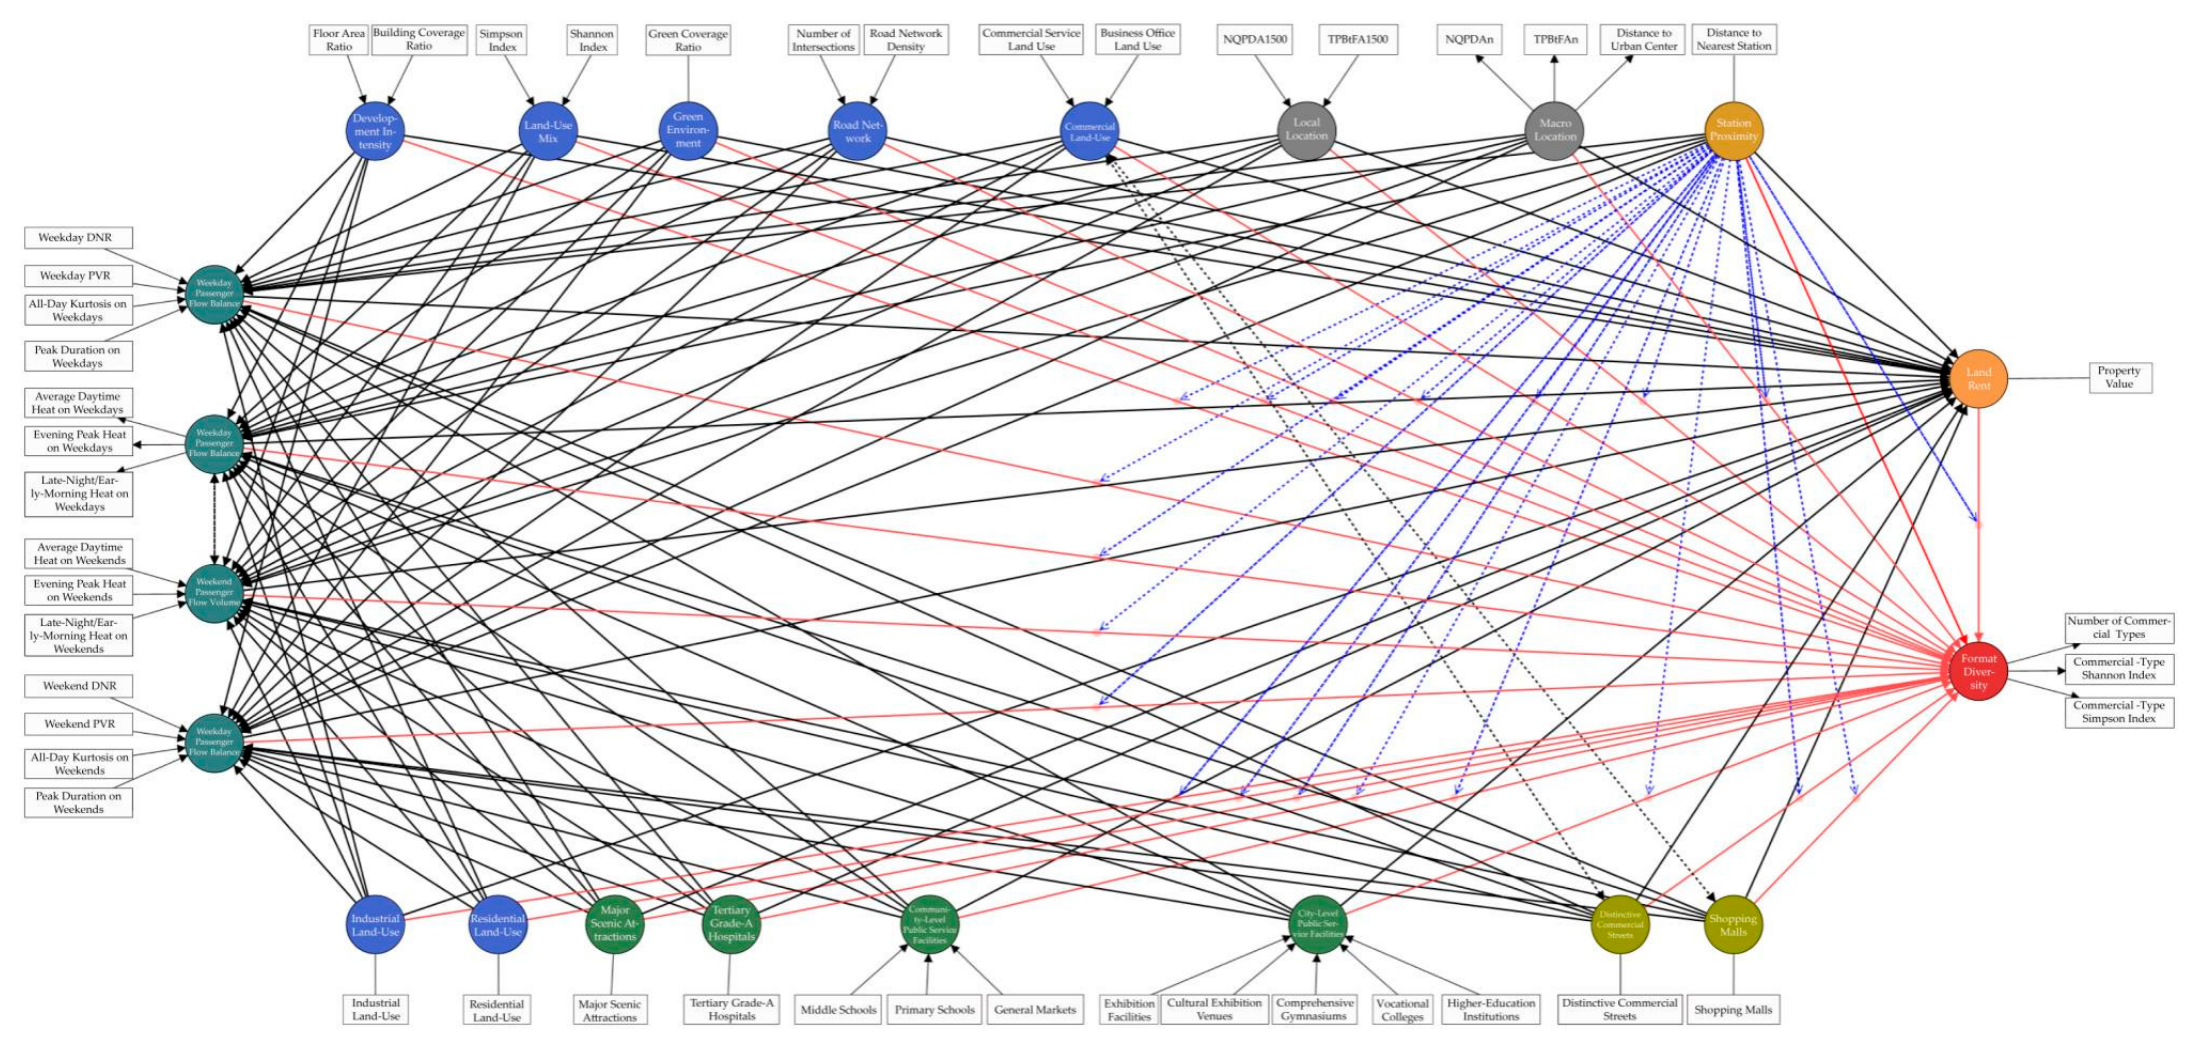
Table 1.
Construction of the indicator system and data-processing methods.
| Dimension | Main Data Source | Secondary Dimension | Quantitative Indicator | Operationalization |
|---|---|---|---|---|
| Urban Form Characteristics | OpenStreetMap; land-use data | Road Network Characteristics | Road Network Density | Ratio of the total length of urban roads within a 400 m buffer around each sampling point to the buffer area |
| Number of Intersections | Number of urban road intersections within a 400 m buffer around each sampling point | |||
| Land-Use Type Characteristics | Residential Land-Use Proportion | Proportion of residential land within a 400 m buffer around each sampling point | ||
| Commercial Land-Use Proportion | Composite indicator based on the proportions of commercial land and commercial land within a 400 m buffer around each sampling point | |||
| Industrial Land-Use Proportion | Proportion of industrial land within a 400 m buffer around each sampling point | |||
| Land-Use Mix Characteristics | Land-Use Shannon Index | Calculated from the proportions of different land-use types within a 400 m buffer around each sampling point | ||
| Land-Use Simpson Index | ||||
| Development Intensity Characteristics | Building Coverage Ratio | Ratio of building footprint area within a 400 m buffer around each sampling point to the buffer area | ||
| Floor Area Ratio | The total floor area is estimated from the product of building footprint area and number of floors within a 400 m buffer around each sampling point, and divided by the buffer area | |||
| Green Environment Characteristics | Green Coverage Ratio | Mean green coverage rate derived from Anjuke real-estate data within a 400 m buffer around each sampling point | ||
| Locational Characteristics | OpenStreetMap | Macro location | Global Integration | Calculated in ArcGIS using the SDA spatial syntax plug-in |
| Global Choice | ||||
| Distance to Urban Center | Linear distance from each sampling point to Lujiazui, Shanghai, defined as the urban center | |||
| Local Location | Local Integration | Calculated in ArcGIS using the SDA spatial syntax plug-in | ||
| Local Choice | ||||
| Station Proximity | Distance to Nearest Station | Linear distance from each sampling point to the nearest rail transit station | ||
| Facility Configuration Characteristics | Gaode map’s POI | City-Level Public Service Facilities | Presence of Exhibition Facilities | Whether exhibition-facility POIs are present within an 800 m buffer around each sampling point |
| Presence of Cultural Exhibition Venues | Whether cultural exhibition venue POIs are present within an 800 m buffer around each sampling point | |||
| Presence of Comprehensive Gymnasiums | Whether comprehensive gymnasium POIs are present within a 1,600 m buffer around each sampling point | |||
| Presence of Vocational Colleges | Whether vocational college POIs are present within a 1,600 m buffer around each sampling point | |||
| Presence of Higher-Education Institutions | Whether higher-education institution POIs are present within an 800 m buffer around each sampling point | |||
| Community-Level Public Service Facilities | Presence of Middle Schools | Whether middle school POIs are present within a 400 m buffer around each sampling point | ||
| Presence of Primary Schools | Whether primary school POIs are present within an 800 m buffer around each sampling point | |||
| Presence of General Markets | Whether general market POIs are present within a 200 m buffer around each sampling point | |||
| Tertiary Grade-A Hospitals | Presence of Tertiary Grade-A Hospitals | Whether tertiary grade-A hospital POIs are present within a 1,600 m buffer around each sampling point | ||
| Major Scenic Attractions | Presence of Major Scenic Attractions | Whether major scenic attraction POIs are present within an 800 m buffer around each sampling point | ||
| Passenger Flow Characteristics | Baidu heatmap data; kernel density estimation; averages calculated from three weekdays or weekend days | Weekday Passenger Flow Volume | Average Daytime Heat on Weekdays | Average heat value from 06:00 to 18:00 on weekdays |
| Evening Peak Heat on Weekdays | Average heat value from 18:00 to 22:00 on weekdays | |||
| Late-Night/Early-Morning Heat on Weekdays | Average heat value from 22:00 to 06:00 the next day on weekdays | |||
| Weekday Passenger Flow Balance | Weekday DNR | Day-night ratio: ratio of average daytime heat to evening peak heat on weekdays | ||
| Weekday PVR | Peak-valley ratio: ratio of average daytime heat to the difference between the maximum and minimum hourly heat values during the evening peak on weekdays | |||
| All-Day Kurtosis on Weekdays | Statistic describing the peakedness or flatness of passenger-flow distribution; here the Kurtosis indicator is used (sample excess kurtosis) | |||
| Peak Duration on Weekdays | Longest continuous number of hours during which the average hourly passenger flow on weekdays exceeds 80% of the maximum value | |||
| Weekend Passenger Flow Volume | Average Daytime Heat on Weekends | Average heat value from 06:00 to 18:00 on weekends | ||
| Evening Peak Heat on Weekends | Average heat value from 18:00 to 22:00 on weekends | |||
| Late-Night/Early-Morning Heat on Weekends | Average heat value from 22:00 to 06:00 the next day on weekends | |||
| Weekend Passenger Flow Balance | Weekend DNR | Day-night ratio: ratio of average daytime heat on weekends to evening peak heat on weekdays | ||
| Weekend PVR | Peak-valley ratio: ratio of average daytime heat on weekends to the difference between the maximum and minimum hourly heat values during the evening peak on weekdays | |||
| All-Day Kurtosis on Weekends | Statistic describing the peakedness or flatness of passenger-flow distribution; here the Kurtosis indicator is used (sample excess kurtosis) | |||
| Peak Duration on Weekends | Longest continuous number of hours during which the average hourly passenger flow on weekends exceeds 80% of the maximum value | |||
| Spatial Characteristics of Commercial Organization | Gaode map’s POI | Shopping Malls | Presence of Shopping Malls | Whether shopping mall POIs are present within an 800 m buffer around each sampling point |
| Distinctive Commercial Streets | Presence of Distinctive Commercial Streets | Whether distinctive commercial street POIs are present within an 800 m buffer around each sampling point | ||
| Land Rent Characteristics | Anjuke website | Property Value | Property Value | Log-transformed average listing price of surrounding second-hand housing |
| Commercial Format Diversity | Gaode map’s POI | Number of commercial Types | Number of commercial Types | Number of commercial format POI categories covered within a 400 m buffer around each sampling point |
| Commercial format Richness | Commercial Format Shannon Index | Calculated from the proportions of commercial format POI categories within a 400 m buffer around each sampling point | ||
| Commercial format Dominance | Commercial Format Simpson Index |
Table 2.
Quality assessment of the influence-path analysis models.
| Area | Diversity Indicator | Adjusted R² | SRMR (Saturated / Estimated) |
|---|---|---|---|
| Urban Core | Commercial -Type Shannon Index | 0.238 | 0.055 / 0.104 |
| Number of Commercial Types | 0.438 | 0.056 / 0.105 | |
| Commercial -Type Simpson Index | 0.897 | 0.055 / 0.098 | |
| Suburban Area | Commercial -Type Shannon Index | 0.203 | 0.066 / 0.104 |
| Number of Commercial Types | 0.36 | 0.072 / 0.105 | |
| Commercial -Type Simpson Index | 0.091 | 0.067 / 0.101 |
Table 3.
Comparison of direct influence-path coefficients.
| Data Group | Influence Path | Commercial Format Richness (Shannon Index) | Number of Commercial Types | Commercial Format Dominance (Simpson Index) |
|---|---|---|---|---|
| Urban Core | Tertiary Grade-A Hospitals → Commercial Format Diversity | / | 0.096 | 0.092 |
| Weekend Passenger Flow Volume → Commercial Format Diversity | / | 0.129 | -0.354 | |
| Weekend Passenger Flow Balance → Commercial Format Diversity | 0.011 | -0.09 | -0.089 | |
| Land Rent Characteristics → Commercial Format Diversity | 0.006 | -0.158 | / | |
| City-Level Public Service Facilities → Commercial Format Diversity | -0.007 | 0.058 | 0.151 | |
| Local Location → Commercial Format Diversity | -0.006 | -0.044 | -0.065 | |
| Residential Land-Use Proportion → Commercial Format Diversity | -0.021 | 0.226 | 0.176 | |
| Industrial Land-Use Proportion → Commercial Format Diversity | -0.003 | -0.083 | -0.097 | |
| Weekday Passenger Flow Volume → Commercial Format Diversity | / | 0.176 | 0.489 | |
| Development Intensity Characteristics → Commercial Format Diversity | / | 0.229 | 0.118 | |
| Land-Use Mix Characteristics → Commercial Format Diversity | 0.888 | 0.247 | 0.139 | |
| Community-Level Public Service Facilities → Commercial Format Diversity | / | 0.262 | 0.326 | |
| Shopping Malls → Commercial Format Diversity | -0.008 | 0.313 | 0.107 | |
| Green Environment Characteristics → Commercial Format Diversity | / | 0.074 | 0.035 | |
| Station Proximity → Commercial Format Diversity | / | -0.043 | / | |
| Station Proximity × Weekend Passenger Flow Volume → Commercial Format Diversity | / | 0.057 | 0.086 | |
| Station Proximity × Weekend Passenger Flow Balance → Commercial Format Diversity | / | 0.076 | 0.072 | |
| Station Proximity × Residential Land-Use Proportion → Commercial Format Diversity | / | / | -0.055 | |
| Road Network Characteristics → Commercial Format Diversity | -0.007 | 0.062 | 0.078 | |
| Suburban Area | Tertiary Grade-A Hospitals → Commercial Format Diversity | / | 0.069 | / |
| Macro Location → Commercial Format Diversity | 0.093 | 0.179 | 0.066 | |
| Weekend Passenger Flow Balance → Commercial Format Diversity | -0.058 | -0.054 | -0.124 | |
| Commercial Land-Use Proportion → Commercial Format Diversity | 0.092 | 0.241 | 0.043 | |
| Land Rent Characteristics → Commercial Format Diversity | -0.035 | -0.147 | / | |
| City-Level Public Service Facilities → Commercial Format Diversity | 0.288 | 0.058 | / | |
| Local Location → Commercial Format Diversity | -0.053 | -0.017 | -0.055 | |
| Residential Land-Use Proportion → Commercial Format Diversity | 0.109 | 0.133 | 0.089 | |
| Industrial Land-Use Proportion → Commercial Format Diversity | -0.098 | -0.03 | -0.137 | |
| Weekday Passenger Flow Volume → Commercial Format Diversity | 0.189 | 0.236 | 0.294 | |
| Weekday Passenger Flow Balance → Commercial Format Diversity | 0.052 | 0.054 | / | |
| Development Intensity Characteristics → Commercial Format Diversity | 0.1 | 0.21 | / | |
| Land-Use Mix Characteristics → Commercial Format Diversity | 0.045 | -0.042 | 0.074 | |
| Community-Level Public Service Facilities → Commercial Format Diversity | 0.333 | 0.429 | 0.239 | |
| Shopping Malls → Commercial Format Diversity | 0.23 | 0.452 | 0.086 | |
| Station Proximity → Commercial Format Diversity | -0.066 | -0.254 | 0.011 | |
| Station Proximity × Commercial Land-Use Proportion → Commercial Format Diversity | 0.043 | / | 0.037 | |
| Station Proximity × City-Level Public Service Facilities → Commercial Format Diversity | 0.067 | 0.173 | / | |
| Station Proximity × Residential Land-Use Proportion → Commercial Format Diversity | 0.055 | / | 0.067 | |
| Station Proximity × Road Network Characteristics → Commercial Format Diversity | 0.033 | 0.017 | 0.04 | |
| Station Proximity × Major Scenic Attractions → Commercial Format Diversity | / | 0.101 | / | |
| Road Network Characteristics → Commercial Format Diversity | 0.052 | 0.053 | 0.059 | |
| Major Scenic Attractions → Commercial Format Diversity | / | 0.122 | / |
Note: ‘/’ indicates that the result in the corresponding column is not significant.
Table 4.
Comparison of indirect influence-path coefficients.
| Data Group | Influence Pathway | Path Coefficients | ||
|---|---|---|---|---|
| commercial format diversity (Shannon Index) |
Number of commercial Types |
commercial format Dominance (Simpson Index) |
||
| Urban Core | City-Level Public Service Facilities → Weekend Passenger Flow Volume → commercial format diversity | -0.278 | 0.101 | -0.214 |
| Macro location → Weekday Passenger Flow Volume → commercial format diversity | -0.106 | -0.039 | -0.081 | |
| Shopping Malls → Weekend Passenger Flow Volume → commercial format diversity | -0.09 | 0.033 | -0.07 | |
| Tertiary Grade-A Hospitals → Weekend Passenger Flow Volume → commercial format diversity | -0.07 | / | -0.053 | |
| Major Attractions → Weekend Passenger Flow Volume → commercial format diversity | -0.067 | / | -0.052 | |
| Distinctive Commercial Streets → Weekend Passenger Flow Volume → commercial format diversity | -0.036 | / | -0.03 | |
| Land-Use Mix → Weekday Passenger Flow Volume → commercial format diversity | -0.035 | / | / | |
| Road Network → Weekend Passenger Flow Volume → commercial format diversity | -0.031 | / | / | |
| Industrial Land Use → Weekday Passenger Flow Volume → commercial format diversity | -0.031 | / | / | |
| Industrial Land Use → Weekend Passenger Flow Volume → commercial format diversity | 0.035 | / | / | |
| City-Level Public Service Facilities → Weekend Passenger Flow Balance → commercial format diversity | 0.044 | 0.044 | / | |
| Tertiary Grade-A Hospitals → Weekday Passenger Flow Volume → commercial format diversity | 0.063 | / | 0.048 | |
| Shopping Malls → Weekday Passenger Flow Volume → commercial format diversity | 0.076 | / | 0.056 | |
| Local Location → Weekday Passenger Flow Volume → commercial format diversity | 0.11 | 0.039 | 0.082 | |
| Macro location → Weekend Passenger Flow Volume → commercial format diversity | 0.11 | -0.041 | 0.087 | |
| Community-Level Public Service Facilities → Weekday Passenger Flow Volume → commercial format diversity | 0.12 | 0.041 | 0.09 | |
| Development Intensity → Weekday Passenger Flow Volume → commercial format diversity | 0.131 | 0.047 | 0.099 | |
| City-Level Public Service Facilities → Weekday Passenger Flow Volume → commercial format diversity | 0.274 | 0.099 | 0.205 | |
| Shopping Malls → Land Rent Characteristics → commercial format diversity | / | 0.032 | / | |
| Weekend Passenger Flow Balance → Land Rent Characteristics → commercial format diversity | / | 0.037 | / | |
| Weekday Passenger Flow Balance → Land Rent Characteristics → commercial format diversity | / | 0.045 | / | |
| Macro location → Land Rent Characteristics → commercial format diversity | / | 0.052 | / | |
| Suburban Area | Macro location → Weekday Passenger Flow Volume → commercial format diversity | -0.067 | -0.082 | -0.105 |
| Community-Level Public Service Facilities → Weekend Passenger Flow Volume → commercial format diversity | / | / | -0.068 | |
| Tertiary Grade-A Hospitals → Weekend Passenger Flow Volume → commercial format diversity | / | / | -0.043 | |
| Local Location → Weekend Passenger Flow Volume → commercial format diversity | / | / | -0.033 | |
| Shopping Malls → Weekday Passenger Flow Volume → commercial format diversity | / | / | 0.032 | |
| Residential Land Use → Weekday Passenger Flow Volume → commercial format diversity | / | / | 0.033 | |
| Local Location → Weekday Passenger Flow Volume → commercial format diversity | 0.034 | 0.042 | 0.054 | |
| Tertiary Grade-A Hospitals → Weekday Passenger Flow Volume → commercial format diversity | 0.036 | 0.043 | 0.059 | |
| Development Intensity → Weekday Passenger Flow Volume → commercial format diversity | 0.037 | 0.045 | 0.061 | |
| Weekend Passenger Flow Balance → Land Rent Characteristics → commercial format diversity | / | 0.051 | / | |
| Macro location → Weekend Passenger Flow Volume → commercial format diversity | / | / | 0.063 | |
| Community-Level Public Service Facilities → Weekday Passenger Flow Volume → commercial format diversity | 0.047 | 0.053 | 0.075 | |
| Macro location → Land Rent Characteristics → commercial format diversity | / | 0.089 | / | |
| City-Level Public Service Facilities → Weekday Passenger Flow Volume → commercial format diversity | 0.119 | 0.144 | 0.195 | |
Note: ‘/’ indicates that the result in the corresponding column is not significant or that the path coefficient is very small (<0.03).
Disclaimer/Publisher’s Note: The statements, opinions and data contained in all publications are solely those of the individual author(s) and contributor(s) and not of MDPI and/or the editor(s). MDPI and/or the editor(s) disclaim responsibility for any injury to people or property resulting from any ideas, methods, instructions or products referred to in the content. |
© 2026 by the authors. Licensee MDPI, Basel, Switzerland. This article is an open access article distributed under the terms and conditions of the Creative Commons Attribution (CC BY) license (http://creativecommons.org/licenses/by/4.0/).
Copyright: This open access article is published under a Creative Commons CC BY 4.0 license, which permit the free download, distribution, and reuse, provided that the author and preprint are cited in any reuse.


