

Submitted:
30 June 2026
Posted:
01 July 2026
You are already at the latest version
Abstract
The planetary boundary layer height (PBLH) represents an essential parameter of the climate system, which controls the exchanges of momentum, heat, moisture, and pollutants between the terrestrial surface and the free atmosphere. In this study, the spatiotemporal variability of the PBLH in Romania during the warm season (May–September) was investigated utilizing the ERA5 reanalysis data for the 1989-2022 period. To identify the dominant modes of variability, the Empirical Orthogonal Function (EOF) analysis was applied, conducted separately for the daily, daytime, and nighttime fields of the PBLH. The results highlight the fact that the first EOF mode explains more than half of the total PBLH variability and is associated with the variability of the large-scale atmospheric circulation, represented by the North Atlantic Oscillation (NAO). The subsequent EOF modes reflect the influence of regional thermodynamic processes, heatwaves, atmospheric moisture, and the meridional circulation modulated by the Carpathian topography. The findings indicate that the evolution of the planetary boundary layer in Romania is determined by the interaction between the hemispheric-scale atmospheric circulation, regional thermodynamic processes, and the topographic effects associated with the Carpathian arc. These results contribute to the understanding of the mechanisms that control PBLH variability in Southeastern Europe and provide useful information for climatological and air quality studies.
Keywords:
planetary boundary layer height
; ERA5
; EOF analysis
; North Atlantic Oscillation
; climate variability
1. Introduction
The planetary boundary layer (PBL - Planetary Boundary Layer) represents the lowest part of the troposphere and constitutes the zone of direct interaction between the terrestrial surface and the free atmosphere. Within its interior, intense exchanges of momentum, heat, moisture, and atmospheric constituents take place, which are processes that directly influence weather evolution, regional climate, and air quality [1,2]. For this reason, the planetary boundary layer height (PBLH - Planetary Boundary Layer Height) is considered one of the most important parameters utilized for describing the vertical structure of the lower atmosphere and the efficiency of turbulent mixing processes.
The variability of the PBLH is controlled by the complex interaction between radiative forcing, the characteristics of the underlying surface, synoptic-scale atmospheric circulation, convective processes, and topographic effects [1,2]. During the warm season, the intense heating of the surface leads to the development of a deep convective boundary layer, whereas the distribution of moisture, convective activity, and regional atmospheric circulation can significantly modify its structure and evolution. Modifications in the boundary layer height influence both the development of severe weather phenomena and the dispersion of atmospheric pollutants, as well as aerosol transport processes, thus representing an essential element in climatological and environmental studies.
In recent decades, the development of modern atmospheric reanalysis products has allowed the investigation of planetary boundary layer variability over extended periods and at high spatial resolutions. Among these, the ERA5 reanalysis data provided by the European Centre for Medium-Range Weather Forecasts (ECMWF) offer one of the most complete and coherent representations of the state of the atmosphere, being widely utilized in studies dedicated to PBL climatology and regional atmospheric variability [3]. The temporal consistency and high resolution of the ERA5 dataset allow the identification of the dominant mechanisms that control the evolution of the PBLH over time intervals on the order of decades. These characteristics make ERA5 one of the main data sources utilized in climatological studies dedicated to the planetary boundary layer.
Recently, Timofte et al. [4] conducted a climatological analysis of the long-term evolution of the planetary boundary layer in southern Romania [5], comparing the PBL height determined via the Stull method based on atmospheric sounding with the estimations provided by the ERA5 reanalysis. The results highlighted a good consistency between the two approaches and demonstrated the utility of ERA5 products for investigating the climatological variability of the PBLH. Furthermore, the study revealed significant differences between the daytime and nighttime structures of the boundary layer, underlining the importance of analyzing these components separately.
For the investigation of the spatio-temporal variability of meteorological fields, statistical dimensionality reduction methods are frequently utilized, among which the Empirical Orthogonal Function analysis (EOF - Empirical Orthogonal Functions) represents one of the most widespread and robust approaches [6,7,8]. The method allows the identification of the dominant modes of variability and the separation of signals associated with different physical mechanisms that control the evolution of an atmospheric variable. EOF has been successfully utilized for investigating the main modes of climate variability, including the North Atlantic Oscillation (NAO), the El Nino - Southern Oscillation (ENSO), and the Pacific Decadal Oscillation (PDO), as well as for characterizing regional climate variability and atmospheric teleconnections [6,7,8].
The application of EOF analysis to investigate PBLH variability in Romania was previously explored in a preliminary study based on ERA5 data for the 1989–2019 period [9], which highlighted the existence of a link between the spatial distribution of the PBLH and the North Atlantic Oscillation (NAO).
Among the hemispheric-scale atmospheric circulation mechanisms, the North Atlantic Oscillation (NAO) represents one of the most important factors influencing European climate variability. Numerous studies have highlighted the impact of the NAO on air temperature, precipitation, and atmospheric circulation in Europe and in the region of Romania [10,11]. In Romania, the NAO signal is observable in both temperature and precipitation variability, influencing regional atmospheric circulation and seasonal climate conditions [10,11].
Romania represents a particularly interesting region for the study of planetary boundary layer variability due to its position at the interference of Atlantic, continental, Mediterranean, and Pontic atmospheric influences. Additionally, the presence of the Carpathian arc generates important regional contrasts and significantly modifies the atmospheric circulation, the distribution of precipitation, and the mixing processes in the lower atmosphere. These particularities determine a pronounced spatial variability of the planetary boundary layer, especially during the warm season, when convective processes and local thermal effects reach their maximum intensity. Previous studies have highlighted the fact that climate variability in Romania is significantly influenced by large-scale atmospheric processes and atmospheric teleconnections that modulate the regional thermal and pluviometric regime [12]. Furthermore, recent climatological observations indicate significant changes in air temperature and precipitation regimes over the territory of Romania in recent decades [12,13].
Regional research dedicated to the warm season has highlighted specific features of the planetary boundary layer variability in the Moldavia region (eastern part of Romania) [5] and underlined the influence of regional atmospheric conditions on the PBLH development [14]. These findings suggest the existence of regional control mechanisms regarding the boundary layer development, whose expansion and characterization at a national scale require dedicated climatological investigations. However, although studies exist concerning the climatological evolution of the PBL and regional analyses of its variability in Romania [8,9,14], a systematic, national-scale analysis of the dominant modes of PBLH variability based on EOF analysis and an extended climatological time series is still lacking. In this context, the aim of the present study is to identify and interpret the dominant modes of variability of the PBLH in Romania during the warm season (May - September), utilizing the ERA5 reanalysis data for the 1989 - 2022 period. The study extends previous research both spatially, by investigating the entire territory of Romania, and temporally, by using a climatological series extended up to the year 2022. Additionally, the Empirical Orthogonal Function (EOF) analysis allows the identification and interpretation of the dominant mechanisms controlling the spatiotemporal variability of the PBLH.
The main hypothesis of this study is that the variability of the PBLH in Romania during the warm season is driven by the interaction between hemispheric-scale atmospheric circulation, regional thermodynamic processes, and topographic effects associated with the Carpathian arc. The testing of this hypothesis is performed through the application of the EOF analysis, which allows the identification and quantification of the relative contribution of these mechanisms to the spatio-temporal variability of the PBLH.
2. Materials and Methods
2.1. Data Utilized
The study utilizes data regarding the PBLH originating from the ERA5 reanalysis data provided by the European Centre for Medium-Range Weather Forecasts (ECMWF) [3]. ERA5 offers a coherent representation of the state of the atmosphere through the assimilation of a large number of observations coming from terrestrial, airborne, and satellite sources.
ERA5 has a spatial resolution of approximately 0.25° × 0.25° and an hourly temporal resolution [15,16].
The analysis was performed for the warm season, defined by the May - September (MJJAS) interval, covering a period of 34 years (1989 - 2022). The selected spatial domain encompasses the territory of Romania and neighboring regions, being delimited by the geographical coordinates 40°N-50°N and 20°E-30°E. The extension of the area beyond national borders was essential to mitigate edge effects and to faithfully capture the dominant spatial structures. Three categories of PBLH fields were analyzed: the daily mean height (24 hours), the daytime mean height, and the nighttime mean height.
To interpret the physical mechanisms associated with the EOF modes, additional data were utilized regarding air temperature at 2 m, total precipitable water, specific humidity at 1000 hPa, and atmospheric circulation components originating from the NCEP/NCAR reanalysis data.
2.2. Calculation of Anomalies
In order to eliminate the seasonal signal and to properly highlight the interannual variability, the anomalies of the PBLH were calculated relative to the climatology of the 1998 - 2018 reference period.
The anomaly for each individual grid point was determined as the direct difference between the observed value and the corresponding climatological mean (equation 1):
where represents the anomaly, and represents the climatological mean.
2.3. Empirical Orthogonal Function Analysis (EOF)
In order to identify the dominant modes of spatio - temporal variability of the planetary boundary layer height (PBLH), the Empirical Orthogonal Function analysis (EOF) was applied to the covariance matrix of the anomalies [17]. The construction of the data matrix followed a structured statistical algorithm to correctly isolate the interannual signal of the warm season. In the first stage, starting from the hourly ERA5 values, the monthly means were calculated. From these, the corresponding monthly means for the 1998 - 2018 reference period were subtracted, thereby obtaining the monthly anomalies. Subsequently, in order to exclusively capture the dynamics of the warm season, these anomalies were averaged for the May - September (MJJAS) interval, being structured into three distinct categories of analysis: the daily mean regime (24 hours), the daytime regime, and the nighttime regime. To compensate for the geometric grid distortions caused by the convergence of the meridians toward the north, specific to the 40°N - 50°N domain, the anomalies at each individual grid point were previously weighted by the square root of the cosine of the corresponding latitude.
Through the mathematical decomposition of this matrix, the total variability of the field was separated into independent modes, with each mode being defined by spatial functions (EOFs), which describe the dominant geographical patterns of the PBLH anomalies across the analyzed domain, and principal components (PCs), in the form of time series that reflect the evolution, phase, and intensity over time of each spatial pattern throughout the analyzed 34 years. Due to the mathematical property of orthogonality of the method, each successive EOF mode captures a distinct and independent fraction of the residual variance of the PBLH field, with the information explained by the first mode being extracted prior to the calculation of the next one, thereby ensuring that the identified structures do not overlap in terms of physical meaning. For the dynamical interpretation and the analysis of the associated physical mechanisms, the first 5 EOF modes and their corresponding principal components were selected and plotted, a criterion based on the eigenvalue hierarchy and on their capacity to concentrate the largest part of the total variance of the PBLH field.
2.4. Composite Mean and Composite Anomaly Analysis
In order to provide a thorough physical interpretation of the EOF modes, composite mean fields and composite anomalies were calculated for the years corresponding to the extreme values of the principal components.
The composite method allows the identification of the characteristic synoptic configurations associated with each individual EOF mode and highlights the main dynamic and thermodynamic factors responsible for the PBLH variability.
The following parameters were rigorously analyzed: air temperature at 2 m, total precipitable water, specific humidity at 1000 hPa, the meridional wind component at 1000 hPa, and the North Atlantic Oscillation (NAO) index.
For each individual EOF mode, the years corresponding to both the positive and negative extreme values of the principal components were carefully selected, and the composite means were subsequently calculated separately for these distinct situations.
2.5. Evaluation of the Explained Variance
For each individual EOF mode, the fraction of explained variance was calculated, which represents the eigenvalue associated with that specific EOF mode.
The detailed analysis was limited to the first five EOF modes, which explain the largest part of the total variance and present a robust physical interpretation.
3. Results and Discussions
The EOF analysis applied to the fields of PBLH anomalies highlighted the existence of a small number of dominant modes of variability. The first five EOF modes explain approximately 80% of the total variance of the PBLH field and capture the main physical mechanisms that control the evolution of the PBL in Romania during the warm season.
The analysis focuses on the warm season (May - September, MJJAS) over a 30-year period (1989 - 2022) across Romania. The EOF decomposition was performed on data interpolated onto a regular spatial grid to ensure methodological consistency and to avoid biases associated with irregular spatial sampling.
Only the first five eigenmodes were retained for detailed examination (Figure 1, Figure 2, Figure 3, Figure 4 and Figure 5), as they account for the largest fraction of the total variance in the dataset [18]. These leading modes capture the most significant large-scale structures of variability, while higher-order modes, which explain progressively smaller portions of variance (Table 1), were not considered further in order to maintain statistical robustness and physical interpretability.
The following EOF modes have the values:

Table 1.
Eigenvalues and explained variance for EOF modes 6 to 10.
| EOF Mode | Daily (Value / Variance %) | Diurnal (d) (Value/Variance %) | Nocturnal (n) (Value/Variance %) |
| 6 | 0.9849E+05 / 2.41% | 0.2907E+06 / 2.10% | 0.2399E+05 / 3.40% |
| 7 | 0.8802E+05 / 2.16% | 0.2713E+06 / 1.96% | 0.1523E+05 / 2.16% |
| 8 | 0.7646E+05 / 1.87% | 0.2205E+06 / 1.59% | 0.1349E+05 / 1.91% |
| 9 | 0.6634E+05 / 1.63% | 0.2138E+06 / 1.54% | 0.1190E+05 / 1.68% |
| 10 | 0.5575E+05 / 1.37% | 0.1579E+06 / 1.14% | 0.1579E+06 / 1.30% |
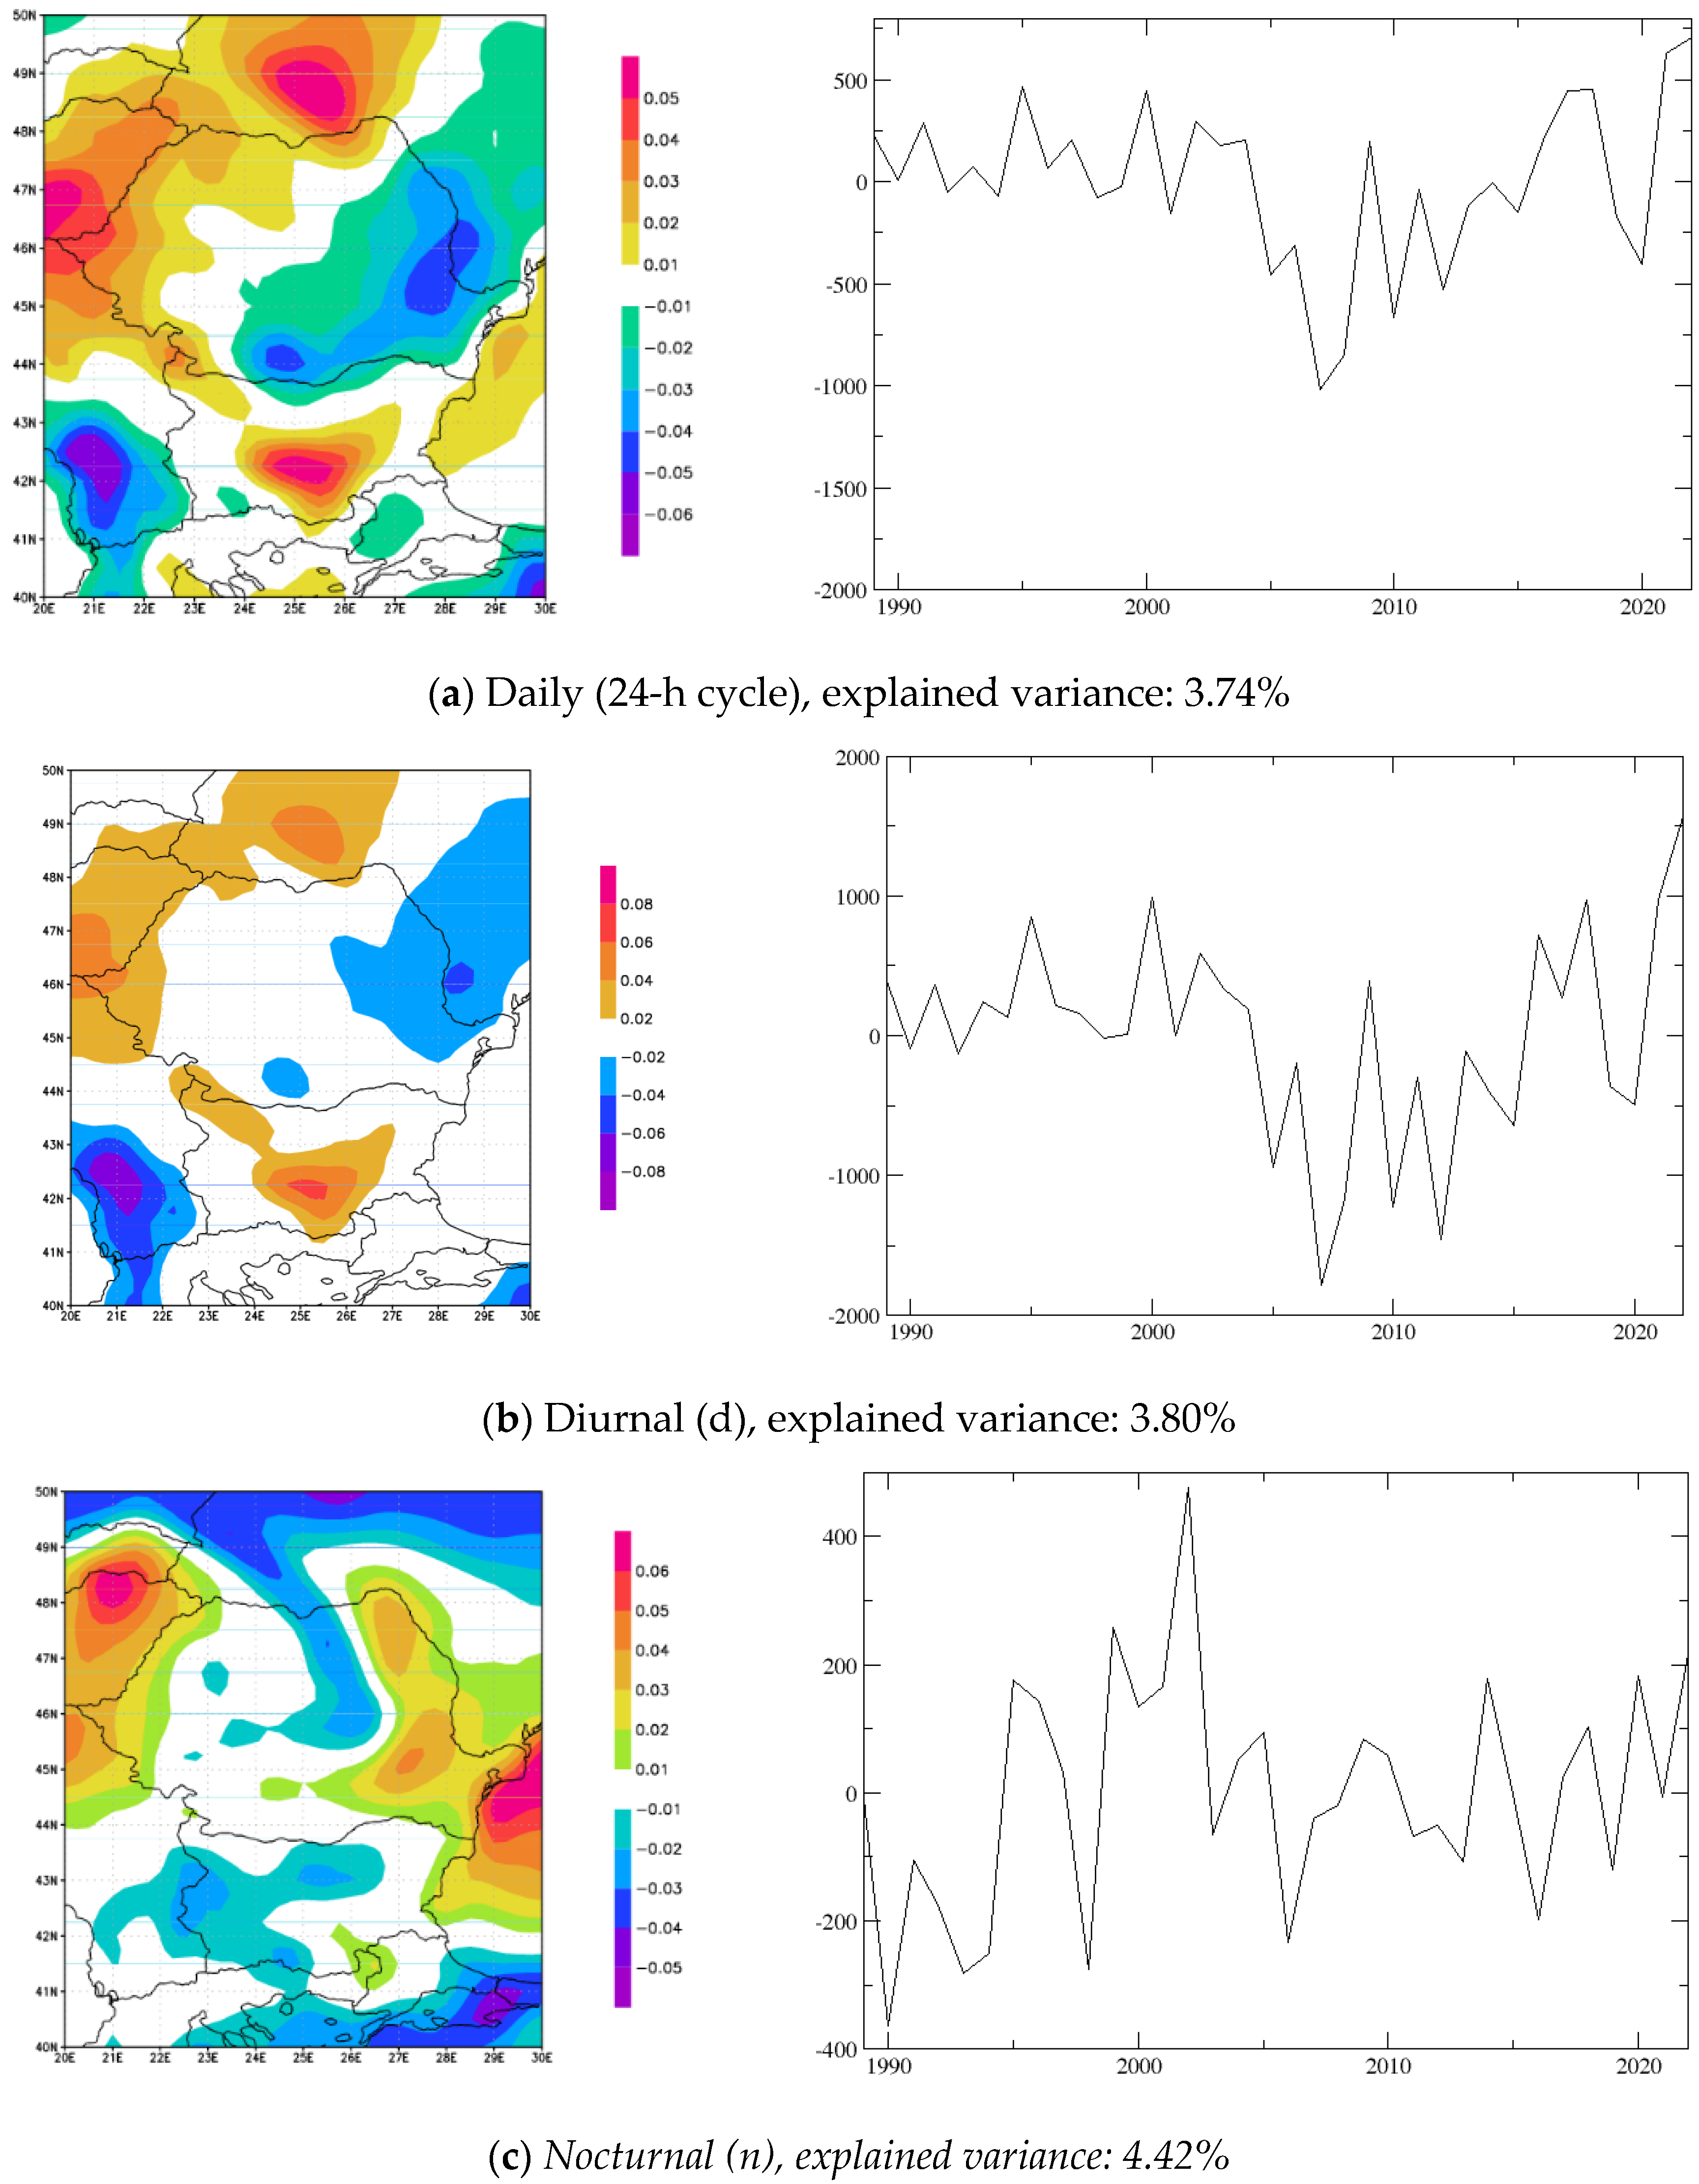
Figure 1.
Spatial patterns (left) and corresponding Principal Component (PC) time series (right) for the first EOF mode. The three panels represent the daily (a), diurnal (b), and nocturnal (c) analysis.
Figure 1.
Spatial patterns (left) and corresponding Principal Component (PC) time series (right) for the first EOF mode. The three panels represent the daily (a), diurnal (b), and nocturnal (c) analysis.
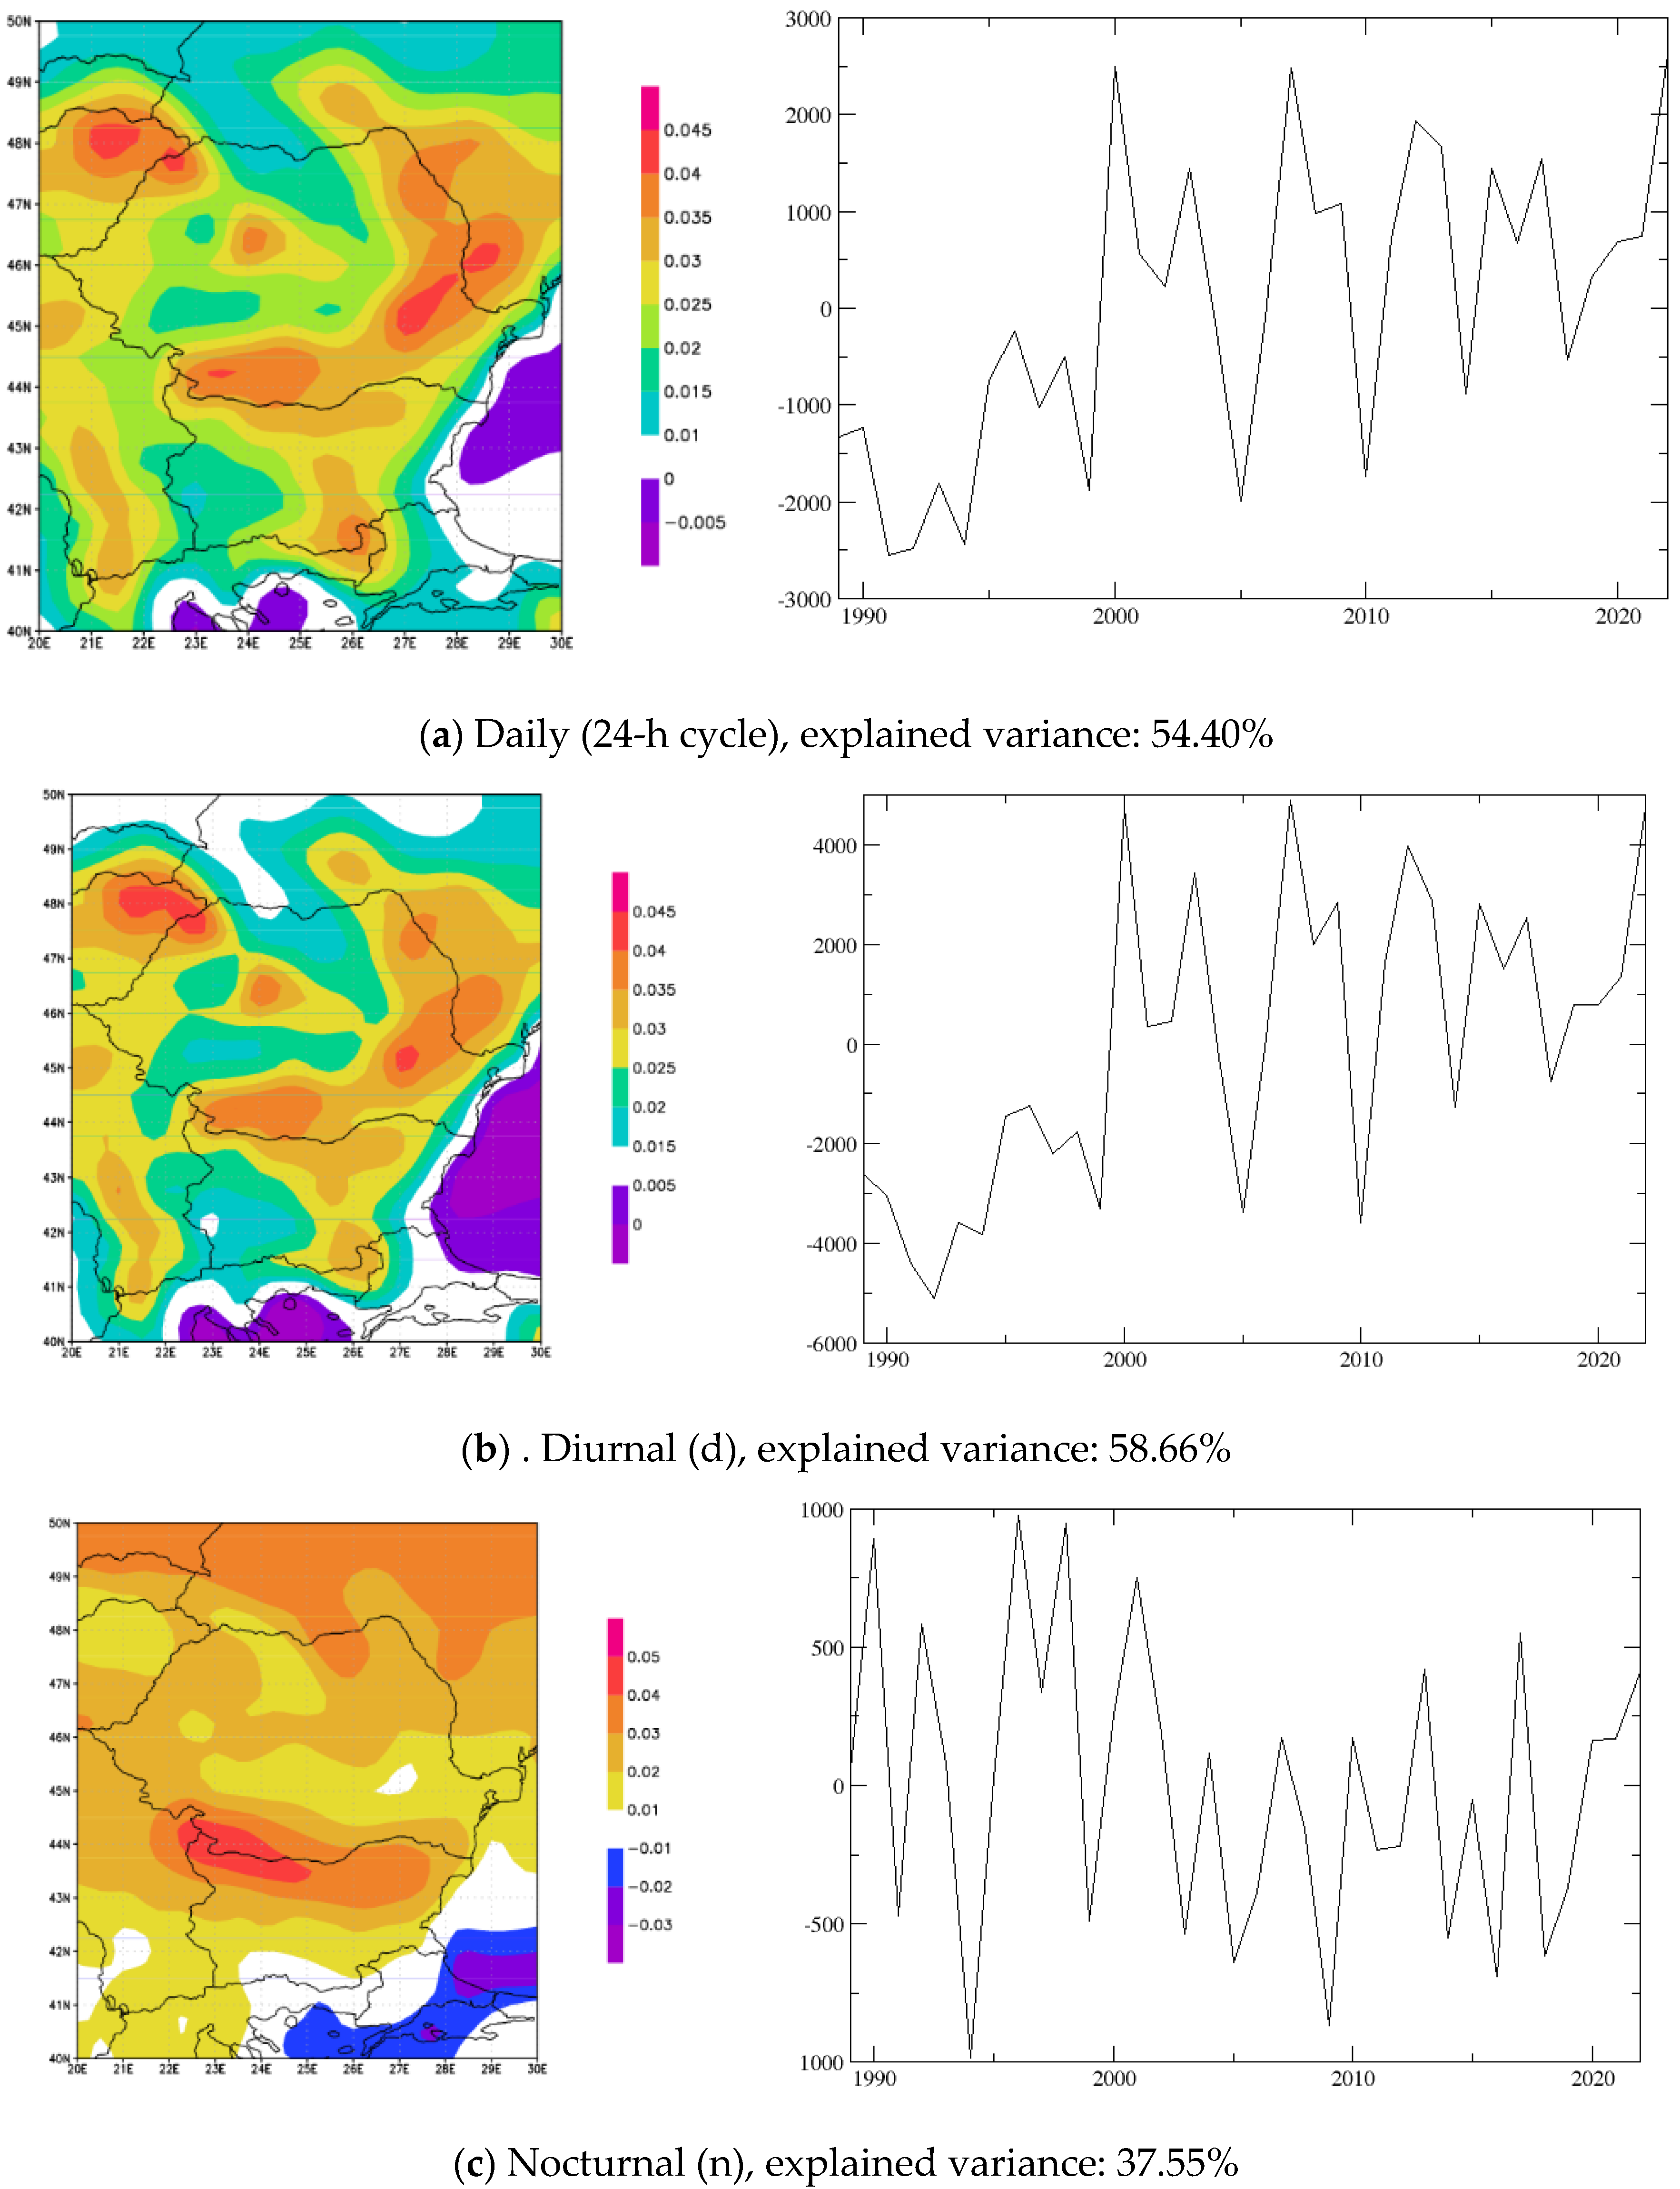
Figure 2.
Spatial patterns (left) and corresponding PC2 time series (right) for the second EOF mode.
Figure 2.
Spatial patterns (left) and corresponding PC2 time series (right) for the second EOF mode.
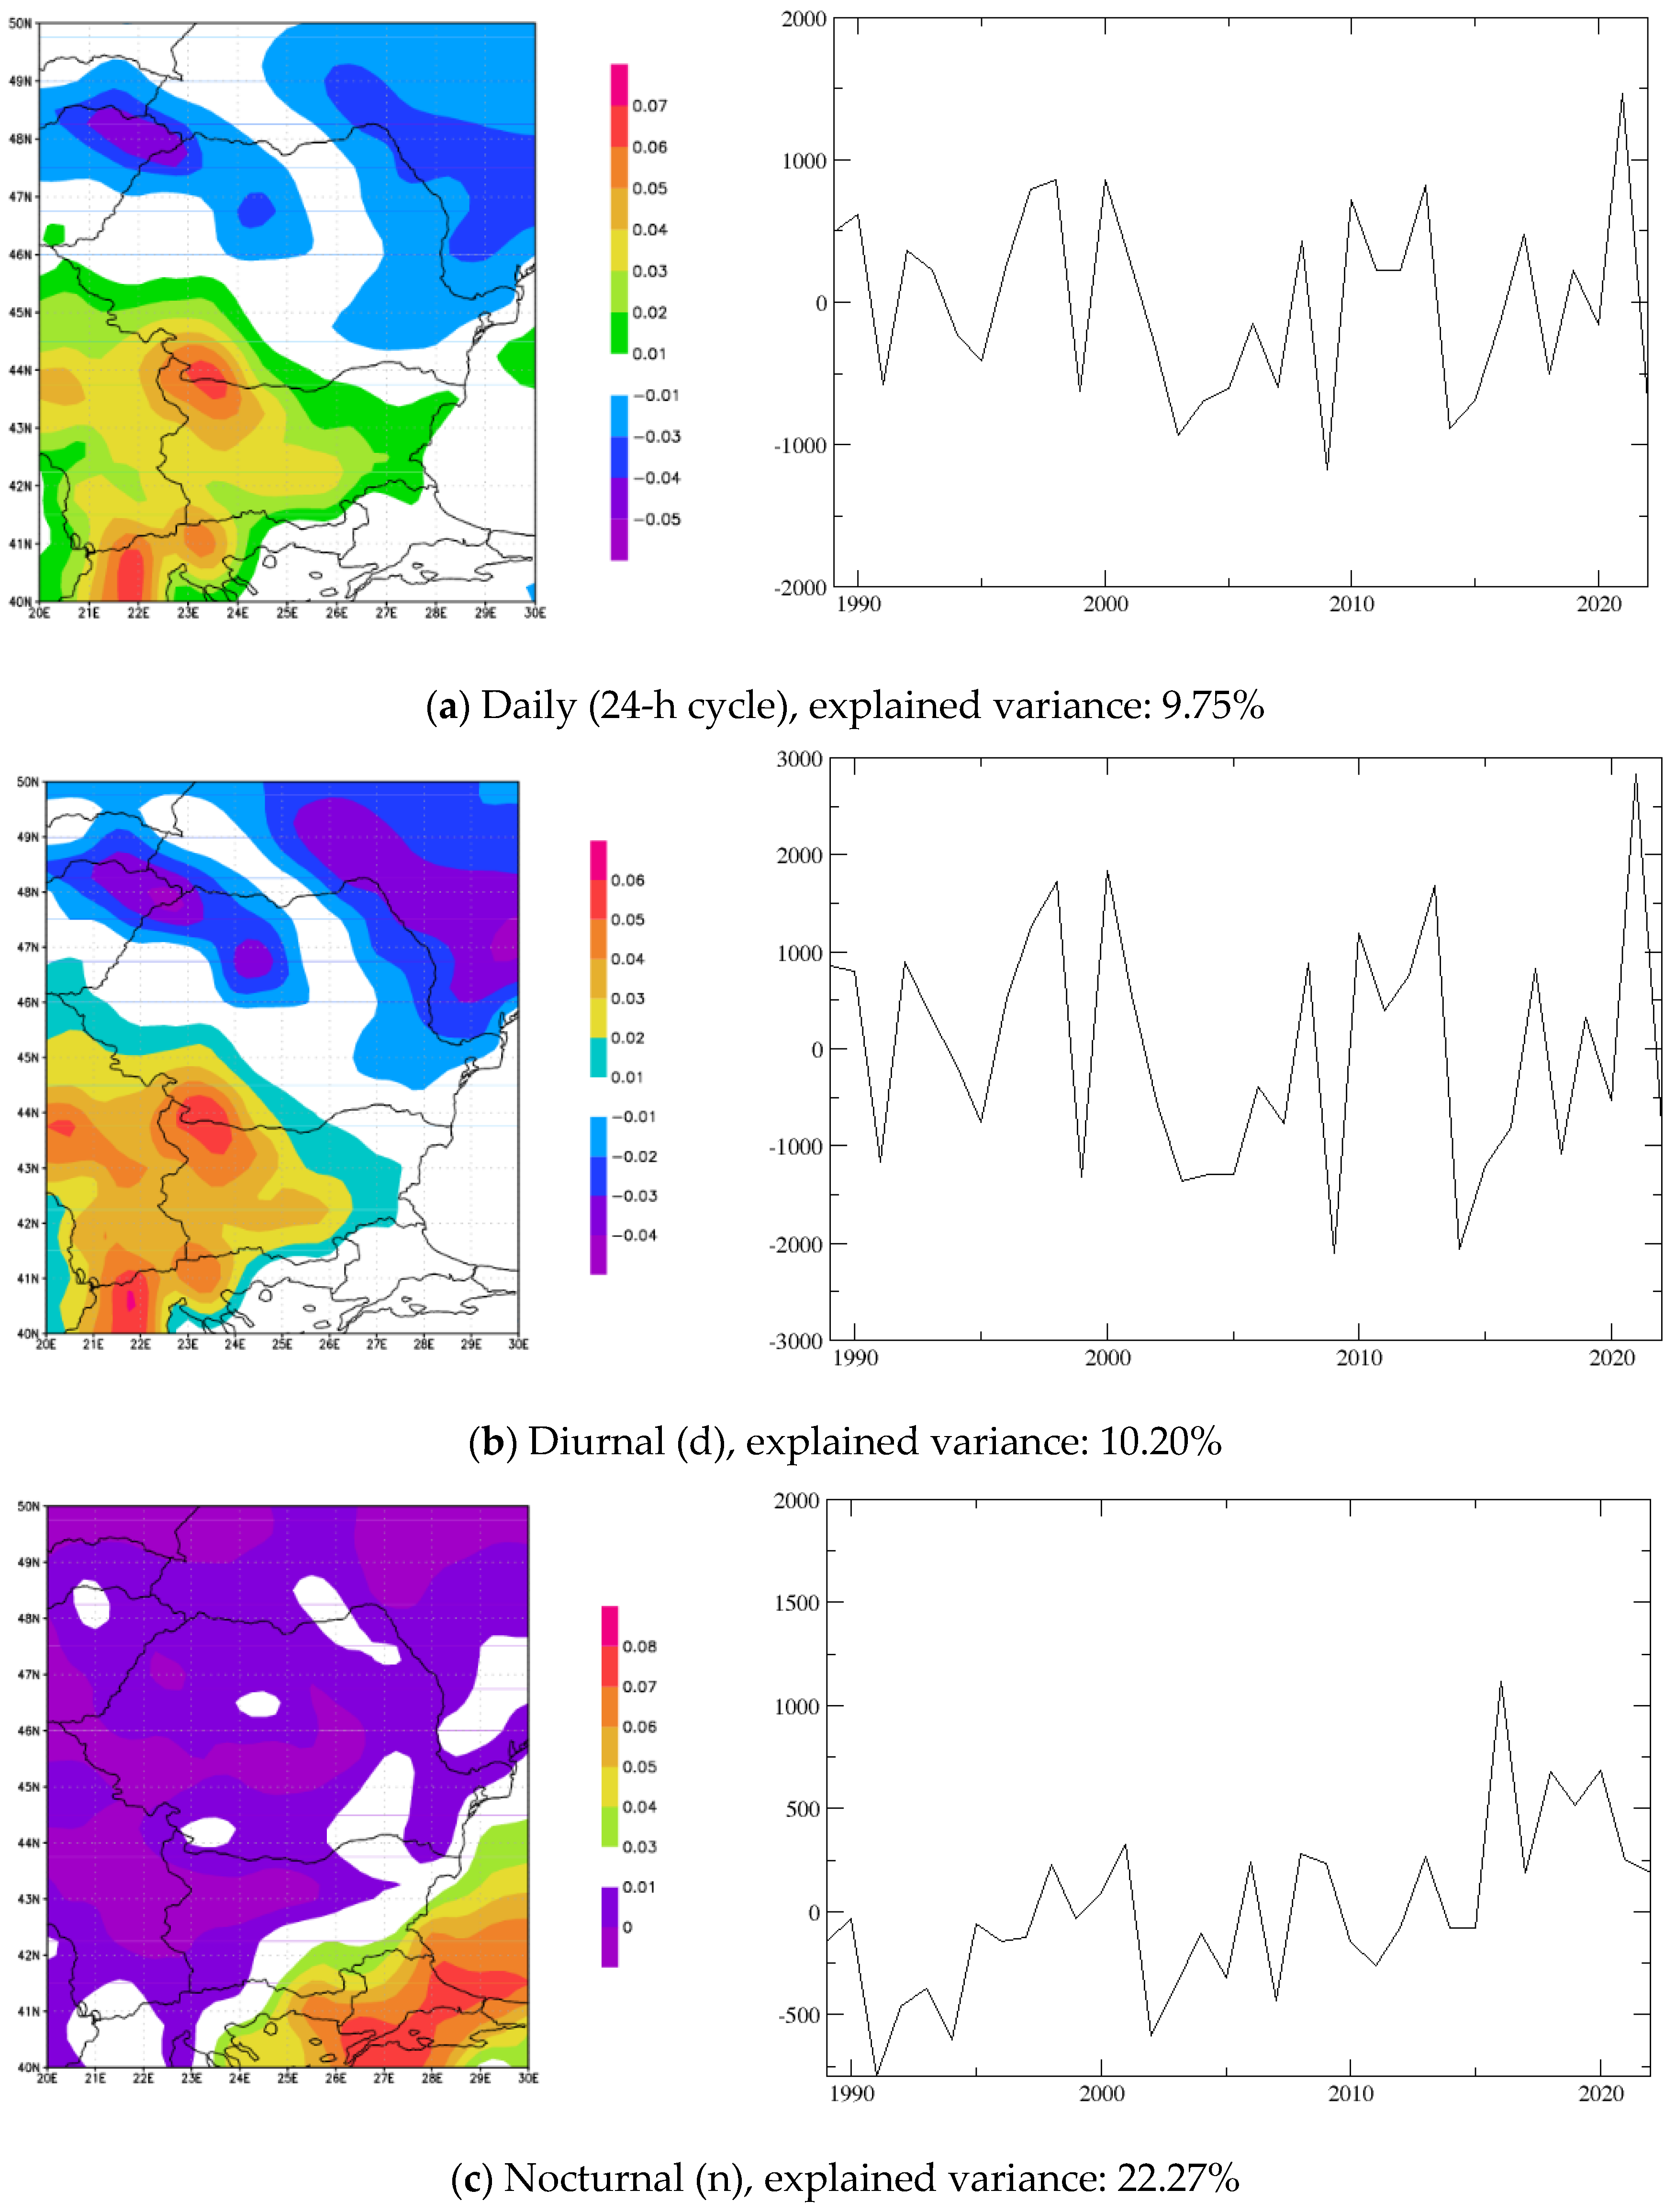
Figure 3.
Spatial patterns (left) and corresponding PC3 time series (right) for the third EOF mode.
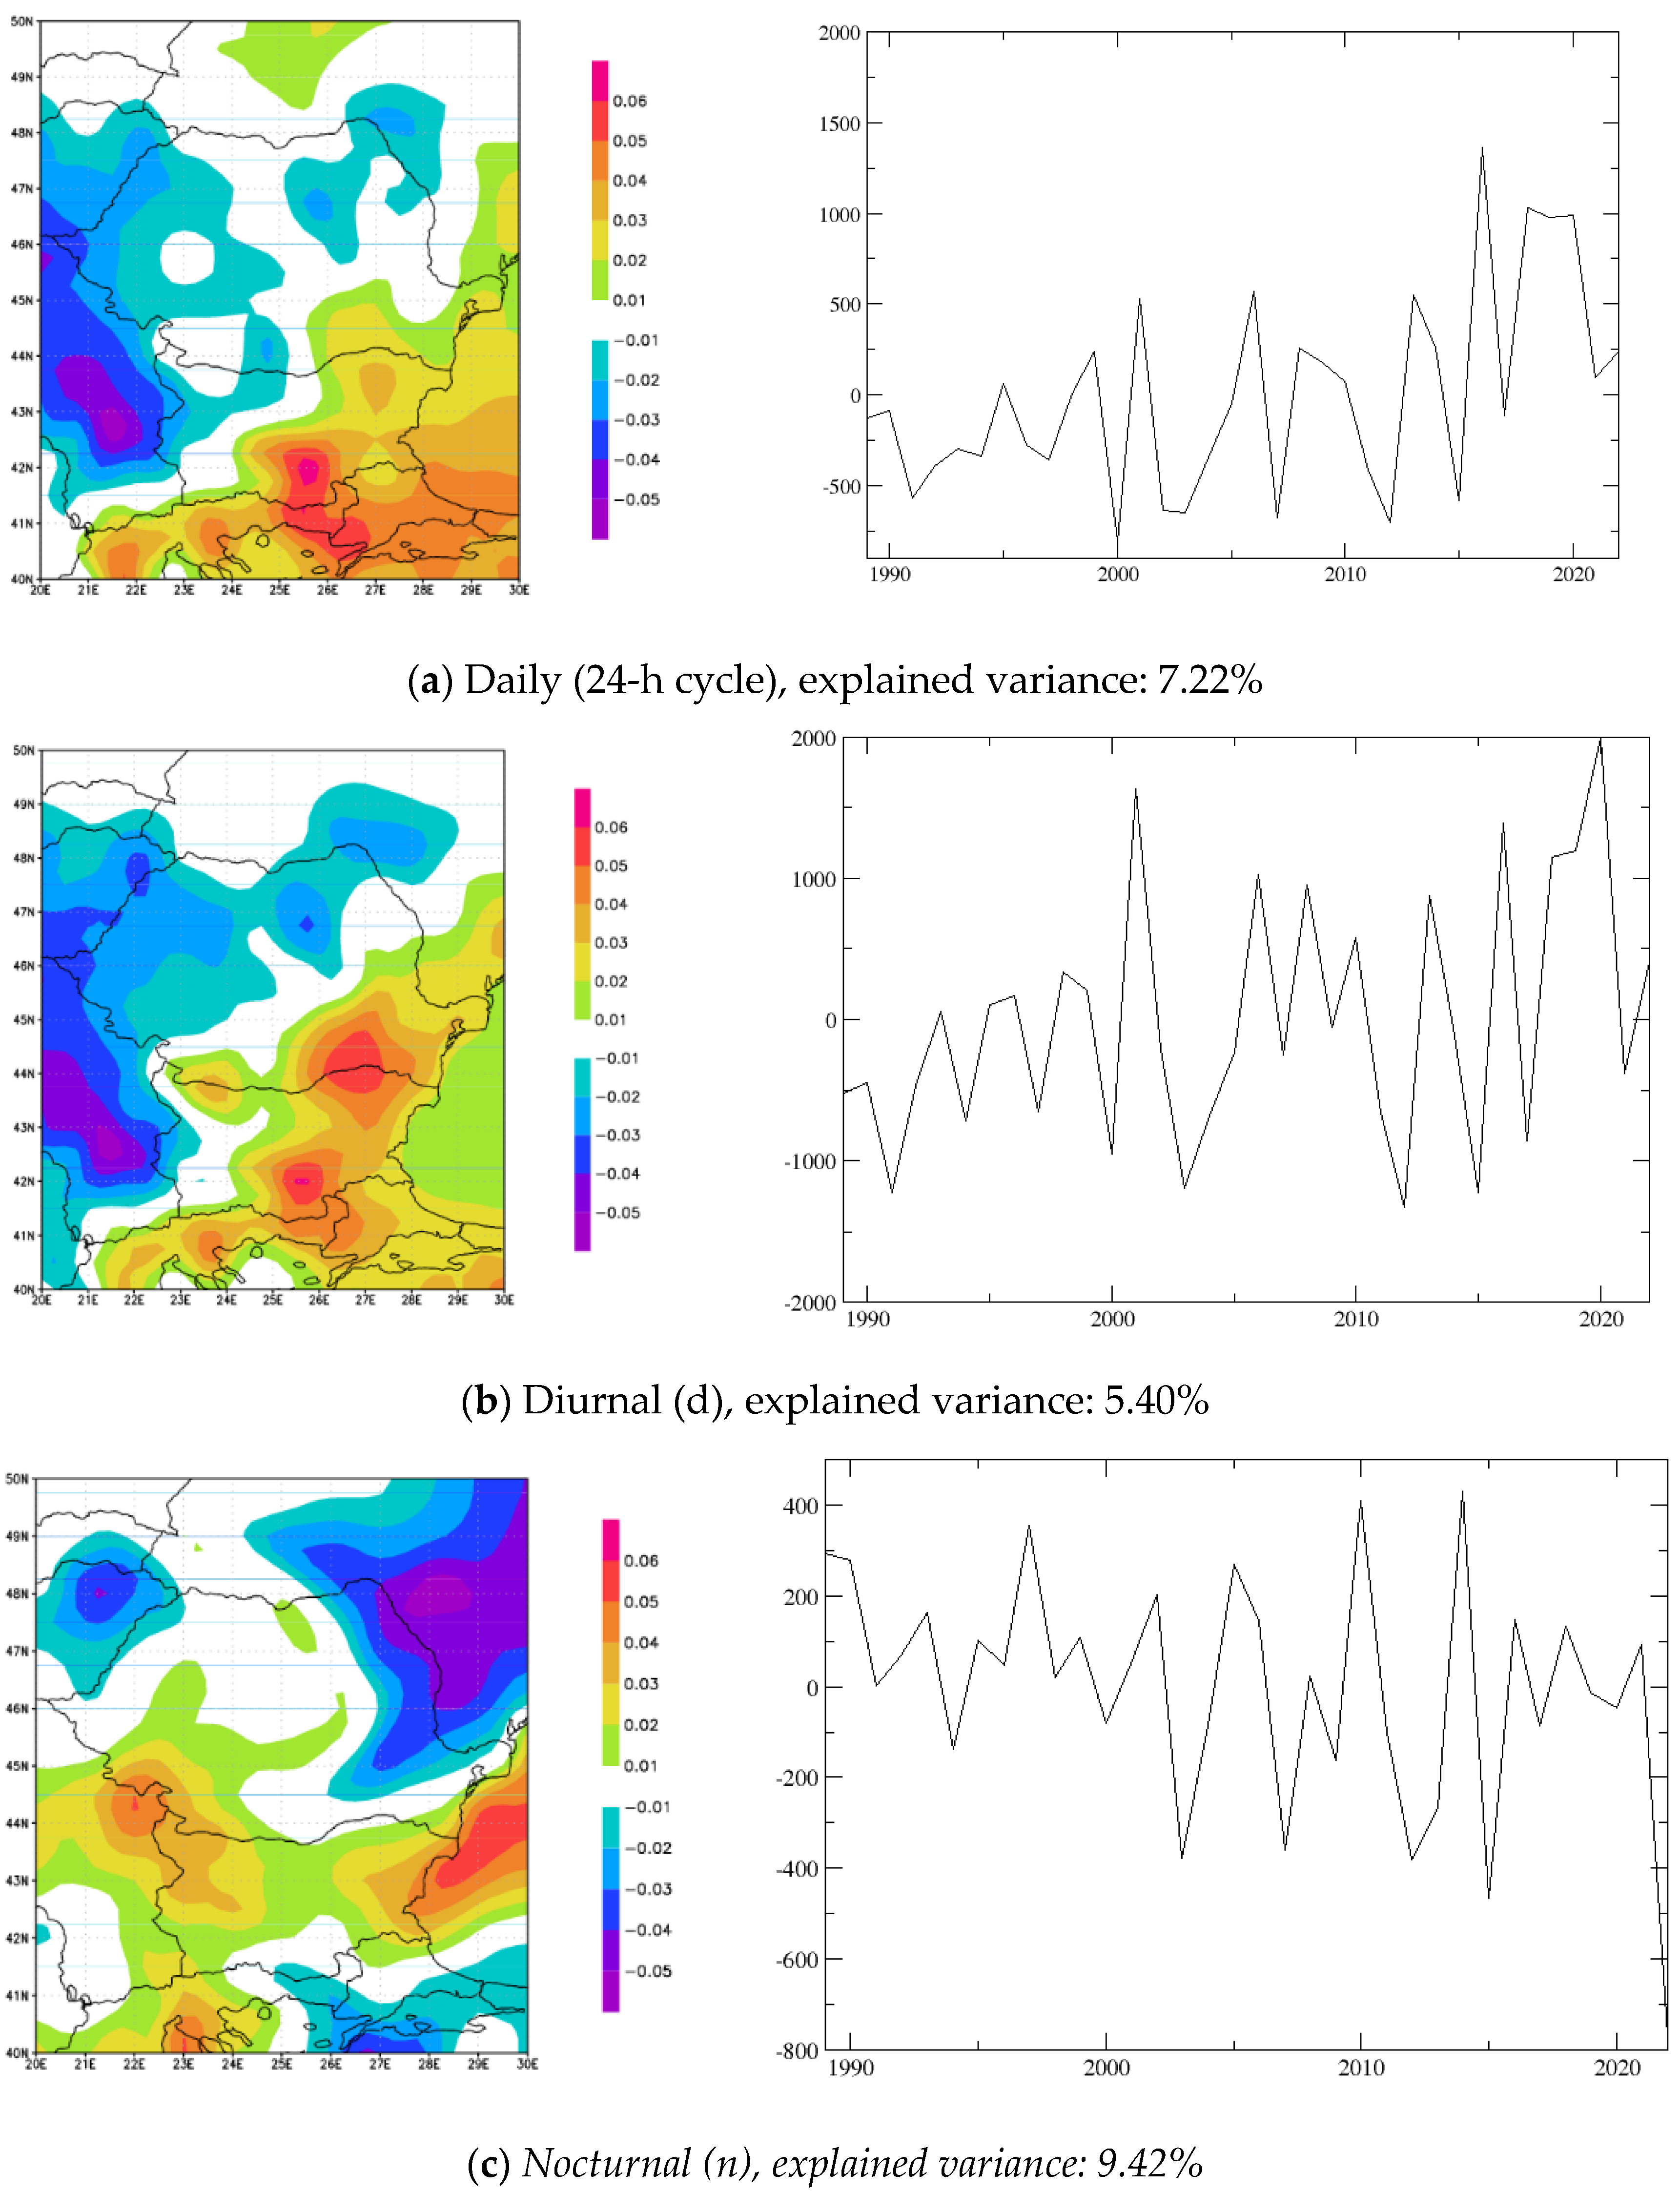
Figure 4.
Spatial patterns (left) and corresponding PC4 time series (right) for the fourth EOF mode.
Figure 4.
Spatial patterns (left) and corresponding PC4 time series (right) for the fourth EOF mode.
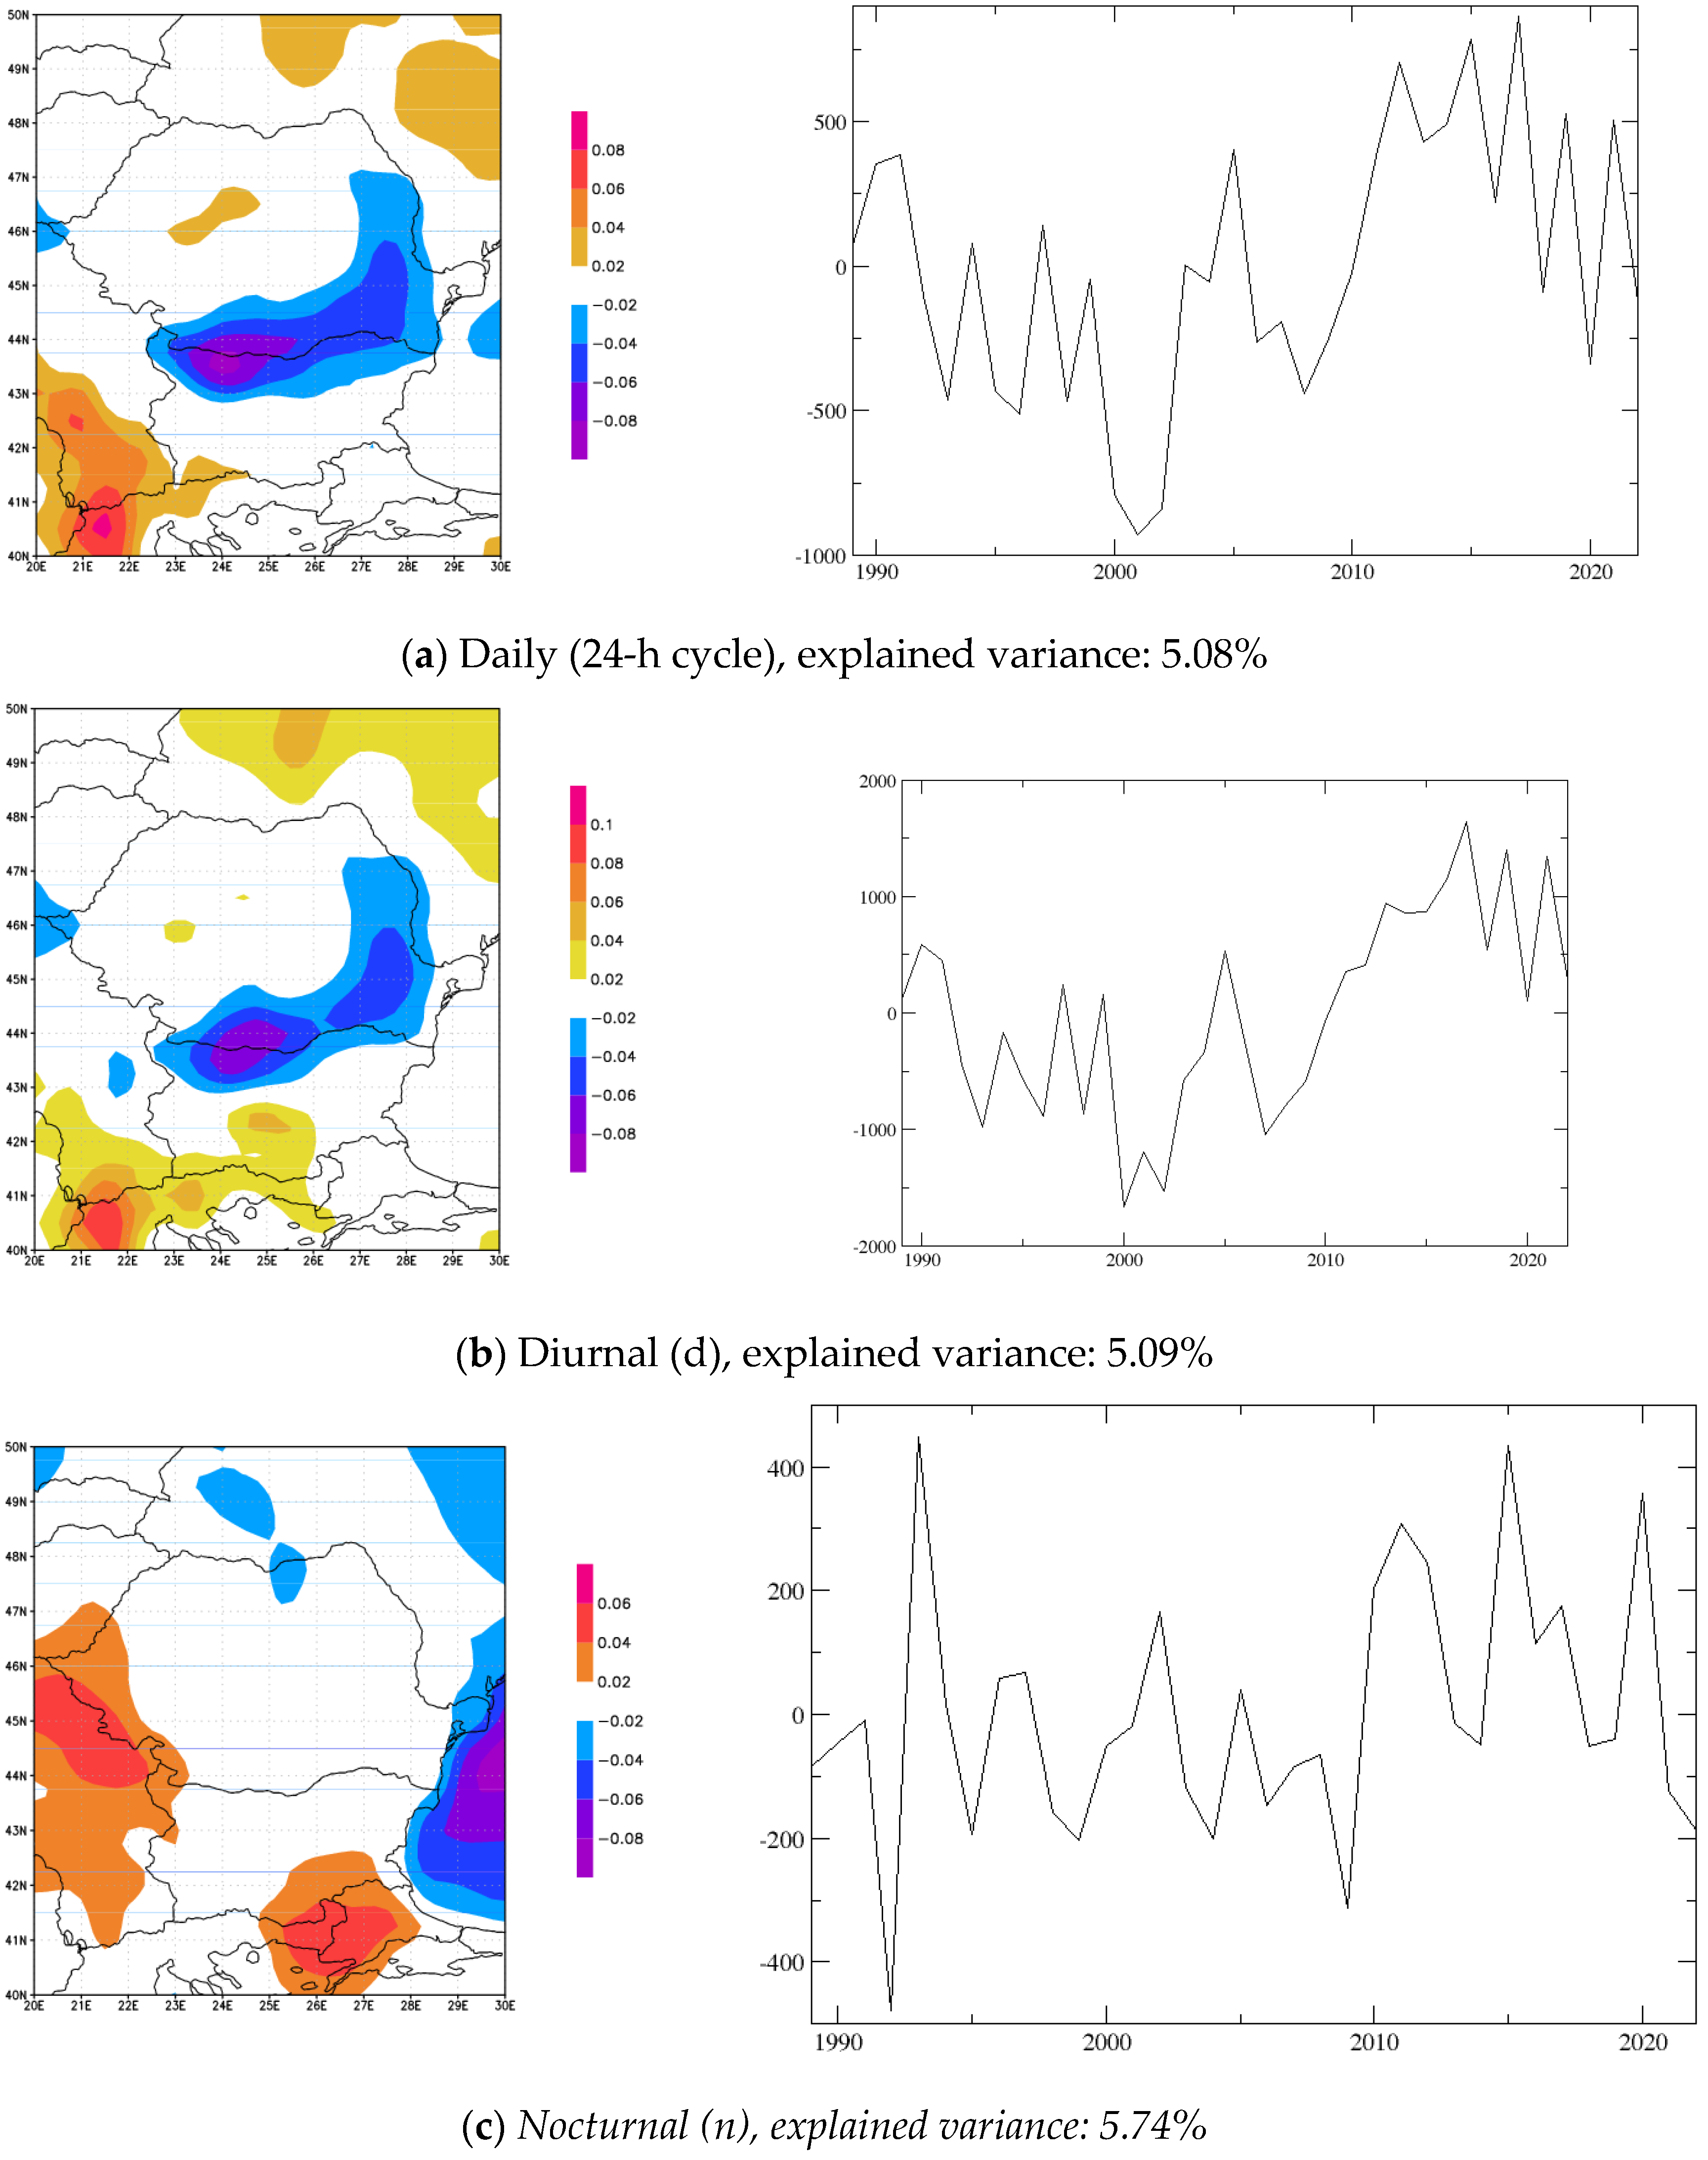
Figure 5.
Spatial patterns (left) and corresponding PC4 time series (right) for the fourth EOF mode.
Figure 5.
Spatial patterns (left) and corresponding PC4 time series (right) for the fourth EOF mode.
3.1. Analysis of EOF 1: Influence of Large-Scale Atmospheric Circulation (NAO)
The first EOF mode (EOF1) represents the dominant structure of the PBLH variability during the warm season and explains 54.4% of the total variance of the PBLH field (Figure 1a). The high proportion of explained variance indicates the existence of a large-scale control mechanism that acts relatively uniformly over the entire territory of Romania.
The spatial pattern associated with EOF1 (Figure 1, left panels) highlights predominantly positive anomalies across the entire territory of the country, with the highest values being located in the extra-Carpathian regions, particularly in Moldavia region (north-east of the country), Oltenia region (south-west of the country between Carpahtians mountains and Danube), and southeastern Romania. The spatial distribution suggests the existence of a coherent response of the boundary layer to modifications in regional and hemispheric atmospheric circulation. The higher sensitivity of the extra-Carpathian regions can be explained by the reduced influence of orographic effects on turbulent mixing processes and by the direct exposure to the dominant atmospheric advections.
The temporal evolution of the principal component associated with EOF1 (PC1) highlights a pronounced variability at interannual and multiannual scales (PC1; Figure 1, right panels). The predominantly negative values observed in the first part of the analyzed period are followed by a significant increase after the year 2000, with a significant maximum in the years 2000, 2007, and 2022. In contrast, pronounced minima are identified in the years 2005 and 2010, suggesting the existence of important modifications in the atmospheric forcing mechanisms responsible for the development of the boundary layer.
The comparison of the PC1 evolution with the North Atlantic Oscillation (NAO) index highlights a remarkable correspondence between the two time series. The main maxima and minima of PC1 coincide with the positive and negative phases of the NAO, suggesting that the first EOF mode reflects the response of the PBL to modifications in the atmospheric circulation from the North Atlantic sector.
NAO represents the primary mode of atmospheric variability in the North Atlantic region and significantly influences European atmospheric circulation by modifying the intensity and position of the westerly jet stream. During the positive phases of NAO, the westerly circulation is intensified, favoring more stable and drier atmospheric conditions in certain regions of Southeastern Europe.
These conditions lead to an increase in the surface sensible heat flux and to the development of a deeper boundary layer. Conversely, the negative phases of NAO favor increased cyclonic activity and atmospheric instability, which can limit the development of the boundary layer by increasing cloudiness and precipitation [19].
This interpretation is supported by the behavior observed in the year 2010, when the NAO index recorded its most pronounced negative value across the entire analyzed period. Concurrently, Romania was affected by numerous episodes of heavy precipitation and widespread flooding, particularly in the extra-Carpathian regions. The associated atmospheric conditions favored a reduction in surface heating and restricted the development of the planetary boundary layer, which explains the pronounced negative values of PC1 (Figure 6).
The separate analysis of the daytime and nighttime components shows that the EOF1 structure is dominated by the daytime contribution, which highlights the determining role of radiative surface heating in controlling PBLH variability. Nevertheless, the nighttime component contributes to the amplification or attenuation of the daily signal during certain periods, indicating that residual mixing processes and the persistence of atmospheric instability can influence the evolution of the boundary layer even after sunset.
Overall, EOF1 represents the signature of the primary control mechanism of PBLH variability in Romania during the warm season and reflects the direct influence of hemispheric-scale atmospheric circulation, represented by the North Atlantic Oscillation, on the development and structure of the planetary boundary layer.
3.2. Analysis of EOF 2: Regional Thermodynamic Forcing
The second EOF mode (EOF2) explains 9.8% of the total variance of the planetary boundary layer height and highlights a distinct regional pattern of variability (Figure 2a). Unlike EOF1, which reflects the influence of a large-scale control mechanism, EOF2 describes regional contrasts generated by thermodynamic and hydrological processes (Figure 2, left panels).
The spatial structure of EOF2 exhibits a clear bipolar configuration, characterized by negative anomalies in northeastern Romania, particularly in Moldavia, and positive anomalies in the southwestern part of the country, centered over Oltenia (southweastern Romania). This distribution suggests the existence of regional mechanisms that drive different responses of the boundary layer within these two regions.
The temporal evolution of the associated principal component (PC2) highlights the alternation between periods when the development of the boundary layer is favored in Moldavia and inhibited in Oltenia, and periods when the situation is reversed. Positive values of PC2 are associated with a relative reduction in the PBL height in northeastern Romania and an increase in the southwest, while negative values indicate a more pronounced development of the boundary layer in Moldova (Figure 2, right panels).
To identify the physical mechanism responsible for this distribution, the total precipitable water (PW) fields were analyzed. The results show that the spatial pattern of EOF2 exhibits a significant correspondence with the regional distribution of atmospheric moisture. Years characterized by precipitable water deficits in northeastern Romania, such as 2003, 2009, and 2014, coincide with negative values of PC2 and the development of a deeper boundary layer in Moldavia.
From a physical perspective, the reduction in atmospheric moisture content favors an increase in the surface sensible heat flux and a decrease in the energy fraction utilized for evapotranspiration. Under these conditions, a higher proportion of the available energy is converted into heating the air near the surface, which leads to the intensification of convective turbulence and to an increase in the boundary layer height.
Conversely, periods characterized by positive anomalies of precipitable water (PW) and frequent convective activity lead to a reduction in radiative surface heating through increased cloudiness and precipitation. These processes limit the development of thermal convection and favor the occurrence of lower values of the boundary layer height. A representative example is the year 2021, when northeastern Romania was characterized by positive anomalies of PW and frequent frontal activity, conditions that contributed to the relative reduction of the PBLH in this region (Figure 7).
The analysis of the daytime and nighttime components indicates that EOF2 is primarily controlled by daytime processes associated with surface heating and convection development. The high similarity between the daily EOF2 and daytime EOF2 structures confirms that the dominant mechanism is linked to convective processes that reach their maximum intensity during the day.
Nevertheless, the nighttime contribution is not negligible. The nighttime EOF2 explains more than 22% of the variance of the nighttime field and suggests that the effects of convective processes developed during the day can persist into the early hours of the night through the residual layer (Figure 2c). In situations characterized by persistent atmospheric instability, convective activity can continue after sunset, influencing the structure and evolution of the nighttime boundary layer.
The obtained results indicate that EOF2 captures the response of the PBL to regional variations in the energy and hydrological balance, highlighting the central role of atmospheric moisture distribution and convective activity in controlling PBLH variability during the warm season. Thus, this mode represents the main regional mechanism that modulates the boundary layer's response to local atmospheric and thermodynamic forcings.
A distinct shift is observed during the warm season of 2021 (Figure 7d), where northeastern Romania experienced higher PW anomalies (increased moisture) due to the passage of multiple frontal systems and enhanced convective activity [15]. This resulted in a relative decrease in PBL height in the northeast compared to southwestern Romania, where PW amounts were lower. These patterns suggest a strong coupling between regional precipitation anomalies and PBL variability, highlighting the role of thermodynamic and convective processes in modulating boundary layer development during the warm season
3.3. Analysis of EOF 3: Thermal Advection and Heatwave Impact
The third EOF mode (EOF3) explains 7.2% of the total variance of the planetary boundary layer height and highlights the influence of extreme thermal processes on the boundary layer development in Romania (Figure 3a). Unlike EOF1 and EOF2, which are associated with large-scale atmospheric circulation and regional moisture distribution respectively, EOF3 reflects the response of the PBLH to extreme heating episodes generated by persistent advections of tropical air [20].
The spatial structure of EOF3 exhibits a bipolar configuration characterized by positive anomalies in southeastern Romania and slightly negative anomalies in the rest of the country. The highest values are identified in Dobrogea (south-east of the country, between Danube and Black Sea) and Muntenia (south of the country), regions that are frequently under the direct influence of tropical air advections originating from North Africa and the eastern basin of the Mediterranean Sea. This distribution suggests the existence of a direct link between the intensity of atmospheric heating and the development of the PBL.
The temporal evolution of the associated principal component (PC3) highlights pronounced negative values in the years 2000, 2007, 2012, and 2015 (Figure 3, right panels). These years are well known in the climatology of Romania for the high frequency of heatwaves and for the extreme temperatures recorded during the warm season. The analysis of the air temperature fields at 2 m confirms the existence of extensive positive thermal anomalies, which locally exceed 2-3°C relative to the climatological means (Figure 8a-c).
From a synoptic perspective, these episodes are associated with the development and persistence of the extended subtropical ridge from North Africa toward Southeastern Europe. The atmospheric configuration favors the transport of continental tropical air masses characterized by high temperatures, relatively low humidity, and pronounced stability in the free troposphere. Near the surface, however, the intense heating leads to an increase in the sensible heat flux and to the development of a deep convective layer.
Under these conditions, thermal turbulence becomes significantly more efficient, and the boundary layer height can increase substantially. Because heatwaves simultaneously affect extensive areas of Romania, local spatial variability is reduced, and the signal associated with extreme heating becomes dominant at a regional scale.
The comparative analysis of the daytime and nighttime components indicates that the EOF3 signal is primarily generated by daytime processes associated with intense radiative surface heating (Figure 3b-c).
Nevertheless, the nighttime contribution is remarkable and explains an important fraction of the total variability. This result suggests that the effects of heatwaves are not limited to the daytime interval but persist during the night as well.
During severe heatwave episodes, nighttime radiative cooling is often reduced, and minimum temperatures remain high. This phenomenon favors the maintenance of a deeper residual layer and delays the stabilization of the lower atmosphere. Consequently, turbulent processes can continue into the early hours of the night, and the boundary layer height remains greater than under normal climatological conditions.
The year 2007 constitutes a representative example of this behavior (Figure 8a). The succession of heatwaves and the persistence of high temperatures during the night contributed to the amplification of the nighttime component of EOF3. The results suggest that, in such situations, the processes associated with the residual layer and residual atmospheric instability can become comparable in importance to the daytime convective mechanisms.
The positive trend observed after the year 2016 in the evolution of the main component PC3 may indicate modifications in the frequency and intensity of heat episodes at a regional level. Although the analysis of climate trends does not represent the primary objective of the present study, this result is consistent with numerous research works that highlight the increasing frequency of heatwaves in Southeastern Europe over recent decades [21].
Overall, EOF3 captures the influence of extreme thermal processes on the planetary boundary layer structure and highlights the role of tropical air advections and heatwaves in amplifying its vertical development. The results demonstrate that episodes of extreme temperatures represent one of the important regional mechanisms controlling PBLH variability in Romania during the warm season.
3.4. Analysis of EOF 4: Mixed Layer Humidity and Regional Moisture Budget
The fourth EOF mode (EOF4) explains 5.1% of the total variance of the PBLH and highlights the influence of processes associated with atmospheric moisture distribution and energy exchanges between the terrestrial surface and the atmosphere (Figure 4a).
The spatial distribution of EOF4 is characterized by an almost monopolar mode, with predominant positive anomalies in southern and southeastern Romania and lower values in the other regions of the country. This configuration suggests the existence of a regional mechanism that simultaneously influences the development of the boundary layer over extensive areas.
In order, to physically interpret this mode, the composite fields of specific humidity at the 1000 hPa level were analyzed (Figure 9). The results indicate a correspondence between EOF4 variability and the regional distribution of moisture within the lower layers of the atmosphere. However, the relationship between the moisture content and the boundary layer height is not a direct one but rather depends on how the energy available at the surface is partitioned between the sensible heat flux and the latent heat flux.
In years characterized by high moisture, such as 2001, evaporation and evapotranspiration contribute to an increase in the latent heat flux. Concurrently, additional moisture can favor the development of convection and turbulent mixing, especially under conditions of pronounced atmospheric instability [22,23]. In such situations, the boundary layer can become deeper due to the intensification of convective processes.
On the other hand, a more humid atmosphere can also favor the development of cloudiness, reducing the solar radiation available at the surface and limiting daytime heating. Consequently, the final effect of moisture on the PBLH depends on the balance between the cooling processes associated with evaporation and the destabilization processes generated by the release of latent heat.
In the case of the year 2001 (Figure 4, right panels), the specific humidity distribution suggests that the more pronounced development of the boundary layer was associated with a favorable combination between moisture availability and regional convective conditions. In contrast, the year 2017, characterized by lower values of specific humidity, saw vertical mixing processes influenced by a different energetic regime, which led to modifications in the structure and depth of the boundary layer.
The temporal evolution of the main component PC4 indicates that the variability associated with this mode is dominated by the daytime component(Figure 4b). This result is consistent with the fact that energy exchange processes between the surface and the atmosphere reach their maximum intensity during the day, when solar radiation controls both surface heating and the development of convective turbulence.
Nevertheless, the nighttime EOF4 analysis highlights the fact that the signal associated with moisture persists even after sunset (Figure 4c). The moisture accumulated within the boundary layer during the day influences the properties of the residual layer and can modify nighttime atmospheric stability, thereby contributing to the maintenance of a portion of the variability observed during the daytime.
The results suggest that EOF4 reflects the coupling processes between the surface and the atmosphere via the regional energetic and hydrological balance. This mode underscores the fact that the variability of the PBL layer is not exclusively controlled by large-scale atmospheric circulation, but also by local and regional mechanisms associated with moisture availability and surface energy exchanges.
3.5. Analysis of EOF 5: Meridional Circulation and Topographic Interaction
The fifth EOF mode (EOF5) explains 3.7% of the total variance of the PBLH and describes a regional component of variability associated with the interaction between meridional circulation and the complex topography of Romania (Figure 5a).
Although its contribution to the total variance is smaller compared to the preceding EOF modes, its well-defined spatial structure indicates the existence of distinct physical processes that influence the development of the boundary layer at a regional scale.
The spatial pattern of EOF5 exhibits a bipolar configuration characterized by negative anomalies in southern and eastern Romania and positive anomalies in the northern and western regions. This distribution suggests the existence of a regional redistribution mechanism of energy and air mass associated with variations in meridional circulation.
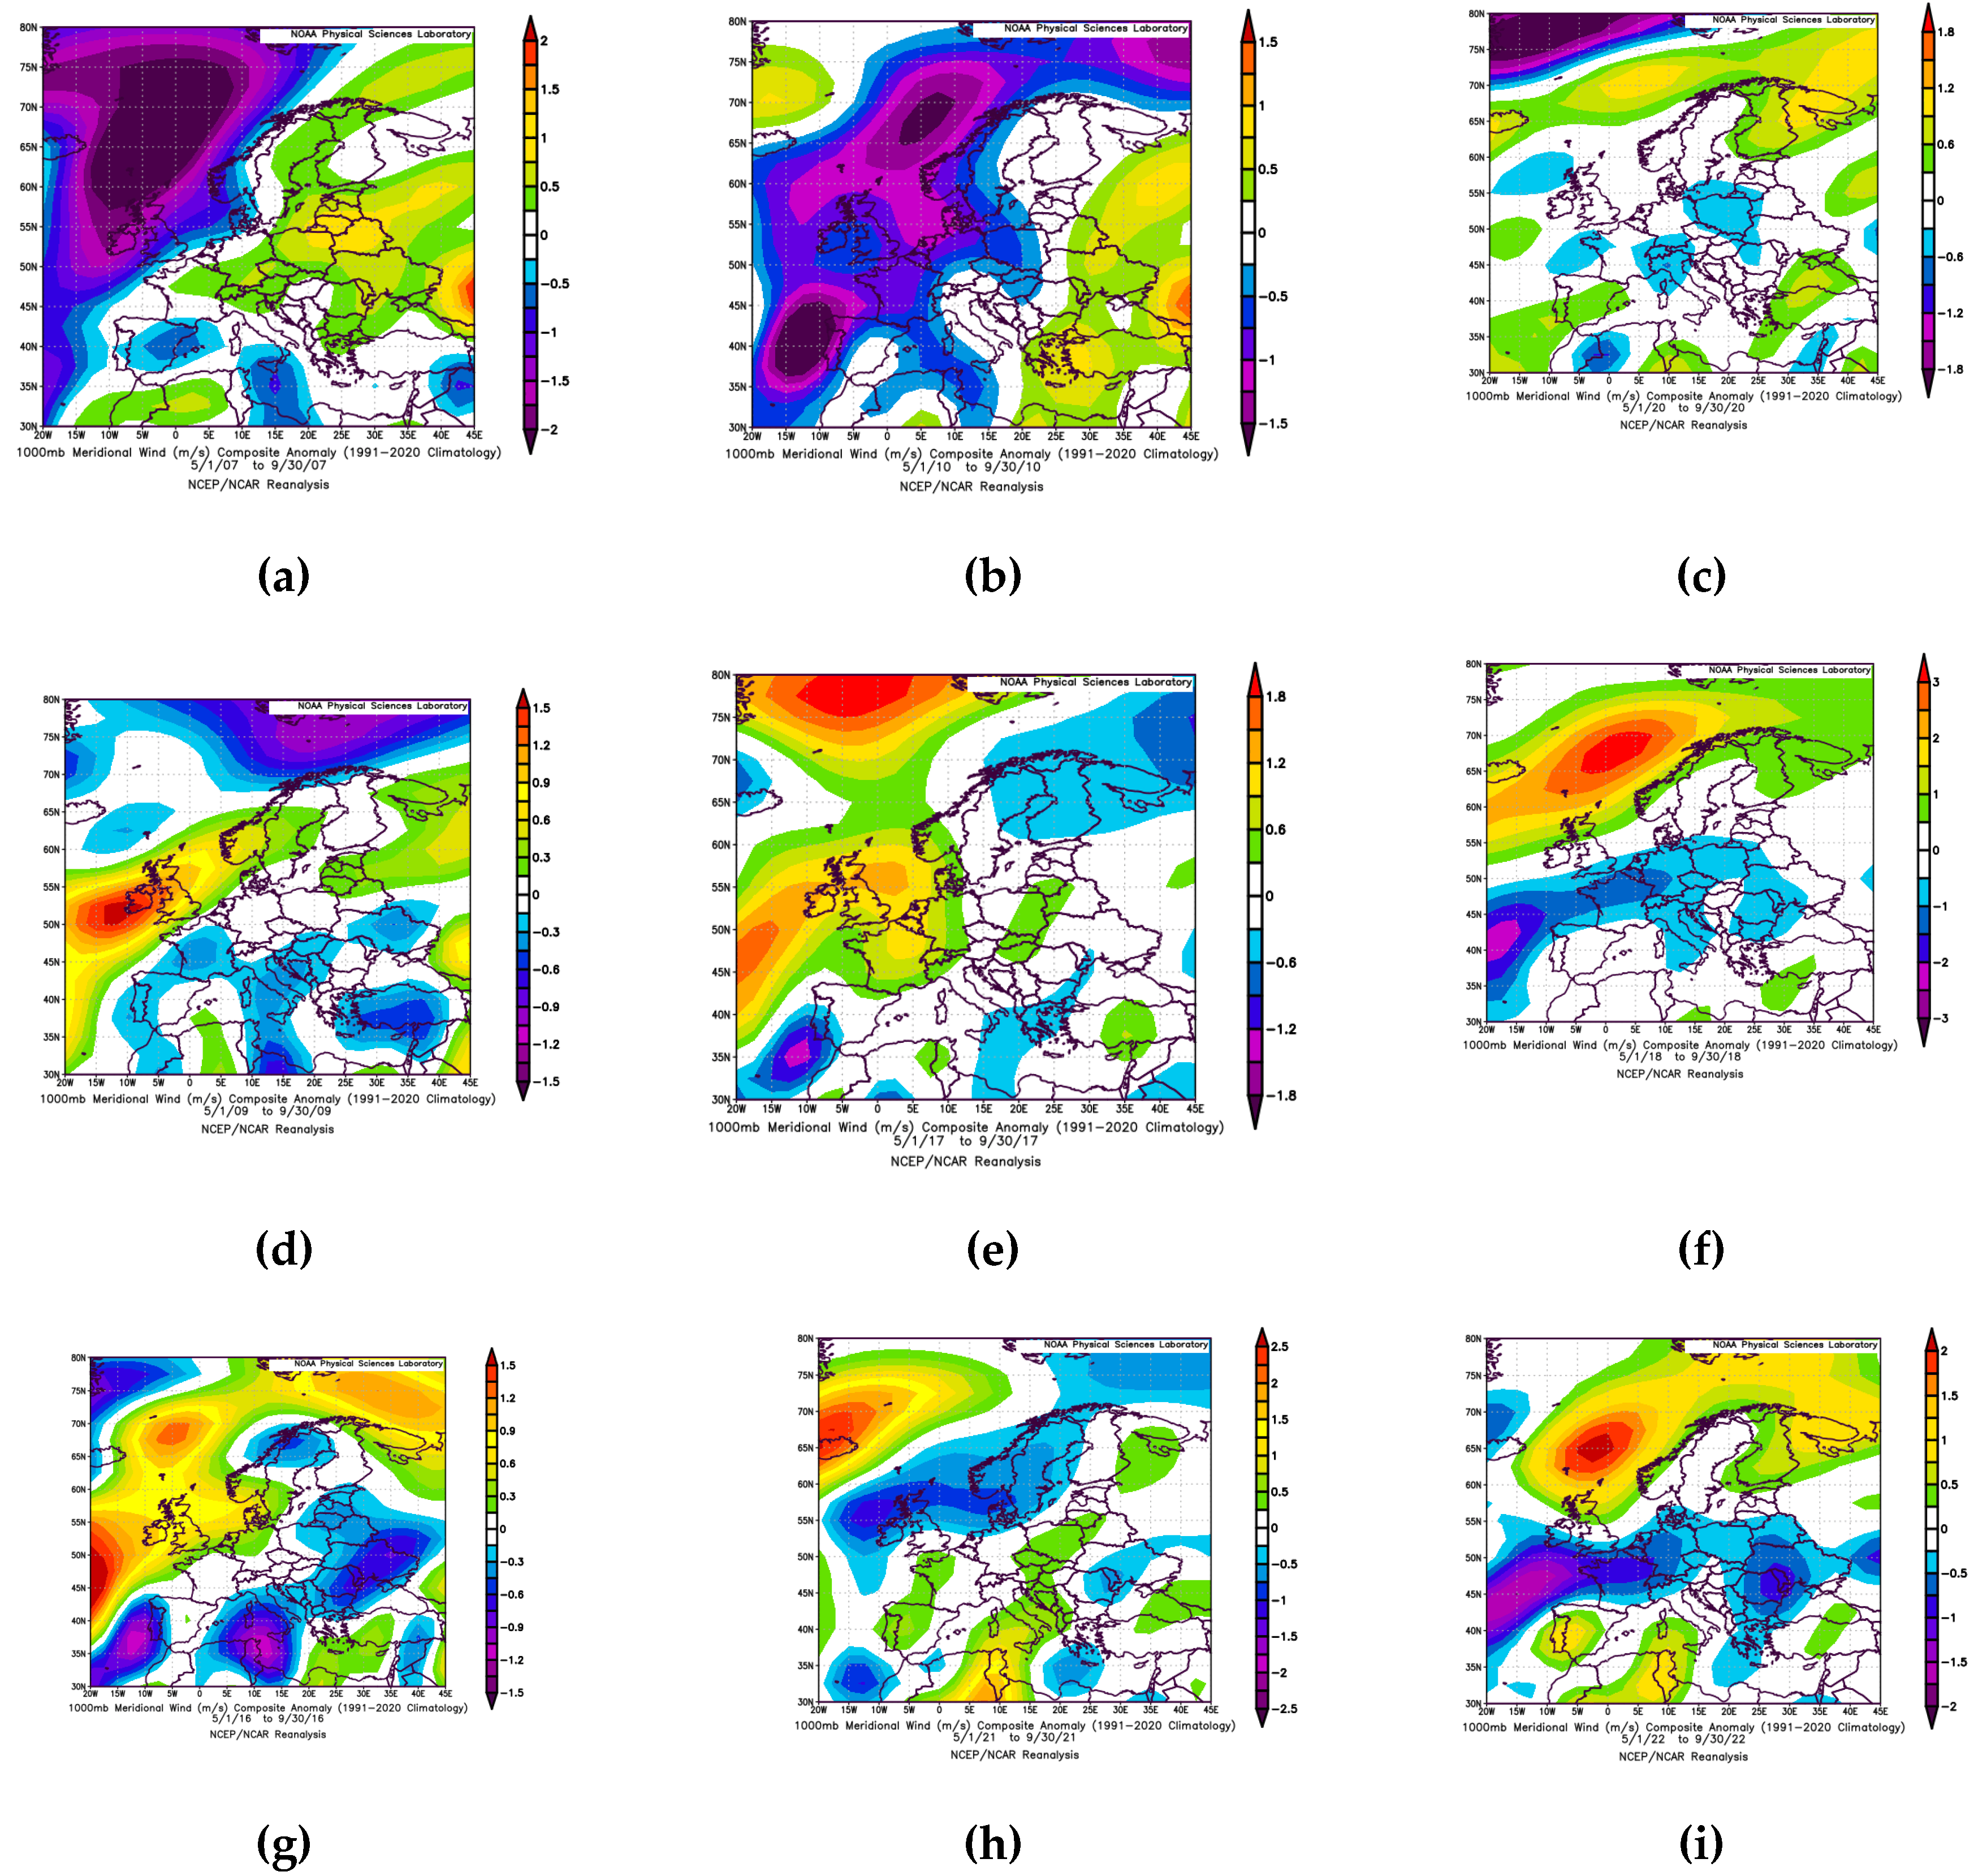
To investigate this mechanism, the composite anomalies of the meridional wind component at the 1000 hPa level were analyzed (Figure 10 a–i). The results indicate that periods characterized by the intensification of the meridional flow are associated with the development of a deeper boundary layer in certain regions of the country, particularly in southeastern Romania.
From a dynamic perspective, meridional circulation favors the transport of air masses between different latitudes, contributing to the redistribution of heat and moisture within the lower troposphere. The intensification of this transport can modify atmospheric stability and can amplify vertical mixing processes, leading to an increase in the PBLH planetary boundary layer height.
The years 2009, 2017, 2018, 2021, and 2022 are representative examples of this behavior (Figure 10b, Figure 10e, Figure 10f, Figure 10h, and Figure 10i). During these periods, a more active meridional circulation favored the development of more intense turbulence and a more efficient vertical exchange between the surface and the free atmosphere. As a result, the boundary layer height presented higher values in the regions directly influenced by these circulation configurations.
In contrast, periods characterized by the weakening of the meridional circulation or by the predominance of less mobile atmospheric regimes were associated with a reduction in vertical mixing and an increase in atmospheric stability. These conditions favor air accumulation within the lower layers and limit the vertical development of the boundary layer. Such situations were identified in the years 2007, 2010, and 2020 (Figure 10a, Figure 10c and Figure 10g).
A particularly important aspect for the interpretation of EOF5 is represented by the role of the Carpathian arc. The Carpathians constitute the main orographic element of the region and exert a major influence on the atmospheric circulation in Romania. Depending on the direction of the dominant flow, it can act both as a barrier and as a channeling mechanism for the circulation [24].
In situations characterized by intense meridional circulation, orographic effects can amplify air transport along depressional corridors and extra-Carpathian regions, favoring the local development of the boundary layer. Conversely, under conditions dominated by westerly circulation or weakly organized baric fields, the orographic influence can lead to the regional compartmentalization of air masses and to the emergence of significant spatial contrasts in the PBLH.
The analysis of the daytime and nighttime components indicates that the boundary layer's response to modifications in the meridional circulation is not exclusively limited to the daytime interval. In certain situations, such as the year 2002, the nighttime contribution becomes comparable to the daytime one, suggesting that advective transport and dynamic processes can maintain turbulent activity even in the absence of radiative surface heating.
Therefore, EOF5 can be interpreted as an expression of the interaction between the regional atmospheric circulation and the topography of Romania. This mode highlights the fact that the variability of the PBL is the result not only of large-scale atmospheric forcings and regional thermodynamic processes, but also of local dynamic mechanisms generated by the complex configuration of the relief.
4. Conclusions
The central idea of this study is that the PBLH over Romania during the warm season does not vary randomly, but responds to a set of major physical mechanisms acting at different spatial scales. At the large scale, atmospheric circulation organizes the dominant mode of PBLH variability across the entire country. Superimposed on this large-scale signal are regional influences related to atmospheric moisture, episodes of extreme heating, surface–atmosphere energy exchanges, and the effect of the Carpathian topography on atmospheric circulation and vertical mixing.
This study investigated the spatio-temporal variability of the planetary boundary layer height (PBLH) in Romania during the warm season (May-September) using the ERA5 reanalysis data for the 1989-2022 period by means of Empirical Orthogonal Functions (EOF). The application of the EOF method allowed the identification of the main atmospheric mechanisms responsible for the PBLH variability and the evaluation of the relative contribution of the dynamic and thermodynamic processes that control the development of the PBL.
The results show that the PBLH variability in Romania is dominated by a small number of coherent spatial modes, with the first five EOF modes explaining approximately 80% of the total variance of the analyzed field. Among these, the first EOF mode represents the dominant mechanism, explaining more than half of the total variability and reflecting the influence of the hemispheric-scale atmospheric circulation on the boundary layer development.
The analysis highlights three main categories of factors that control the PBLH variability during the warm season.
The first category is represented by the large-scale atmospheric circulation. The first EOF mode is closely associated with the North Atlantic Oscillation (NAO), demonstrating that modifications in the atmospheric circulation from the North Atlantic sector directly influence the boundary layer development over Romania. The findings indicate that the NAO represents one of the primary control factors of the interannual and multiannual variability of the PBLH.
The second category is represented by regional thermodynamic processes. The distribution of precipitable water, convective activity, the surface energy balance, and extreme temperature episodes significantly influence the development of the boundary layer. In particular, heatwaves associated with tropical air advections favor the development of deeper boundary layers and modify both the daytime and nighttime structures of the PBLH.
The third category is represented by regional dynamic processes associated with the meridional circulation and its interaction with topography. The results highlight the important role of the Carpathian arc in modulating the regional response of the boundary layer to different atmospheric circulation patterns, contributing to the emergence of the observed spatial contrasts between the extra-Carpathian and intra-Carpathian regions.
The comparative analysis of the daily, daytime, and nighttime fields shows that daytime processes represent the primary source of PBLH variability during the warm season. Nevertheless, the findings also highlight the important contribution of nighttime processes during convective episodes, heatwaves, and situations characterized by intense meridional circulation. These results suggest that the variability of the boundary layer cannot be exclusively explained by the processes associated with daytime heating, rendering the consideration of the mechanisms controlling the evolution of the residual layer and the nighttime boundary layer absolutely necessary.
The results confirm that the atmospheric connection signals identified previously for the climate of Romania [4,10,11] are also found within the variability of the PBL, suggesting the existence of a link between large-scale circulation processes and the dynamics of the lower atmosphere.
From the knowledge of the authors, studies dedicated to the dominant modes of variability of the PBLH in Romania are still limited. In this context, the present study contributes to filling this research field through a systematic analysis of the main mechanisms controlling the PBLH variability during the warm season, highlighting the relative contributions of hemispheric-scale atmospheric circulation, regional thermodynamic processes, and the influence of the Carpathian topography.
Overall, the study demonstrates that the variability of the PBLH planetary boundary layer height in Romania is the result of the complex interaction between hemispheric-scale atmospheric circulation, regional thermodynamic processes, and local topographic features. The obtained results are consistent with previous studies that have highlighted the important influence of large-scale atmospheric processes and connections on climate variability in Romania, as well as with observations indicating significant modifications in the thermal and pluviometric regimes in recent decades. In this context, the association of the first EOF mode with the North Atlantic Oscillation and the identification of distinct modes linked to atmospheric moisture, heatwaves, and meridional circulation suggest that the PBLH variability represents an integrated expression of the climate mechanisms controlling the evolution of the lower atmosphere over Romania.
The results contribute to a better understanding of the mechanisms controlling the boundary layer evolution in Southeastern Europe and provide a useful framework for future studies dedicated to boundary layer climatology, severe weather phenomena, and atmospheric pollutant dispersion processes.
5. Limitations and Future Research Perspectives
Although the ERA5 reanalysis data represents one of the most advanced atmospheric data sources available at present, the estimation of the PBLH height remains dependent on the parameterizations utilized within the numerical model and on the availability of assimilated observations. Consequently, the PBLH values obtained from the reanalysis can exhibit differences relative to direct observations, particularly under conditions characterized by high atmospheric stability, intense convective processes, or complex topography.
Another limitation of the study is represented by the exclusive utilization of reanalysis data. Although these data provide a coherent spatial and temporal description of the atmosphere, validating the results through comparison with independent observations could contribute to a more rigorous evaluation of the identified variability modes. In this regard, measurements originating from ceilometers, lidar systems, upper-air soundings, or other instruments dedicated to boundary layer monitoring could provide additional information regarding the performance of ERA5 estimations over the territory of Romania.
The interpretation of EOF modes also involves certain limitations. Although this method allows the identification of dominant variability structures, the resulting modes represent orthogonal statistical constructs and do not always correspond to completely independent physical mechanisms. For this reason, the interpretation of the processes associated with each mode must be conducted within the context of complementary synoptic and climatological information.
Future research could extend the analysis by utilizing observational datasets and other reanalysis products to evaluate the robustness of the obtained results. Additionally, it would be useful to investigate the relationship between PBL planetary boundary layer variability and the frequency of severe weather phenomena, including intense convective episodes, heatwaves, and periods of atmospheric pollution.
An important direction for future research is represented by the investigation of the relationship between PBL variability and the main modes of climate variability that influence Romania. Previous studies have highlighted the role of atmospheric connections and large-scale circulation in controlling regional climate variability, and the results of the present study suggest that these mechanisms can significantly influence the evolution of the PBLH as well. Future analyses based on extended time series and additional statistical methods could more rigorously quantify the relationships among the PBLH, the North Atlantic Oscillation, and other atmospheric circulation indices relevant to Southeastern Europe.
Furthermore, the climate changes observed in Romania in recent decades raise important questions regarding possible long-term shifts in the structure and variability of the PBL. Investigating the multi-decadal trends of the PBLH and its response to regional warming represents a promising research direction, with direct implications for severe weather forecasting, air quality assessment, and the study of surface-atmosphere interactions.
Author Contributions
Conceptualization, I.-M.M, D.-C.B., A.T. and M.-M.C.; methodology, D.-C.B., I.-M.M., A.T.; software, I.-M.M., A.T. and D.-C.B.; validation, I.-M.M., A.T. and D.-C.B.; formal analysis, D.-C.B., I.-M.M., A.T. and M.-M.C.; investigation, I.-M.M, D.-C.B., A.T. and M.-M.C.; resources, I.-M.M., A.T. and D.-C.B.; data curation, I.-M.M., A.T. and D.-C.B.; writing—original draft preparation, D.-C.B., I.-M.M.; writing—review and editing, I.-M.M, D.-C.B., A.T. and M.-M.C.; visualisation, I.-M.M, D.-C.B., A.T. and M.-M.C.; supervision I.-M.M, D.-C.B., A.T. and M.-M.C.; project administration, I.-M.M, D.-C.B., A.T. All authors have read and agreed to the published version of the manuscript.
Funding
This work was financed by Smart Growth, Digitization and Financial Instruments Program (Po-CIDIF) 2021-2027, Action 1.3 Integration of the national RDI ecosystem in the European and inter-national Research Space, project “Supporting the operation of facilities in Romania within the ACTRIS ERIC research infrastructure”, SMIS code 309113. M.M. Cazacu acknowledge partial financial support from the Romanian Ministry of Education and Research (UEFISCDI), through project Proactive Resilience and Emergency Preparedness for Adaptive Response and Efficiency - PREPARE, PN-IV-P6-6.1-CoEx-2024-0102, ctr. 1CoEx/2026.
Data Availability Statement
The raw data supporting the conclusions of this article will be made available by the authors without undue reservation.
Conflicts of Interest
The authors declare no conflicts of interest.
References
- Garratt, J. R. The atmospheric boundary layer. Earth-Sci. Rev. 1994, 37(1-2), 89–134. [Google Scholar] [CrossRef]
- Hannachi, A.; Jolliffe, I. T.; Stephenson, D. B. Empirical orthogonal functions and related techniques in atmospheric science: A review. Int. J. Climatol. 2007, 27(9), 1119–1152. [Google Scholar] [CrossRef]
- Hersbach, H.; et al. The ERA5 global reanalysis. Q. J. R. Meteorol. Soc. 2020, 146, 1999–2049. [Google Scholar] [CrossRef]
- Timofte, A.; Bostan, D.-C.; Apetroaie, C.; Miclăuș, I.-M.; Cazacu, M.-M. The 50-Year Evolution of the Planetary Boundary Layer in the Southern Part of Romania: Comparison Between the Determinations by the Stull Method and the Reanalysis Data from ERA5. Atmosphere 2025, 16, 1247. [Google Scholar] [CrossRef]
- Britannica. Land of Romania. 26 June 2026. Available online: https://www.britannica.com/place/Romania/Land.
- Lorenz, E. N. Empirical Orthogonal Functions and Statistical Weather Prediction. Statistical Forecasting Project Rep. 1, MIT Department of Meteorology, 49. 1956. [Google Scholar]
- Schmidt, O.T.; Mengaldo, G.; Balsamo, G.; Wedi, N.P. Spectral Empirical Orthogonal Function Analysis of Weather and Climate Data. Mon. Weather Rev. 2019, 147(8), 2979–2995. [Google Scholar] [CrossRef]
- Monahan, A. H.; Fyfe, J. C.; Ambaum, M. H. P.; Stephenson, D. B.; North, G. R. Empirical Orthogonal Functions: The Medium is the Message. J. Clim. 2009, 22(24), 6501–6514. [Google Scholar] [CrossRef]
- Apetroaie, C.; Bostan, D.C.; Timofte, A.; Miclăuș, I.M.; Cazacu, M.M. Patterns of PBL hight during 1989-2019 over Romania, Moldavia Region using ERA5 data and correlation with NAO index. EGU General Assembly 2023, Vienna, Austria, 24–28 Apr 2023. EGU23-9568. [Google Scholar] [CrossRef]
- Bojariu, R.; Paliu, D. North Atlantic Oscillation projection on Romanian climate fluctuations in the cold season. In Detecting and Modelling Regional Climate Change and Associated Impacts; Brunet, M., Lopez, D., Eds.; Springer: Berlin, 2001; pp. 345–352. [Google Scholar]
- Bojariu, R.; Giorgi, F. The North Atlantic Oscillation signal in a regional climate simulation for the European region. Tellus A 2005, 57(4), 641–653. [Google Scholar] [CrossRef]
- Matei, D.; Bojariu, R. Local climate variability over Romanian territory due to large-scale phenomena, EGS - AGU - EUG Joint Assembly, Abstracts from the meeting held in Nice, France, 6 - 11 April 2003. 2003. [Google Scholar]
- Dumitrescu, A.; Bojariu, R.; Bîrsan, M.V.; Marin, L.; Manea, A. Recent climatic changes in Romania from observational data (1961–2013). Theor. Appl. Climatol. 2015, 122, 111–119. [Google Scholar] [CrossRef]
- Bostan, D.C.; Timofte, A. Variabilitatea Stratului Limită Planetar în sezonul cald, din regiunea Moldova, 19-21 noiembrie 2019, Sesiunea Anuală de Comunicări Științifice a Administrației Naționale de Meteorologie, București.
- ECMWF. ERA5: Data Documentation. European Centre for Medium-Range Weather Forecasts. 2019. Available online: https://confluence.ecmwf.int/display/CKB/ERA5%3A+data+documentation.
- ERA5. Available online: https://cds.climate.copernicus.eu/datasets/reanalysis-era5-single-levels?tab=overview.
- Hannachi, A.; Jolliffe, I.T.; Stephenson, D.B. Empirical orthogonal functions and related techniques in atmospheric science: A review. Int. J. Climatol. 2007, 27, 1119–1152. [Google Scholar] [CrossRef]
- North, G. R.; Bell, T. L.; Cahalan, R. F.; Moeng, F. J. Sampling errors in the estimation of empirical orthogonal functions. Mon. Weather Rev. 1982, 110(7), 699–706. [Google Scholar] [CrossRef]
- Boroneant, C.; Tomozeiu, R.; Rimbu, N. EOF analysis of winter and summer precipitation in Romania, Conference: Proceedings of the 3rd ECAC 2000 At: Pisa, Italy, Volume: ISBN 88-900502-0-9. Pisa, Italy, 2000; ISBN 88-900502-0-9. [Google Scholar]
- Sfîcă, L.; Croitoru, A.-E.; Iordache, I.; Ciupertea, A.-F. Synoptic Conditions Generating Heat Waves and Warm Spells in Romania. Atmosphere 2017, 8, 50. [Google Scholar] [CrossRef]
- Morabito, M.; Crisci, A.; Messeri, A.; Messeri, G.; Betti, G.; Orlandini, S.; Raschi, A.; Maracchi, G. Increasing Heatwave Hazards in the Southeastern European Union Capitals. Atmosphere 2017, 8, 115. [Google Scholar] [CrossRef]
- Chaboureau, J.P.; Guichard, F.; Redelsperger, J.L.; Lafore, J.P. The role of stability and moisture in the diurnal cycle of convection over land. Q.J.R. Meteorol. Soc. 2004, 130, 3105–3117. [Google Scholar] [CrossRef]
- Young, George S. Convection in the atmospheric boundary layer. Earth-Sci. Rev. 1988, 25(Issue 3), 179–198. [Google Scholar] [CrossRef]
- Szép, R.; Mateescu, E.; Niță, I.-A.; Birsan, M.-V.; Bodor, Z.; Keresztesi, Á. Effects of the Eastern Carpathians on atmospheric circulations and precipitation chemistry from 2006 to 2016 at four monitoring stations (Eastern Carpathians, Romania). Atmos. Res. 2018, 214, 311–328. [Google Scholar] [CrossRef]
Figure 6.
Interannual variability of the North Atlantic Oscillation (NAO) index during the warm season (May–September) for the 1989–2022 period.
Figure 6.
Interannual variability of the North Atlantic Oscillation (NAO) index during the warm season (May–September) for the 1989–2022 period.
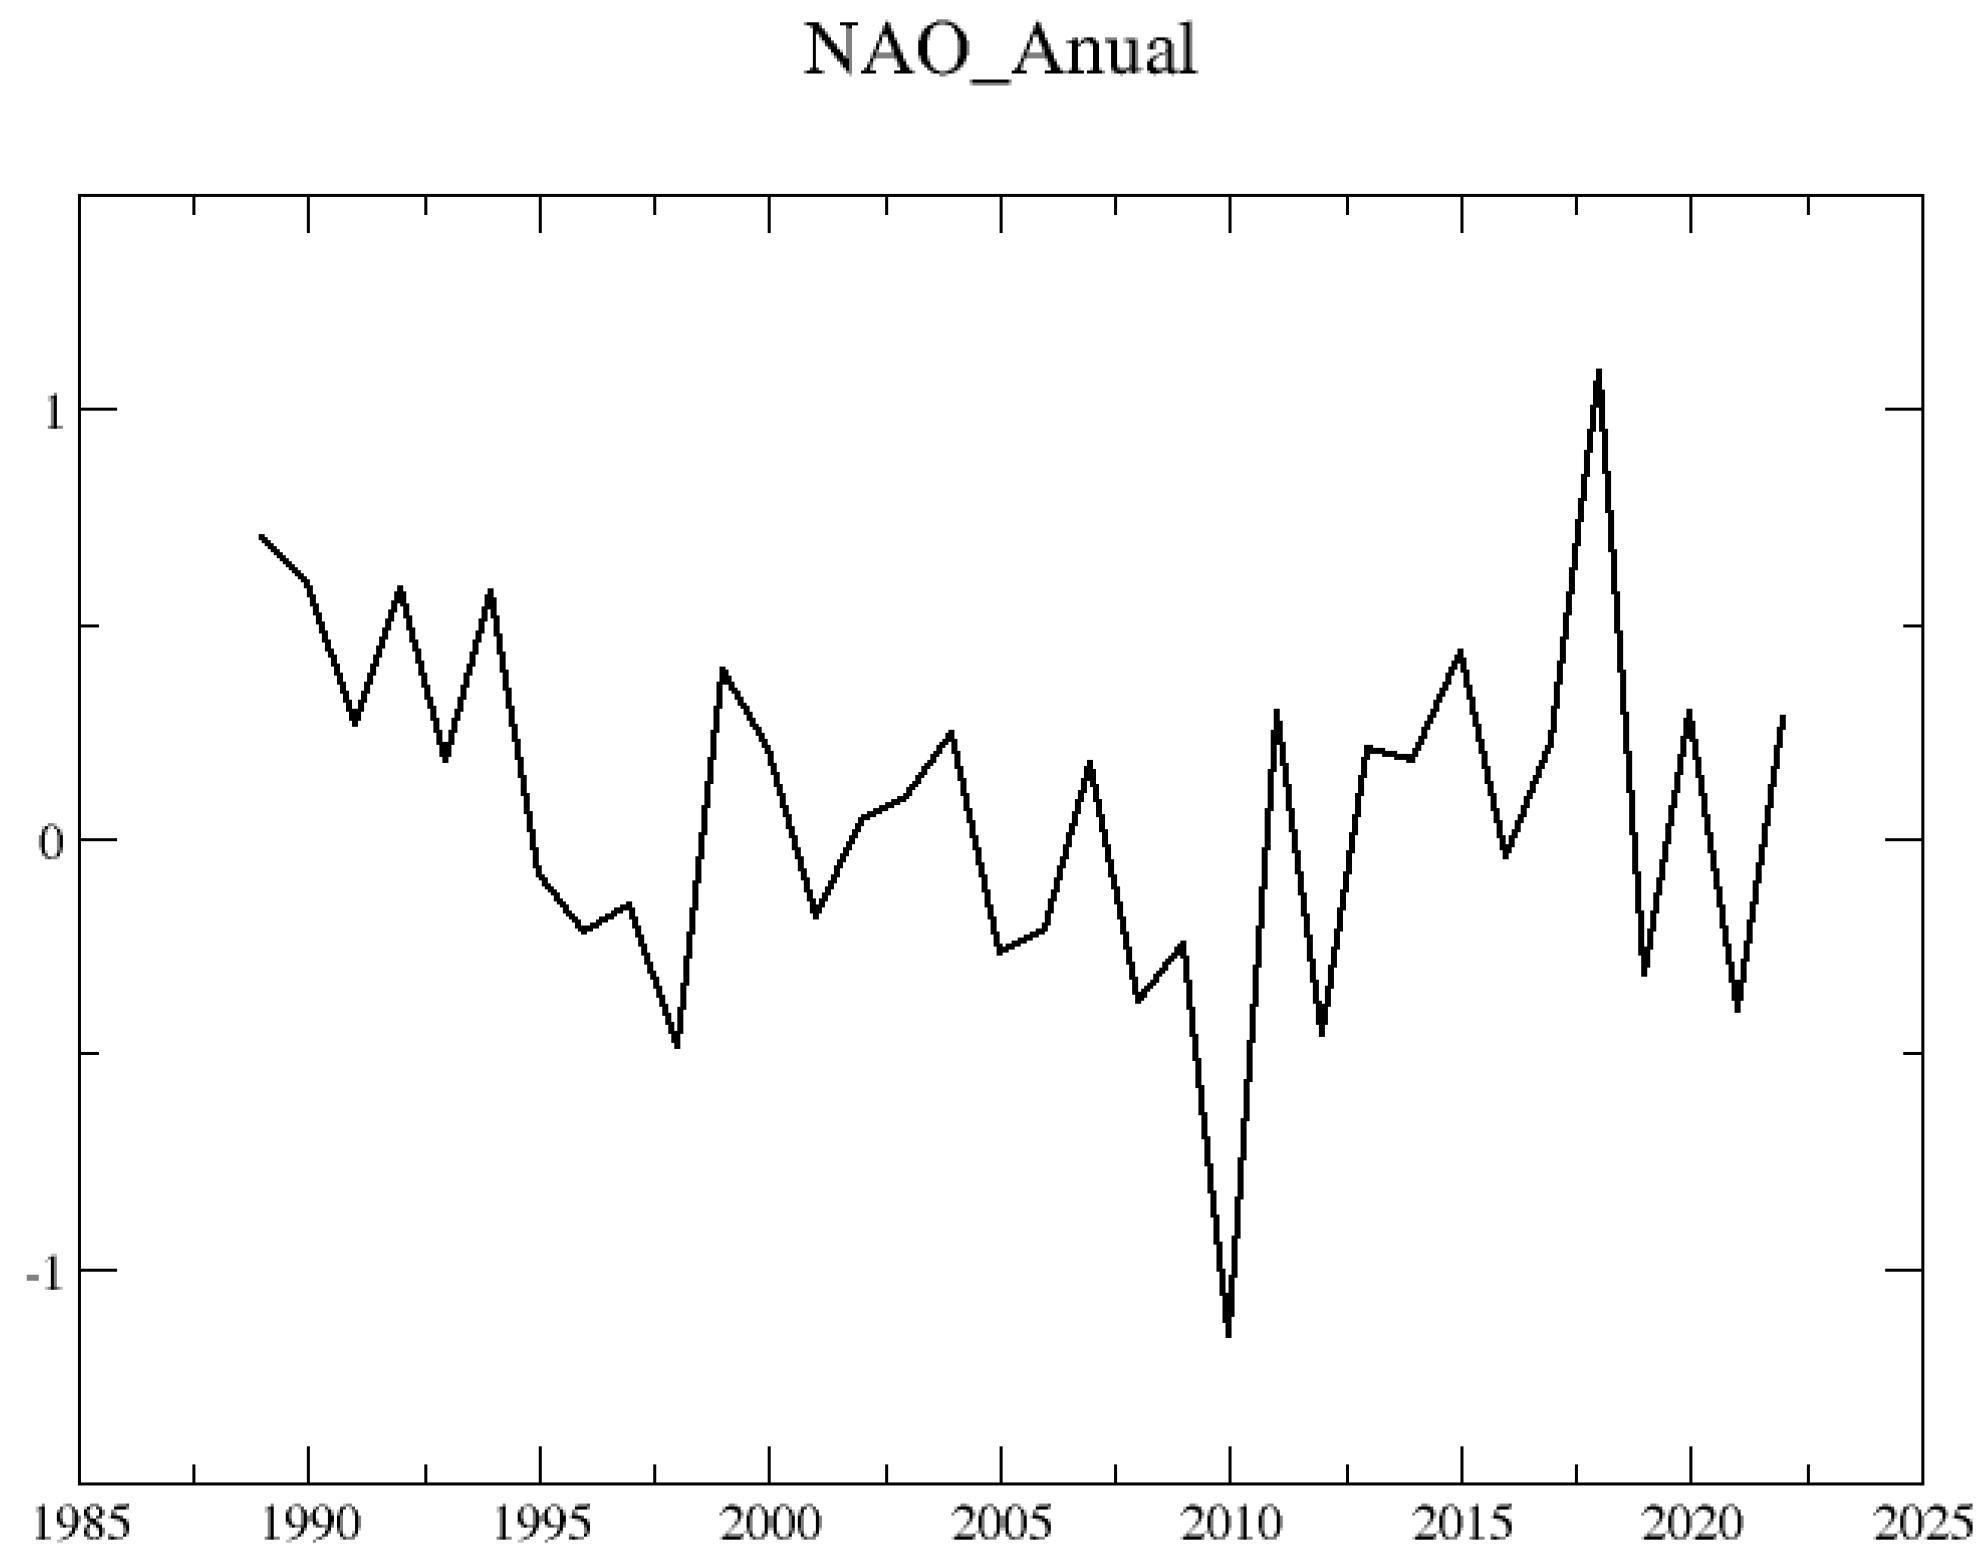
Figure 7.
Composite anomalies of Columnar Precipitable Water (kg/m²) for the warm season (May–September) for (a) 2003, (b) 2007, (c) 2014, and (d) 2021. Anomalies are calculated relative to the 1991–2020 climatology using NCEP/NCAR Reanalysis data.
Figure 7.
Composite anomalies of Columnar Precipitable Water (kg/m²) for the warm season (May–September) for (a) 2003, (b) 2007, (c) 2014, and (d) 2021. Anomalies are calculated relative to the 1991–2020 climatology using NCEP/NCAR Reanalysis data.
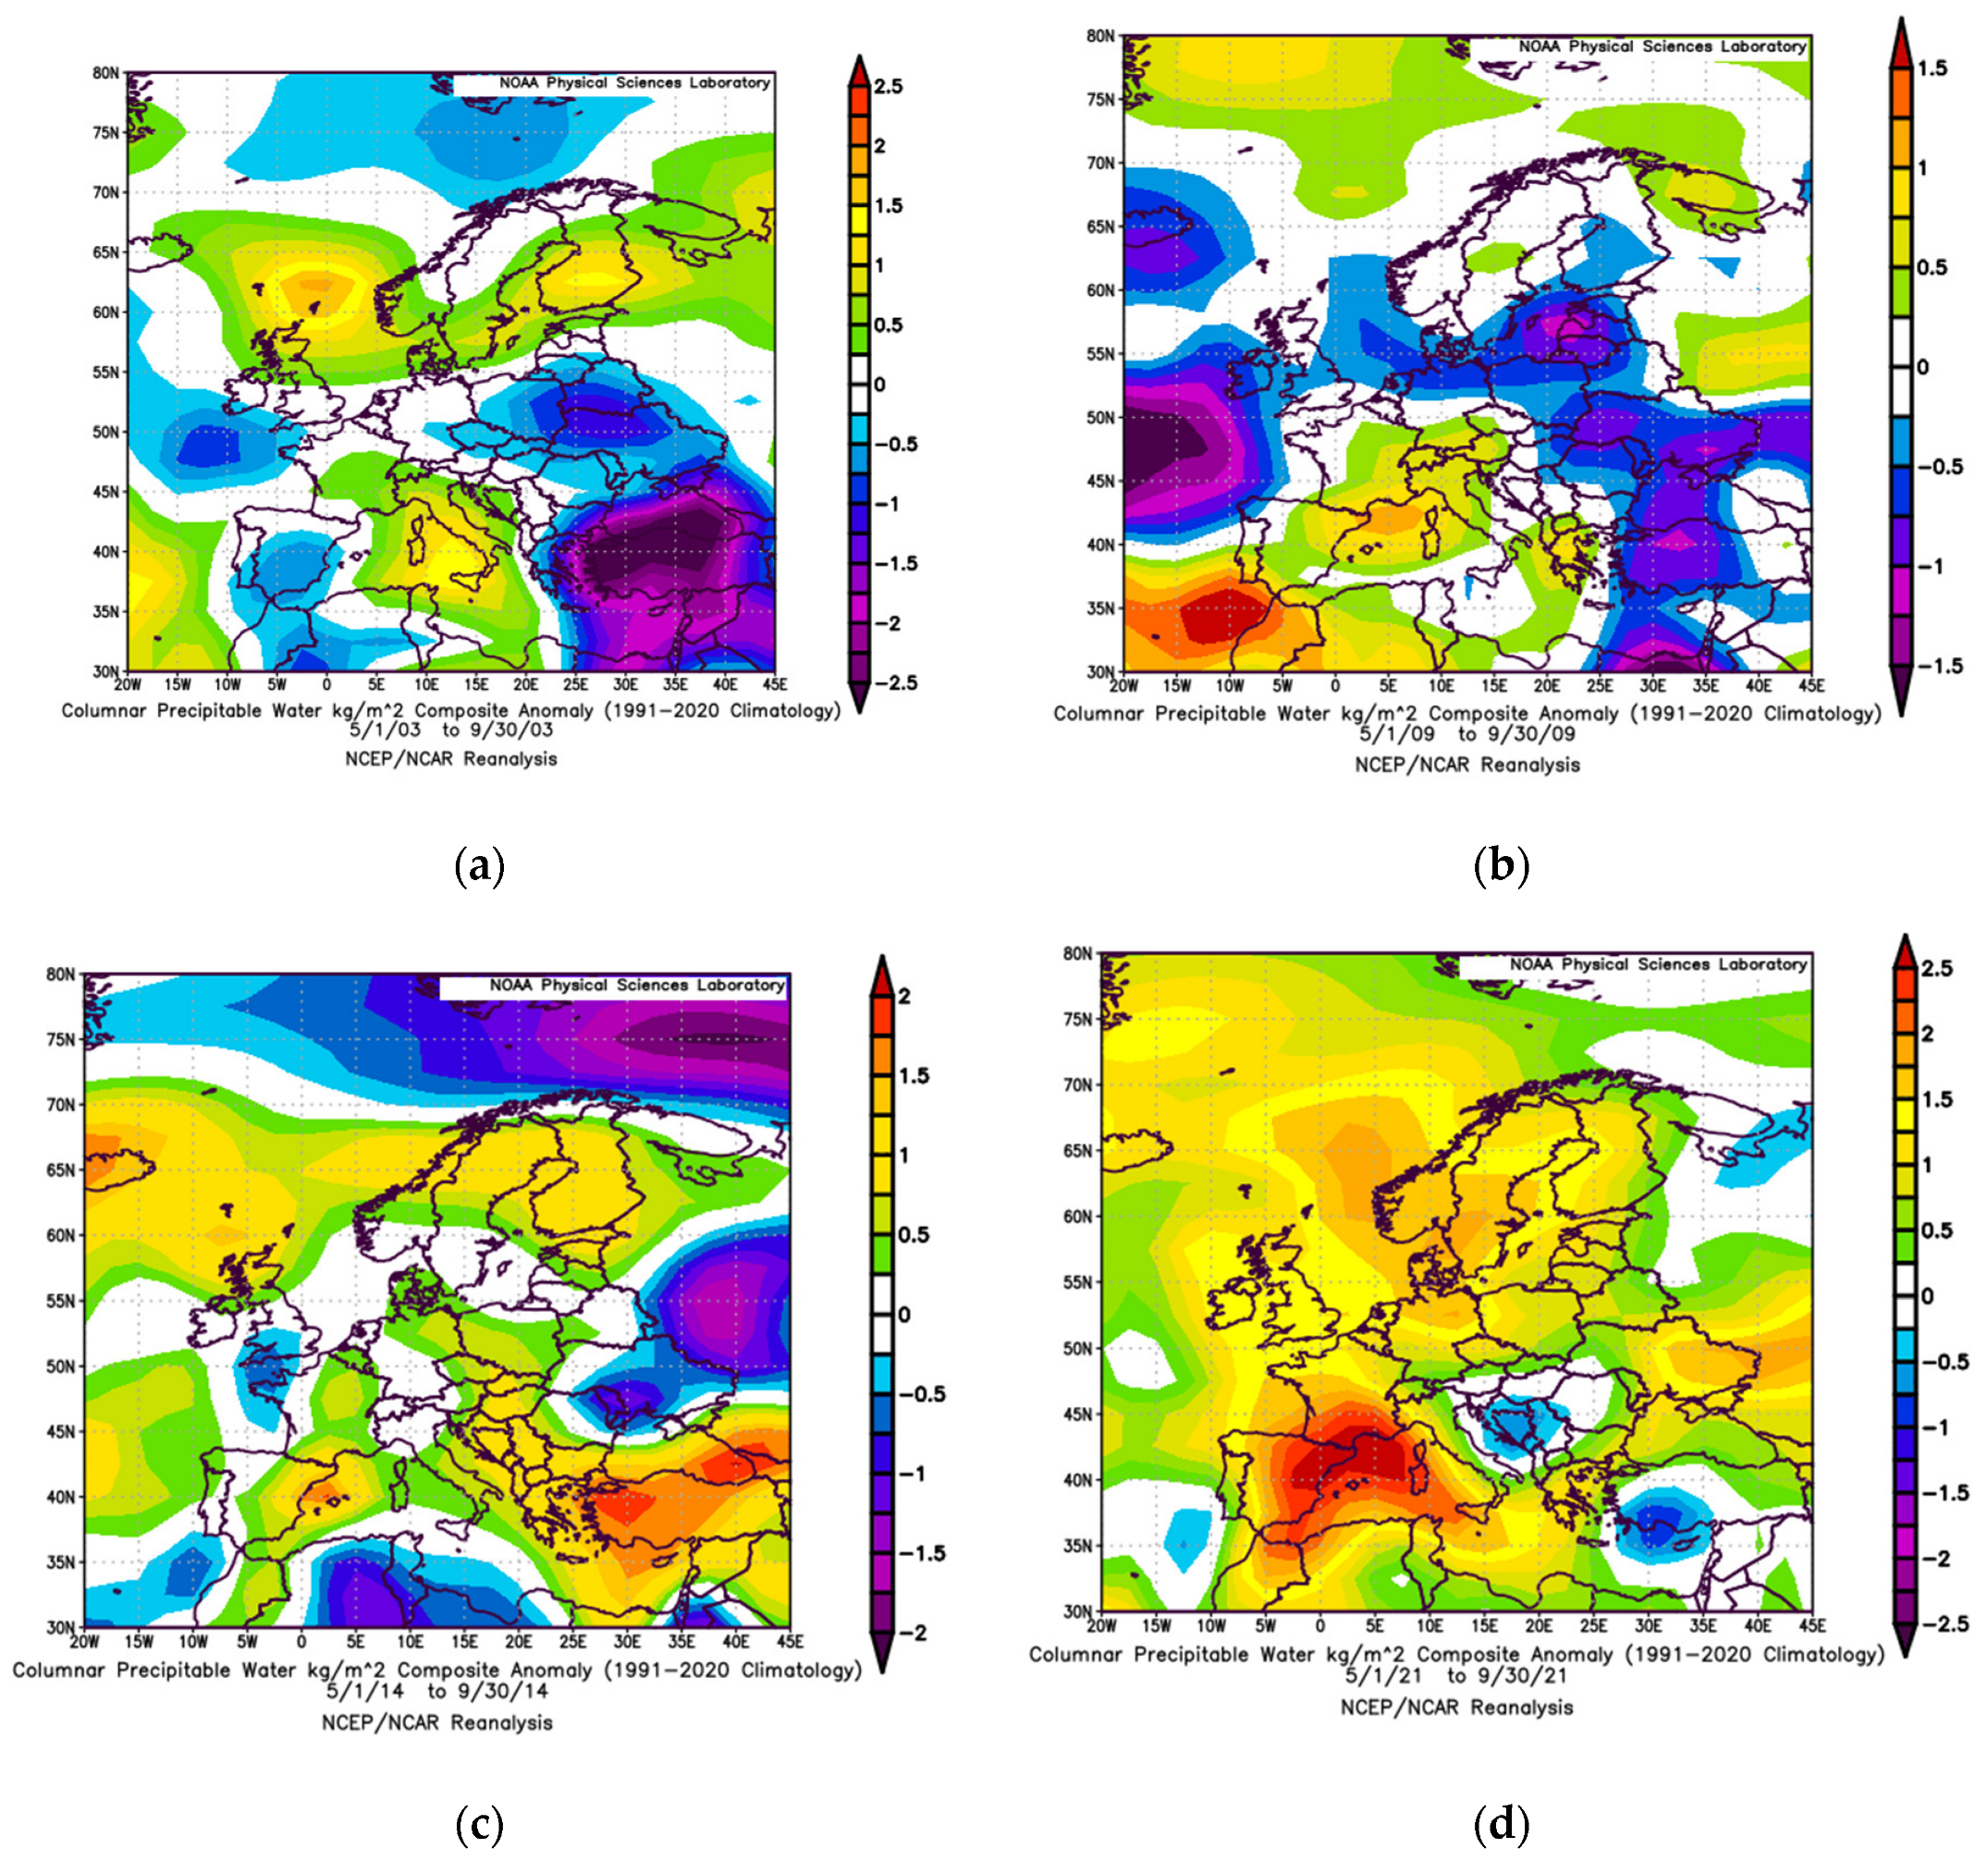
Figure 8.
Composite anomalies of 2m temperature (°C) for the warm season (May–September) relative to the 1981–2020 climatology for (a) 2007, (b) 2012, and (c) 2015. Data source: NCEP/NCAR Reanalysis.
Figure 8.
Composite anomalies of 2m temperature (°C) for the warm season (May–September) relative to the 1981–2020 climatology for (a) 2007, (b) 2012, and (c) 2015. Data source: NCEP/NCAR Reanalysis.
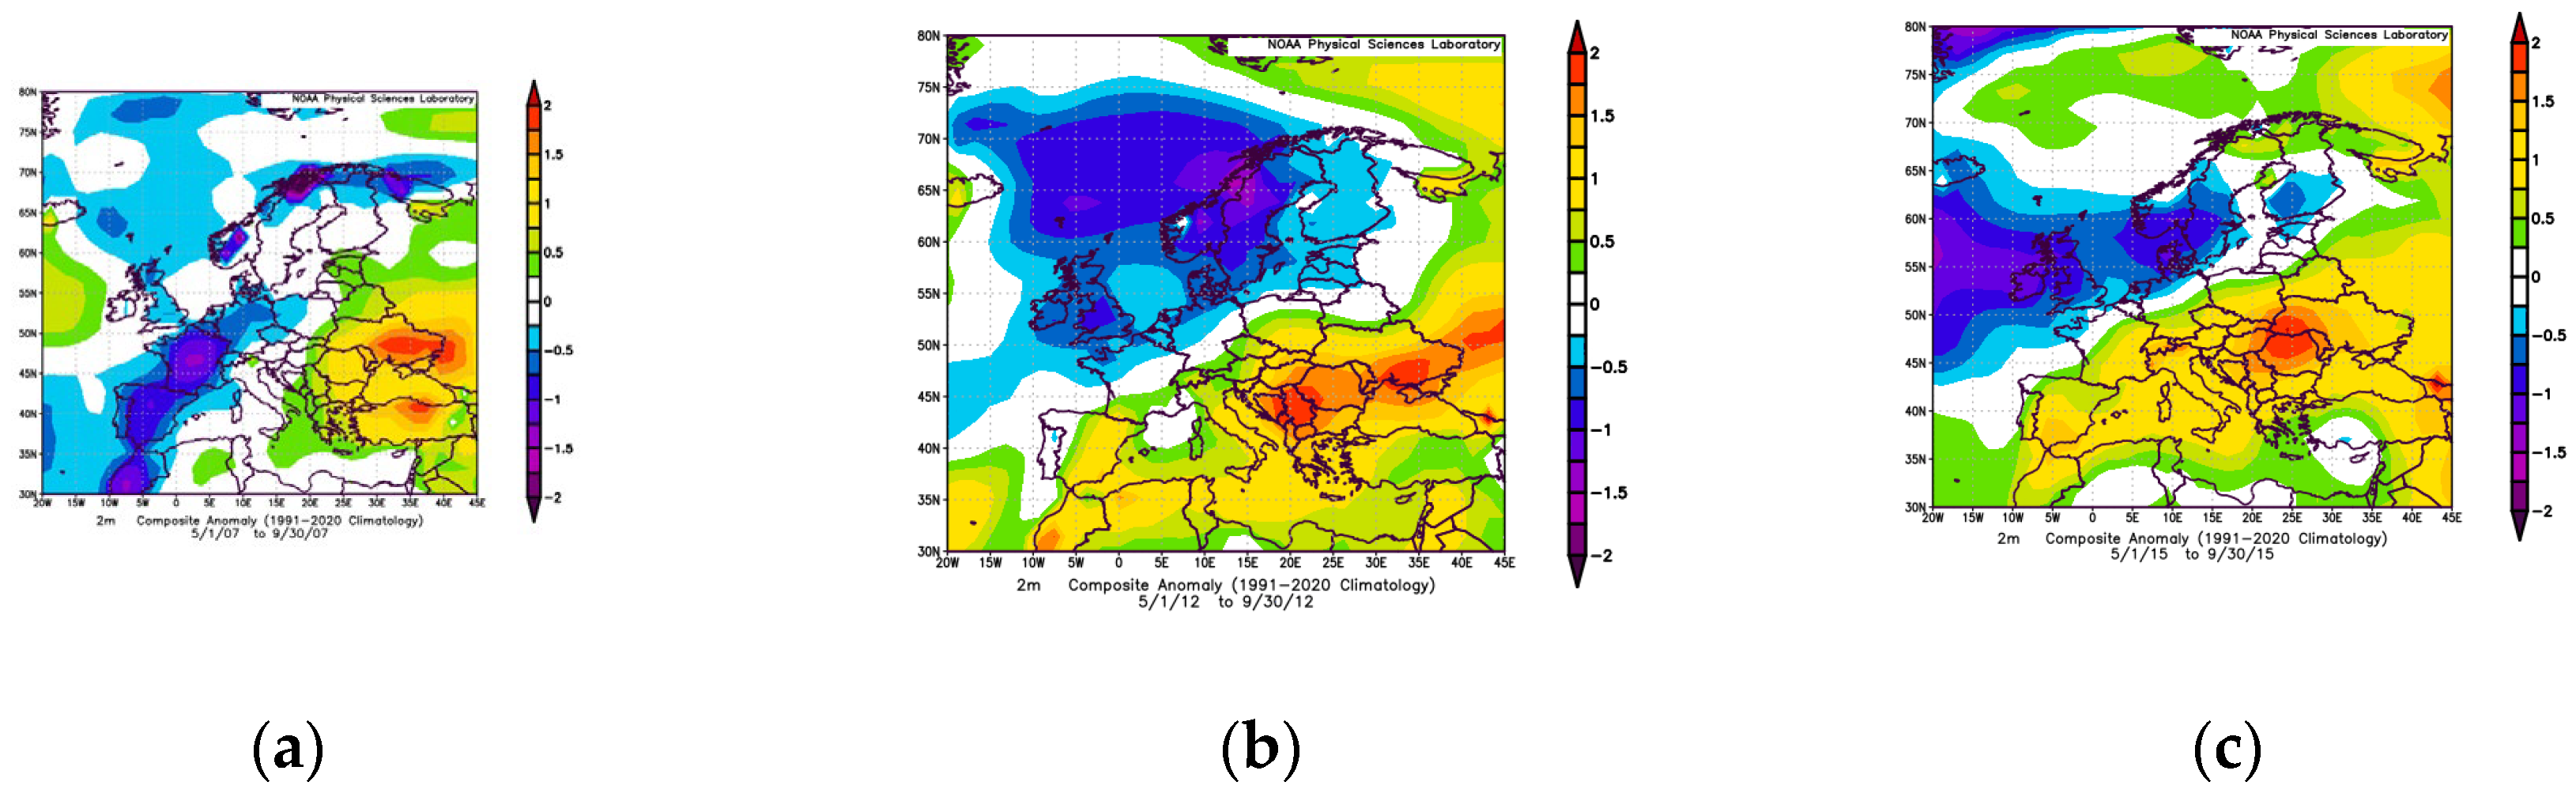
Figure 9.
Composite mean of 1000mb Specific Humidity (kg/kg) for the warm season (May–September) for (a) 2001 and (b) 2017. Data source: NCEP/NCAR Reanalysis.
Figure 9.
Composite mean of 1000mb Specific Humidity (kg/kg) for the warm season (May–September) for (a) 2001 and (b) 2017. Data source: NCEP/NCAR Reanalysis.
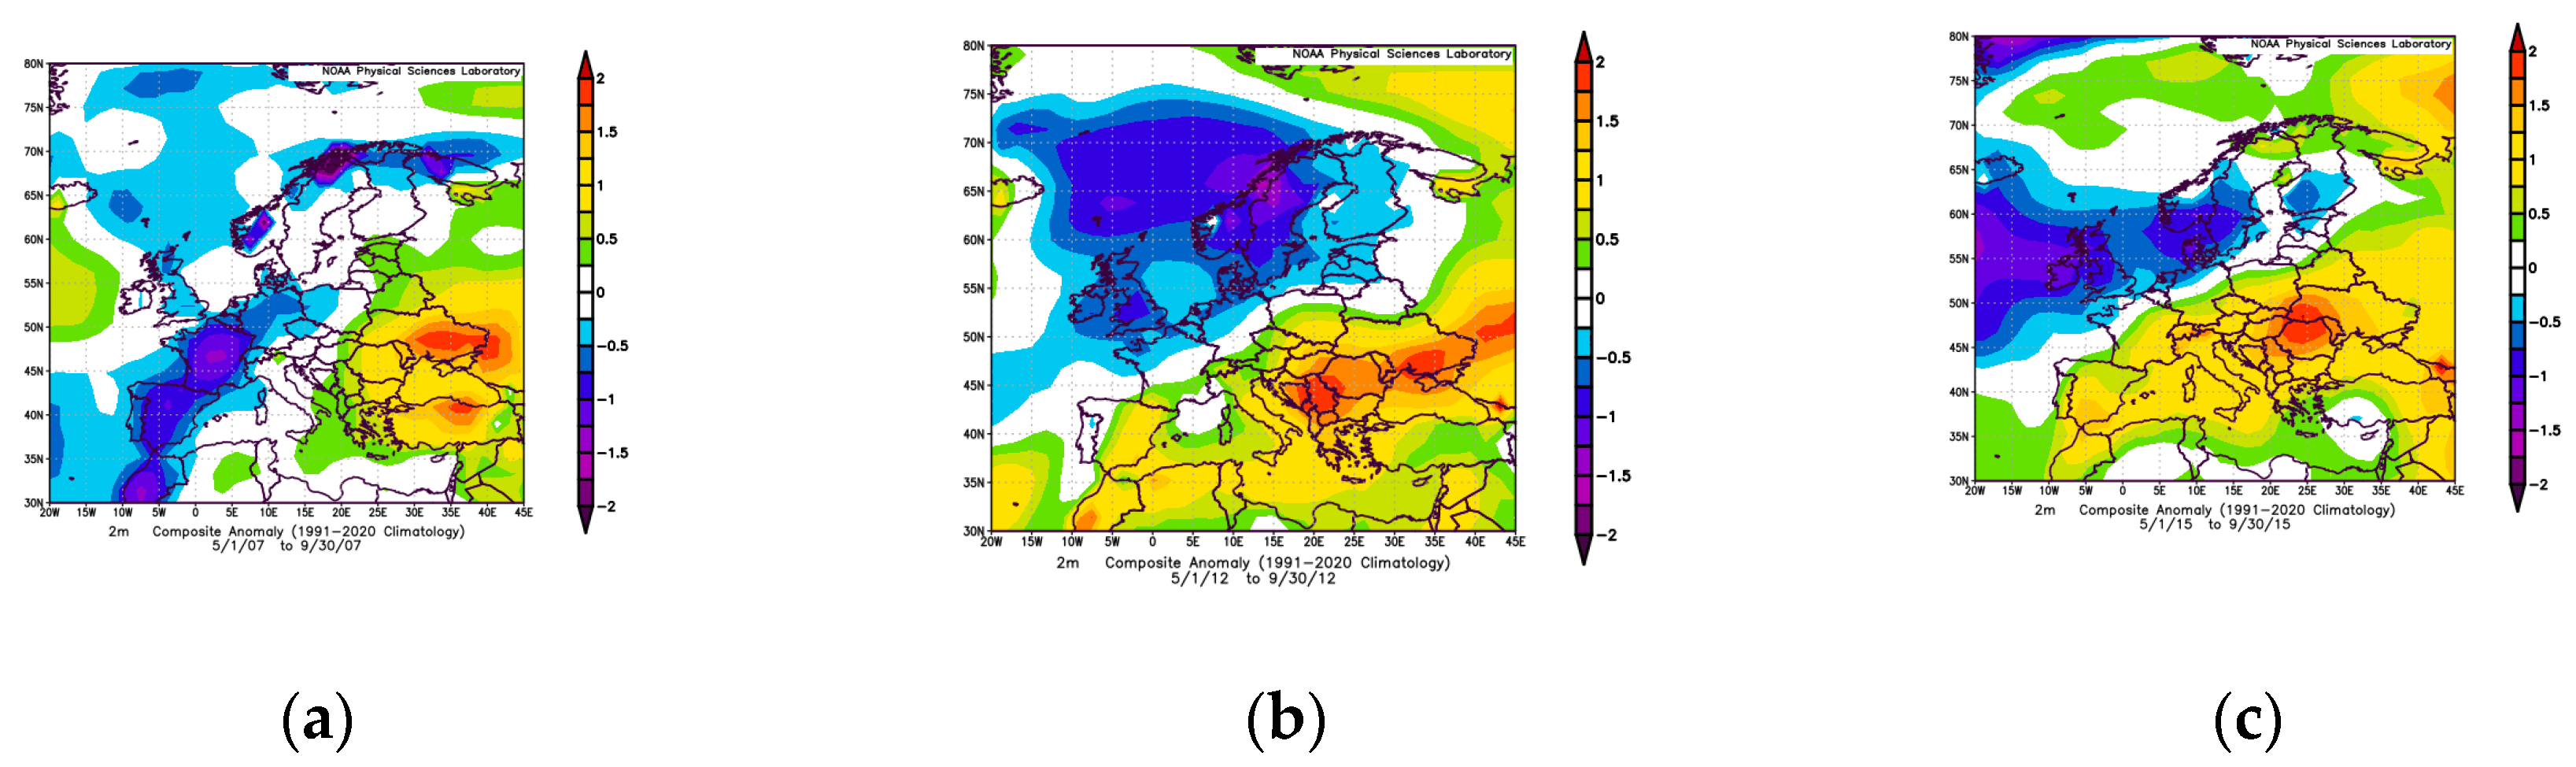
Figure 10.
Composite anomalies of 1000mb Meridional Wind (m/s) for the warm season (May–September) relative to the 1991–2020 climatology. The panels represent the synoptic context for: (a) 2007, (b) 2009, (c) 2010, (d) 2016, (e) 2017, (f) 2018, (g) 2020, (h) 2021, and (i) 2022. Data source: NCEP/NCAR Reanalysis.
Figure 10.
Composite anomalies of 1000mb Meridional Wind (m/s) for the warm season (May–September) relative to the 1991–2020 climatology. The panels represent the synoptic context for: (a) 2007, (b) 2009, (c) 2010, (d) 2016, (e) 2017, (f) 2018, (g) 2020, (h) 2021, and (i) 2022. Data source: NCEP/NCAR Reanalysis.
Disclaimer/Publisher’s Note: The statements, opinions and data contained in all publications are solely those of the individual author(s) and contributor(s) and not of MDPI and/or the editor(s). MDPI and/or the editor(s) disclaim responsibility for any injury to people or property resulting from any ideas, methods, instructions or products referred to in the content. |
© 2026 by the authors. Licensee MDPI, Basel, Switzerland. This article is an open access article distributed under the terms and conditions of the Creative Commons Attribution (CC BY) license (http://creativecommons.org/licenses/by/4.0/).
Copyright: This open access article is published under a Creative Commons CC BY 4.0 license, which permit the free download, distribution, and reuse, provided that the author and preprint are cited in any reuse.


