

Submitted:
01 July 2026
Posted:
02 July 2026
You are already at the latest version
Abstract
Accurate identification of suitable habitats is essential for the ecological, economic, conservation, and sustainable management of Almaciga (Agathis philippinensis). This study employed a geospatial Maximum Entropy (MaxEnt) species distribution modeling approach to predict the habitat suitability of Almaciga and identify the environmental factors influencing its distribution. Twenty environmental variables were initially evaluated using Pearson correlation analysis, hierarchical clustering, and Variance Inflation Factor (VIF) to minimize multicollinearity. The survey occurrences were split into 80% for training and 20% for testing. The final predictor set consisted of the maximum temperature of the warmest month (BIO5) and elevation (ELEV). Model performance was evaluated using the Area Under the Receiver Operating Characteristic Curve (AUC) with 99% and 98% accuracy for training and testing, respectively. The elevation was the most influential variable, contributing 90.5% to the model and accounting for 93.8% permutation importance. The suitability maps revealed that highly suitable areas (i.e., 331.27 km2) are concentrated in mountainous regions categorized by higher elevations and cooler temperatures. These findings provide valuable spatial information for conservation planning, habitat restoration, sustainable forest management, and climate adaptation strategies for Almaciga across the Philippines.
Keywords:
almaciga
; habitat suitability mapping
; maximum entropy (MaxEnt)
; geospatial analysis
1. Introduction
The Philippines is recognized as a global biodiversity hotspot [1,2] with high levels of species richness and endemism occurring alongside continuing habitat loss and land-use pressure [3,4]. Forest ecosystems are particularly important because they support many endemic, threatened, and economically valuable plant species [5,6] and provide ecosystem services such as watershed protection [7], carbon storage [8,9], livelihood resources [5,10,11], and habitat connectivity [12,13,14]. However, conservation planning in forest landscapes requires more than species lists [15]; it also requires spatially explicit information on where suitable habitats occur [5,16], which environmental factors shape species distributions [5,17], and which areas should be prioritized for protection, restoration, or sustainable management [18]. This need is especially relevant in biodiversity-rich regions of the Philippines, where field data remain uneven and spatial documentation of biodiversity is still affected by geographic and taxonomic gaps [19,20,21].
Almaciga (Agathis philippinensis Warb.) is an ecologically and economically important forest tree species in the Philippines. It is valued for its resin, commonly known as Manila copal, which has been used in varnish, paint, incense, paint driers, and other industrial products [22,23,24]. Previous work on A. philippinensis has shown that resin tapping and collection practices vary across sites and that the species contributes to the supplemental income of local and Indigenous communities, including in sites such as Mt. Hamiguitan, Governor Generoso, Davao Oriental [25]. At the same time, unsustainable tapping, excessive bark injury, poor tapping skills, habitat disturbance, and limited information on suitable habitats may affect the long-term management of remaining populations [22,24,25]. For this reason, identifying where the species is most likely to occur under suitable environmental conditions is important for aligning conservation goals with sustainable forest use.
Despite the ecological and livelihood importance of A. philippinensis, regional-scale spatial information on its suitable habitats in the Davao Region remains limited. Existing information is often derived from field observations, forest inventories, local management records, resin-quality studies, or site-specific tapping studies, which are valuable but may not fully capture the broader environmental conditions associated with the species’ distribution [23,25]. The Davao Region contains extensive mountainous landscapes, forest fragments, protected areas, ancestral domains, and production landscapes, necessitating the generation of evidence-based maps to guide conservation interventions [26]. Habitat suitability mapping and species distribution modeling can help identify priority areas for field validation, enrichment planting, habitat protection, and restoration, particularly in landscapes where conservation resources are limited [27,28].
Species distribution models are useful tools for addressing this type of spatial conservation problem. These models relate species occurrence records to environmental predictors to estimate areas with suitable environmental conditions across a landscape [27]. Among these approaches, Maximum Entropy modeling, or MaxEnt, is widely used because it can model species distributions using presence-only occurrence data, which are common in biodiversity surveys and herbarium- or inventory-based datasets [28]. MaxEnt has been applied in ecological, conservation, and biogeographic studies because it can generate spatial predictions even when confirmed absence data are unavailable [29,30]. However, presence-only models must be interpreted carefully because they estimate relative habitat suitability rather than confirmed species occupancy, and their outputs may be influenced by sampling bias, background selection, predictor choice, and model settings [29,30].
A major methodological concern in species distribution modeling is multicollinearity, which occurs when two or more environmental predictors are strongly correlated [15,31,32,33]. In ecological models, collinearity can make it difficult to interpret the relative influence of predictors because variables may share overlapping information [32,34,35]. This issue is particularly common when using bioclimatic variables, many of which are derived from related temperature and precipitation measurements [15,36]. Although some studies suggest that machine-learning algorithms such as MaxEnt may maintain high predictive performance even when correlated variables are included, collinearity can still affect ecological interpretation, model stability, and transferability [31,34]. Therefore, predictor screening using correlation analysis [37,38], hierarchical clustering [39,40,41], and Variance Inflation Factor [42,43] can improve model parsimony and support clearer interpretation of the environmental drivers of species distribution [36,44].
This study aimed to model the habitat suitability of A. philippinensis in the Davao Region, Philippines, using a geospatial MaxEnt approach and a multicollinearity-controlled variable-selection framework. Specifically, the study sought to: (1) predict the spatial distribution of suitable A. philippinensis habitats; (2) identify the most influential environmental predictors after reducing multicollinearity among 20 environmental variables; and (3) generate a suitability map that can support conservation planning, habitat restoration, enrichment planting, sustainable forest management, and climate adaptation planning.
2. Materials and Methods
2.1. Study Area and Occurrence Records
The research was conducted in the Davao Region, officially designated as Region XI, situated in southeastern Mindanao, Philippines (Figure 1). The study area was delineated according to the administrative boundaries of Region XI, which encompasses five provinces: Davao de Oro, Davao del Norte, Davao del Sur, Davao Occidental, and Davao Oriental. As of 31 July 2025, the region comprises six cities, 43 municipalities, and 1,162 barangays [45,46]. The Davao Region features diverse landscapes, such as coastal lowlands, interior valleys, uplands, and montane forest systems [47,48,49], which provides a suitable context for assessing the potential habitat suitability of A. philippinensis.
The target taxon for species distribution modeling was almaciga, which is treated in this study as Agathis philippinensis Warb. Although current taxonomic treatment places A. philippinensis as a synonym of the accepted name Agathis dammara (Lamb.) Rich., the name A. philippinensis is retained because it remains widely used in Philippine forestry, conservation, and almaciga literature [25,50,51,52,53]. The species is associated with upland and mountainous forests and has reported biophysical limits of 150–2,200 m elevation, 22–32 °C mean annual temperature, and 2,500–5,000 mm annual rainfall [53]. Almaciga has been recorded in Davao, with resin-tapping communities identified in Governor Generoso, Davao Oriental, in proximity to Mt. Hamiguitan [25,54]. The existence of significant conservation areas, including the Mount Hamiguitan Range Wildlife Sanctuary, further demonstrates the region’s suitability for ecological modeling due to its pronounced environmental gradients and diverse habitats [55]. Since A. philippinensis is listed as Vulnerable (VU) in the IUCN Red List under the accepted name A. dammara [51] and is also listed among threatened Philippine plants [56] habitat suitability modeling in Davao Region can support conservation prioritization, enrichment planting, plantation planning, and sustainable resin-resource management [57].
Occurrence records of A. philippinensis were obtained from the Global Biodiversity Information Facility (GBIF) [58] nd supplemented with field survey data collected by the authors in 2025. Before modeling, all occurrence records underwent data-quality screening. Records with duplicate geographic coordinates, missing or erroneous coordinate information, or locations outside the Davao Region study boundary were excluded [59]. The occurrence records used in this study are provided in the supplemental data (Table S1).
2.2. Environmental Variables Selection
Twenty environmental variables were used at a spatial resolution of 30 arc-seconds, corresponding to approximately 1 km (Table 1). Nineteen bioclimatic variables were sourced from the WorldClim database Version 2.1, which provides global climate layers widely applied in ecological and species distribution modeling [60,61]. Elevation (ELEV) was included as a topographic predictor and derived from the Shuttle Radar Topography Mission (SRTM) digital elevation model, and also available from WorldClim [61,62]. These variables were chosen to represent the climatic and topographic conditions that may influence the distribution of Agathis philippinensis in the Davao Region.
Pairwise Pearson correlation coefficients were calculated for all combinations of environmental predictors to minimize multicollinearity. High correlations among variables can reduce model interpretability, increase parameter uncertainty, and influence estimates of variable importance in ecological and species distribution models [31,34]. Variables with absolute correlation coefficients (|r|) of 0.70 or higher were classified as highly correlated and grouped using hierarchical clustering analysis [39,40]. From each cluster, a single representative variable was selected based on ecological relevance, biological interpretability, and statistical independence [39,41]. Variables with |r| values between 0.80 and 0.89 were considered highly correlated, while values of 0.90 or above indicated severe multicollinearity and led to the exclusion of redundant predictors (Table 2) [63,64]. Correlation strength was interpreted according to established guidelines for correlation coefficients [33,65].
Following correlation-based screening, the retained variables were further evaluated using the Variance Inflation Factor (VIF) to quantify remaining multicollinearity. VIF estimates how much the variance of a predictor is inflated due to its linear relationships with other explanatory variables [66,67]. It is expressed as in Equation 1:
VIFi = 1/(1 – Ri2)
where (VIFi) is the Variance Inflation Factor of predictor (i), and (Ri2) is the coefficient of determination obtained by regressing predictor (i) against all other predictor variables. Higher (Ri2) values indicate that the predictor can be explained by the remaining variables, resulting in greater multicollinearity. Conversely, VIF values close to 1 indicate that the predictor provides relatively unique information.
In this study, variables with VIF values greater than 5 were considered highly collinear and were iteratively removed from the predictor set. The use of a conservative VIF threshold of 5 is widely adopted to identify problematic multicollinearity; however, such thresholds should be regarded as practical guidelines rather than definitive statistical criteria [63,66,67]. The integration of Pearson correlation analysis, hierarchical clustering, and VIF assessment established a systematic framework for selecting a parsimonious set of environmental predictors appropriate for MaxEnt modeling. This methodology aligns with established recommendations to eliminate redundant predictors, reduce overfitting, and enhance interpretability in species distribution models [29,30,34].
2.3. Species Distribution Modeling
The potential distribution of A. philippinensis was modeled using the Maximum Entropy algorithm, commonly referred to as MaxEnt. This machine-learning method is widely utilized in species distribution modeling that relies on presence-only occurrence records and environmental predictors [28,29,68]. MaxEnt is particularly suitable for this study, as occurrence data for many forest species are generally available only as presence records, while reliable absence data are often limited or unavailable [28,30].
The selected occurrence records and environmental predictors were used to estimate the relative habitat suitability of A. philippinensis across Davao Region. MaxEnt generates a continuous suitability output ranging from 0 to 1, where higher values indicate areas with environmental conditions more similar to those associated with known occurrence points [28,68]. In this study, the resulting suitability surface was interpreted as a relative index of suitable environmental conditions for A. philippinensis, rather than as a direct estimate of true species abundance or confirmed presence.
The MaxEnt algorithm is based on the principle of maximum entropy, which estimates the probability distribution closest to uniform while satisfying constraints derived from the environmental characteristics of known occurrence locations [28,29]. This allows the model to compare environmental conditions at species occurrence points with those available across the background study area, thereby identifying areas with similar ecological conditions [30].
MaxEnt estimates the most uniform or least-biased probability distribution of habitat suitability across the study area while satisfying constraints derived from environmental conditions observed at known occurrence locations. If the study area is represented by a set of grid cells x, MaxEnt seeks to estimate a probability distribution p(x) that maximizes entropy as shown in Equation 2 below:
H(p) = - Σₓ p(x) log p(x)
subject to the condition that the expected value of each environmental predictor under the estimated distribution is equal, or approximately equal, to its empirical average at the species occurrence points as stated in Equation 3:

where fj(x) represents the value of environmental predictor j at grid cell x, and f̂j represents the empirical mean of that predictor across the occurrence records. The resulting MaxEnt distribution can be expressed in Equation 4 below as:

where λj is the fitted coefficient or weight for predictor j, and Z is a normalization constant that ensures that the predicted probabilities across all grid cells sum to one (Equation 5) :

In this formulation, grid cells with environmental conditions more similar to the known occurrence records receive higher suitability values, while grid cells with less similar conditions receive lower values. Therefore, the MaxEnt output represents relative environmental suitability rather than confirmed species presence, abundance, or occupancy.
In ecological terms, the model compares the environmental profile of A. philippinensis occurrence points with the environmental conditions available across the Davao Region. The algorithm then assigns higher suitability to areas that share similar elevation and climatic characteristics with the occurrence records. The use of MaxEnt in geospatial environmental modeling has also been demonstrated in Davao Oriental by Cabrera and Lee [69], who applied the maximum entropy model together with GIS-based multi-criteria analysis for spatial risk assessment [69]. Their study reported that MaxEnt provided high verification accuracy, supporting its usefulness as a data-driven spatial modeling approach in data-limited settings.
2.4. Model Evaluation and Variable Importance
Model performance was evaluated using the Area Under the Receiver Operating Characteristic Curve (AUC), a threshold-independent metric widely applied to assess the discriminatory capacity of species distribution models (Table 3) [70,71]. In presence-only MaxEnt modeling, AUC differentiates known occurrence records from background locations rather than true presences from true absences. Therefore, AUC was interpreted as a relative indicator of predictive performance and applied with caution, as it may be affected by background extent, prevalence, and spatial bias [28,29,30,72,73]. AUC values range from 0.5 to 1.0, with values approaching 1.0 reflecting stronger model discrimination and values above 0.90 indicating excellent model performance. Variable importance was assessed using MaxEnt-derived percent contribution, permutation importance, and jackknife analyses to quantify the relative influence of each environmental predictor on the potential distribution of Agathis philippinensis [28,30,68].
2.5. Habitat Suitability Mapping
The suitability outputs generated by MaxEnt were reclassified into five habitat suitability categories to facilitate interpretation, spatial analysis, and conservation planning (Table 4). MaxEnt outputs were interpreted as relative habitat suitability values ranging from 0 to 1, where higher values indicate environmental conditions more similar to those associated with known occurrence records [28,29,68]. The suitability raster was reclassified into five equal-interval classes: unsuitable (0.0–0.2), low (0.2–0.4), moderate (0.4–0.6), high (0.6–0.8), and very high suitability (0.8–1.0). Such reclassification of continuous species distribution model outputs is commonly used to improve map interpretation and support spatial decision-making. However, threshold classes should be interpreted as relative suitability categories rather than confirmed presence or absence [30,74]. The resulting habitat suitability map was used to identify potential distribution areas and priority zones for the conservation, enrichment planting, forest restoration, and sustainable management of Agathis philippinensis across the Davao Region [75,76].
3. Results and Discussions
3.1. Environmental Variables Selection
A total of 20 environmental predictors, comprising nineteen (19) WorldClim bioclimatic variables and one (1) topographic layer, were initially evaluated to characterize the potential habitat of A. philippinensis in the Davao Region. To assess multicollinearity, 1,000 random points were generated across the study area, and predictor values were extracted from each point for Pearson correlation analysis. The random points were used only for predictor screening, not for MaxEnt model calibration; therefore, the 1,000-point sample was considered sufficient to evaluate multicollinearity among the environmental variables. The correlation matrix showed substantial redundancy among several predictors (Figure 2). Strong positive correlations were observed among temperature-related variables, particularly BIO1, BIO5, BIO6, BIO8, BIO9, BIO10, and BIO11, and among precipitation-related variables, including BIO12, BIO13, BIO14, BIO15, BIO16, BIO17, BIO18, and BIO19. Several pairs of variables exceeded the threshold of |r| ≥ 0.70, indicating potential multicollinearity. Highly correlated variables were therefore excluded prior to MaxEnt modeling to reduce predictor redundancy and improve model interpretability, following recommendations in ecological and species distribution modeling [30,34]. The use of WorldClim bioclimatic variables was appropriate because these predictors summarize annual climatic trends, seasonality, and limiting climatic conditions derived from monthly temperature and precipitation values [60,61].
Hierarchical clustering analysis was conducted using a correlation threshold of |r| > 0.70 to reduce predictor redundancy. The dendrogram grouped the environmental variables into five major clusters (see Table 5 and Figure 3), with variables within each cluster considered to contain similar environmental information. Cluster 1 group includes BIO4, BIO12, BIO13, BIO15, BIO16, and BIO19, while Cluster 2 group are BIO14, BIO17, and BIO18. Cluster 3 consists of temperature-related variables, such as BIO1, BIO5, BIO6, BIO8, BIO9, BIO10, and BIO11. Cluster 4 comprises BIO2, BIO3, and BIO7, whereas elevation (ELEV) forms a distinct cluster, indicating its unique topographic contribution. One representative variable was selected from each cluster based on ecological relevance, statistical independence, and interpretability. This variable-screening approach minimized multicollinearity, reduced potential overfitting, and improved the interpretation of the MaxEnt model, consistent with recommended practices in species distribution modelling [30,34].
Following correlation-based screening, the representative variables were further evaluated using the Variance Inflation Factor (VIF) analysis. Variables with VIF values greater than 5 were iteratively removed. The final predictor set retained BIO5, representing the Maximum Temperature of the Warmest Month, and elevation (ELEV), both with VIF values of 1.731 (Table 6). These values were well below the commonly applied VIF threshold of 5, indicating the absence of problematic multicollinearity among the retained predictors [34,63,66].
The selection of BIO5 and elevation (ELEV) as the final predictors indicates that the potential distribution of A. philippinensis in the Davao Region is primarily determined by warm-season temperature and topographic gradients. Both variables persisted after correlation-based screening and variance inflation factor (VIF) analysis, demonstrating that each contributed unique environmental information. This outcome aligns with established practices in species distribution modeling, which recommend reducing highly correlated predictors to enhance model interpretability and prevent inflated estimates of variable importance [30,34,66]. From an ecological perspective, elevation is significant because A. philippinensis occupies upland and montane forest habitats and has been documented across a wide elevational range, approximately 150–2,200 m above sea level [53]. Elevation may therefore serve as a proxy for multiple environmental gradients, such as temperature, moisture, terrain, and forest structure. BIO5, representing the Maximum Temperature of the Warmest Month, likely reflects the upper thermal limits that influence habitat suitability, especially at lower elevations or more exposed sites. As WorldClim bioclimatic variables capture annual trends, seasonality, and climatic extremes, BIO5 is particularly relevant for identifying heat-related constraints in species distribution modelling [60,61]. The exclusion of most precipitation variables does not indicate that rainfall is unimportant for A. philippinensis. Instead, these variables exhibited high collinearity and likely provided redundant climatic information. The final predictor set indicates that suitable habitats for A. philippinensis in the Davao Region are primarily defined by elevation-related environmental gradients and maximum warm-season temperature, resulting in a parsimonious and interpretable MaxEnt model.
3.2. Final Environmental Variables Influencing the Habitat Distribution of A. philippinensis
Following multicollinearity screening, only two environmental variables, ELEV and BIO5, were retained for final MaxEnt modeling. Elevation was the dominant predictor, contributing 90.5% to the model and accounting for 93.2% of permutation importance, while BIO5 contributed 9.5% and accounted for 6.2% of permutation importance (Table 7). This indicates that the potential distribution of Agathis philippinensis in the Davao Region is more strongly influenced by topographic gradients than by warm-season temperature alone.
The jackknife analysis supported this result (Figure 4a–c). Elevation produced the highest regularized training gain, test gain, and AUC when used independently, and its omission caused the greatest reduction in model performance. This suggests that elevation contained the most unique and useful information for predicting habitat suitability. Ecologically, this is consistent with the known association of A. philippinensis with upland rainforest environments, where elevation may represent linked gradients in temperature, moisture, terrain, soil condition, and vegetation structure [53,77,78].
The ROC analysis showed excellent model performance, with a training AUC of 0.990 and a test AUC of 0.988 (Figure 4d). The small difference between training and test AUC values suggests that the model generalized well and showed limited evidence of overfitting. Largely, the results indicate that ELEV and BIO5 captured the major environmental gradients influencing the predicted habitat suitability of A. philippinensis in the Davao Region, while maintaining a parsimonious and interpretable MaxEnt model [30,68,71].
The response curves further show the influence of elevation and BIO5 on the predicted habitat suitability of Agathis philippinensis (Figure 5). Habitat suitability increased sharply with elevation, particularly above approximately 1,200–1,500 m, and reached a maximum suitability at higher elevations. This pattern supports the strong association of A. philippinensis with upland and montane forest environments, where elevation represents linked gradients in temperature, moisture, terrain, and vegetation structure [53,77,78].
In contrast, habitat suitability declined as BIO5 (Maximum Temperature of the Warmest Month) increased. Suitability remained high under lower maximum-temperature conditions but decreased rapidly when BIO5 exceeded approximately 24–26 °C and approached zero above 30 °C. Since WorldClim bioclimatic variables are derived from monthly temperature and rainfall data to represent biologically meaningful climatic conditions, this response suggests that warm-season temperature may be a limiting factor for A. philippinensis distribution in the Davao Region [60,61].
3.3. Predicted Habitat Suitability and Potential Distribution of A. philippinensis
The MaxEnt habitat suitability map showed a heterogeneous distribution of suitable habitats for A. philippinensis across the Davao Region (Figure 6). Most of the study area was classified as unsuitable, while high- and very high-suitability areas were concentrated in isolated mountainous landscapes. This pattern is consistent with the model results, where elevation was the strongest predictor, and with published accounts describing A. philippinensis as an upland forest species occurring across broad elevational ranges, including montane environments [53,77]. The suitability analysis showed that 89.75% of the study area, equivalent to 28,774.50 km², was classified as unsuitable (Table 8). This likely reflects the dominance of low-elevation, warmer, agricultural, urbanized, or disturbed landscapes that do not match the environmental conditions associated with A. philippinensis occurrence. Low and moderate suitability areas covered 1,801.02 km² and 731.88 km², respectively, representing transitional habitats where some environmental requirements may be present but are insufficient to support optimal habitat suitability. Only 2.34% of the study area, equivalent to 752.42 km², was classified as high to very high suitability. These areas were mainly concentrated in mountainous portions of the Davao Region, including landscapes associated with the Mount Hamiguitan Range, Mayo Range, Mt. Kampalili-Puting Bato, and Mt. Apo forest systems. The concentration of suitable habitats in these areas reflects the species’ affinity for cooler, higher-elevation environments and relatively intact forest conditions. This is also consistent with the response curves, which showed increasing suitability with elevation and declining suitability under higher maximum temperatures.
The fragmented distribution of highly suitable habitats suggests that A. philippinensis populations in the Davao Region may be restricted to isolated upland refugia. Such spatial confinement may increase vulnerability to forest degradation, land-use change, and future warming, particularly at lower elevations. Therefore, high- and very-high-suitability areas should be prioritized for in situ conservation, seed-source protection, assisted regeneration, and sustainable forest management. The resulting suitability map provides spatial guidance for conservation planning and restoration strategies to support the long-term persistence of A. philippinensis in the Davao Region.
3.4. Limitations of This Study
This study has several limitations that should be considered in interpreting the results. First, the MaxEnt model was based on presence-only occurrence records; therefore, the predicted output represents relative habitat suitability rather than confirmed species presence, abundance, or occupancy. Second, although occurrence records were screened and cleaned before modeling, the dataset may still reflect spatial sampling bias associated with accessible or previously surveyed areas. Third, the model used regional-scale environmental layers and retained only elevation and BIO5 after multicollinearity screening; thus, other potentially important ecological factors such as soil properties, forest structure, land cover, disturbance, resin-tapping pressure, and microhabitat conditions were not directly incorporated. Fourth, the suitability classes should be interpreted as relative categories rather than direct evidence of species presence or absence. Finally, the study did not include future climate or land-use change scenarios, and the predicted high- and very high-suitability areas require field validation before being used for site-specific conservation, restoration, or enrichment-planting decisions.
4. Conclusions
The findings demonstrate the usefulness of a geospatial MaxEnt approach combined with multicollinearity-controlled variable selection for modeling the habitat suitability of Agathis philippinensis in the Davao Region. From the initial 20 environmental predictors, only elevation and BIO5, or the maximum temperature of the warmest month, were retained after variable screening. This indicates that the predicted distribution of A. philippinensis in the study area is mainly influenced by topographic gradients and warm-season temperature. The model also showed strong predictive performance, as reflected in the high training and test AUC values, supporting its ability to discriminate between suitable and unsuitable areas within the Davao Region.
The habitat suitability map showed that most of the Davao Region is unsuitable for A. philippinensis, covering 28,774.50 km² (89.75%) of the study area. Low-suitability areas accounted for 1,801.02 km² or 5.62%, while moderate-suitability areas covered 731.88 km² or 2.28%. In contrast, high-suitability areas accounted for only 421.15 km² (1.31%), and very high-suitability areas covered 331.27 km² (1.03%). Combined, high- and very high-suitability habitats accounted for only 752.42 km², or 2.34%, of the study area, indicating that optimal habitats for A. philippinensis are limited and mainly associated with mountainous landscapes.
The findings should be interpreted with consideration of the study’s limitations. The MaxEnt model was based on presence-only occurrence records; therefore, the predicted outputs represent relative habitat suitability rather than confirmed species presence, abundance, or occupancy. Although occurrence records were screened before modeling, potential spatial sampling bias may still be present. In addition, the use of regional-scale environmental layers and the retention of only elevation and BIO5 mean that other potentially important habitat factors, such as soil properties, forest structure, land cover, disturbance, resin-tapping pressure, and microhabitat conditions, were not directly incorporated. The suitability classes should therefore be treated as relative categories that require field validation before being used for site-specific management decisions.
Overall, the results highlight the need to prioritize high- and very high-suitability areas for conservation, seed-source protection, assisted regeneration, enrichment planting, and sustainable forest management. The suitability map provides spatially explicit information that can support evidence-based conservation planning, habitat restoration, and climate adaptation strategies for the long-term persistence of Agathis philippinensis in the Davao Region and other relevant landscapes in the Philippines.
Supplementary Materials
The following supporting information can be downloaded at the website of this paper posted on Preprints.org, Table S1 is available in Supplementary Material 1.
Author Contributions
Conceptualization, J.S.C., L.B.B. and A.G.P.; methodology, J.S.C.; formal analysis and visualization, J.S.C and R.M.A.; writing—original draft preparation, review and editing, L.B.B. and J.S.C. All authors have read and agreed to the published version of the manuscript.
Funding
This research was funded by the Global Environment Facility (GEF) through the Department of Environment and Natural Resources (DENR)–United Nations Development Programme (UNDP) Biodiversity Corridor Project, under the Eastern Mindanao Biodiversity Corridor (EMBC) Clusters 5 and 6 implemented by Davao Oriental State University.
Data Availability Statement
The datasets generated and analyzed during this study are available in the Supplementary Materials. However, their use should be limited to educational purposes, given that the data include occurrence/locality information for Agathis philippinensis, a vulnerable species that may be at risk of illegal resin tapping and habitat disturbance. Any further use of the data should observe applicable conservation, ethical, and data-sharing restrictions.
Acknowledgments
The authors acknowledge the partial support provided by the Davao Oriental State University internal research fund. The authors also extend their sincere appreciation to their colleagues and friends in the academe for their valuable support, and to the Department of Environment and Natural Resources (DENR) for issuing the Gratuitous Permit, which facilitated this study. During the preparation of this manuscript, the authors used ChatGPT and Grammarly to ensure proper writing and grammar. The authors have reviewed and edited the output and take full responsibility for the content of this publication.
Conflicts of Interest
The authors declare no conflicts of interest. The funders had no role in the design of the study; in the collection, analyses, or interpretation of data; in the writing of the manuscript; or in the decision to publish the results.
Abbreviations
The following abbreviations are used in this manuscript:
| Abbreviation | Full Term |
| A. philippinensis | Agathis philippinensis |
| AUC | Area Under the Receiver Operating Characteristic Curve |
| BIO | Bioclimatic variable |
| BIO1-BIO19 | WorldClim bioclimatic variables |
| BIO5 | Maximum Temperature of the Warmest Month |
| DEM | Digital Elevation Model |
| DENR | Department of Environment and Natural Resources |
| DorSU | Davao Oriental State University |
| ELEV | Elevation |
| EMBC | Eastern Mindanao Biodiversity Corridor |
| GBIF | Global Biodiversity Information Facility |
| GEF | Global Environment Facility |
| GIS | Geographic Information System |
| IUCN | International Union for Conservation of Nature |
| MaxEnt | Maximum Entropy |
| PRS | Philippine Reference System |
| ROC | Receiver Operating Characteristic |
| SDM | Species Distribution Modeling |
| SRTM | Shuttle Radar Topography Mission |
| MaxEnt | Maximum Entropy |
| UNDP | United Nations Development Programme |
| UTM | Universal Transverse Mercator |
| VIF | Variance Inflation Factor |
| VU | Vulnerable |
References
- Amoroso, V.B.; Orias, P.J.F.; Taer, E.C.; Montero, Y.P.M. A Review of Philippine Plant Discoveries in the Last 25 Years. J. Nat. Conserv. 2026, 93, 127337. [Google Scholar] [CrossRef]
- Alcala, A.; Alcala, E.; Buot, I., Jr.; Diesmos, A.; Dolar, Ma.L.; Fernando, E.; Gonzalez, J.C.; Tabaranza, B., Jr. Philippine Biodiversity: Ecological Roles, Uses, and Conservation Status. Trans. NAST. PHL 2006, 28, 203–214. [Google Scholar] [CrossRef]
- Myers, N.; Mittermeier, R.A.; Mittermeier, C.G.; Da Fonseca, G.A.B.; Kent, J. Biodiversity Hotspots for Conservation Priorities. Nature 2000, 403, 853–858. [Google Scholar] [CrossRef] [PubMed]
- Posa, M.R.C.; Diesmos, A.C.; Sodhi, N.S.; Brooks, T.M. Hope for Threatened Tropical Biodiversity: Lessons from the Philippines. BioScience 2008, 58, 231–240. [Google Scholar] [CrossRef]
- Wani, A.M.; Sahoo, G. Forest Ecosystem Services and Biodiversity. In Spatial Modeling in Forest Resources Management; Shit, P.K., Pourghasemi, H.R., Das, P., Bhunia, G.S., Eds.; Environmental Science and Engineering; Springer International Publishing: Cham, 2021; pp. 529–552 ISBN 978-3-030-56541-1. ISBN 978-3-030-56541-1.
- Brockerhoff, E.G.; Barbaro, L.; Castagneyrol, B.; Forrester, D.I.; Gardiner, B.; González-Olabarria, J.R.; Lyver, P.O.; Meurisse, N.; Oxbrough, A.; Taki, H.; et al. Forest Biodiversity, Ecosystem Functioning and the Provision of Ecosystem Services. Biodivers. Conserv 2017, 26, 3005–3035. [Google Scholar] [CrossRef]
- Luck, G.W.; Chan, K.M.A.; Fay, J.P. Protecting Ecosystem Services and Biodiversity in the World’s Watersheds. Conserv. Lett. 2009, 2, 179–188. [Google Scholar] [CrossRef]
- Lyu, M.; Xie, J.; Giardina, C.P.; Vadeboncoeur, M.A.; Feng, X.; Wang, M.; Ukonmaanaho, L.; Lin, T.-C.; Kuzyakov, Y.; Yang, Y. Understory Ferns Alter Soil Carbon Chemistry and Increase Carbon Storage during Reforestation with Native Pine on Previously Degraded Sites. Soil Biol. Biochem. 2019, 132, 80–92. [Google Scholar] [CrossRef]
- Ojea, E.; Loureiro, M.L.; Alló, M.; Barrio, M. Ecosystem Services and REDD: Estimating the Benefits of Non-Carbon Services in Worldwide Forests. World Dev. 2016, 78, 246–261. [Google Scholar] [CrossRef]
- Negi, V.S.; Maikhuri, R.K.; Rawat, L.S. Non-Timber Forest Products (NTFPs): A Viable Option for Biodiversity Conservation and Livelihood Enhancement in Central Himalaya. Biodivers. Conserv 2011, 20, 545–559. [Google Scholar] [CrossRef]
- Egoh, B.N.; O’Farrell, P.J.; Charef, A.; Josephine Gurney, L.; Koellner, T.; Nibam Abi, H.; Egoh, M.; Willemen, L. An African Account of Ecosystem Service Provision: Use, Threats and Policy Options for Sustainable Livelihoods. Ecosyst. Serv. 2012, 2, 71–81. [Google Scholar] [CrossRef]
- Bai, Y.; Zhao, J.; Shen, H.; Li, X.; Wen, B. The Evolution of Forest Landscape Connectivity and Ecological Network Construction: A Case Study of Zhejiang’s Ecological Corridors. Sustainability 2024, 16, 5868. [Google Scholar] [CrossRef]
- Zhang, Y.; Luo, Y.; Han, L.; Chen, K.; Wang, Z.; Yang, Q. Importance of Patches in Maintaining Forest Landscape Connectivity: A Case Study of Barluk, Xinjiang, China. Forests 2025, 16, 74. [Google Scholar] [CrossRef]
- Lapin, K.; Oettel, J.; Braun, M.; Konrad, H. (Eds.) Ecological Connectivity of Forest Ecosystems; Springer Nature Switzerland: Cham, 2025; ISBN 978-3-031-82205-6. [Google Scholar]
- Baskent, E.Z.; Borges, J.G.; Kašpar, J. An Updated Review of Spatial Forest Planning: Approaches, Techniques, Challenges, and Future Directions. Curr. For. Rep. 2024, 10, 299–321. [Google Scholar] [CrossRef]
- Vázquez-Benito, J.A.; Burgos-Hernández, M.; López-Mata, L.; Galván-Escobedo, I.G.; Mata-Rosas, M.; Aguirre-Dugua, X. Beyond Protected Areas: Spatial Conservation Priorities for an Endemic and Endangered Orchid Species in Mexico Using Species Distribution Models. Front. Conserv. Sci. 2026, 7, 1777677. [Google Scholar] [CrossRef]
- Wang, H.-H.; Wonkka, C.L.; Treglia, M.L.; Grant, W.E.; Smeins, F.E.; Rogers, W.E. Species Distribution Modelling for Conservation of an Endangered Endemic Orchid. AoB Plants 2015, 7. [Google Scholar] [CrossRef] [PubMed]
- Duarte, G.T.; Ribeiro, M.C.; Paglia, A.P. Ecosystem Services Modeling as a Tool for Defining Priority Areas for Conservation. PLoS ONE 2016, 11, e0154573. [Google Scholar] [CrossRef] [PubMed]
- Berba, C.M.P.; Matias, A.M.A. State of Biodiversity Documentation in the Philippines: Metadata Gaps, Taxonomic Biases, and Spatial Biases in the DNA Barcode Data of Animal and Plant Taxa in the Context of Species Occurrence Data. PeerJ 2022, 10, e13146. [Google Scholar] [CrossRef] [PubMed]
- Mallari, N.A.D.; Collar, N.J.; McGowan, P.J.K.; Marsden, S.J. Philippine Protected Areas Are Not Meeting the Biodiversity Coverage and Management Effectiveness Requirements of Aichi Target 11. Ambio 2016, 45, 313–322. [Google Scholar] [CrossRef] [PubMed]
- Agduma, A.R.; Garcia, F.G.; Cabasan, M.T.; Pimentel, J.; Ele, R.J.; Rubio, M.; Murray, S.; Hilario-Husain, B.A.; Dela Cruz, K.C.; Abdullah, S.; et al. Overview of Priorities, Threats, and Challenges to Biodiversity Conservation in the Southern Philippines. Reg. Sustain. 2023, 4, 203–213. [Google Scholar] [CrossRef]
- Ella, A.B.; Samiano, F.B. Enhancing the Adaptive Capacity of Indigenous Peoples by Promoting Sustainable Resin Tapping of Almaciga (Agathis philippinensis) in Palawan and Sierra Madre, Philippines; 2015. [Google Scholar]
- Razal, R.A.; Jara, A.A.; Samar, G.P.O.; Alomia, R.L.M.; Taghap, K.M.; Agonia, M.R.; Rendon, Ma.D.Dm. Geographical Variations and Correlation among Some Chemical and Thermal Properties of Almaciga (Agathis philippinensis Warb.) Resins from Selected Commercial Sites in the Philippines. Heliyon 2021, 7, e06413. [Google Scholar] [CrossRef] [PubMed]
- Centre for Sustainability PH, Inc.; Forest Foundation Philippines Almaciga Manual: Phenology, Economic Use, Ecology, Collection, Propagation, Reforestation; Forest Foundation Philippines, 2017.
- Daracan, V.; Mendoza, R.; Torres, A.; Jara, A.; Manalo, R.; Batallones, C.H.; Razal, R. Comparison of Agathis Philippinensis Resin Tapping and Collection Practices in Three Selected Sites in the Philippines. Biodiversitas 2020, 21. [Google Scholar] [CrossRef]
- Coritico, F.P.; Amoroso, V.B. Threatened Lycophytes and Ferns in Four Protected Areas of Mindanao, Philippines. Nat. Conserv. Res. 2020, 5. [Google Scholar] [CrossRef]
- Elith, J.; Leathwick, J.R. Species Distribution Models: Ecological Explanation and Prediction Across Space and Time. Annu. Rev. Ecol. Evol. Syst. 2009, 40, 677–697. [Google Scholar] [CrossRef]
- Phillips, S.J.; Anderson, R.P.; Schapire, R.E. Maximum Entropy Modeling of Species Geographic Distributions. Ecol. Model. 2006, 190, 231–259. [Google Scholar] [CrossRef]
- Elith, J.; Phillips, S.J.; Hastie, T.; Dudík, M.; Chee, Y.E.; Yates, C.J. A Statistical Explanation of MaxEnt for Ecologists: Statistical Explanation of MaxEnt. Divers. Distrib. 2011, 17, 43–57. [Google Scholar] [CrossRef]
- Merow, C.; Smith, M.J.; Silander, J.A. A Practical Guide to MaxEnt for Modeling Species’ Distributions: What It Does, and Why Inputs and Settings Matter. Ecography 2013, 36, 1058–1069. [Google Scholar] [CrossRef]
- De Marco, P.; Nóbrega, C.C. Evaluating Collinearity Effects on Species Distribution Models: An Approach Based on Virtual Species Simulation. PLoS ONE 2018, 13, e0202403. [Google Scholar] [CrossRef] [PubMed]
- Naimi, B. On Uncertainty in Species Distribution Modelling; PhD, University of Twente: Enschede, The Netherlands, 2015. [Google Scholar]
- Díaz-Vallejo, M.; Peña-Peniche, A.; Mota-Vargas, C.; Piña-Torres, J.; Valencia-Rodríguez, D.; Rangel-Rivera, C.E.; Gaviria-Hernández, J.; Rojas-Soto, O. Analyses of the Variable Selection Using Correlation Methods: An Approach to the Importance of Statistical Inferences in the Modelling Process. Ecol. Model. 2024, 498, 110893. [Google Scholar] [CrossRef]
- Dormann, C.F.; Elith, J.; Bacher, S.; Buchmann, C.; Carl, G.; Carré, G.; Marquéz, J.R.G.; Gruber, B.; Lafourcade, B.; Leitão, P.J.; et al. Collinearity: A Review of Methods to Deal with It and a Simulation Study Evaluating Their Performance. Ecography 2013, 36, 27–46. [Google Scholar] [CrossRef]
- Santini, L.; Benítez-López, A.; Maiorano, L.; Čengić, M.; Huijbregts, M.A.J. Assessing the Reliability of Species Distribution Projections in Climate Change Research. Divers. Distrib. 2021, 27, 1035–1050. [Google Scholar] [CrossRef]
- Van Steenderen, C.J.M.; Sutton, G.F. Climate Covariate Selection Influences MaxEnt Model Predictions and Predictive Accuracy under Current and Future Climates. Ecol. Model. 2024, 498, 110872. [Google Scholar] [CrossRef]
- Firouzi, H.; Rajaratnam, B.; Hero, A. Predictive Correlation Screening: Application to Two-Stage Predictor Design in High Dimension 2013. [PubMed]
- Gregorich, M.; Strohmaier, S.; Dunkler, D.; Heinze, G. Regression with Highly Correlated Predictors: Variable Omission Is Not the Solution. IJERPH 2021, 18, 4259. [Google Scholar] [CrossRef] [PubMed]
- López-Oriona, Á.; Sun, Y.; Vilar, J.A. Improving the Prediction Accuracy of Statistical Models: A New Hierarchical Clustering Approach. Stat. Comput 2025, 35, 168. [Google Scholar] [CrossRef]
- Kimes, P.K.; Liu, Y.; Hayes, D.N.; Marron, J.S. Statistical Significance for Hierarchical Clustering. Biometrics 2017, 73, 811–821. [Google Scholar] [CrossRef] [PubMed]
- Sebastiani, P.; Perls, T.T. Detection of Significant Groups in Hierarchical Clustering by Resampling. Front. Genet. 2016, 7. [Google Scholar] [CrossRef] [PubMed]
- Pradhan, P. Strengthening MaxEnt Modelling through Screening of Redundant Explanatory Bioclimatic Variables with Variance Inflation Factor Analysis. Researcher 2016, 8, 29. [Google Scholar] [CrossRef]
- Fianchini, M.; Solidoro, C.; Melaku Canu, D. Improving MaxEnt Reliability with Multi-criteria Analysis and Site Weighting: A Case Study on Caulerpa Cylindracea. Ecol. Sol. Evid. 2025, 6, e70074. [Google Scholar] [CrossRef]
- Wynants, L.; Timmerman, D.; Bourne, T.; Van Huffel, S.; Van Calster, B. Screening for Data Clustering in Multicenter Studies: The Residual Intraclass Correlation. BMC Med. Res. Methodol. 2013, 13, 128. [Google Scholar] [CrossRef] [PubMed]
- Philippine Statistics Authority Region XI (Davao Region): Philippine Standard Geographic Code. Available online: https://psa.gov.ph/classification/psgc/provinces/1100000000 (accessed on 24 June 2026).
- Philippine Statistics Authority Region XI (Davao Region): Cities and Municipalities, Philippine Standard Geographic Code. Available online: https://psa.gov.ph/classification/psgc/citimuni/1100000000 (accessed on 24 June 2026).
- Luna, T.W., Jr. Physical Aspects and Natural Resources of the Philippines. Philipp. Rev. Econ. (Online ISSN 2984-8156) 2012, 2. [Google Scholar]
- Cabrera, J.S.; Dumdumaya, C.E. Determination of Future Land Use Changes Using Remote Sensing Imagery and Artificial Neural Network Algorithm: A Case Study of Davao City, Philippines. [CrossRef] [PubMed]
- Ramos, R.L.; Nemenzo-Calica, P.; Antonio, E.S. Elevation-Driven Shifts in Species Diversity, Endemicity, and Vegetation Structure across the Mount Hamiguitan Range Wildlife Sanctuary, a UNESCO World Heritage Site in Davao Oriental, Philippines. DRJ 2026, 17, 60–72. [Google Scholar] [CrossRef]
- GBIF Backbone Taxonomy 2023.
- IUCN Agathis Dammara: Farjon, A.: The IUCN Red List of Threatened Species 2013: E.T202906A2757847 2012.
- Agathis philippinensis Warb. Cat. Life (2026-05-15 XR) 2026. [CrossRef]
- Orwa, C.; Mutua, A.; Kindt, R.; Jamnadass, R.; Anthony, S. Agathis Philippinensis. Agroforestree Database: A Tree Reference and Selection Guide Version 4.0 2009.
- Evangelista, K.P.; Predo, C.; Andrada, R., II; Codilan, A.; Palma-Torres, V.; Amada, L.A.; Calderon, M. Supply Chain Analysis of Almaciga. Agathis Philipp.> Warb.) Resin Gov. Generoso Davao Orient. Philipp. 2022, 11, 13–20. [Google Scholar]
- UNESCO World Herit. Cent. Mt. Hamiguitan Range Wildl. Sanctuary.
- Updated National List of Threatened Philippine Plants and Their Categories 2026.
- Chica, D.P.; Amada, L.A.M.; Calderon, M.M. Technical and Financial Feasibility of Almaciga Plantation.
- GBIF.org Occurrence Download 2026, 4580.
- Degen, F.; Deb, O.; Gu, J.; Yu, J.; Marro, S.; Torr, P.; Yu, J. Plan2Map: A Multimodal Benchmark for Document-Grounded Geospatial Boundary Reconstruction from Planning Records 2026.
- Fick, S.E.; Hijmans, R.J. WorldClim 2: New 1-km Spatial Resolution Climate Surfaces for Global Land Areas. Intl J. Climatol. 2017, 37, 4302–4315. [Google Scholar] [CrossRef]
- Historical Climate Data — WorldClim 1 Documentation.
- Farr, T.G.; Rosen, P.A.; Caro, E.; Crippen, R.; Duren, R.; Hensley, S.; Kobrick, M.; Paller, M.; Rodriguez, E.; Roth, L.; et al. The Shuttle Radar Topography Mission. Rev. Geophys. 2007, 45, 2005RG000183. [Google Scholar] [CrossRef]
- Kim, J.H. Multicollinearity and Misleading Statistical Results. Korean J. Anesthesiol. 2019, 72, 558–569. [Google Scholar] [CrossRef] [PubMed]
- Kyriazos, T.; Poga, M. Dealing with Multicollinearity in Factor Analysis: The Problem, Detections, and Solutions. OJS 2023, 13, 404–424. [Google Scholar] [CrossRef]
- Schober, P.; Boer, C.; Schwarte, L.A. Correlation Coefficients: Appropriate Use and Interpretation. Anesth. Analg. 2018, 126, 1763–1768. [Google Scholar] [CrossRef] [PubMed]
- Zuur, A.F.; Ieno, E.N.; Elphick, C.S. A Protocol for Data Exploration to Avoid Common Statistical Problems: Data Exploration. Methods Ecol. Evol. 2010, 1, 3–14. [Google Scholar] [CrossRef]
- O’brien, R.M. A Caution Regarding Rules of Thumb for Variance Inflation Factors. Qual. Quant. 2007, 41, 673–690. [Google Scholar] [CrossRef]
- Phillips, S.J.; Dudík, M. Modeling of Species Distributions with Maxent: New Extensions and a Comprehensive Evaluation. Ecography 2008, 31, 161–175. [Google Scholar] [CrossRef]
- Cabrera, J.S.; Lee, H.S. Flood Risk Assessment for Davao Oriental in the Philippines Using Geographic Information System-based Multi-criteria Analysis and the Maximum Entropy Model. J. Flood Risk Manag. 2020, 13, e12607. [Google Scholar] [CrossRef]
- Fielding, A.H.; Bell, J.F. A Review of Methods for the Assessment of Prediction Errors in Conservation Presence/Absence Models. Envir. Conserv. 1997, 24, 38–49. [Google Scholar] [CrossRef]
- Swets, J.A. Measuring the Accuracy of Diagnostic Systems. Science 1988, 240, 1285–1293. [Google Scholar] [CrossRef] [PubMed]
- Lobo, J.M.; Jiménez-Valverde, A.; Real, R. AUC: A Misleading Measure of the Performance of Predictive Distribution Models. Glob. Ecol. Biogeogr. 2008, 17, 145–151. [Google Scholar] [CrossRef]
- Peterson, A.T.; Papeş, M.; Soberón, J. Rethinking Receiver Operating Characteristic Analysis Applications in Ecological Niche Modeling. Ecol. Model. 2008, 213, 63–72. [Google Scholar] [CrossRef]
- Liu, C.; Berry, P.M.; Dawson, T.P.; Pearson, R.G. Selecting Thresholds of Occurrence in the Prediction of Species Distributions. Ecography 2005, 28, 385–393. [Google Scholar] [CrossRef]
- Guisan, A.; Thuiller, W. Predicting Species Distribution: Offering More than Simple Habitat Models. Ecol. Lett. 2005, 8, 993–1009. [Google Scholar] [CrossRef] [PubMed]
- Guisan, A.; Tingley, R.; Baumgartner, J.B.; Naujokaitis-Lewis, I.; Sutcliffe, P.R.; Tulloch, A.I.T.; Regan, T.J.; Brotons, L.; McDonald-Madden, E.; Mantyka-Pringle, C.; et al. Predicting Species Distributions for Conservation Decisions. Ecol. Lett. 2013, 16, 1424–1435. [Google Scholar] [CrossRef] [PubMed]
- Jongkind, C.C.H. Agathis philippinensis Warb. In Plant Resources of South-East Asia No. 5(1): Timber trees; Major commercial timbers; Soerianegara, I., Lemmens, R.H.M.J., Eds.; PROSEA Foundation: Bogor, Indonesia, 1993.
- Körner, C. The Use of ‘Altitude’ in Ecological Research. Trends Ecol. Evol. 2007, 22, 569–574. [Google Scholar] [CrossRef] [PubMed]
Figure 1.
Study Area with the corresponding survey records of Almaciga.
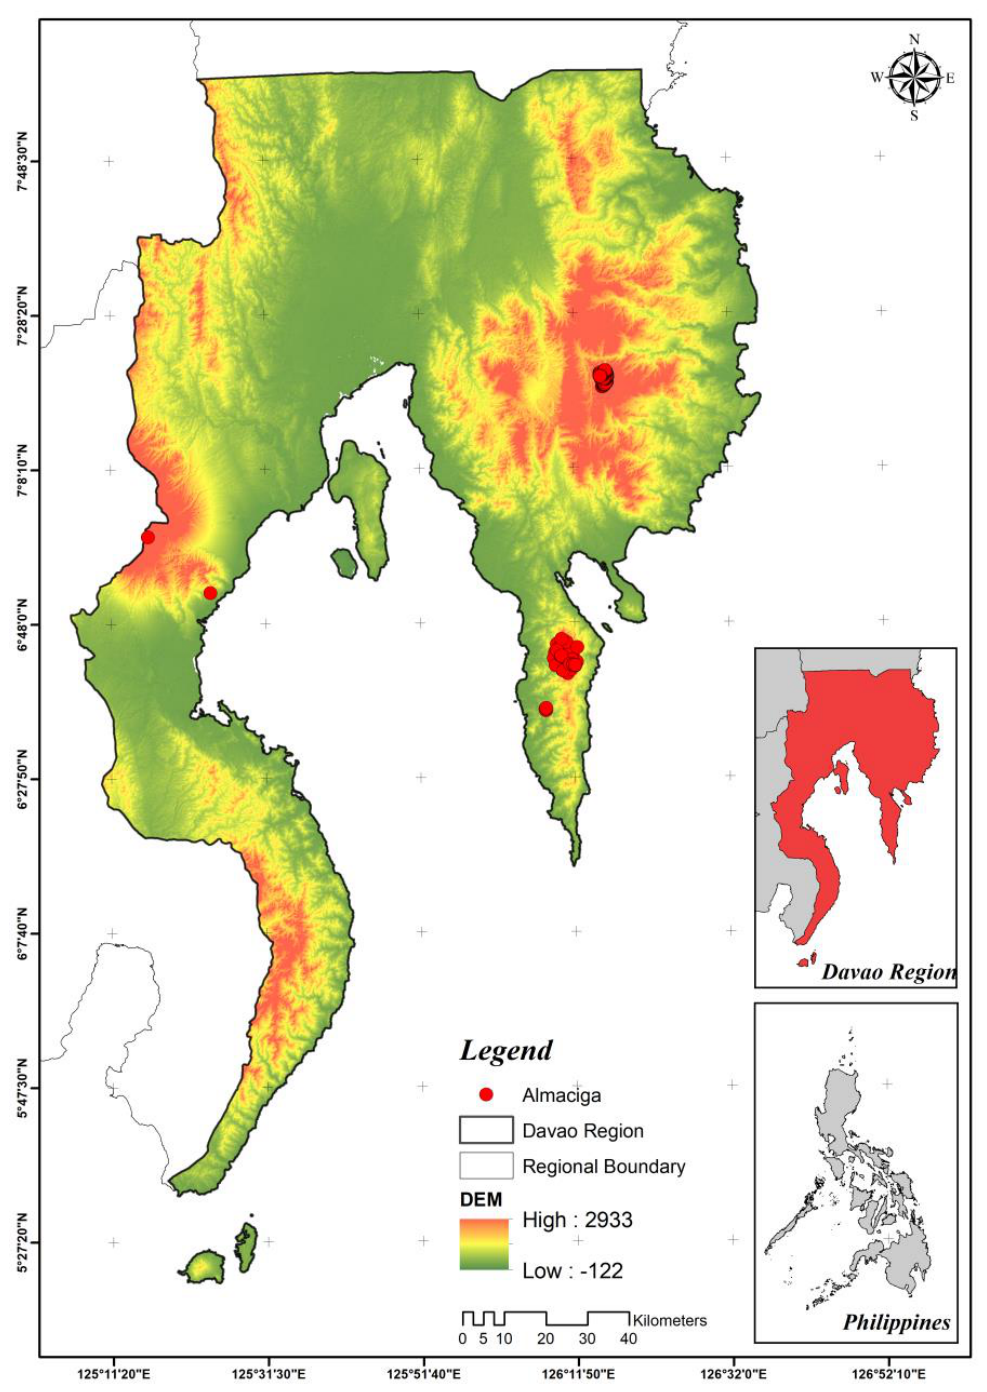
Figure 2.
Pearson correlation heatmap showing the relationships among the 20 environmental variables used in habitat suitability modeling of Agathis philippinensis.
Figure 2.
Pearson correlation heatmap showing the relationships among the 20 environmental variables used in habitat suitability modeling of Agathis philippinensis.
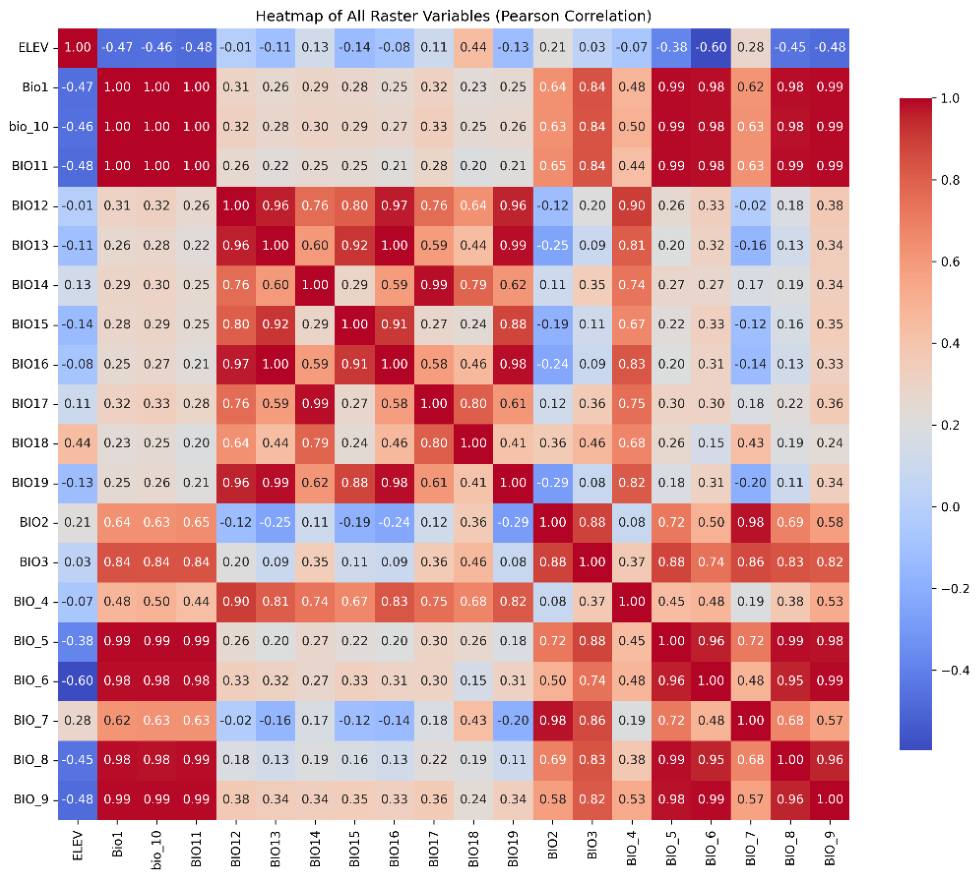
Figure 3.
Hierarchical clustering dendrogram of environmental variables using a correlation threshold of |r| > 0.70. Variables grouped within the same cluster exhibit high correlation and potential redundancy.
Figure 3.
Hierarchical clustering dendrogram of environmental variables using a correlation threshold of |r| > 0.70. Variables grouped within the same cluster exhibit high correlation and potential redundancy.
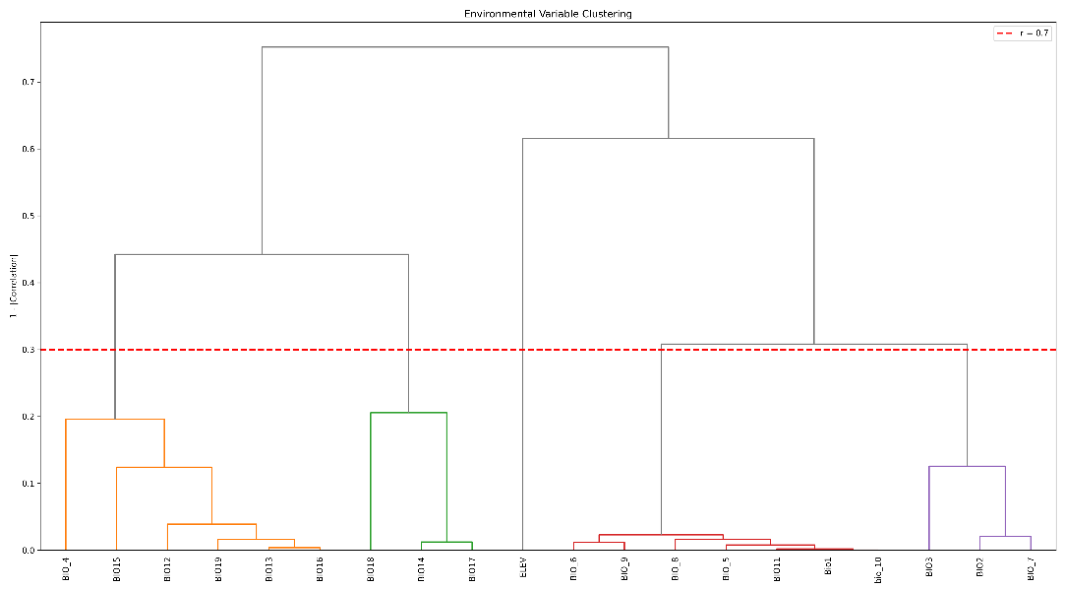
Figure 4.
a) MaxEnt model evaluation for Agathis philippinensis: (a) jackknife of regularized training gain, (b) jackknife of test gain, (c) jackknife of AUC, and (d) receiver operating characteristic curve showing training AUC = 0.990 and test AUC = 0.988.
Figure 4.
a) MaxEnt model evaluation for Agathis philippinensis: (a) jackknife of regularized training gain, (b) jackknife of test gain, (c) jackknife of AUC, and (d) receiver operating characteristic curve showing training AUC = 0.990 and test AUC = 0.988.
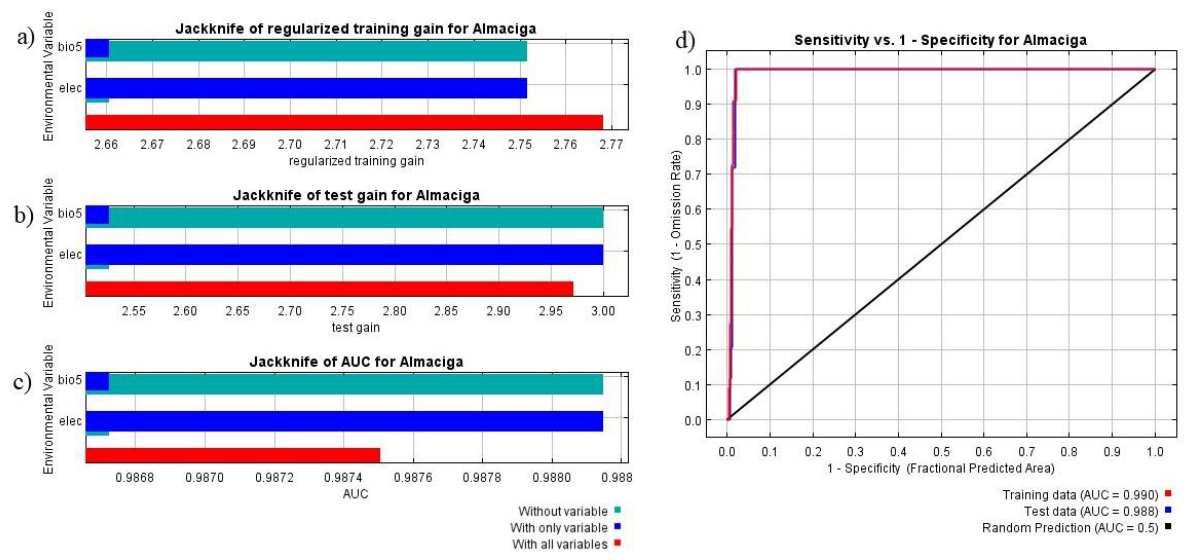
Figure 5.
Response curves showing the relationship between habitat suitability and environmental predictors. LEFT: The response of Almaciga to elevation. Right: The response of Almaciga to BIO5.
Figure 5.
Response curves showing the relationship between habitat suitability and environmental predictors. LEFT: The response of Almaciga to elevation. Right: The response of Almaciga to BIO5.
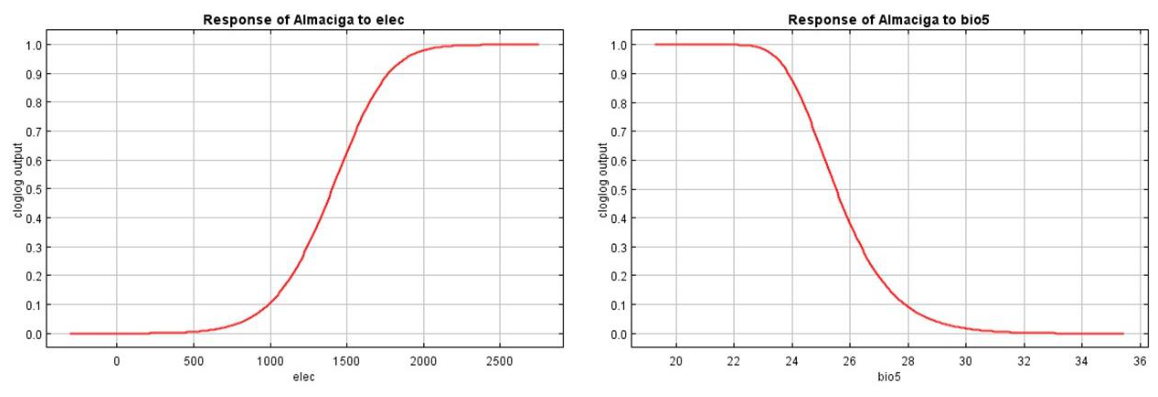
Figure 6.
Habitat suitability map of Agathis philippinensis in the Davao Region generated using the MaxEnt species distribution model. Suitability values were classified into five categories: unsuitable (0.0–0.2), low (0.2–0.4), moderate (0.4–0.6), high (0.6–0.8), and very high (0.8–1.0). High and very high suitability areas were concentrated in mountainous landscapes at higher elevations and under cooler climatic conditions.
Figure 6.
Habitat suitability map of Agathis philippinensis in the Davao Region generated using the MaxEnt species distribution model. Suitability values were classified into five categories: unsuitable (0.0–0.2), low (0.2–0.4), moderate (0.4–0.6), high (0.6–0.8), and very high (0.8–1.0). High and very high suitability areas were concentrated in mountainous landscapes at higher elevations and under cooler climatic conditions.
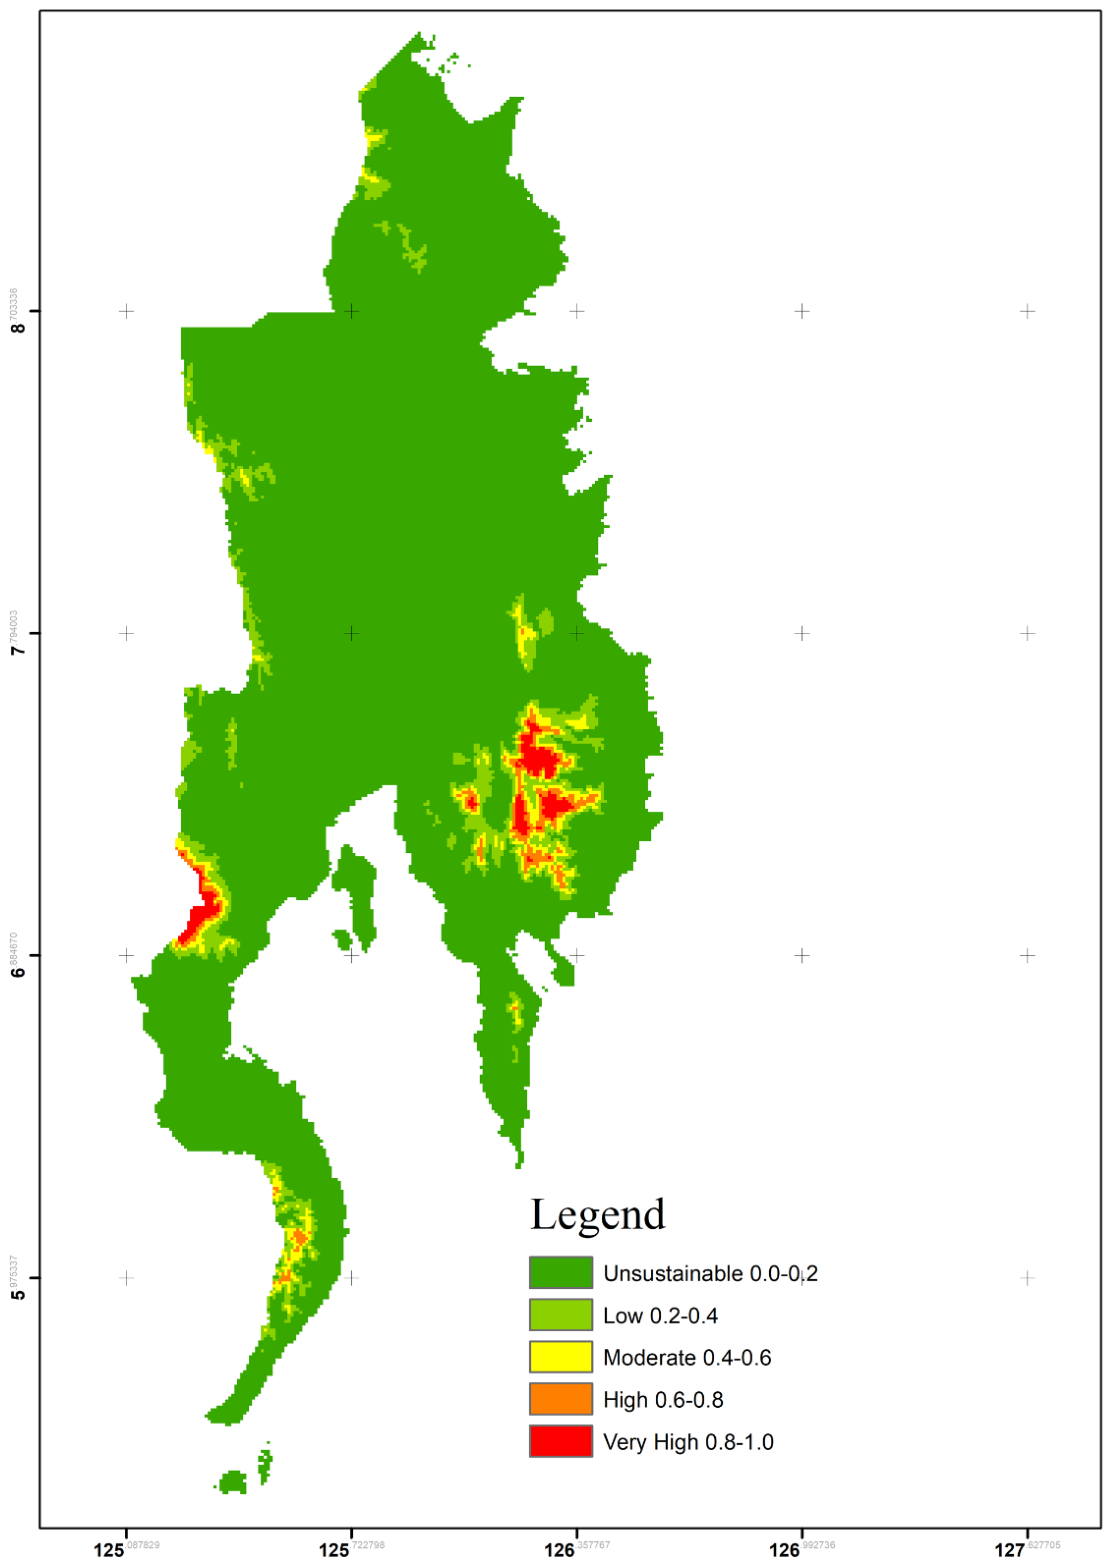

Table 1.
Bioclimatic Variables from WorldClim Used in the Study.
| Code | BIOCLIM Variable | Description / Meaning |
| BIO1 | Annual Mean Temperature | Mean temperature across the year |
| BIO2 | Mean Diurnal Range | Mean of the monthly maximum temperature minus the minimum temperature |
| BIO3 | Isothermality | BIO2 divided by BIO7 × 100 |
| BIO4 | Temperature Seasonality | Variation in temperature across the year |
| BIO5 | Maximum Temperature of Warmest Month | Highest monthly maximum temperature |
| BIO6 | Minimum Temperature of Coldest Month | Lowest monthly minimum temperature |
| BIO7 | Temperature Annual Range | BIO5 minus BIO6 |
| BIO8 | Mean Temperature of Wettest Quarter | Mean temperature during the wettest 3-month period |
| BIO9 | Mean Temperature of Driest Quarter | Mean temperature during the driest 3-month period |
| BIO10 | Mean Temperature of Warmest Quarter | Mean temperature during the warmest 3-month period |
| BIO11 | Mean Temperature of Coldest Quarter | Mean temperature during the coldest 3-month period |
| BIO12 | Annual Precipitation | Total precipitation across the year |
| BIO13 | Precipitation of Wettest Month | Highest monthly precipitation |
| BIO14 | Precipitation of Driest Month | Lowest monthly precipitation |
| BIO15 | Precipitation Seasonality | Variation in precipitation across the year |
| BIO16 | Precipitation of the Wettest Quarter | Total precipitation during the wettest 3-month period |
| BIO17 | Precipitation of the Driest Quarter | Total precipitation during the driest 3-month period |
| BIO18 | Precipitation of Warmest Quarter | Total precipitation during the warmest 3-month period |
| BIO19 | Precipitation of Coldest Quarter | Total precipitation during the coldest 3-month period |
Table 2.
Interpretation of Pearson Correlation Coefficients for Environmental Variable Selection.
| Absolute Correlation Coefficient (|r|) | Interpretation | Action |
| < 0.70 | Acceptable correlation | Retain both variables |
| 0.70–0.79 | High correlation | Candidate for removal |
| 0.80–0.89 | Very high correlation | Remove one variable based on ecological relevance |
| ≥ 0.90 | Severe multicollinearity | Remove one variable immediately |
Table 3.
Classification of Area Under the Receiver Operating Characteristic Curve (AUC) values used for model evaluation.
Table 3.
Classification of Area Under the Receiver Operating Characteristic Curve (AUC) values used for model evaluation.
| AUC Value | Interpretation |
| 0.50-0.60 | Poor |
| 0.60-0.70 | Fair |
| 0.70-0.80 | Good |
| 0.80-0.90 | Very Good |
| >0.90 | Excellent |
Table 4.
Habitat suitability classification used for the MaxEnt model outputs.
| Suitability Class | Suitability Value |
| Unsuitable | 0.0-0.2 |
| Low | 0.2-0.4 |
| Moderate | 0.4-0.6 |
| High | 0.6-0.8 |
| Very High | 0.8-1.0 |
Table 5.
Environmental variable clusters derived from hierarchical clustering (|r| > 0.70).
| Cluster | Variables | Representative |
| 1 | BIO4, BIO12, BIO13, BIO15, BIO16, BIO19 | BIO13 |
| 2 | BIO14, BIO17, BIO18 | BIO18 |
| 3 | BIO1, BIO5, BIO6, BIO8, BIO9, BIO10, BIO11 | BIO5 |
| 4 | BIO2, BIO3, BIO7 | BIO3 |
| 5 | ELEV | ELEV |
Table 6.
Final variables retained after VIF analysis. .
| Variable | Description | VIF |
| BIO5 | Maximum Temperature of the Warmest Month | 1.731 |
| ELEV | Elevation | 1.731 |
Table 7.
Relative contributions of the environmental variables. .
| Variable | Percent Contribution | Permutation Importance |
| ELEV | 90.5 | 93.2 |
| BIO5 | 9.5 | 6.2 |
Table 8.
Suitability results from the MaxEnt model map. .
| Class | Area (km²) | Percentage (%) |
| Unsuitable | 28,774.50 | 89.75 |
| Low | 1,801.02 | 5.62 |
| Moderate | 731.88 | 2.28 |
| High | 421.15 | 1.31 |
| Very High | 331.27 | 1.03 |
Disclaimer/Publisher’s Note: The statements, opinions and data contained in all publications are solely those of the individual author(s) and contributor(s) and not of MDPI and/or the editor(s). MDPI and/or the editor(s) disclaim responsibility for any injury to people or property resulting from any ideas, methods, instructions or products referred to in the content. |
© 2026 by the authors. Licensee MDPI, Basel, Switzerland. This article is an open access article distributed under the terms and conditions of the Creative Commons Attribution (CC BY) license (http://creativecommons.org/licenses/by/4.0/).
Copyright: This open access article is published under a Creative Commons CC BY 4.0 license, which permit the free download, distribution, and reuse, provided that the author and preprint are cited in any reuse.