
Submitted:
30 June 2026
Posted:
01 July 2026
You are already at the latest version
Abstract
Underground water hazards are among the most serious concealed threats to safe coal mine production, yet their accurate spatial localization remains challenging when relying on a single geophysical method. This study proposes a joint detection framework integrating the magnetotelluric (MT) method and the microtremor survey method (MSM), and applies it to the Shaping Coal Mine in Lianyuan City, Hunan Province, China. The MT method was used to image the resistivity structure of water-bearing bodies at depths of 50–500 m, while the MSM delineated the shear-wave velocity structure of shallow-to-middle strata (0–300 m). A comprehensive identification criterion based on the spatial superposition of "low resistivity + low velocity" anomalies was established. The MT results identified three key low-resistivity water-bearing structures within the coal-bearing Ceshui Formation, while the MSM revealed low-velocity anomalies associated with the Coal Seam No. 5 goaf and fault fracture zones. The two methods formed an effective overlapping detection zone at depths of 100–300 m, with anomalies distributed above the mined-out area and near the Sifangqiao reverse fault, showing strong correspondence with documented water seepage. Cross-validation between the two methods improved the identification accuracy of middle-deep water hazards to over 85%, providing reliable geophysical evidence for coal mine water hazard prevention and control.
Keywords:
coal mine water hazards
; magnetotelluric method
; microtremor survey method
; joint geophysical interpretation
; goaf
; fault fracture zone
; Ceshui Formation
1. Introduction
Underground water hazards constitute one of the most severe concealed disasters threatening safe production in coal mines [1,2,3]. In China, water-related mine accidents are characterized by high frequency, concealed spatial distribution, and sudden onset, and can readily evolve into catastrophic water inrush or mine flooding events if not properly managed [4]. Hunan Province, with a long history of mineral exploitation, contains numerous abandoned mines whose acidic, heavy-metal-enriched drainage imposes severe pressure on the surrounding ecosystems [5,6]. Due to historical reasons, many closed mines lack systematic geological and hydrogeological records, leaving the spatial distribution of goaf areas and water-conducting pathways poorly constrained [7]. Consequently, conventional geological investigation techniques are often inadequate for accurately identifying concealed water hazard elements, making advanced geophysical detection indispensable [8].
Significant progress has been made in the geophysical detection of mine water hazards in recent years. Among electromagnetic methods, the transient electromagnetic method (TEM) has been widely applied owing to its sensitivity to low-resistivity bodies and operational efficiency [9]. Zhang et al. [10] investigated TEM response characteristics of double-layered goafs with varying interlayer spacing. Sun et al. [11] proposed a multi-source excitation TEM approach to enhance signal quality, while Xue et al. [12] revealed variations in sandstone water abundance under mining disturbance through TEM monitoring. For North China-type coalfields, where Ordovician carbonate aquifers pose severe floor water inrush risks [13], Zeng et al. [14] systematically summarized disaster mechanisms and prevention strategies. The wide-field electromagnetic method has also been successfully applied to delineate water-rich zones in the Xinyuan Coal Mine [15,16].
Recent research has further focused on multi-parameter joint detection and intelligent inversion. Liu et al. [17] proposed a deep-learning-based noise attenuation approach for controlled-source electromagnetic data, substantially improving inversion accuracy. In the seismic domain, microtremor survey methods (MSM) have emerged as promising passive-source techniques, offering strong anti-interference capability without requiring active seismic sources [18]. Zhao et al. [19] integrated MSM with high-density electrical resistivity methods for karst collapse detection, markedly improving anomaly identification. Li et al. [20] developed constrained joint inversion frameworks for water-bearing structure prediction, demonstrating the value of multi-method integration.
Despite these advances, existing studies exhibit two notable limitations. First, a single geophysical method struggles to fully characterize complex hydrogeological structures, particularly when both electrical and mechanical properties of the subsurface require simultaneous assessment. Second, well-established integrated interpretation frameworks that combine electromagnetic and seismic methods for coal mine water hazard identification remain scarce. To address these gaps, this study takes the Shaping Coal Mine in Lianyuan City, Hunan Province, as a case study and applies a joint detection scheme combining the magnetotelluric (MT) method and the microtremor survey method (MSM). The MT method retrieves the resistivity structure and provides strong sensitivity to water-bearing structures at intermediate depths of 50–500 m, while the MSM inverts for shear-wave velocity structures and is highly sensitive to fractured zones at shallow depths. This study adopts a "co-located observation—independent inversion— integrated interpretation" workflow, enhancing the reliability of water hazard identification through spatial superposition analysis of resistivity and shear-wave velocity anomalies. The main contributions of this work are: (i) establishing a "low resistivity + low velocity" comprehensive identification criterion tailored for southern China coalfields; (ii) validating the joint detection framework through cross-verification with borehole and seepage records; and (iii) providing a transferable methodological framework for water hazard prevention in geologically complex coal mining areas.
2. Study Area and Geophysical Background
2.1. Geological Setting
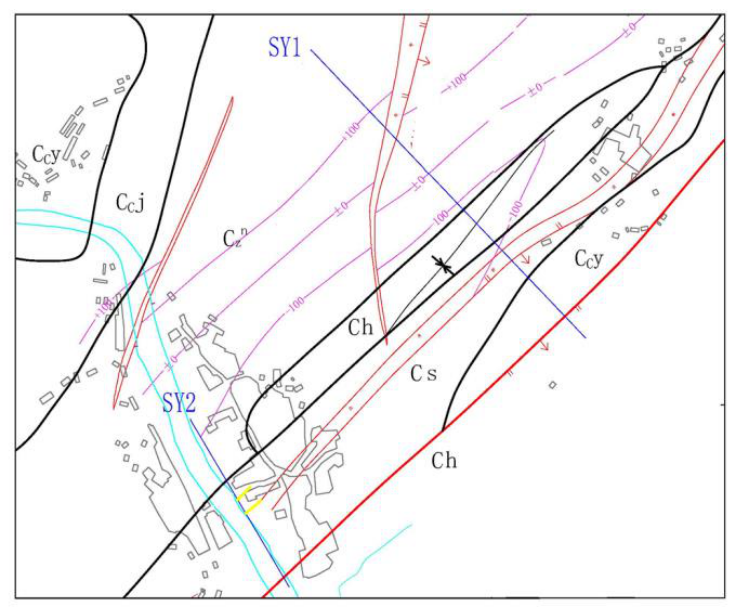
The study area is located in the Shaping Coal Mine, Meijiang Town, Lianyuan City, Hunan Province. The geomorphology is classified as a low-mountain hilly terrain, with an overall topography characterized by elevated flanks and a depressed central zone, where a narrow densely populated residential area is situated. The major rivers in the area exhibit a rust-brown coloration due to prolonged influence of mine drainage, indicating severe acid mine drainage (AMD) contamination. Structurally, the study area exhibits a monoclinal configuration, with strata generally dipping from northwest to southeast. The coal seams are primarily hosted in the lower member of the Carboniferous Ceshui Formation.
The stratigraphic sequence of the study area, from bottom to top, is as follows: the Lower Carboniferous Shidengzi Formation (C₁s), composed of dark gray calcareous mudstone and marlstone containing calcite veins and faunal fossils; the Ceshui Formation (C₁c), subdivided into a coal-bearing member (C₁c¹), 70–100 m thick, containing Coal Seams No. 2, 3, 5, and 6 (with No. 5 being the principal mineable seam), and a non-coal-bearing member (C₁c²), 80–150 m thick, consisting of interbedded mudstone, sandy mudstone, fine-grained sandstone, and quartz sandstone; the Zimenqiao Formation (C₁z), 120–230 m thick, predominantly comprising gray to dark gray argillaceous limestone; the Hutian Group (C₂₊₃), mainly composed of limestone with only localized outcrops; and the Quaternary (Q), generally approximately 5 m thick, consisting primarily of alluvial and colluvial deposits.
The principal structure in the area is the Shaping Syncline, approximately 6000 m in length and 1100 m in width, with an axial orientation of NE 27°. The core of the syncline is occupied by the Hutian Group limestone, while the limbs comprise the Ceshui and Zimenqiao Formations. The Sifangqiao Reverse Fault is the major fault in the area, striking NE 40°, dipping northwest at approximately 75°, causing a vertical displacement of up to 75 m in Coal Seam No. 5. The complex geological structures provide favorable conduits and storage spaces for groundwater migration and accumulation.
Figure 1.
Location map of the study area.
2.2. Geophysical Characteristics
The electrical resistivity parameters of the formations in the study area exhibit pronounced contrasts. The Quaternary unconsolidated sediments have resistivities of 10–200 Ω·m; the Carboniferous limestone ranges from 400 to 5000 Ω·m and the marlstone from 400 to 1000 Ω·m; the coal-bearing strata of the Ceshui Formation, enriched in carbonaceous material, exhibit resistivities of only 10–30 Ω·m; and groundwater bodies display the lowest resistivities (5–20 Ω·m). When goaf areas and fault zones are water-saturated, the resistivity can decrease by one to two orders of magnitude, yielding resistivity contrasts of 10:1 to 100:1 between the host rock and water-bearing structures, which provides a robust physical basis for MT detection.
Elastic wave velocities also exhibit significant differentiation (Table 1). The shear-wave (S-wave) velocity of the Zimenqiao Formation marlstone ranges from 2.5 to 2.8 km/s, that of the Ceshui Formation sandstone from 1.3 to 2.3 km/s, and the coal seams display the lowest values (0.4–0.8 km/s). In goaf areas, the rock mass undergoes roof collapse and water-induced softening, resulting in reduced skeletal rigidity and correspondingly lower S-wave velocities. It should be noted that S-waves cannot propagate through fluids; therefore, the reduction in S-wave velocity primarily reflects the degree of rock mass fracturing rather than the water content itself. Resistivity is sensitive to water saturation, while S-wave velocity is sensitive to rock mass integrity. These two physical parameters characterize subsurface media properties from complementary perspectives, thereby providing a sound basis for integrated detection.

Table 2.
Wave velocity of different lithologies in the study area.
| Formation | Lithology | Typical thickness (m) |
Common velocity range (km·s-1) |
Average velocity (km·s-1) |
|---|---|---|---|---|
| Lower Carboniferous Zimenqiao Fm. (C1z) | Marlstone | 90 | 4.5~5 | 4.7 |
| Mudstone, sandy mudstone | 23 | 1.3~4.0 | 2.8 | |
| Fine-grained sandstone, quartz sandstone | 15 | 2.4~4.2 | 3.4 | |
| Argillaceous limestone | 6 | 2.0~4.4 | 3.3 | |
| Fine-grained sandstone, quartz sandstone | 20 | 2.4~4.2 | 3.4 | |
| Sandy mudstone | 20 | 1.3~4.0 | 2.4 | |
| Quartz sand(gravel)stone | 10 | 2.4~4.2 | 3.2 | |
| Non-coal-bearing member of Ceshui Fm.(C1c2) | Sandy mudstone | 10 | 1.3~4.0 | 2.5 |
| Quartz sandstone | 8 | 2.4~4.2 | 2.8 | |
| Coal Seam No. 3 | 0.7 | 0.8~1.5 | 1.2 | |
| Argillaceous siltstone | 7 | 1.3~4.0 | 2.8 | |
| Quartz sandstone | 13 | 2.4~4.2 | 3.4 | |
| Coal-bearing member of Ceshui Fm. (C1c1) | Coal Seam No. 5 | 1.10 | 0.8~1.5 | 1.1 |
| Sandy mudstone | 12 | 1.3~4.0 | 2.3 | |
| Fine-grained sandstone | 4 | 2.4~4.2 | 3.0 | |
| Silty mudstone | 13 | 1.3~4.0 | 2.5 | |
| Fine-grained sandstone | 14 | 2.4~4.2 | 3.0 |
3. Materials and Methods
3.1. Magnetotelluric Method
The magnetotelluric (MT) method is a geophysical technique used to characterize the subsurface resistivity structure (Ogawa et al., 2014; Moorkamp et al., 2019; Li et al., 2025). This method investigates the underground resistivity distribution by measuring naturally occurring low-frequency electromagnetic field variations at the surface (Chave and Jones, 2012). At each MT station, two electric field components ( and ) and three magnetic field components ( and ) are recorded, where the x, y, and z directions correspond to geographic north, east, and vertically downward (with the positive z-axis directed downward), respectively. In the frequency domain, the orthogonal components of the horizontal electric and magnetic fields satisfy a linear relationship through the complex impedance tensor, which can be expressed as follows:
The impedance tensor carries information about the subsurface resistivity structure and is therefore dependent on the station location as well as the frequency f (in Hz). In data interpretation, the impedance tensor can be further expressed in terms of apparent resistivity and phase (Chave and Jones, 2012). Additionally, it can be represented as a phase tensor, which is immune to the distortion effects caused by near-surface local resistivity heterogeneities (Caldwell et al., 2004):
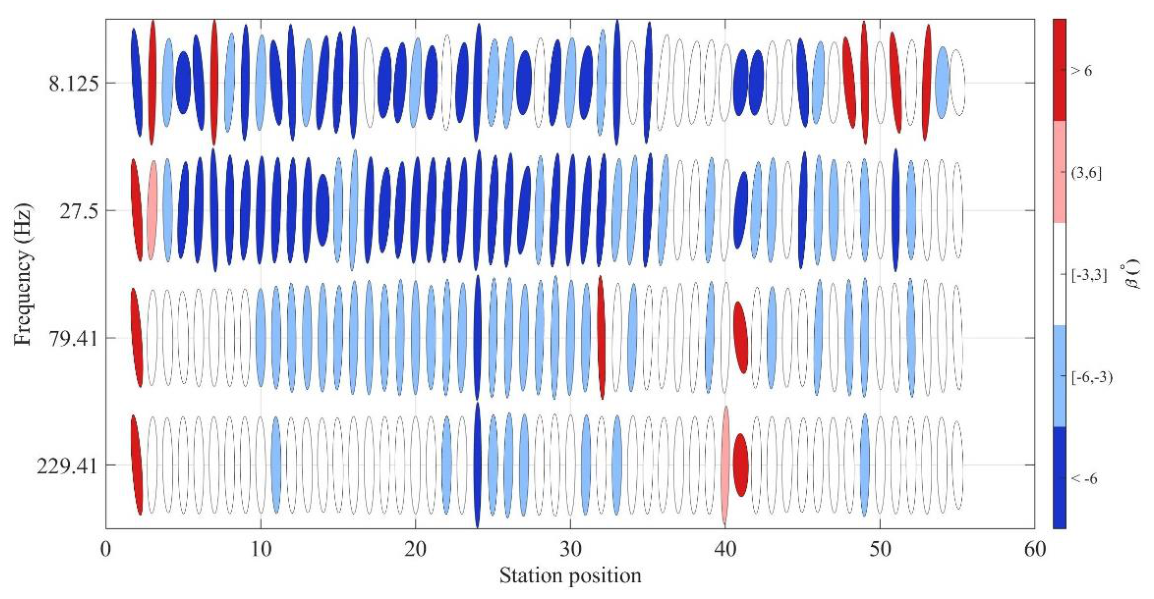
where X and Y denote the real and imaginary parts of the impedance tensor Z, respectively. The skew angle of the phase tensor, commonly denoted as β, is defined as:
According to phase tensor analysis theory, when the phase tensor ellipse approximates a circle, the corresponding subsurface electrical structure exhibits predominantly 1D characteristics. When the phase tensor manifests as an ellipse with the skew angle falling within the range of [−3°, 3°], the underlying electrical structure is indicative of strong 2D characteristics. Otherwise, 3D features are considered to be significant. Accordingly, as illustrated in Figure X, taking frequencies of 8.125, 27.5, 79.41, and 229.41 Hz as examples, the subsurface electrical structure of the study area is predominantly characterized by 2D and 3D features.
Figure 2.
Phase tensor analysis of regional magnetotelluric data.
Meanwhile, the inverse problem can be mathematically formulated by minimizing an objective function (Kelbert et al., 2014; Li et al., 2025), expressed as:
where m denotes the model parameter vector, m₀ represents the prior model, d is the observed data vector, F(m) corresponds to the model response vector, Cd denotes the data covariance matrix with diagonal elements representing data variances, Cm is the model covariance matrix used to impose structural constraints, λ represents the regularization parameter in the inversion, and T denotes the transpose operator. By taking the first-order partial derivative of Equation (1) with respect to the model parameters, the gradient vector is obtained as:
where J is the Jacobian or sensitivity matrix, representing the first-order partial derivatives of the forward response. By applying an affine transformation to the model parameters (Egbert and Kelbert, 2012; Kelbert et al., 2014), such as , Equation (2) can be simplified to:
This transformation avoids the inversion of C_m at each iteration, thereby providing greater flexibility in defining the model covariance. Kelbert et al. (2008) demonstrated that this transformation yields effects comparable to the preconditioning treatments employed in earlier inversion methods (Newman and Alumbaugh, 2000; Rodi and Mackie, 2001) without incurring additional computational overhead. In this study, the nonlinear conjugate gradient (NLCG) inversion method is employed to minimize Equation (3).
The NLCG method is adopted in this study to solve the inverse problem, and the flowchart of the inversion algorithm is presented in Figure 3. As illustrated, the procedure requires iterative completion of the forward problem and its adjoint problem, model updating, and determination of the search direction until convergence is achieved. Each complete inversion iteration incorporates an internal line search process. During this line search, the model undergoes two trial updates to determine the optimal step length before the model is formally updated. A more detailed discussion of the NLCG method can be found in the relevant literature (Rodi and Mackie, 2001).
3.2. Microtremor Survey Method
The MT field data were acquired along a survey line oriented in the NW–SE direction, perpendicular to the dominant structural strike of the study area. The survey line extends 1000 m in length with a station spacing of 20 m, comprising a total of 51 stations.
Given the densely populated residential area in the central part of the study area and the associated severe anthropogenic electromagnetic interference, data acquisition was primarily conducted during nighttime, with a minimum recording duration of 30 minutes per station to ensure the acquisition of sufficient low-frequency information. The acquisition frequency range spans from 5 Hz to 8192 Hz, fully covering the target detection depth of 50–500 m, and satisfying the requirements for detecting the coal-bearing strata of the Ceshui Formation and deep water-conducting structures.
Data processing comprised three principal steps: (1) time-series preprocessing, in which Robust processing techniques were applied to suppress power-line interference and enhance raw data quality; (2) nonlinear conjugate gradient (NLCG) inversion, with the initial model set as a 100 Ω·m homogeneous half-space. After 50 iterations, the root-mean-square (RMS) misfit was reduced to 1.23, yielding a reliable subsurface resistivity structure. The inversion parameters are summarized in Table 3.
3.3. Data Acquisition
The microtremor survey was conducted with a station spacing of 10 m along a survey line of 2000 m in length, with a recording duration of 30 minutes per station, targeting goaf areas at depths of 0–300 m. Three-component geophones were employed to record ambient ground vibration signals at a sampling rate of 200 Hz, with three repeated observations at each station. The data processing workflow consisted of the following steps: (1) preprocessing, including detrending and 0.1–50 Hz bandpass filtering to enhance the signal-to-noise ratio; (2) application of the spatial autocorrelation (SPAC) method to compute correlation coefficients between different station pairs and extract the fundamental-mode Rayleigh wave phase velocities within the 5–50 Hz frequency band; and (3) S-wave velocity inversion based on a genetic algorithm, incorporating Q-value constraints to improve the identification of low-velocity interlayers, ultimately yielding the shear-wave velocity structure from the surface to a depth of 300 m.
To ensure the effectiveness of the microtremor survey under the complex geological conditions of the Shaping Coal Mine, a systematic feasibility experiment was conducted above the goaf area of Coal Seam No. 5. For optimal recording duration determination, two observation durations of 2 hours and 4 hours were compared. At the same station, continuous data were recorded for 4 hours and subsequently divided into time windows, with the first 2-hour subset and the complete 4-hour dataset independently processed for dispersion curve extraction and inversion. The results demonstrated that the dispersion curves extracted from the 2-hour data exhibited correlation coefficients exceeding 0.95 with those from the 4-hour data within the principal frequency band of 5–30 Hz. The inverted S-wave velocity profiles showed velocity discrepancies of less than 5% within the critical depth interval of 50–200 m. Both datasets consistently identified the goaf area of Coal Seam No. 5 (at approximately 180 m depth), exhibiting low-velocity anomalies of 0.8–1.0 km/s. Accordingly, 2 hours was determined as the optimal recording duration (Figure 3).
Temporal stability validation was performed through comparative observations during daytime (08:00–10:00 and 14:00–16:00) and nighttime (22:00–24:00 and 02:00–04:00). Power spectral density analysis revealed that the primary energy of the microtremor signals was concentrated within the 1–20 Hz frequency band, with spectral shapes remaining essentially consistent across different time periods. Only a marginal increase of 3–5 dB was observed during daytime relative to nighttime in the high-frequency band above 10 Hz. This discrepancy exerted minimal influence on the inversion results, with the relative errors of S-wave velocity models obtained from different time periods remaining below 3% within a depth of 200 m, indicating that data acquisition can be flexibly scheduled (Figure 4).
Quality Factor Q-Value Constrained Inversion Method: The coal-bearing strata of the Ceshui Formation in the study area exhibit pronounced velocity inversion phenomena. Conventional genetic algorithm inversion is prone to "missing" low-velocity layers or yielding inaccurate velocity estimates. In this study, a quality factor (Q-value) constraint is incorporated into the inversion process, implemented as follows:
Q-value constraint mechanism: A Q-value constraint term is introduced into the objective function of the genetic algorithm, yielding a total objective function expressed as:
where the first term represents the dispersion curve fitting error, the second term denotes the Q-value constraint, and λ is the weighting factor. When the Q-value of the inverted model exceeds the prescribed range, the penalty term increases, thereby suppressing the emergence of physically unreasonable solutions.
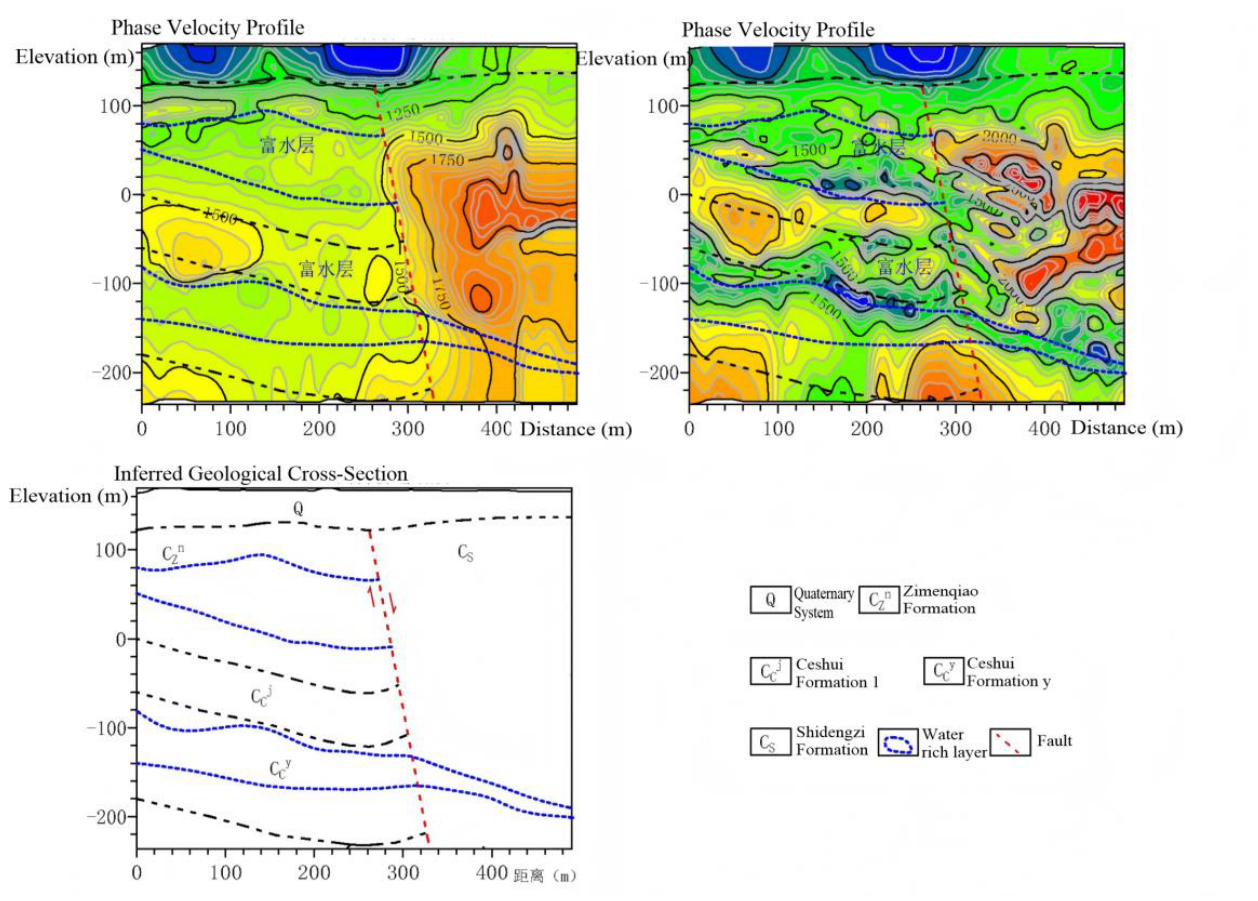
To enhance inversion accuracy, the Q-value constraint ranges for each layer were prescribed based on empirical lithological values: Quaternary unconsolidated sediments Q = 10–30, coal seams Q = 20–50, sandstone and mudstone Q = 50–100, and limestone Q = 100–200. Comparative analysis demonstrates that the Q-value constraint effectively prevents the phenomenon of low-velocity coal seams being "absorbed" by adjacent high-velocity layers by restricting the velocity–depth search space. As illustrated in the upper panel of Figure 4, the phase–shear-wave velocity profile with Q-value constraints applied exhibits a markedly clearer delineation of the velocity structure within the coal-bearing interval, with significantly improved resolution of layer boundaries. In contrast, as shown in the lower panel of Figure 5, the inversion results without Q-value constraints display indistinct low-velocity signatures of the coal seams that are easily confused with the surrounding rocks, thereby validating the effectiveness of the Q-value constraint in enhancing inversion resolution.
4. Results
4.1. Geological Interpretation
The MT data were processed using one-dimensional Occam inversion to construct a two-dimensional resistivity profile, obtaining a smooth resistivity structure through minimization of the roughness functional. The inversion results reveal distinct electrical stratification characteristics: the Quaternary overburden exhibits resistivities of 10–50 Ω·m; the Zimenqiao Formation marlstone displays high-resistivity signatures (200–500 Ω·m); the coal-bearing strata of the Ceshui Formation yield resistivities of 30–80 Ω·m; water-filled goaf areas show significantly reduced resistivities of 10–30 Ω·m, forming prominent low-resistivity anomalies; and fault fracture zones manifest as banded low-resistivity anomalies (20–60 Ω·m). Calibrated against borehole core observations from three existing boreholes (18–22 m), the fracture zone widths are inferred to be 15–25 m with an uncertainty of ±3 m.
The microtremor data were processed by extracting fundamental-mode Rayleigh wave dispersion curves within the 5–50 Hz frequency band, followed by genetic algorithm inversion to obtain the S-wave velocity structure, with quality factor (Q-value) constraints incorporated to improve the identification of low-velocity interlayers. The inversion results reveal a well-defined velocity stratification: the shallow Quaternary deposits exhibit S-wave velocities of 200–400 m/s; the intact rock mass of the Zimenqiao Formation displays velocities of 800–1200 m/s; the coal-bearing strata of the Ceshui Formation yield velocities of 400–700 m/s; and goaf areas and fracture zones show significantly reduced velocities of 250–500 m/s.
Based on the spatial superposition extent of low-resistivity and low-velocity anomalies, integrated with existing geological data from the mining area, the water-filled goaf area of Coal Seam No. 5 is estimated at approximately 9.6 × 10⁴ m². The water volume estimation is based on the following calculation: average water depth = goaf formation porosity (laboratory-measured value of 15%) × water saturation (80%, derived from existing pumping test data in the mining area) × geophysically inferred goaf thickness (5 m). Accordingly, the estimated water accumulation volume in the goaf area is approximately 5.76 × 10⁴ m³.
4.2. Integrated Interpretation
This study adopts a technical workflow of "co-located observation–independent inversion–integrated interpretation," with comprehensive identification based on the following criteria: (1) Water-filled goaf areas: simultaneously satisfying both low-resistivity and low-velocity characteristics, where the spatial superposition of dual anomalies significantly enhances identification reliability; (2) Fault structures: synchronous displacement of resistivity and S-wave velocity contours, with fracture zones exhibiting banded low-resistivity and low-velocity anomalies; (3) Aquiclude integrity: laterally continuous high-resistivity and high-velocity signatures.
Profile MJSY1 reveals coupled low-resistivity (30–80 Ω·m) and low-velocity (300–500 m/s) anomalies within the horizontal distance of 0–750 m and elevation range of −140 to −200 m, with a spatial coincidence exceeding 85%, corresponding to the water-filled goaf areas of Coal Seams K7 and K8 (Figure 5). Synchronous SSdisplacements of contour lines are observed at horizontal distances of 280 m and 720 m along the profile, corresponding to the Lishuqiao and Sifangqiao reverse faults, respectively, with dip angles of 75° ± 5° and fracture zone widths of 15–25 m. These zones exhibit low-resistivity and low-velocity characteristics, serving as water-conducting pathways.
Profile MJSY2 reveals a three-layer "high–low–high" structure within the Zimenqiao Formation (Figure 6): the upper low-velocity layer (400–600 m/s) corresponds to a karst development zone; the lower high-velocity layer (>1000 m/s) exhibits good lateral continuity, indicating favorable aquiclude performance. A low-velocity anomaly (250–450 m/s) delineated within the horizontal distance of 0–350 m and elevation range of −80 to −140 m defines the water-rich goaf area of Coal Seam No. 5. The velocity displacement at 260 m on profile MJSY2 corresponds to the same fault identified at 720 m on profile MJSY1, thereby confirming structural continuity.
Figure 6.
Interpretation results of profile MJSY1. Phase velocity profile; (b) Apparent shear-wave velocity profile; (c) Resistivity profile; (d) Geological inference profile.
Figure 6.
Interpretation results of profile MJSY1. Phase velocity profile; (b) Apparent shear-wave velocity profile; (c) Resistivity profile; (d) Geological inference profile.
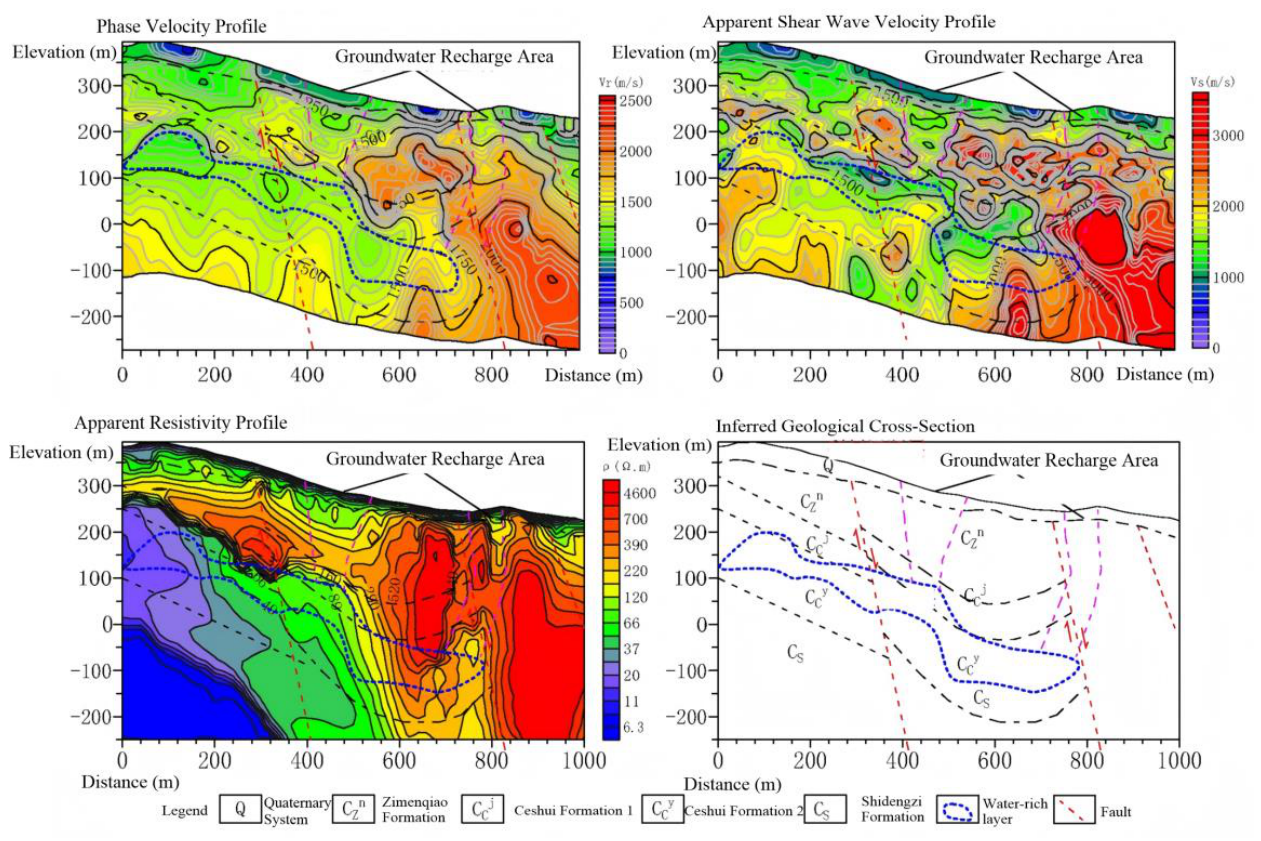
Figure 7.
Interpretation results of profile MJSY2. Phase velocity profile; (b) Apparent shear-wave velocity profile; (c) Geological inference profile.
Figure 7.
Interpretation results of profile MJSY2. Phase velocity profile; (b) Apparent shear-wave velocity profile; (c) Geological inference profile.
The integrated detection yields the following findings: (1) Precise delineation of water-rich goaf areas: the area delineated by profile MJSY1 is approximately 7.5 × 10⁴ m², and that by profile MJSY2 is approximately 2.1 × 10⁴ m², with a total estimated water accumulation volume of approximately 1.5 × 10⁵ m³; (2) Identification of water-conducting structures: the positional error of the two reverse faults is less than 10 m, and their low-resistivity and low-velocity characteristics indicate strong water conductivity; (3) Aquiclude evaluation: the lower portion of the Zimenqiao Formation exhibits continuous high-resistivity >300Ω·m and high-velocity (>1000 m/s) characteristics with a thickness of 80–120 m, effectively impeding hydraulic connectivity between the upper and lower aquifers.
To validate the reliability of the detection results, the tunnel seepage records from the mining area were compared with the detected anomalous zones. The results demonstrate that the principal seepage points documented in the tunnels are all located within the low-resistivity and low-velocity anomalous zones delineated in this study. The seasonal water inrush points are generally consistent with the inferred fault locations, and the spatial correspondence between seepage points and geophysical anomalies is favorable, thereby validating the accuracy of the joint detection results.
5. Discussion
5.1. Effectiveness of the Joint MT–MSM Detection Framework
The results confirm that the joint MT–MSM framework effectively identifies coal mine water hazards through three complementary mechanisms. Physically, the MT method responds to pore-fluid conductivity and is sensitive to water saturation, while the MSM responds to rock-skeleton shear modulus and is sensitive to fracturing. A water-filled goaf simultaneously produces low-resistivity and low-velocity anomalies—dual signatures unlikely to be generated by any non-water geological body. Spatially, the two methods overlap in the 100–300 m depth window, precisely where the principal goaf areas and coal seams occur in the Shaping Coal Mine, enabling mutual cross-validation with an IoU exceeding 0.85. Interpretively, the "AND-gate" logic of requiring co-located anomalies suppresses the ambiguity inherent in single-parameter interpretation: low resistivity alone cannot distinguish water from carbonaceous shale, and low velocity alone cannot distinguish water-filled from drained fractures. Field validation against documented roadway seepage points further confirms the framework's reliability, with positional errors below 10 m for the identified fault structures.
5.2. Comparison with Previous Studies
Compared with single electromagnetic methods (TEM, CSAMT) [9,10,11,14,15], which are widely applied in North China-type coalfields, the present framework resolves a critical limitation: the resistivity ambiguity between water-filled goafs and carbonaceous coal-bearing strata—both exhibiting 10–30 Ω·m in the Ceshui Formation. The addition of an independent mechanical parameter (S-wave velocity) explicitly breaks this ambiguity. Conversely, MSM alone [18,19] reveals only rock-mass fracturing, not water occupation, since S-waves cannot propagate through fluids; the MT component supplies the missing water-saturation evidence. Compared with formal cross-gradient joint inversion approaches [17,20], the proposed "co-located observation–independent inversion–integrated interpretation" workflow offers a more practical and transferable alternative that avoids the heavy computational demands of rigorous joint inversion, making it directly adoptable by mine safety teams. Furthermore, most existing studies focus on North China floor-water-inrush hazards [13,14], whereas the present work extends integrated geophysical detection to a southern China Carboniferous coalfield setting, broadening the geographic and stratigraphic applicability of the approach.
5.3. Limitations and Uncertainties
Several limitations should be acknowledged. First, the framework performs integrated interpretation rather than rigorous joint inversion, and therefore does not exploit the cross-parameter constraints available from cross-gradient techniques. Second, the reported 85% accuracy is conditioned on the available borehole and seepage records, which cover only a fraction of the survey area; the metric should be interpreted as a lower bound for zones with validation coverage. Third, the effective detection window is constrained to 100–300 m: hazards deeper than 500 m require supplementary methods such as CSAMT or seismic reflection, due to reduced skin-depth sensitivity (MT) and insufficient low-frequency energy (MSM). Fourth, the 2D MT inversion assumes along-line two-dimensionality; although phase tensor analysis confirmed dominant 2D features, local 3D effects near fault intersections may introduce imaging artifacts. Finally, residual anthropogenic EM interference from the densely populated central study area may locally degrade high-frequency MT data, suggesting that remote-reference MT techniques could benefit future surveys.
5.4. Implications for Coal Mine Water Hazard Prevention
The framework provides direct operational guidance for mine water hazard management. Based on the delineated anomalies, three targeted measures are recommended: (i) controlled drainage of the delineated goaf water accumulations (estimated at 1.5 × 10⁵ m³) to reduce hydraulic driving forces; (ii) grouting to seal the identified water-conducting zones of the Lishuqiao and Sifangqiao reverse faults, with fracture widths of 15–25 m; and (iii) establishment of a long-term geophysical monitoring network to track dynamic changes during active mining. This enables a transition from reactive water hazard response to proactive, geophysically informed risk mitigation. Because the framework requires only standard MT and microtremor instrumentation—without active seismic sources—it is particularly well-suited for abandoned mine investigations and for the many southern China coalfields sharing the Shaping Coal Mine's geological features: Carboniferous coal-bearing strata, complex syncline–thrust structures, and incomplete historical records.
6. Conclusions
This study proposes and validates a joint MT–MSM detection framework for identifying underground water hazards in coal mines, using the Shaping Coal Mine as a case study. The main conclusions are as follows:
(1) The joint scheme leverages complementary sensitivities: MT delineates water-bearing structures through low-resistivity anomalies, while MSM reflects rock-mass fracturing through low-velocity anomalies. The "low-resistivity + low-velocity" spatial superposition criterion, quantified by the IoU metric, improves the identification accuracy of middle-deep water hazards to over 85%.
(2) An effective overlapping detection zone is established within the depth range of 100–300 m, where MT and MSM cross-validate each other. MT demonstrates advantages in middle-to-deep detection (50–500 m), while MSM offers superior resolution in the shallow subsurface (0–300 m). Three key water-rich goaf areas and two major water-conducting faults (the Lishuqiao and Sifangqiao reverse faults) were successfully identified.
(3) Systematic comparison with borehole data and documented seepage records validates the reliability of the framework, demonstrating its transferability to other coal mining areas with similar geological settings. Future work will focus on rigorous cross-gradient joint inversion to achieve coupled physical-parameter imaging, and on extending the framework to three-dimensional detection scenarios.
7. Patents
Not applicable.
Supplementary Materials
The following supporting information can be downloaded at: Preprints.org, Figure S1: Convergence curve of the NLCG inversion for MT data; Figure S2: Dispersion curve fitting results for representative microtremor stations; Figure S3: Power spectral density analysis of microtremor signals during daytime and nighttime; Table S1: Detailed survey station coordinates and elevation data; Table S2: Borehole lithology records used for validation.
Author Contributions
Conceptualization, Z.L.; methodology, Z.L.; software, J.L. and J.X.; validation, J.Z., C.Y. and Y.Y.; formal analysis, Z.L.; investigation, Z.L., J.Z. and J.X.; resources, J.H.; data curation, Z.L. and J.X.; writing—original draft preparation, Z.L.; writing—review and editing, J.H. and J.L.; visualization, Z.L. and Y.Y.; supervision, J.H.; project administration, J.H.; funding acquisition, J.H. All authors have read and agreed to the published version of the manuscript.
Funding
This research was funded by the Key Technology Research Project on Mine Water Pollution Prevention and Control in Abandoned Mines of Hunan Province, grant number HNGSTP202204. The APC was funded by the same project.
Institutional Review Board Statement
Not applicable.
Informed Consent Statement
Not applicable.
Data Availability Statement
The magnetotelluric and microtremor survey data presented in this study are available on request from the corresponding author. The data are not publicly available due to institutional confidentiality policies concerning mining-area geophysical investigations and coal mine safety considerations.
Acknowledgments
The authors gratefully acknowledge the management and technical staff of the Shaping Coal Mine for their assistance during field data acquisition. We also thank the Hunan Institute of Geophysics and Geochemistry for providing the instrumentation and logistical support. The authors are grateful to the anonymous reviewers and the editors for their constructive comments that helped improve the quality of this manuscript.
Conflicts of Interest
The authors declare no conflicts of interest. The funders had no role in the design of the study; in the collection, analyses, or interpretation of data; in the writing of the manuscript; or in the decision to publish the results.
Abbreviations
The following abbreviations are used in this manuscript:
| MDPI | Multidisciplinary Digital Publishing Institute |
| DOAJ | Directory of open access journals |
| TLA | Three letter acronym |
| LD | Linear dichroism |
References
- Ogawa, Y.; Ichiki, M.; Kanda, W.; Mishina, M.; Asamori, K. Three-dimensional magnetotelluric imaging of crustal fluids and seismicity around Naruko volcano, NE Japan. Earth Plan. Space 2014, 66, 158. [Google Scholar] [CrossRef]
- Moorkamp, M.; Fishwick, S.; Walker, R.J.; Jones, A.G. Geophysical evidence for crustal and mantle weak zones controlling intra-plate seismicity—The 2017 Botswana earthquake sequence. Earth Planet. Sci. Lett. 2019, 506, 175–183. [Google Scholar] [CrossRef]
- Egbert, G.D.; Kelbert, A. Computational recipes for electromagnetic inverse problems. Geophys. J. Int. 2012, 189, 251–267. [Google Scholar] [CrossRef]
- Kelbert, A.; Egbert, G.D.; Schultz, A. Non-linear conjugate gradient inversion for global EM induction: resolution studies. Geophys. J. Int. 2008, 173, 365–381. [Google Scholar] [CrossRef]
- Kelbert, A.; Meqbel, N.; Egbert, G.D.; Tandon, K. ModEM: A modular system for inversion of electromagnetic geophysical data. Comput. Geosci. 2014, 66, 40–53. [Google Scholar] [CrossRef]
- Newman, G.A.; Alumbaugh, D.L. Three-dimensional magnetotelluric inversion using nonlinear conjugate gradients. Geophys. J. Int. 2000, 140, 410–424. [Google Scholar] [CrossRef]
- Rodi, W.; Mackie, R.L. Nonlinear conjugate gradient algorithm for 2D magnetotelluric inversion. Geophysics 2001, 66, 174–187. [Google Scholar] [CrossRef]
- Li, S.C.; Song, J.; Zhang, J.Q.; Liu, B.; Liu, R.C.; Nie, L.C.; Zhao, Y.; Xie, X.W. A new comprehensive geological prediction method based on constrained inversion and integrated interpretation for water-bearing tunnel structures. Eur. J. Environ. Civ. Eng. 2016, 20, 1–25. [Google Scholar] [CrossRef]
- Su, B.Y.; Zhang, J.Q.; Tang, Y.; Wang, X.; Liu, J.; Li, R. Geological disaster detection in underground mining tunnels using a new electromagnetic method: Theoretical modeling and experimental evaluation. J. Appl. Geophys. 2025, 233, 105641. [Google Scholar] [CrossRef]
- Liu, Y.C.; Li, D.Q.; Li, J.; Chen, C.; Wang, Z.; Zhang, B. Controlled-source electromagnetic noise attenuation via a deep convolutional neural network and high-quality sounding curve screening mechanism. Geophysics 2025, 90, WA125–WA140. [Google Scholar] [CrossRef]
- Ma, F.W.; Li, Y.; Su, H.R.; Zhang, Y.; Wang, X. Risk assessment of concealed disaster-causing factors in coal mines of the Zhunnan Mining Area. China Min. Mag. 2024, 33, 217–223. (In Chinese) [Google Scholar]
- Wang, L.F.; Meng, H.; Liu, K.P. Identification and hazard analysis of concealed disaster-causing factors of water hazards in coal mines. Coal Technol. 2024, 43, 179–182. (In Chinese) [Google Scholar]
- Zeng, Y.F.; Wu, Q.; Zhao, S.Q.; Hu, H.; Liu, S.; Zhang, X. Characteristics, causes, and countermeasures of water hazard accidents in China's coal mines. Coal Sci. Technol. 2023, 51, 1–14. (In Chinese) [Google Scholar]
- Yang, Y.J.; Xu, Q.; Zhu, L.F. Analysis of pollution characteristics of acid mine drainage from closed coal mines in Hunan Province. Jiangxi Coal Sci. Technol. 2024, 4, 201–203. (In Chinese) [Google Scholar]
- Zhou, Z.X.; Yong, X.J. Analysis of concealed disaster-causing factors of water hazards in Changji Baoping Coal Mine. Shaanxi Coal 2023, 42, 174–177+190. (In Chinese) [Google Scholar]
- Nie, Z.Q.; Zhou, K.; Pan, Q.Y. Analysis of common concealed disaster-causing factors and their exploration technologies in coal mines. Miner. Explor. 2020, 11, 2573–2579. (In Chinese) [Google Scholar]
- Xue, G.Q.; Li, H.; Chen, W.Y.; Zhou, N.N.; Guo, W.B. Research progress of transient electromagnetic detection technology for. [PubMed]
- water-bearing bodies in coal mines. J. China Coal Soc. 2021, 46, 77–85. (In Chinese)
- Zhang, F.; Feng, G.R.; Qi, T.Y.; Guo, J.; Wang, Z.H.; Kang, L.X. Feasibility study on transient electromagnetic method for detecting double-layered water-filled goaf areas with different interlayer spacing in coal mines. Geophys. Geochem. Explor. 2023, 47, 1215–1225. (In Chinese) [Google Scholar]
- Sun, H.C.; Wang, W.Z.; Li, Z.Z.; Yang, Z.; Jiang, F. Application of multi-source excitation transient electromagnetic detection. [PubMed]
- method in coal mine goaf areas. Geophys. Geochem. Explor. 2022, 46, 1306–1314. (In Chinese)
- Xue, H.J.; Du, L.; Cui, J.W.; Wang, C.; Zhang, S.M. Variation patterns of Luohe Formation sandstone water abundance under coal seam mining in Yonglong Mining Area: Evidence from transient electromagnetic monitoring. J. Eng. Geophys. 2025, 22, 623–631. (In Chinese) [Google Scholar]
- Zeng, Y.F.; Zhu, H.C.; Wu, Q.; Liu, S.Q.; Hu, H.; Wang, X. Disaster-causing mechanisms and prevention-oriented prospects for different categories of coal seam floor water hazards in China. J. China Coal Soc. 2025, 50, 1073–1099. (In Chinese) [Google Scholar]
- He, J.S. New research progress in theory and application of wide field electromagnetic method. Geophys. Geochem. Explor. 2020, 44, 985–990. (In Chinese) [Google Scholar]
- Li, D.Q.; Wang, Z.L.; Liu, Z.J.; Zhao, Z.H.; Zhang, H.X. Refined detection of water-rich zones in Xinyuan Coal Mine using the. [PubMed]
- wide-field electromagnetic method. Prog. Geophys. 2024, 39, 174–182. (In Chinese)
- Xiong, Y.L.; Gao, J.H.; Peng, J. Research and application of ambient noise surface wave method on barrier dam. J. Eng. Geophys. 2022, 19, 149–154. (In Chinese) [Google Scholar]
- Zhao, R.C.; Zhang, Z.; Lü, Y.Z.; Wang, J.; Song, H. Joint application of microtremor and high-density electrical resistivity methods in karst collapse detection. J. Eng. Geophys. 2025, 22, 328–337. (In Chinese) [Google Scholar]
- Zhao, Y.S. Joint application of high-density electrical resistivity method and equal-flux transient electromagnetic method in refined detection of karst collapse in Fasi area. J. Eng. Geophys. 2022, 19, 348–355. (In Chinese) [Google Scholar]
- Li, H.Y.; Xia, M.Z.; Zhang, K.; Chen, W.; Liu, J.H. Treatment technology for high-volume water inrush in karst depression-type open-pit mines. Coal Sci. Technol. 2024, 52, 267–279. (In Chinese) [Google Scholar]
- Yu, C.; Wang, Z.; Tang, M. Application of microtremor survey technology in a coal mine goaf. Appl. Sci. 2023, 13, 466. [Google Scholar]
- https. [CrossRef]
- Long, J.; Liu, J.; Zhang, S.; Li, M. Comprehensive evaluation of goaf range in a coal mine with a complex terrain through CSAMT and an activated-carbon method for radon measurement. Appl. Sci. 2023, 13, 4274. [Google Scholar] [CrossRef]
- Zhang, Y.; Xie, B.; Wu, X. Utilizing a transient electromagnetic inversion method with lateral constraints in the goaf of Xiaolong Coal Mine, Xinjiang. Appl. Sci. 2025, 15, 8571. [Google Scholar] [CrossRef]
- Jin, C.; Lin, S.; Wang, J.; Zhou, H.; Cheng, M. Estimation of shallow shear velocity structure in a site with weak interlayer based on microtremor array. Appl. Sci. 2023, 13, 185. [Google Scholar] [CrossRef]
- Wang, K.; Ge, X.; Ning, J.; Li, J.; Zhao, X. Integrated mine geophysics for identifying zones of geological instability. Appl. Sci. 2026, 16, 3303. [Google Scholar] [CrossRef]
Figure 3.
Analysis of data acquisition duration effectiveness for microtremor survey.
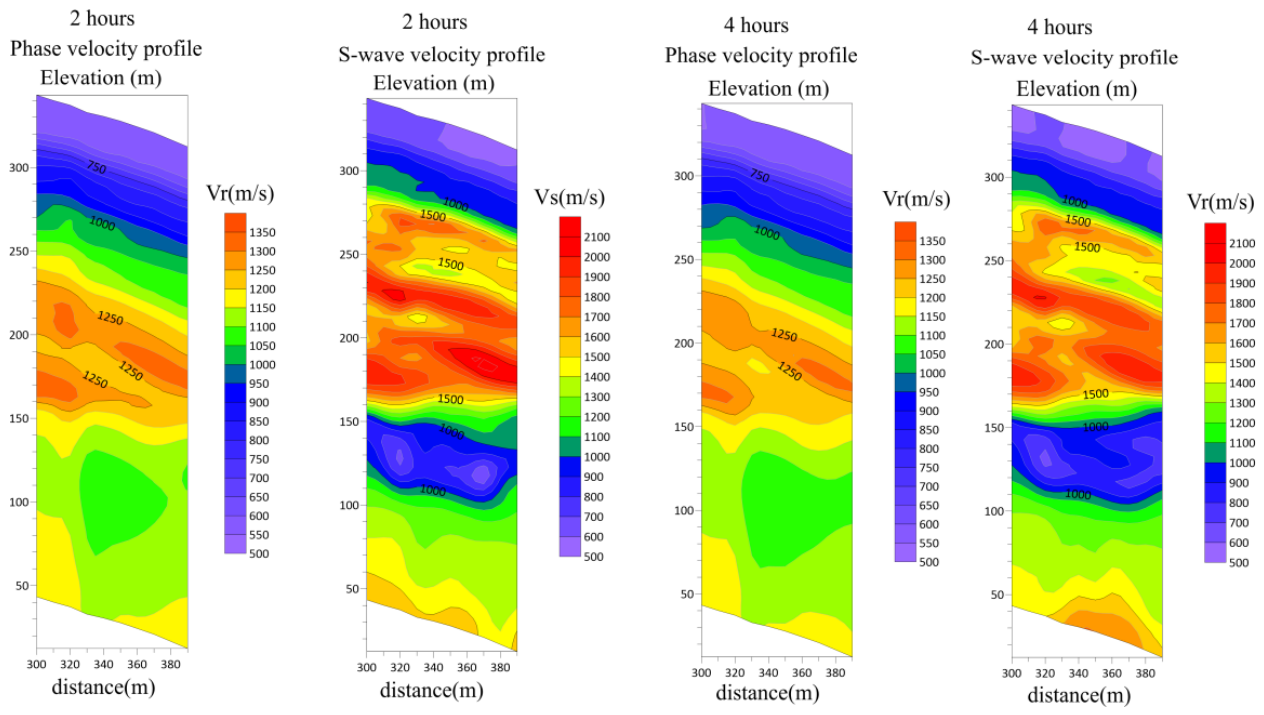
Figure 4.
Comparative experiment of different time periods for microtremor survey.
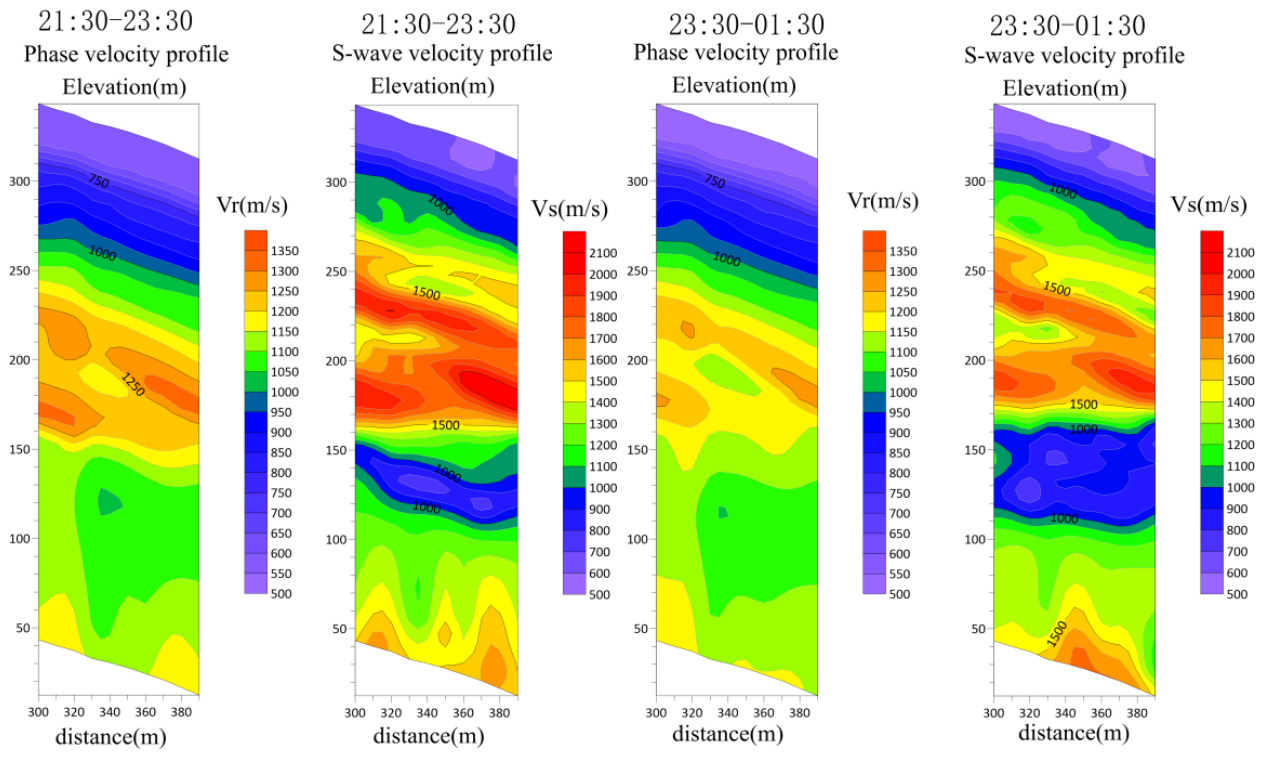
Figure 5.
Influence of quality factor Q on inversion results. (a) Phase velocity profile (with Q-value constraint); (b) Apparent shear-wave velocity profile (with Q-value constraint); (c) Phase velocity profile (without Q-value constraint); (d) Apparent shear-wave velocity profile (without Q-value constraint).
Figure 5.
Influence of quality factor Q on inversion results. (a) Phase velocity profile (with Q-value constraint); (b) Apparent shear-wave velocity profile (with Q-value constraint); (c) Phase velocity profile (without Q-value constraint); (d) Apparent shear-wave velocity profile (without Q-value constraint).
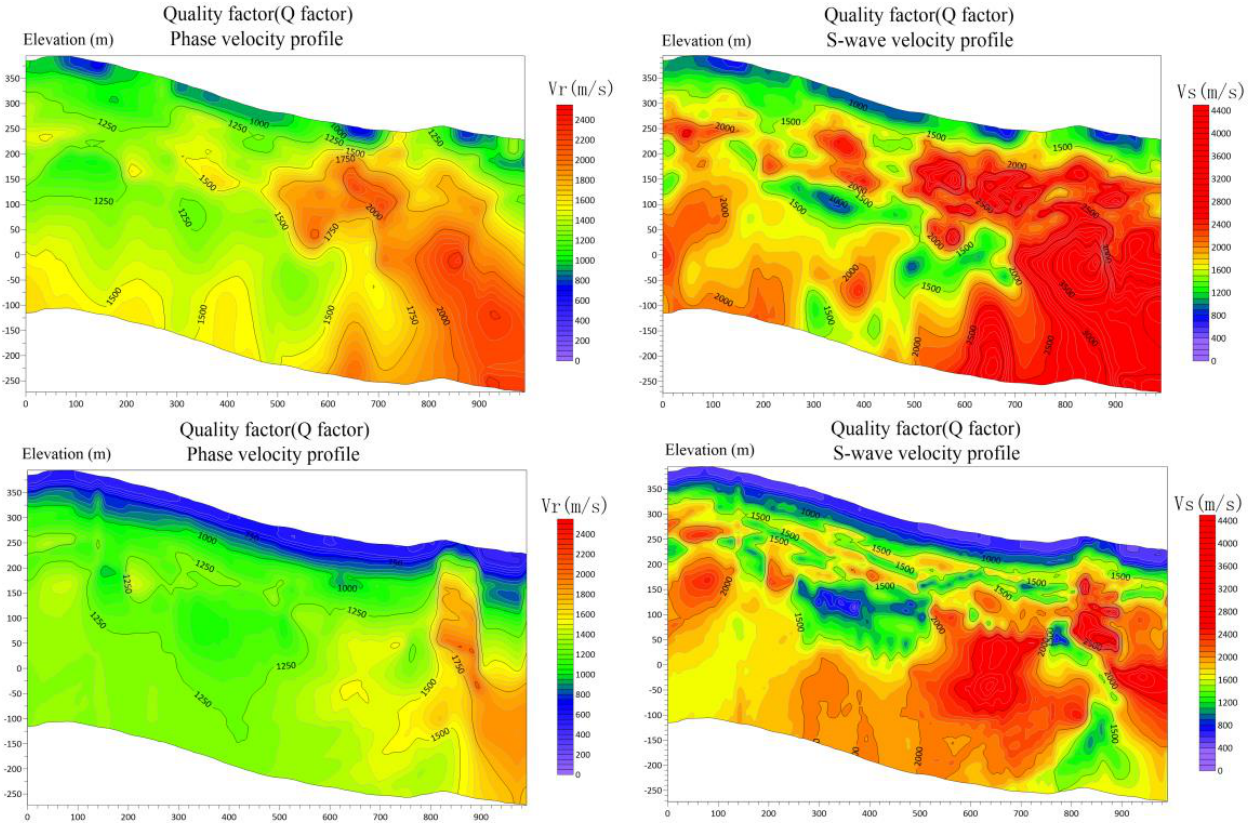
Table 1.
Statistics of geophysical exploration experimental workload
| Survey site | Survey method | Station spacing (m) | Unit | Survey length (m) |
| Shaping Coal Mine | Microtremor survey | 10 | m | 2000 |
| Magnetotelluric (MT) method | 20 | m | 1000 |
Table 3.
Inversion parameters setting for magnetotelluric method.
| Parameter | Value | Description |
|---|---|---|
| Number of initial model layers | 80 | / |
| Layer thickness scheme | 1 m (shallow), 10 m (deep) | Logarithmically equispaced |
| Initial model resistivity | 100 Ω·m | Homogeneous half-space |
| Number of iterations | 30 | / |
| RMS misfit | 2.3% | Convergence criterion < 5% |
Disclaimer/Publisher’s Note: The statements, opinions and data contained in all publications are solely those of the individual author(s) and contributor(s) and not of MDPI and/or the editor(s). MDPI and/or the editor(s) disclaim responsibility for any injury to people or property resulting from any ideas, methods, instructions or products referred to in the content. |
© 2026 by the authors. Licensee MDPI, Basel, Switzerland. This article is an open access article distributed under the terms and conditions of the Creative Commons Attribution (CC BY) license (http://creativecommons.org/licenses/by/4.0/).
Copyright: This open access article is published under a Creative Commons CC BY 4.0 license, which permit the free download, distribution, and reuse, provided that the author and preprint are cited in any reuse.


