

Submitted:
29 June 2026
Posted:
30 June 2026
You are already at the latest version
Abstract
Frequent hydration–desiccation cycles in Antarctica impose strong selective pressures on bryophytes physiology and associated microbiota. Here, we investigated physiological and transcriptional responses of the Antarctic moss Polytrichastrum alpinum and its associated microbial communities under controlled hydration, desiccation and rehydration conditions. Desiccation induced strong but reversible physiological and molecular changes, with most gene expression patterns returning toward hydrated states upon rehydration, indicating efficient recovery of metabolic activity. This response involved coordinated regulation of stress-associated gene groups, including LEA proteins, heat-shock proteins and components of ABA and calcium signalling. Furthermore, field-collected samples exhibited transcriptional profiles similar to desiccated material, suggesting that this species naturally operates in a persistently water-limited state. Associated bacterial and fungal communities showed coordinated shifts in both composition and functional activity during the experiment, particularly in pathways related to carbon and amino acid metabolism. These results highlight the resilience of Antarctic P. alpinum and its microbiome under increasing environmental variability driven by climate change.
Keywords:
Antarctica
; moss
; metatranscriptomics
; desiccation
; hydration
; bacteria
; fungi
Introduction
Bryophytes are the dominant components of the terrestrial vegetation in maritime Antarctica and represent one of the most successful plant lineages in this extreme environment [1]. In ice-free coastal regions, such as the South Shetland Islands, bryophytes form extensive carpets, cushions and turfs that structurally define the landscape. Whereas the Antarctic flora includes only two native vascular species, bryophytes encompass several dozen taxa and occupy most available ice-free habitats [2]. Beyond their structural dominance, bryophytes play key ecological roles by stabilizing soils, reducing erosion, facilitating biocrust formation, and providing carbon input to terrestrial food webs [3]. Over time, bryophyte mats accumulate organic matter and create microhabitats with more stable temperature and moisture conditions than surrounding bare ground [4].
The success of bryophytes in Antarctic ecosystems can be attributed to their poikilohydric lifestyle [1]. They generally tolerate extensive dehydration and rapidly resume metabolic activity upon rehydration, although recent evidence indicates that moss gametophytes may also partially regulate water loss via nonstomatal mechanisms [5]. However, the magnitude and dynamics of desiccation responses can vary substantially among bryophyte species, reflecting differences in ecological niche, morphology and physiological strategies [6]. In polar environments, hydration status fluctuates frequently due to freeze–thaw cycles, variable precipitation, wind exposure, and episodic snowmelt. Desiccation results in marked physiological adjustments, including suppression of photosynthesis, restructuring of thylakoid membranes, osmolyte accumulation, and activation of antioxidant systems that limit reactive oxygen species formation. Upon rehydration, photosynthetic electron transport and carbon assimilation can recover within hours, indicating tight coordination of stress-responsive pathways at transcriptional and post-transcriptional levels [7].
Recent genomic and transcriptomic studies have demonstrated that desiccation tolerance in bryophytes involves coordinated regulation of genes encoding late embryogenesis abundant (LEA) proteins, heat-shock proteins, reactive oxygen species scavengers, membrane stabilization factors, and enzymes involved in carbohydrate metabolism [8,9,10,11]. Regulation of photosystem repair, cyclic electron flow and energy dissipation is particularly important during repeated hydration-desiccation cycles [9,12]. While these mechanisms have been investigated under controlled laboratory conditions, comparatively little is known about how such molecular responses operate in Antarctic field settings, where hydration dynamics are driven by highly variable microclimatic conditions.
In addition, bryophytes harbour diverse microbial communities that form an integrated functional unit with the plant [13]. These communities are typically dominated by bacteria (e.g. Pseudomonadota, Actinobacteriota, Bacteroidota, Cyanobacteriota) and fungi (e.g. Ascomycota, Basidiomycota), with composition varying according to moss species, substrate, moisture regime and geography [14,15]. These microorganisms contribute to nutrient cycling, carbon turnover and stress tolerance, thereby influencing the performance of the bryophyte as a whole rather than acting as independent components. In Antarctica, such interactions may be particularly important, as both bryophyte and associated microorganisms are exposed to rapid hydration–desiccation fluctuations [16]. While previous studies have described the composition of bryophyte-associated communities, their coordinated functional responses remain poorly understood, especially under changing water availability.
Polytrichastrum alpinum is one of the most widespread and abundant moss species in maritime Antarctica occurring in both coastal and inland ice-free areas and contributing to local primary production and ecosystem functioning [17]. This species is commonly associated with relatively dry, sandy or rocky substrates rather than permanently water-saturated soils, making it particularly suitable for studies of water limitation and desiccation tolerance [18]. Its ecological distribution suggests adaptation to fluctuating moisture and temperature regimes, and previous study has shown that P. alpinum responds sensitively to environmental change. For example, experiments involving passive warming have demonstrated shifts in morphology and physiology, reduced allocation to cellular stress defence and increased investment in primary productivity and gametangia development under elevated temperature conditions [19].
Climate-driven changes in temperature and precipitation regimes are expected to alter the abundance and performance of Antarctic mosses, including P. alpinum [20]. The projected increase in the frequency of wet-dry periods is likely to directly influence the water balance in bryophyte and exposure to desiccation stress. Understanding how dominant Antarctic mosses respond to repeated hydration–desiccation cycles is therefore essential for predicting their resilience under future climatic scenarios. In this study, we focused on Antarctic moss P. alpinum and from Livingston Island and experimentally examined hydration, desiccation and rehydration dynamics. We aimed to characterize physiological and molecular responses of the moss together with compositional and functional responses of its associated bacterial and fungal communities. Specifically, we addressed three questions: (1) which gene groups and metabolic pathways of P. alpinum are most strongly regulated during desiccation relative to hydrated conditions; (2) does rehydration restore transcript abundance to pre-stress levels within 24 hours or induces a distinct recovery-associated transcriptional program; and (3) how bacterial and fungal community composition and functional activity shift across hydration, desiccation and rehydration states.
Materials and Methods
Site Description and Sampling
The sampling site was located close to the Juan Carlos I Antarctic Base on Livingston Island in the South Shetland Islands, Antarctica (S 62.662021, W 060.383264; 15 m a.s.l.). The area is dominated primarily by biocrusts and bryophytes. The local climate is characterised by mean monthly air temperatures ranging from -4.3 °C in July to 2.3 °C in February (annual mean -1.0 °C; [21]). Mean annual relative humidity is 82%, and mean annual wind speed is 3.7 m s⁻¹. Mean monthly radiation ranges from 10 W m⁻² in July to 111 W m⁻² in February.
Bryophytes that clearly belonged to the Polytrichaceae family were selected in the area around the Juan Carlos I Antarctic Base in January 2025. The gametophytes of the selected bryophytes were carefully collected using sterile forceps, picking them one by one to avoid contamination of other mosses, and were brought to the field laboratory. In addition, fresh material was added to the 2 ml of RNAlater™ Stabilization Solution using sterile equipment. The tubes were stored at -80° C until further analysis.
Stress Experiment
The stress experiment (Figure 1) was conducted in the laboratory at the Juan Carlos I Antarctic Base. Fresh gametophytes of the collected bryophytes (approximately 0.5 g) were distributed into 30 Petri dishes, to provide 10 biological replicates per experimental condition. The Petri dishes were filled with 10 ml of Milli-Q water and placed in a transparent, tightly closed container under ambient outdoor conditions near the station for 24 hours (the hydration phase). The gametophytes were then removed and the excess surface water was gently blotted off before being transferred onto filter paper and desiccated over activated silica gel for a further 24 hours, reaching an air relative humidity (RH) of 11%. After desiccation, the gametophytes were rehydrated by returning them to Petri dishes containing fresh Milli-Q water for an additional 24 hours. After each experimental condition, the gametophytes were weighed and preserved in 2 ml of RNAlater™ Stabilization Solution. The samples were then stored at −80 °C until RNA extraction.
RNA Isolation and Metatranscriptomic Sequencing
Tubes containing gametophytes that had been preserved in RNAlater™ were gradually thawed at 4 °C and the preservative solution was then removed. Subsequently, the total RNA was extracted from four biological replicates per experimental condition using the RNeasy Plant Mini Kit (QIAGEN, Germany), followed by on-column DNase digestion with the RNase-Free DNase Set (QIAGEN, Germany), according to the manufacturer's protocol. The extracted RNA samples were submitted to Novogene (Planegg, Germany) for metatranscriptomic sequencing on the Illumina NovaSeq X Plus platform (paired-end 150 bp). The raw sequencing data have been deposited in the NCBI Sequence Read Archive (SRA) under accession number PRJNA1461133.
Bioinformatic and Statistical Analyses
Quality Filtering and rRNA Separation
Phylogenetic Identification of Moss
To determine the moss species, the 18S rRNA contigs extracted using SortMeRNA, assembled with rnaSPAdes (v4.2.0), and compared against the NCBI nucleotide (nt) database using BLASTn tool within the Galaxy platform [25]. Taxonomic assignments were based on the top high-confidence matches (E-value ≤ 1e-20, sequence identity ≥ 97%). Hits that showed consistent affiliation across multiple independent 18S rRNA contigs were considered valid for species-level identification. The resulting consensus taxonomic assignment was then used to confirm the bryophyte species present in the environmental samples.
Microbial Community Composition and Functions
rRNA-free metatranscriptomic reads were taxonomically classified using Kraken2 against the RefSeq database (v2024-11, WGS). Sequences assigned to Bacteria and Fungi were extracted and analysed separately. Differential abundance analysis of bacterial taxa was performed using edgeR (v4.0.16; [26]) and taxa with FDR < 0.05 were considered significantly differentially abundant.
For functional analysis, the bacterial and fungal reads were de novo assembled into transcripts using Trinity (v2.15.1) with default parameters. Transcript abundance was estimated using RSEM based on read mapping to the assembled transcriptome and were further used for pairwise differential expression analysis between conditions with edgeR (v4.0.16). Transcripts were assigned to KEGG Orthology (KO) identifiers and pathway enrichment analysis was conducted based on differentially expressed genes.
Moss Transcriptome Processing and Statistical Analysis
The genome assembly of Polytrichastrum alpinum (ASM4893319v1) was downloaded from the NCBI database. The obtained quality filtered reads were mapped to the downloaded genome using STAR (v2.7.11b; [27]) on the galaxy.eu platform. BAM File Quality Control was performed based on RSeQC (v5.0.1) implemented in OmicsBox. Subsequently, StringTie (v2.2.3), available on galaxy.eu was used to construct reference annotation file and gene-level quantification was conducted with HTSeq (v2.0.5) in OmicsBox. The expression patterns between the treatments were further compared using a pairwise differential expression analysis, with edgeR (v4.0.16) in OmicsBox. Furthermore, the obtained genes were compared against the NCBI database using BLAST (E-value ≤ 1 × 10⁻¹⁰), followed by Gene Ontology (GO) mapping and functional annotation [28]. A combined KEGG pathway analysis and the enrichment tests, based on the differential expression data, were performed. A manual inspection of the pathways was conducted and pathways that were not relevant to bryophytes (e.g. specific to animals, microbial secondary metabolism etc.) were excluded from biological interpretation.
Statistical analyses were carried out in R (v2026.01.0). Raw read counts generated by HTSeq were normalized to counts per million (CPM) to account for differences in library size among samples, and expression values were further log₂-transformed. Principal component analysis (PCA) was performed to visualize patterns of sample similarity among the conditions, and multivariate differences were further assessed using permutational multivariate analysis of variance (PERMANOVA; adonis2, vegan package) on Euclidean distances with 9,999 permutations.
A subset of genes was selected based on functional annotation and grouped into biologically relevant categories associated with desiccation tolerance. When multiple genes corresponded to the same functional gene group, their CPM values were summed to represent coordinated gene-level responses. Normality was assessed using the Shapiro–Wilk test. Differences among treatments were evaluated using one-way ANOVA followed by Tukey’s HSD post-hoc test.
To assess transcriptional resetting following rehydration, a recovery index was calculated using mean log₂-transformed expression values. CPM values were transformed as log₂(CPM + 1), and condition means were calculated across biological replicates. Genes exhibiting a difference between hydrated and desiccated states (|log₂H − log₂D| ≥ 1) were retained for recovery analysis. For each retained gene, transcriptional recovery was quantified using the formula “Recovery index = 1 – (R – H) / (D – H)”, where H, D, and R represented mean log₂(CPM + 1) expression values in hydrated, desiccated, and rehydrated samples, respectively.
Under this definition, a value of 1 indicated complete recovery to hydrated expression levels, values between 0 and 1 indicated partial recovery, values greater than 1 indicated overcompensation beyond hydrated levels, values near 0 indicated minimal recovery, and values below 0 indicated divergence from the hydrated baseline following rehydration. For descriptive purposes, genes were assigned to operational recovery classes based on predefined index intervals to facilitate biological interpretation of transcriptomic resetting.
Results
Tissue Mass Dynamics During the Experiment
The assessment of water loss and recovery under identical treatment conditions was conducted by analysing samples that underwent the complete experimental sequence (fresh, hydration, desiccation and rehydration; 10 replicates; Figure 1). Laboratory hydration increased tissue mass by 47.0 ± 4.0% (SE) relative to fresh material, while desiccation caused a highly consistent mass loss of 59.5 ± 0.3% (SE). Rehydration resulted in a 151.2 ± 1.8% (SE) mass increase relative to the desiccated state and restored tissue mass to 1.6 ± 0.7% (SE) above the hydrated state.
Metatranscriptomic Overview and Bryophyte Species Identification
The metatranscriptomic sequencing generated a total of 513 million high-quality reads, with a range of 28 to 38 million per sample. Of these, 1.6-2.2% were identified as rRNA. The assembly of rRNA reads yielded multiple 18S rRNA contigs ranging from approximately 300 to 1,600 bp. BLASTn search against the NCBI nt database revealed that all high-quality contigs (≥97–99% nucleotide identity) showed significant similarity to reference sequences from the genus Polytrichastrum, with the best-supported hits corresponding to Polytrichastrum alpinum. Furthermore, the molecular identification was independently confirmed by morphological examination.
The quality control of the BAM files demonstrated high and consistent alignment performance across all samples, with approximately 95–97% of reads uniquely mapping to the Polytrichastrum alpinum genome. Consequently, 21,352 transcripts were detected, of which 7,146 were annotated with GO terms.
Microbial Community Composition
Bacterial communities were dominated by Bacillota and Cyanobacteriota in the rRNA-free dataset across different conditions (38-46 and 45-52%, respectively; Fig 2a). At the genus levels, this profile was largely dominated by Clostridium. Fungal communities were mainly represented by Ascomycota (88-91%; Figure 2b). This composition was primarily driven by highly abundant genera including Nannizzia, Mixia, Hyaloscypha and Penicillium.
Differential abundance analysis revealed significant shifts in the active bacterial community across all pairwise comparisons (FDR < 0.05) at both order and genus levels (Suppl. Table 1 and Table 2). Relative to fresh samples, both hydration and desiccation were associated with a general decrease in bacterial taxa, with 16 orders and 49 genera reduced under hydration and 29 orders and 91 genera reduced under desiccation. In contrast, a smaller subset of taxa increased in abundance, including 6 orders and 21 genera under hydration, and 11 orders and 31 genera under desiccation. Compared to hydration, desiccation resulted in the underrepresentation of two genera (Hymenobacter and Thermoflavifilum) and the overrepresentation of four genera (Staphylococcus, Heliomicrobium, Thermobifida and Spirobacillus). Rehydration had limited effects on community composition at higher taxonomic levels, with only one order showing increased abundance relative to hydration. However, changes were more pronounced at the genus level, where 11 and 1 genera were underrepresented and 10 and 2 genera were overrepresented in desiccated and rehydrated samples, respectively.
Fungal communities also exhibited marked shifts across conditions (Suppl. Table 1 and Table 2). Similar to bacteria, the strongest changes were observed in experimental treatments relative to fresh samples, with the orders Trichosporonales and Helotiales consistently enriched. In contrast, differences between desiccated and hydrated samples were limited, involving only a small number of genera, with Nannizzia and Rhodotorula underrepresented, and Fimicolochytrium and Cenococcum overrepresented under desiccation. Rehydration induced additional changes relative to both hydrated and desiccated conditions, with 11 and 7 genera showing differential abundance, respectively. Across both comparisons, Thermochaetoides and Fimicolochytrium were consistently under- and overrepresented, respectively.
In addition, marked differences in functional activity were observed in both fungal and bacterial communities across the four conditions (Table 1, Suppl. Table 3). The highest numbers of differentially expressed genes (DEGs) were detected in treatment samples compared to fresh samples, whereas only minor differences were observed between hydrated and rehydrated states. Pathway enrichment analysis identified 20 and 5 significantly enriched pathways in bacteria and fungi, respectively. In bacteria, these pathways were mainly associated with central metabolism (e.g. carbohydrate, amino acid and lipid metabolism), genetic information processing (ribosome, RNA polymerase and aminoacyl-tRNA biosynthesis) and membrane transport (ABC transporters). In contrast, fungal responses involved central carbon metabolism, including glycolysis, pyruvate metabolism, the TCA cycle and glyoxylate pathways, together with protein processing in endoplasmic reticulum.
Bryophyte Recovery
Recovery index analysis (see Methods for details) based on the metatranscriptomic dataset was performed on 2,152 genes that exhibited at least a two-fold difference between hydrated and desiccated states (Figure 3a). Of these, 1,152 genes showed partial transcriptional recovery after 24 h of rehydration, while 814 genes returned fully to hydrated expression levels. In contrast, only 126 genes showed little or no recovery and 60 genes diverged from the hydrated baseline. Overall, 91 % of desiccation-responsive genes exhibited directional recovery toward the hydrated state.
The distribution of recovery index values was strongly skewed toward 1, indicating that most desiccation-induced transcriptional changes were substantially reversed following rehydration (Figure 3b). Examination of the relationship between recovery index and the magnitude of desiccation-induced expression change revealed no pronounced dependency of recovery efficiency on the strength of the initial response. Both desiccation-induced and desiccation-repressed genes largely shifted back toward hydrated expression levels, and only a small fraction remained displaced or showed further divergence.
Differentially Expressed Genes (DEGs)
Principal component analysis (PCA) based on log₂-transformed CPM-normalized gene expression values revealed a clear separation of samples among different conditions (Figure 4). PC1 (32.3% of the variance) and PC2 (18.0% of the variance) demonstrated a clear distinction between hydrated and rehydrated samples on the one hand, and fresh and desiccated samples on the other. This condition-driven clustering was statistically supported by PERMANOVA (R² = 0.67, F = 8.22, p<0.001).
Pairwise differential expression analysis identified numerous transcripts that were significantly regulated among the four conditions (Table 2). The greatest number of differentially expressed genes was observed between rehydrated and desiccated samples, whereas the fewest changes were detected between desiccated and fresh samples. Comparisons involving rehydration generally yielded higher numbers of differentially expressed genes and a greater number of enriched pathways. Furthermore, a heatmap of differentially expressed genes showed clustering of fresh with desiccated samples and hydrated with rehydrated samples (Suppl. Figure 1).
Comparison of differentially expressed genes across the four pairwise comparisons showed contrast-specific transcriptional responses (Suppl. Figure 2). Up-regulated genes exhibited also specificity, with the majority uniquely detected in rehydrated vs. desiccated (1,619 genes) comparison. A total of 306 genes were commonly up-regulated in comparisons of hydrated vs. fresh and rehydrated vs. desiccated samples (Suppl. Table 4). These included stress-related transcription factors (e.g. WRKY SUSIBA2, NAC66, ERF/AP2), receptor-like kinases involved in signalling (e.g. TMK4, FEI2, At5g) and transporters (e.g. ABC, sucrose, amino acid transporters, etc.). Additionally, different E3 ubiquitin ligases and chaperone protein dnaJ20 were present. On contrary, a total of 424 genes were down-regulated including membrane-protective COR413 proteins, chaperones (HSP80 and HSP90) and ELIPs.
The desiccation-induced overlap (desiccated vs. fresh and desiccated vs. hydrated samples) comprised 406 downregulated and 189 upregulated genes. Genes associated with the cell cycle and cytoskeleton, including AIR9, tubulin α chains and kinesin-like proteins, as well as cell wall biosynthesis genes such as cellulose synthase and glucomannan 4-β-mannosyltransferase, were predominantly downregulated. In contrast, heat shock proteins, including HSP17 and HSP22, were upregulated.
Significant condition-dependent expression changes were observed for multiple gene groups associated with desiccation tolerance and recovery (Table 3). LEA proteins showed increased expression during desiccation, with intermediate levels in fresh and rehydrated samples, indicating their role in stabilizing cellular structures during water loss. Furthermore, TIP1-3 had the highest TPM values within detected aquaporins with significant decrease in the rehydrated samples. Likewise, the TPS, TPP and RFS genes involved in osmoprotectant biosynthesis exhibited the highest expression in hydrated or rehydrated samples. HSP17 and HSP70, showed the highest expression level among heat shock proteins and chaperones. Besides, HSP70 was significantly induced in re-hydrated samples. In contrast, ROS metabolism-related genes did not show significant expression changes across the conditions. However, genes involved in redox regulation were affected by the conditions (except Trx), but mainly the contrast was between fresh and treated samples. In addition, genes involved in ABA and stress-related signalling exhibited strong treatment dependence. ABI5 and PYL12 genes showed significantly reduced expression in hydrated samples. Similarly, NCED gene were significantly down regulated during hydration and rehydration. Several PP2C family members displayed gene-specific responses, with PP2C57 and PP2C60 strongly upregulated during rehydration. Calcium signalling components also showed significant effects, with CIPK3 and CIPK23 particularly reduced expression during rehydration.
Pathway Analysis
Following manual curation, 134 metabolic pathways were identified, of which 52 were significantly enriched, revealing pronounced transcriptional regulation across hydration, desiccation, and rehydration states in P. alpinum (Suppl. Table 5).
Numerous carbohydrate-related pathways demonstrated significant transcriptional regulation across pairwise comparisons of different conditions. Pathways including starch and sucrose metabolism, ascorbate and aldarate metabolism, glycolysis/gluconeogenesis, galactose metabolism, fructose and mannose metabolism, amino sugar and nucleotide sugar metabolism, and the pentose phosphate pathway contained differentially expressed genes and were significantly enriched according to gene set enrichment analysis (GSEA). Overall, these pathways were predominantly down-regulated in rehydrated relative to hydrated samples, in hydrated relative to fresh samples, and in rehydrated relative to desiccated samples, with some exceptions. For example, galactose metabolism was up-regulated in rehydrated compared with desiccated samples, and the citrate cycle was also up-regulated in rehydrated compared with hydrated samples. Additionally, three pathways, namely the citrate cycle, glycolysis/gluconeogenesis, and ascorbate and aldarate metabolism, were up-regulated in desiccated versus hydrated samples. During the desiccation, most enzymes associated with starch and sucrose metabolism were reduced. However, a small subset remained detectable, including β-amylase (EC:3.2.1.2), sucrose-phosphate phosphatase (EC:3.1.3.24), β-glucosidase (EC:3.2.1.21), glucan 1,3-β-glucosidase (EC:3.2.1.58), and α,α-trehalase (EC:3.2.1.28).
Furthermore, metatranscriptomic profiling of carbon fixation pathways in P. alpinum showed that transcripts associated with the Calvin–Benson cycle were detected under all conditions (Suppl. Figure 4). These transcripts were up-regulated in desiccated in comparison to hydrated samples and down-regulated in all experimental conditions compared with fresh samples. Several enzymes, including transketolase (EC:2.2.1.1), ribulose-phosphate 3-epimerase (EC:5.1.3.1) and NADP⁺-dependent malate dehydrogenase (EC:1.1.1.82), were down-regulated during desiccation but recovered upon rehydration. In contrast, phosphoenolpyruvate carboxylase (EC:4.1.1.31), phosphoglycerate kinase (EC:2.7.2.3) and ribose-5-phosphate isomerase (EC:5.3.1.6) remained suppressed in both desiccated and rehydrated samples. Furthermore, phosphoribulokinase (EC:2.7.1.19) transcripts were not detected under any condition, indicating incomplete transcript representation of specific reactions.
Pathways associated with antioxidant and redox processes, including phenylpropanoid, flavonoid, and carotenoid biosynthesis, contained differentially expressed genes across conditions but were not significantly enriched by GSEA. In contrast, ubiquinone and other terpenoid-quinone biosynthesis, as well as porphyrin metabolism, were significantly enriched by GSEA and mainly down-regulated in rehydrated samples. In addition, ascorbate and aldarate metabolism did not contain differentially expressed genes but exhibited significant enrichment in most conditions and was up-regulated in desiccated compared to hydrated samples. Furthermore, glutathione metabolism showed neither significant differential expression nor pathway enrichment in any comparison.
Discussion
Physiological and Molecular Responses of the Bryophyte
The stress experiment demonstrated that Polytrichastrum alpinum responded to water limitation at both physiological and transcriptional levels. The pronounced mass loss during desiccation and the nearly complete recovery upon rehydration confirmed the strong poikilohydric strategy, enabling rapid transitions between metabolically inactive and active states, which is characteristic of Antarctic bryophytes [7]. Moreover, tissue mass was restored after rehydration to levels slightly exceeding the hydrated state, suggesting rapid reactivation of water uptake mechanisms. Similarly, at the molecular level, the majority of desiccation-responsive genes returned toward hydrated expression levels within 24 hours. The strong shift in recovery indices towards complete or partial restoration, also reported for other bryophyte species [29], may suggest that desiccation does not cause a permanent change in gene expression of bryophyte, but rather a reversible state transition. This enables organisms to quickly return to active metabolism when conditions are favourable.
The clustering of fresh samples with desiccated samples, together with the relatively low number of differentially expressed genes between these conditions, suggests that field-collected P. alpinum was already in an under-hydrated and metabolically reduced state. Rather than representing a stress-induced shift, desiccation reflected the physiological condition of this species in its natural Antarctic environment, where water limitation is a defining feature of terrestrial ecosystems [30]. Furthermore, a subset of genes was consistently up-regulated in both pairwise comparisons (hydrated vs. fresh and rehydrated vs. desiccated), indicating the activation of a common recovery program associated with water reintroduction. This shared response included several regulatory transcription factors from WRKY, NAC and ERF families, as well as receptor-like kinases involved in stress perception. While these components are well characterized in angiosperms [31,32], their roles in bryophytes remain less understood. For example, TMK4 has been described in Arabidopsis thaliana as a negative regulator of ABA signalling by enhancing of PP2C activity [33]. However, in P. alpinum, PP2C expression was significantly elevated during rehydration, suggesting a potential reconfiguration of ABA signalling during recovery. Similarly, RLK have been shown to participate in the abiotic stress response of vascular plants [34], but their functional roles in bryophytes remain unexplored. In addition, calcium signalling components exhibited condition-specific responses, with significantly lower expression of CIPK genes during rehydration, reflecting a transition from active stress signalling to recovery processes [35]. Although several key genes involved in ABA signalling and calcium-mediated responses showed significant differential expression across conditions, pathway enrichment analysis did not detect significant enrichment of the plant hormone signal transduction, MAPK signalling, calcium signalling and carotenoid biosynthesis pathways. The 24-hour treatment may capture rapid activation of central regulators, whereas broader transcriptional changes across complete pathways may require longer exposure or may remain undetectable because only a subset of genes within these signalling pathways responds to stress in P. alpinum.
Previous studies on desiccation responses in bryophytes [9,36], including Antarctic species such as Sanionia uncinata [8] and Pohlia nutans [37], have highlighted the central role of ABA signalling, ELIPs and LEA proteins in stress regulation. Similarly, in P. alpinum, LEA proteins were significantly induced during desiccation, acting as cellular protectants that stabilize macromolecules and membranes [38]. Likewise, the upregulation of HSPs during desiccation in P. alpinum is consistent with previous studies in bryophytes, indicating that responses to desiccation stress are conserved across species regardless of geographic origin [29]. Furthermore, desiccation stress promotes the accumulation of reactive oxygen species (ROS) and induces oxidative stress [39]. In this context, ELIPs, which are involved in photoprotection, and genes associated with ROS metabolism showed consistently high expression levels and did not vary significantly across conditions. While ELIPs primarily act by preventing the formation of ROS through stabilization of the photosynthetic apparatus, ROS metabolism genes are responsible for the detoxification of accumulated ROS [12,40]. Their consistently high expression may reflect adaptation to environments characterized by recurrent stress, where the maintenance of basal protective capacity enables the rapid mitigation of oxidative damage without the need for transcriptional reprogramming.
Microbiome Composition and Functional Dynamics
Metatranscriptomic analysis of P. alpinum revealed high diversity of associated microbial communities. The dominance of Clostridium in the dataset suggests that fermentative and anaerobic metabolisms may contribute considerably to microbial functioning within the moss microenvironment, potentially driven by microscale oxygen limitation associated with water retention and organic matter accumulation, both characteristic of Antarctic mosses [41]. Such conditions can promote the activity of anaerobic taxa. Besides, Clostridium has previously been reported in moss-associated microbiomes [42]. Furthermore, the presence of Cyanobacteriota supports their role as primary producers within the moss microbiome, contributing to nitrogen inputs through heterocyst-forming cyanobacteria [44]. In addition, thin filamentous Leptolyngbya observed in P. alpinum are known to colonize polar bryophyte leaf surfaces [45], however their functional role remains unclear. Fungal community composition exhibited the dominance of Ascomycota, reflecting typical structure of Antarctic bryophyte-associated communities [46]. Other taxa frequently reported in moss-associated microbiomes [47] were also detected in the metatranscriptomic dataset of P. alpinum, but at a lower relative abundance. This likely reflects differences in sequencing strategies, as the majority of published studies are based on amplicon or metagenomic sequencing.
Moss hydration dynamics represent a key driver of associated microbial community structure, as also observed in P. alpinum. Desiccation promoted the activity of specific bacterial and fungal taxa, including Staphylococcus and Cenococcum, which have previously been reported in bryophytes and are known for their desiccation tolerance [48,49]. In contrast, several soil-associated genera, including the bacteria Hymenobacter and Thermoflavifilum, and the fungi Nannizzia and Rhodotorula, declined under desiccation, indicating sensitivity to drying. Rehydration resulted in only partial and taxon-specific recovery. Nevertheless, a greater number of bacterial taxa were enriched during rehydration than desiccation, with an increased representation of Pseudomonadota, consistent with previous studies [50].
The changes in microbial community composition were accompanied by pronounced shifts in functional activity. For example, in fungi, central carbon metabolism pathways, including glycolysis/gluconeogenesis, pyruvate metabolism, and glyoxylate and dicarboxylate metabolism, were upregulated during desiccation compared to hydration and subsequently downregulated upon rehydration. A similar pattern was observed for bacterial glycine, serine and threonine metabolism, suggesting a transient reorganization of carbon metabolism under drying conditions, consistent with previous observations in host-associated microbiota [51].
Conclusions
This study shows that Antarctic moss Polytrichastrum alpinum is highly resilient to rapid hydration–desiccation cycles, exhibiting strong but largely reversible physiological and transcriptional responses. Desiccation induces transient reprogramming of stress-related pathways and central carbon metabolism, while rehydration restores most gene expression patterns within 24 h, indicating efficient recovery of metabolic activity. These findings suggest that desiccation in Antarctic mosses represents a routine and reversible state rather than a damaging stress event. At the same time, associated microbial communities undergo coordinated compositional and functional shifts, reflecting dynamic adjustment to changing water availability.
In the context of ongoing climate change, where increases in precipitation and the frequency of wet–dry cycles are expected, such rapid and reversible responses may confer a strong ecological advantage. The ability of P. alpinum to tolerate repeated fluctuations in water availability and rapidly resume activity suggests that this species, and similar Antarctic bryophytes, are well adapted to future environmental variability.
Supplementary Materials
The following supporting information can be downloaded at the website of this paper posted on Preprints.org.
Funding
This project was supported by Deutsche Forschungsgemeinschaft (DFG) within the project PU867/1-1.
Acknowledgments
I thank the Spanish Polar Committee for facilitating access to the Spanish Antarctic Station Juan Carlos I, and the Unidad de Tecnología Marina (UTM-CSIC) for providing logistical support and services at the station. I am grateful to the station commander, Joan Riba, and the technical staff for their support during my stay. I thank Leonie Keilholz for laboratory assistance and Burkhard Becker for his support during the expedition and for critical reading of the manuscript.
References
- Bramley-Alves, J.; et al. Domin. Antarct. Environ. Bryophyt. A Time Change 2014, 309–324.
- Colesie, C.; et al. Antarctica’s vegetation in a changing climate. Wiley Interdiscip. Rev. Clim. Change 2023, 14. [Google Scholar] [CrossRef]
- Seitz, S.; et al. Bryophyte-dominated biological soil crusts mitigate soil erosion in an early successional Chinese subtropical forest. Biogeosciences 2017, 14, 5775–5788. [Google Scholar] [CrossRef]
- Swarnkar, P.; et al. Role of Bryophytes in Carbon Sequestration and Interactions with other Ecological Processes. Indian J. Ecol. 2025, 52. [Google Scholar] [CrossRef]
- Robinson, S.A.; et al. Desiccation tolerance of three moss species from continental Antarctica. Aust. J. Plant Physiol. 2000, 27, 379–388. [Google Scholar] [CrossRef]
- Yin, H.; et al. Basking in the sun: how mosses photosynthesise and survive in Antarctica. Photosynth Res. 2023, 158, 151–169. [Google Scholar] [CrossRef] [PubMed]
- Pizarro, M.; et al. Desiccation tolerance in the Antarctic moss Sanionia uncinata. Biol. Res. 2019, 52, 46. [Google Scholar] [CrossRef] [PubMed]
- Gao, B.; et al. Desiccation tolerance in bryophytes: The dehydration and rehydration transcriptomes in the desiccation-tolerant bryophyte Bryum argenteum. Sci. Rep. 2017, 7. [Google Scholar] [CrossRef] [PubMed]
- Oliver, M.J.; et al. The rehydration transcriptome of the desiccation-tolerant bryophyte Tortula ruralis: Transcript classification and analysis. BMC Genom. 2004, 5. [Google Scholar] [CrossRef] [PubMed]
- Peng, Y.; et al. Proteomic and Transcriptomic Responses of the Desiccation-Tolerant Moss Racomitrium canescens in the Rapid Rehydration Processes. Genes 2023, 14. [Google Scholar] [CrossRef] [PubMed]
- Liu, X.; et al. Functional aspects of early light-induced protein (Elip) genes from the desiccation-tolerant moss syntrichia caninervis. Int. J. Mol. Sci. 2020, 21. [Google Scholar] [CrossRef] [PubMed]
- Ramakrishnan, D.K.; et al. Mosses as extraordinary reservoir of microbial diversity: a comparative analysing of co-occurring ‘plant-moss twins’ in natural alpine ecosystem. Env. Microbiome 2025, 20. [Google Scholar] [CrossRef] [PubMed]
- Chen, K.-H.; Nelson, J. A scoping review of bryophyte microbiota: diverse microbial communities in small plant packages. J. Exp. Bot. 2022, 73, 4496–4513. [Google Scholar] [CrossRef] [PubMed]
- Proctor, M.C.F.; et al. Desiccation-tolerance in bryophytes: a review. Bryologist 2007, 110, 595–621. [Google Scholar] [CrossRef]
- Prather, H.M.; et al. Species-specific effects of passive warming in an Antarctic moss system. R Soc. Open Sci. 2019, 6. [Google Scholar] [CrossRef] [PubMed]
- Zúñiga-González, P.; et al. Soluble carbohydrate content variation in Sanionia uncinata and Polytrichastrum alpinum, two Antarctic mosses with contrasting desiccation capacities. Biol. Res. 2016, 49. [Google Scholar] [CrossRef] [PubMed]
- Shortlidge, E.E.; et al. Passive warming reduces stress and shifts reproductive effort in the Antarctic moss, Polytrichastrum alpinum. Ann. Bot. 2017, 119, 27–38. [Google Scholar] [CrossRef] [PubMed]
- Perera-Castro, A. V.; et al. It Is Hot in the Sun: Antarctic Mosses Have High Temperature Optima for Photosynthesis Despite Cold Climate. Front Plant Sci. 2020, 11. [Google Scholar] [CrossRef] [PubMed]
- Bioinformatics, BioBam. OmicsBox – Bioinformatics Made Easy. 2019. Available online: https://www.biobam.com/omicsbox.
- Bolger, A.M.; Lohse, M.; Usadel, B. Trimmomatic: A flexible trimmer for Illumina sequence data. Bioinformatics 2014, 30, 2114–2120. [Google Scholar] [CrossRef] [PubMed]
- Kopylova, E.; Noé, L.; Touzet, H. SortMeRNA: Fast and accurate filtering of ribosomal RNAs in metatranscriptomic data. Bioinformatics 2012, 28, 3211–3217. [Google Scholar] [CrossRef] [PubMed]
- Abueg, L.A.L.; et al. The Galaxy platform for accessible, reproducible, and collaborative data analyses: 2024 update. Nucleic Acids Res. 2024, 52, W83–W94. [Google Scholar] [CrossRef] [PubMed]
- Robinson, M.D.; McCarthy, D.J.; Smyth, G.K. edgeR: A Bioconductor package for differential expression analysis of digital gene expression data. Bioinformatics 2009, 26, 139–140. [Google Scholar] [CrossRef] [PubMed]
- Dobin, A.; et al. STAR: Ultrafast universal RNA-seq aligner. Bioinformatics 2013, 29, 15–21. [Google Scholar] [CrossRef] [PubMed]
- Götz, S.; et al. High-throughput functional annotation and data mining with the Blast2GO suite. Nucleic Acids Res. 2008, 36, 3420–3435. [Google Scholar] [CrossRef] [PubMed]
- Cruz De Carvalho, R.; et al. Differential proteomics of dehydration and rehydration in bryophytes: Evidence towards a common desiccation tolerance mechanism. Plant Cell Env. 2014, 37, 1499–1515. [Google Scholar] [CrossRef] [PubMed]
- Convey, P.; et al. The spatial structure of Antarctic biodiversity. Ecol. Monogr. 2014, 84, 203–244. [Google Scholar] [CrossRef]
- Bhat, A.; Haney, C.H. The role of plant receptor-like kinases in sensing extrinsic and host-derived signals and shaping the microbiome. Cell Host Microbe 2025, 33, 1233–1240. [Google Scholar] [CrossRef] [PubMed]
- Ou, Y.; Kui, H.; Li, J. Receptor-like Kinases in Root Development: Current Progress and Future Directions. Mol. Plant 2021, 14, 166–185. [Google Scholar] [CrossRef] [PubMed]
- Li, L.; et al. TMK4 receptor kinase negatively modulates ABA signaling by phosphorylating ABI2 and enhancing its activity OO. JIPB J. Integr. Plant Biol. 2020. [Google Scholar] [CrossRef] [PubMed]
- Soltabayeva, A.; et al. Receptor-like Kinases (LRR-RLKs) in Response of Plants to Biotic and Abiotic Stresses. Plants 2022, 11. [Google Scholar] [CrossRef] [PubMed]
- Kaya, C.; Uğurlar, F.; Adamakis, I.D.S. Molecular Mechanisms of CBL-CIPK Signaling Pathway in Plant Abiotic Stress Tolerance and Hormone Crosstalk. Int. J. Mol. Sci. 2024, 25. [Google Scholar] [CrossRef] [PubMed]
- Yang, R.; et al. Transcriptional profiling analysis providing insights into desiccation tolerance mechanisms of the desert moss Syntrichia caninervis. Front Plant Sci. 2023, 14. [Google Scholar] [CrossRef] [PubMed]
- Fang, S.; et al. Integrated transcriptome and metabolome analyses reveal the adaptation of Antarctic moss Pohlia nutans to drought stress. Front Plant Sci. 2022, 13. [Google Scholar] [CrossRef] [PubMed]
- Goyal, K.; Walton, L.J.; Tunnacliffe, A. LEA proteins prevent protein aggregation due to water stress. Biochem. J. 2005. [Google Scholar] [CrossRef] [PubMed]
- Cruz de Carvalho, M.H. Drought stress and reactive oxygen species. Plant Signal Behav. 2008, 3, 156–165. [Google Scholar] [CrossRef] [PubMed]
- Zhang, W.; et al. Transcriptome sequencing of Antarctic moss under salt stress emphasizes the important roles of the ROS-scavenging system. Gene 2019, 696, 122–134. [Google Scholar] [CrossRef] [PubMed]
- Doytchinov, V. V.; Dimov, S.G. Microbial Community Composition of the Antarctic Ecosystems: Review of the Bacteria, Fungi, and Archaea Identified through an NGS-Based Metagenomics Approach 2022, 12. [CrossRef] [PubMed]
- Koua, F.H.M.; Kimbara, K.; Tani, A. Bacterial-biota dynamics of eight bryophyte species from different ecosystems. Saudi J. Biol. Sci. 2015, 22, 204–210. [Google Scholar] [CrossRef] [PubMed]
- Glime, J.M. Bacterial Effects on Bryophytes. In Bryophyte Ecology; Michigan Technological University: Houghton, MI, 2022. [Google Scholar]
- Álvarez, C.; et al. Symbiosis between cyanobacteria and plants: from molecular studies to agronomic applications. J. Exp. Bot. 2023, 74, 6145–6157. [Google Scholar] [CrossRef] [PubMed]
- Pietryka, M.; Richter, D.; Matula, J. Arctic ecosystems-relations between cyanobacterial assemblages and vegetation (Spitsbergen). Ecol. Quest. 2018, 29, 9–20. [Google Scholar] [CrossRef]
- Rosa, L.H.; et al. Ecological succession of fungal and bacterial communities in Antarctic mosses affected by a fairy ring disease. Extremophiles 2021, 25, 471–481. [Google Scholar] [CrossRef] [PubMed]
- Dangar, B. V.; et al. Reviewing bryophyte-microorganism association: insights into environmental optimization. Front Microbiol. 2024, 15, 1407391. [Google Scholar] [CrossRef] [PubMed]
- Chaibenjawong, P.; Foster, S.J. Desiccation tolerance in Staphylococcus aureus. Arch. Microbiol. 2011, 193, 125–135. [Google Scholar] [CrossRef] [PubMed]
- Wang, H.; Kohler, A.; Martin, F.M. Biology, genetics, and ecology of the cosmopolitan ectomycorrhizal ascomycete Cenococcum geophilum. Front Microbiol. 2025, 16. [Google Scholar] [CrossRef] [PubMed]
- Zhao, J.; et al. Resuscitation of soil microbiota. Eur. J. Soil Biol. 2021, 103, 103290. [Google Scholar] [CrossRef]
- Cernava, T.; et al. Plasticity of a holobiont: desiccation induces fasting-like metabolism within the lichen microbiota. ISME J. 2019, 13, 547–556. [Google Scholar] [CrossRef] [PubMed]
Figure 1.
Experimental setup for the Antarctic moss Polytrichastrum alpinum, showing a representative replicate. Values indicated above show sample weights (mean of ten biological replicates) for each condition. Images shown below correspond to samples after removal of surface water for weight measurement.
Figure 1.
Experimental setup for the Antarctic moss Polytrichastrum alpinum, showing a representative replicate. Values indicated above show sample weights (mean of ten biological replicates) for each condition. Images shown below correspond to samples after removal of surface water for weight measurement.
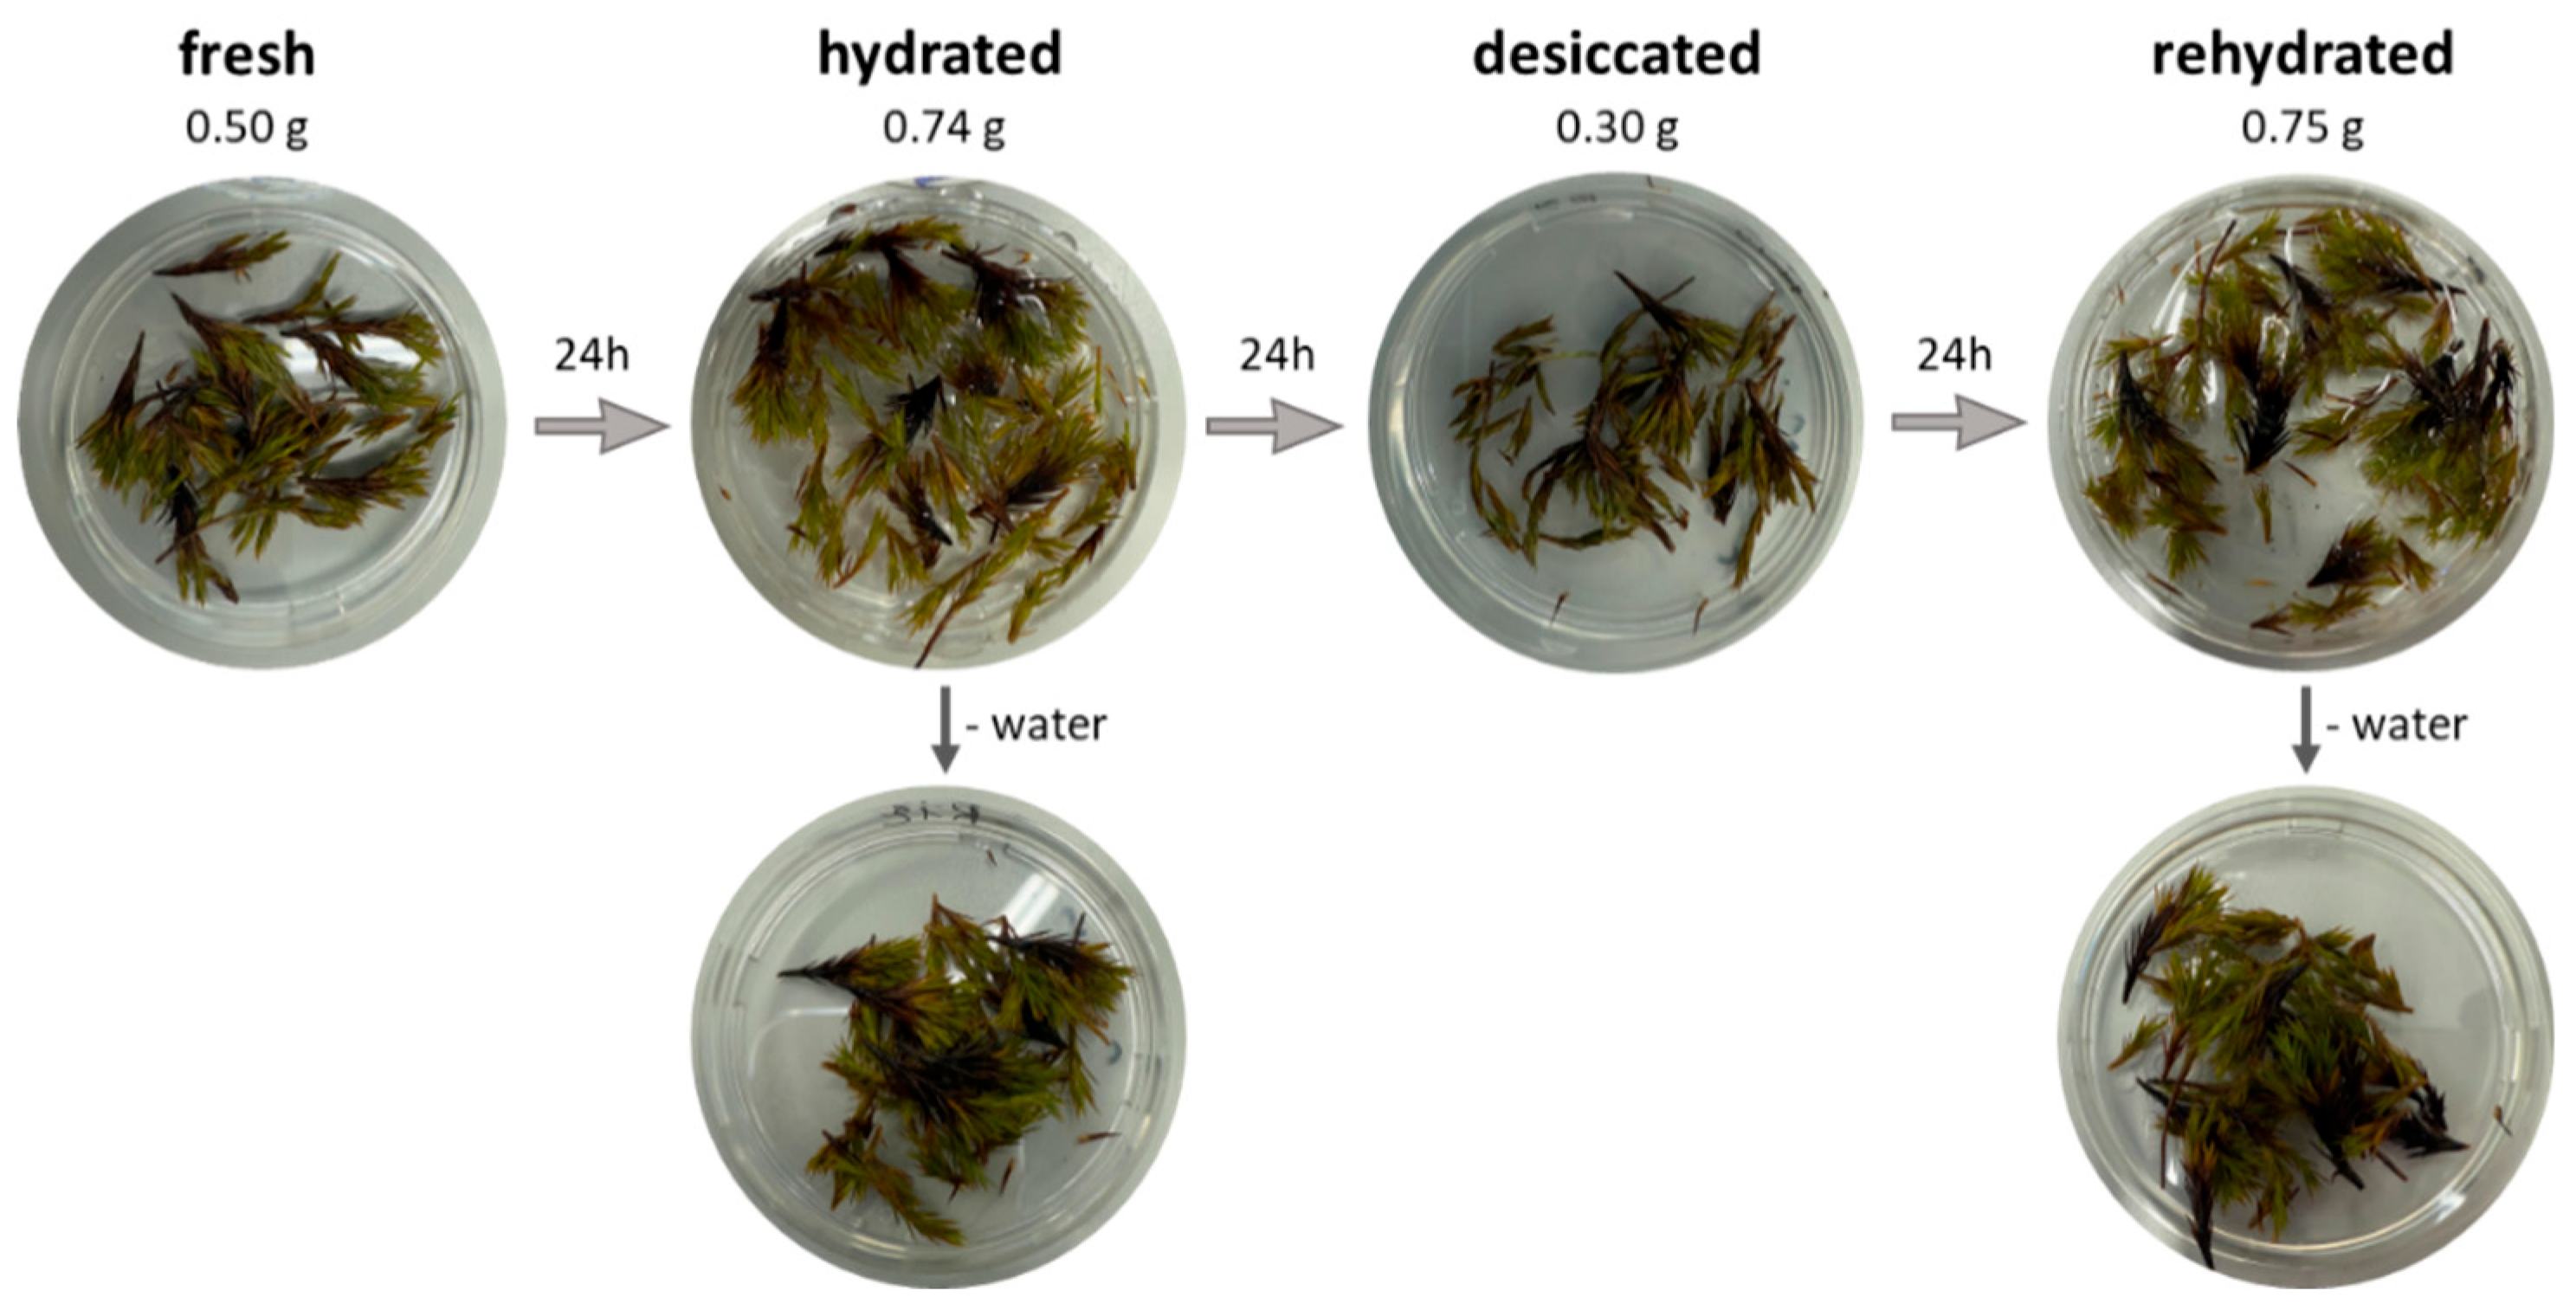
Figure 2.
Relative abundance of bacterial (a) and fungal (b) phyla based on metatranscriptomic sequencing of Polytrichastrum alpinum, assigned using rRNA-free dataset with Kraken2 (RefSeq).
Figure 2.
Relative abundance of bacterial (a) and fungal (b) phyla based on metatranscriptomic sequencing of Polytrichastrum alpinum, assigned using rRNA-free dataset with Kraken2 (RefSeq).
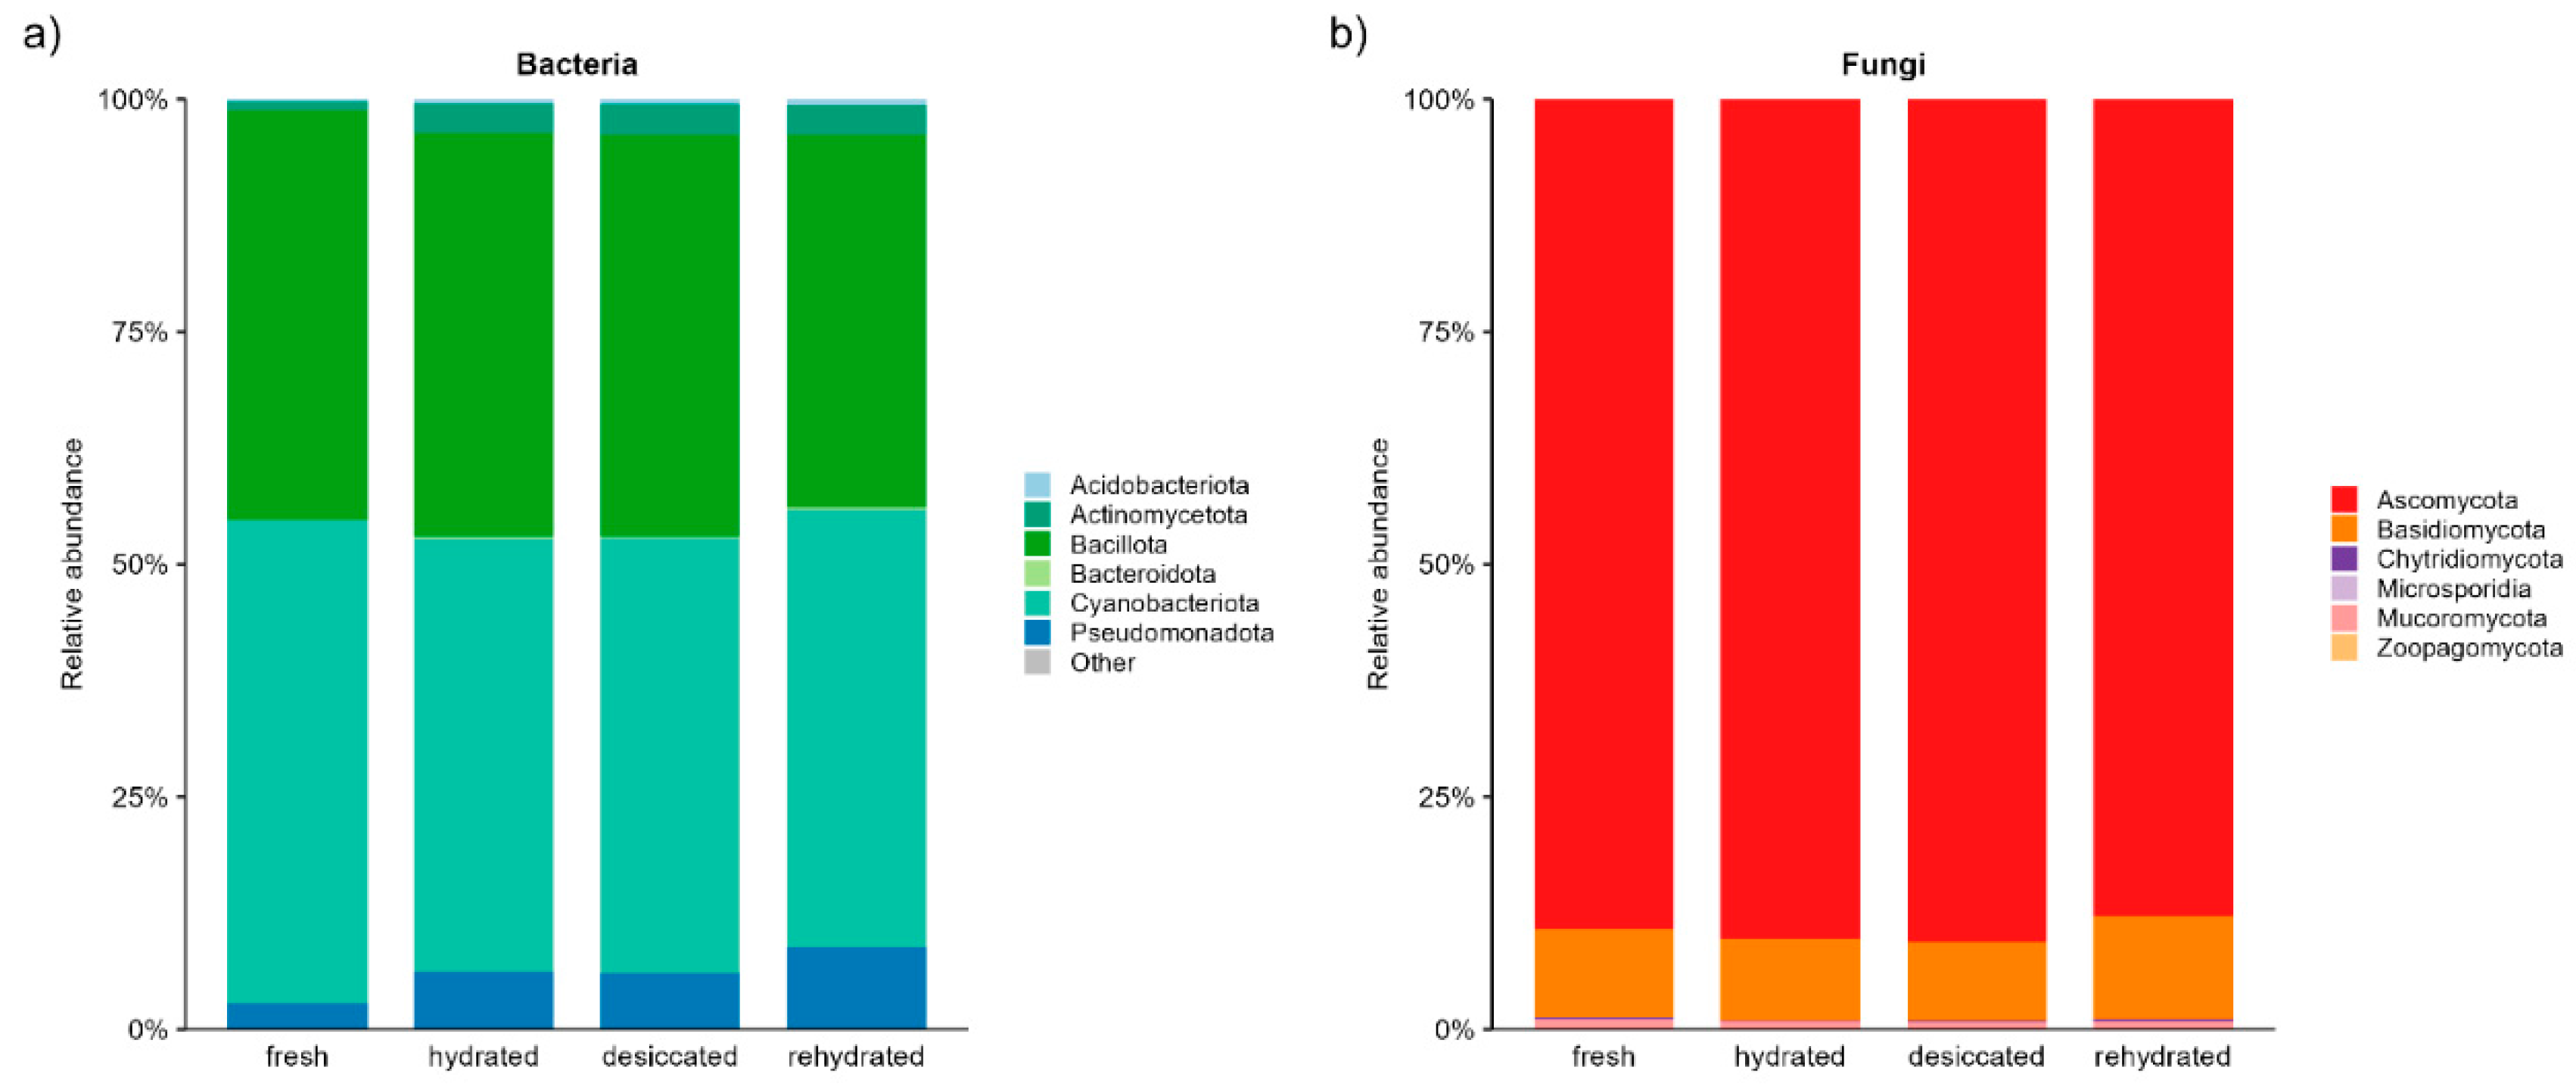
Figure 3.
Gene-level desiccation response and recovery dynamics: (a) gene counts per recovery category, (b) desiccation-induced expression change plotted against the Recovery Index, which quantifies the extent of return to the hydrated baseline after rehydration. Each point represents one gene and dashed lines mark reference thresholds (0 and 1).
Figure 3.
Gene-level desiccation response and recovery dynamics: (a) gene counts per recovery category, (b) desiccation-induced expression change plotted against the Recovery Index, which quantifies the extent of return to the hydrated baseline after rehydration. Each point represents one gene and dashed lines mark reference thresholds (0 and 1).
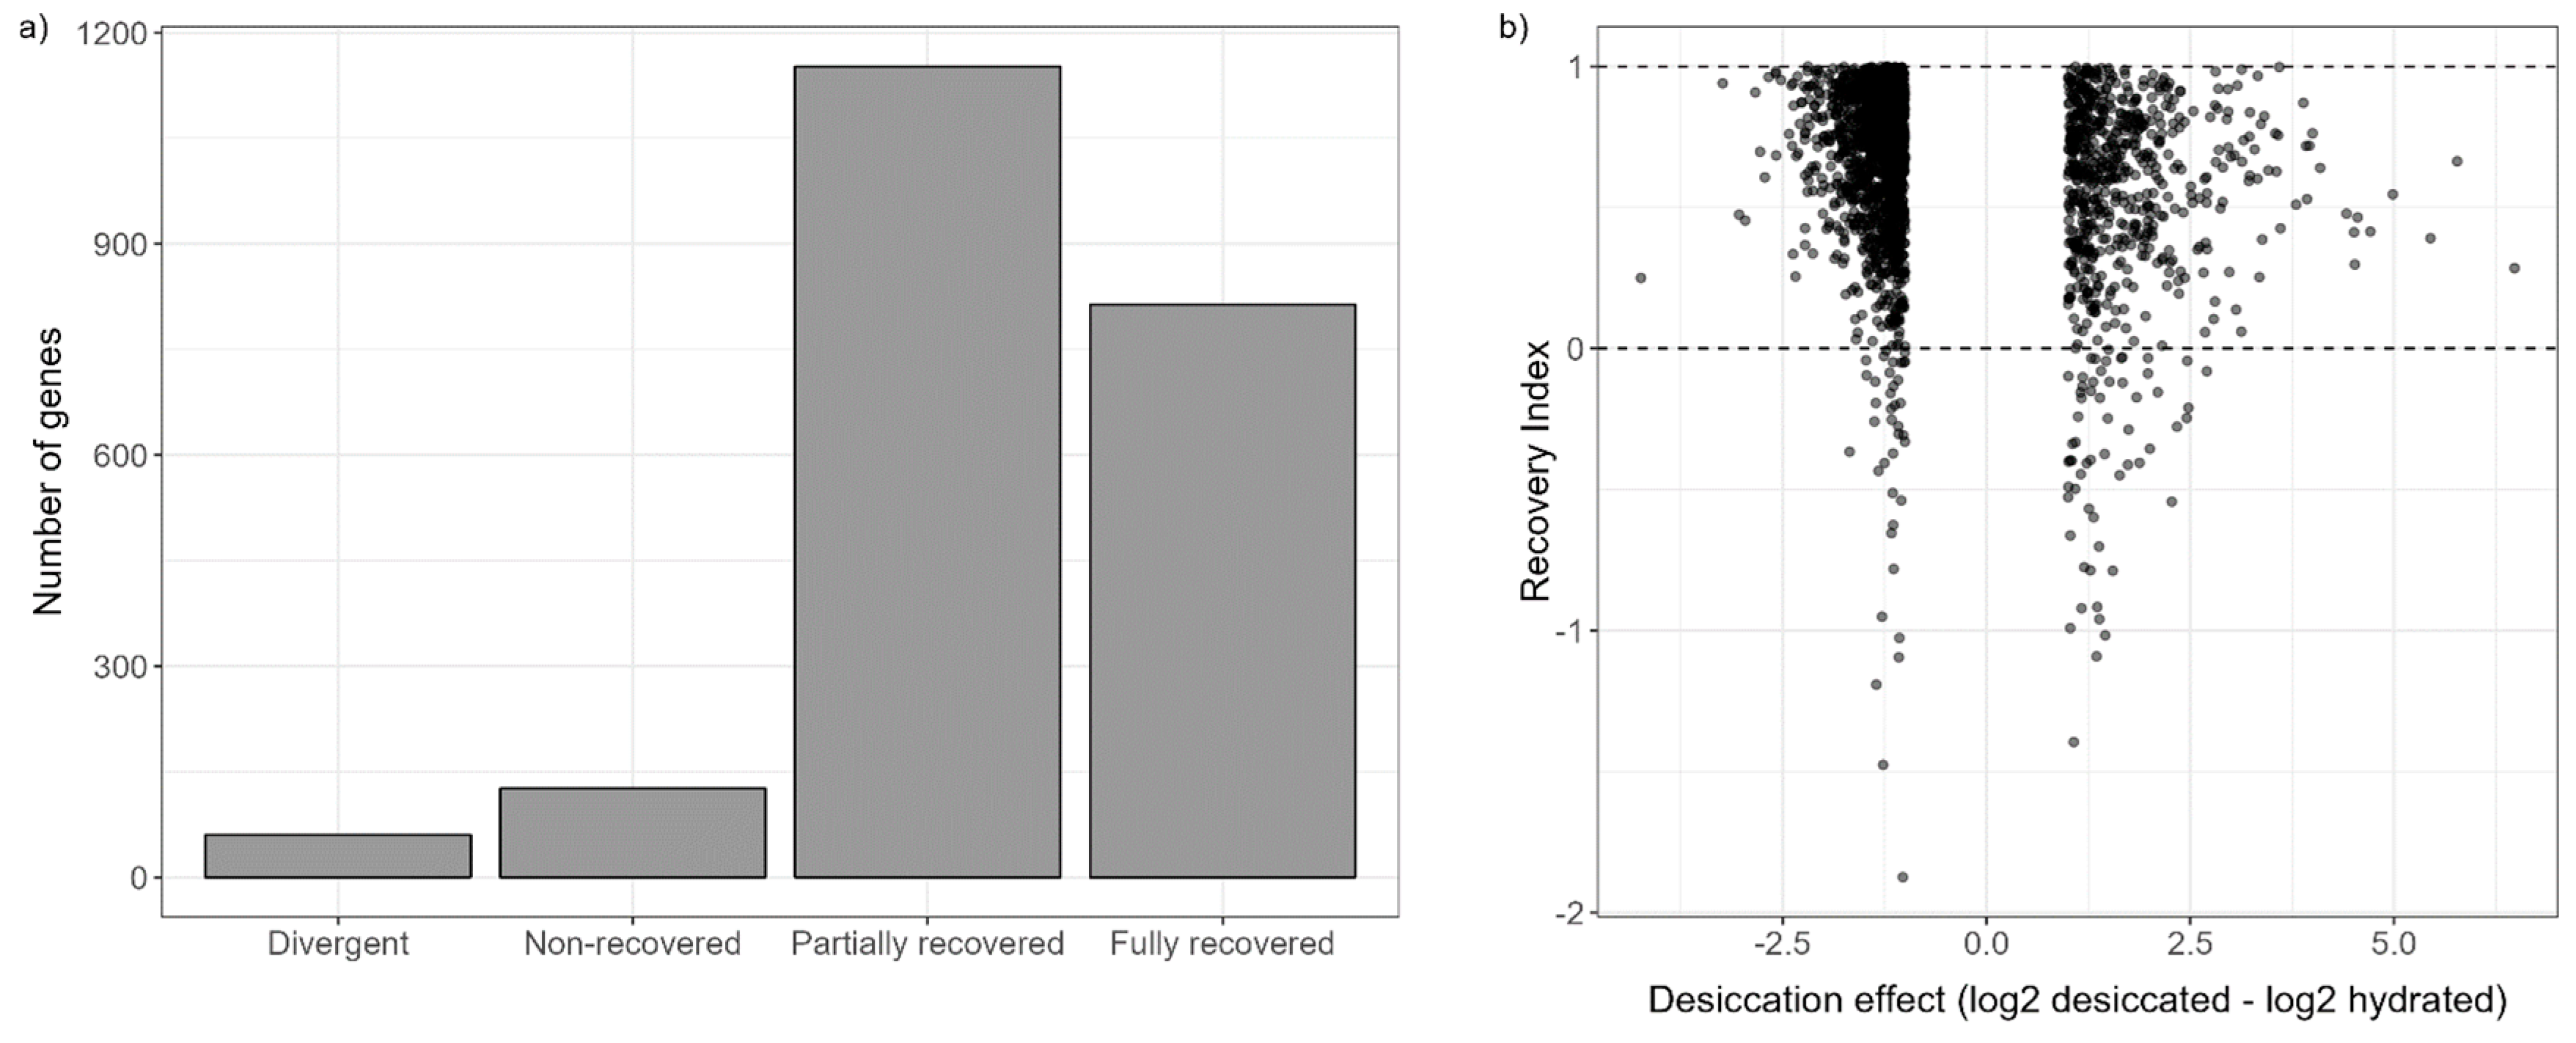
Figure 4.
Principal component analysis (PCA) of log₂-transformed CPM-normalized gene expression profiles across different conditions.
Figure 4.
Principal component analysis (PCA) of log₂-transformed CPM-normalized gene expression profiles across different conditions.
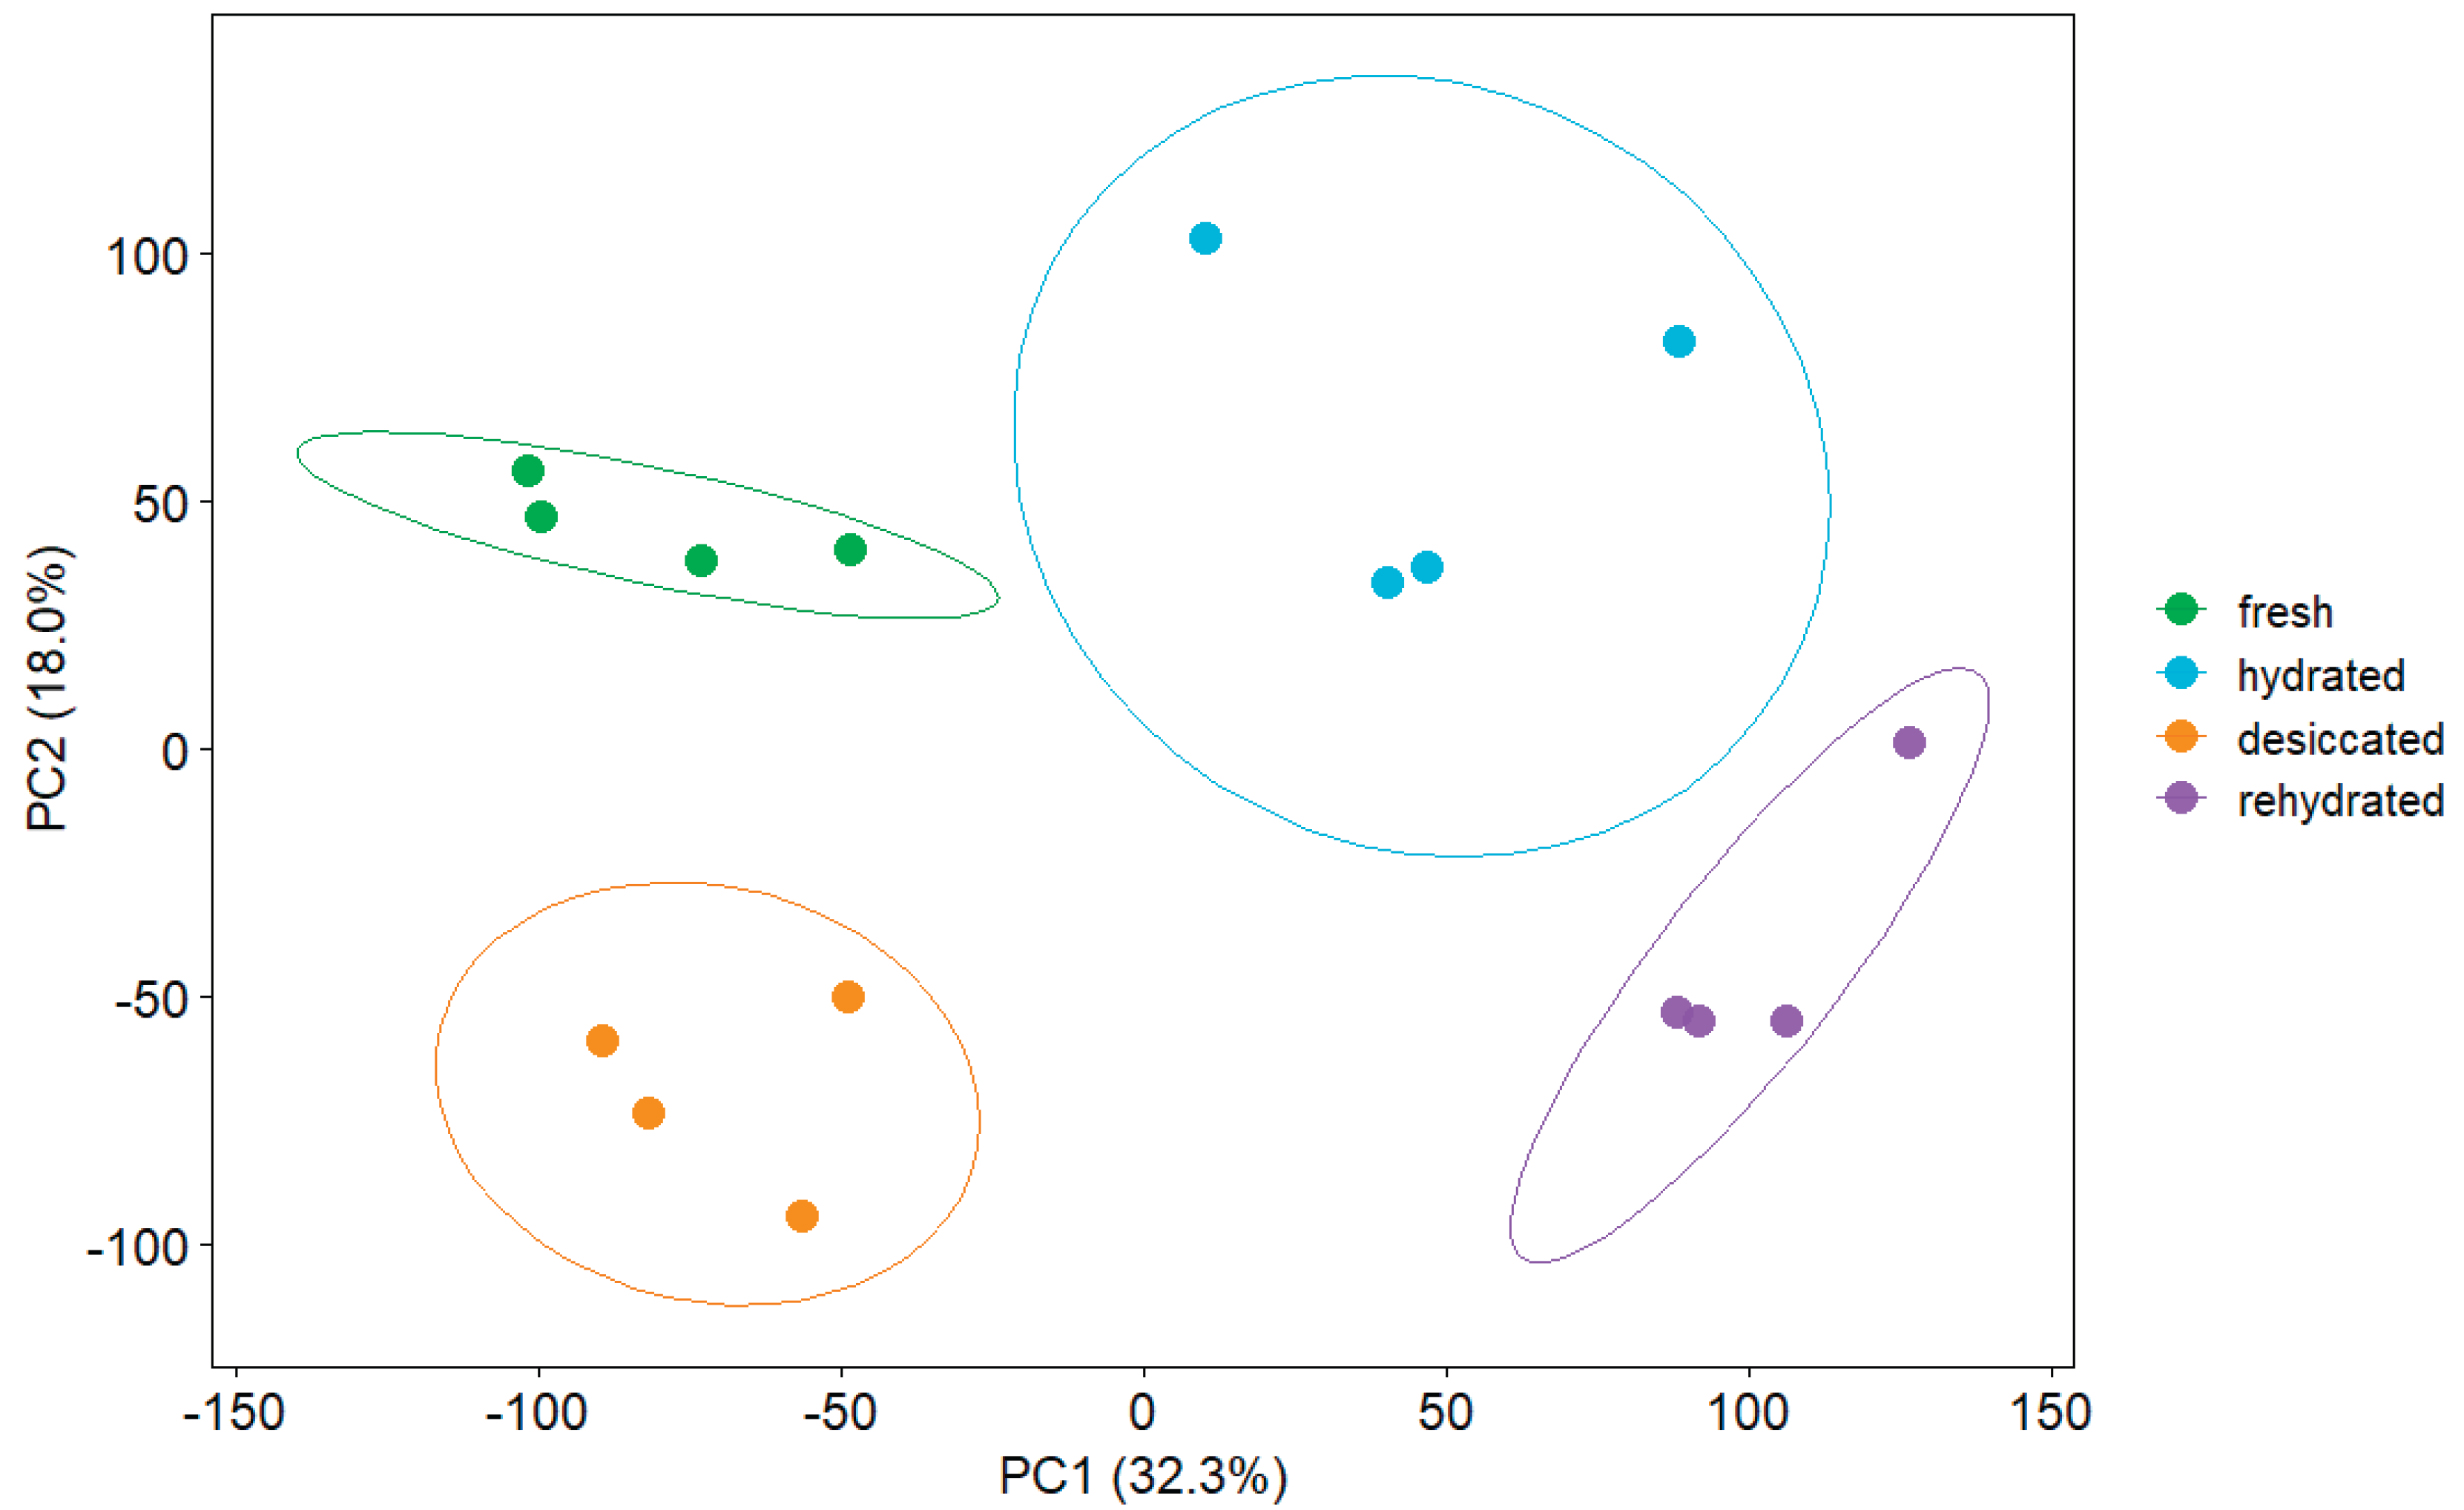

Table 1.
Summary of differentially expressed genes (DEGs) and the number of enriched pathways across pairwise comparisons in bacterial and fungal communities.
Table 1.
Summary of differentially expressed genes (DEGs) and the number of enriched pathways across pairwise comparisons in bacterial and fungal communities.
| Experiment | Number of DEGs | Enriched pathways | ||
|---|---|---|---|---|
| reference | contrast | up-regulated | down-regulated | |
| Bacteria | ||||
| fresh | hydrated | 854 | 83 | 12 |
| fresh | desiccated | 667 | 88 | 2 |
| fresh | rehydrated | 1247 | 365 | 8 |
| hydrated | desiccated | 17 | 4 | 3 |
| hydrated | rehydrated | 1 | 2 | 5 |
| desiccated | rehydrated | 13 | 19 | 3 |
| Fungi | ||||
| fresh | hydrated | 118 | 65 | 0 |
| fresh | desiccated | 106 | 63 | 1 |
| fresh | rehydrated | 161 | 147 | 2 |
| hydrated | desiccated | 22 | 8 | 3 |
| hydrated | rehydrated | 5 | 3 | 1 |
| desiccated | rehydrated | 11 | 44 | 4 |
Table 2.
Number of differentially expressed genes and associated enriched pathways identified for each pairwise treatment comparison.
Table 2.
Number of differentially expressed genes and associated enriched pathways identified for each pairwise treatment comparison.
| contrast reference |
hydrated | desiccated | rehydrated | |||
|---|---|---|---|---|---|---|
| fresh | ↑1017 | 29 | ↑776 | 17 | ↑1743 | 28 |
| ↓1139 | ↓921 | ↓1875 | ||||
| hydrated | ↑964 | 33 | ↑875 | 37 | ||
| ↓1433 | ↓454 | |||||
| desiccated | ↑2034 | 39 | ||||
| ↓1225 | ||||||
Table 3.
Expression levels (TPM; average of 4 replicates) of selected stress-responsive genes and results of one-way ANOVA comparing different experimental conditions. Asterisks indicate levels of statistical significance (* p < 0.05, ** p < 0.01, *** p < 0.001).
Table 3.
Expression levels (TPM; average of 4 replicates) of selected stress-responsive genes and results of one-way ANOVA comparing different experimental conditions. Asterisks indicate levels of statistical significance (* p < 0.05, ** p < 0.01, *** p < 0.001).
| Gene | Category | Condition | ANOVA test | ||||
|---|---|---|---|---|---|---|---|
| fresh | hydrated | desiccated | rehydrated | F-value | p-value | ||
| LEA | LEA protein-encoding genes | 259 | 187 | 345 | 211 | 9.14 | ** |
| NIP1-1 | Aquaporins | 1 | 0 | 0 | 1 | 6.69 | ** |
| TIP1-3 | 1549 | 1011 | 1041 | 523 | 53.02 | *** | |
| SOD | ROS metabolism | 90 | 97 | 90 | 80 | 1.74 | ns |
| CAT | 960 | 953 | 923 | 970 | 0.12 | ns | |
| APX | 586 | 592 | 648 | 586 | 0.74 | ns | |
| DHAR1 | 362 | 494 | 408 | 376 | 0.45 | ns | |
| GST | 1540 | 1587 | 1662 | 1514 | 0.49 | ns | |
| Prx | Redox regulation | 1630 | 1017 | 942 | 879 | 9.59 | ** |
| Trx | 682 | 638 | 631 | 529 | 12.65 | *** | |
| Grx | 17 | 52 | 39 | 67 | 11.61 | *** | |
| Srx | 21 | 11 | 14 | 9 | 20.18 | *** | |
| TPS | Osmoprotectant biosynthesis | 149 | 372 | 119 | 230 | 68.25 | *** |
| TPP | 20 | 26 | 24 | 44 | 5.70 | * | |
| P5CR | 7 | 9 | 7 | 7 | 1.85 | ns | |
| RFS | 24 | 35 | 26 | 34 | 11.57 | *** | |
| HSP17 | Heat shock proteins and chaperones | 762 | 266 | 2597 | 1272 | 7.65 | ** |
| HSP22 | 220 | 71 | 735 | 408 | 7.55 | ** | |
| HSP70 | 293 | 292 | 264 | 579 | 41.6 | *** | |
| HSP80 | 48 | 23 | 78 | 37 | 24.93 | *** | |
| HSP90 | 8 | 5 | 15 | 6 | 12.56 | *** | |
| GroEL | 50 | 45 | 63 | 45 | 7.87 | ** | |
| DnaJ | 132 | 146 | 139 | 165 | 19.78 | *** | |
| CSDP4 | Cold shock proteins | 2 | 5 | 4 | 6 | 6.52 | ** |
| ELIPS | Early light-inducible proteins | 2018 | 1995 | 2753 | 2215 | 1.65 | ns |
| ABI5 | ABA and ABA-related signalling | 74 | 42 | 59 | 59 | 41.64 | *** |
| PYL12 | 10 | 17 | 4 | 16 | 30.7 | *** | |
| ABA1 | 93 | 63 | 40 | 51 | 21.16 | *** | |
| NCED | 7 | 1 | 6 | 1 | 48.12 | *** | |
| SDR | 20 | 48 | 51 | 54 | 12.13 | *** | |
| PP2C | 294 | 358 | 303 | 438 | 18.07 | *** | |
| GLOX | 353 | 469 | 326 | 398 | 1.80 | ns | |
| CPK1 | Ca²⁺ signalling | 299 | 201 | 216 | 161 | 14.42 | *** |
| CPK4 | 81 | 40 | 47 | 32 | 9.57 | ** | |
| CPK26 | 244 | 209 | 189 | 341 | 8.20 | ** | |
| CIPK23 | 276 | 257 | 323 | 105 | 28.15 | *** | |
| CIPK3 | 230 | 229 | 260 | 104 | 28.69 | *** | |
| MSL10 | 1 | 2 | 0 | 2 | 4.41 | * | |
| CNGC4 | 175 | 142 | 146 | 131 | 3.83 | * | |
Disclaimer/Publisher’s Note: The statements, opinions and data contained in all publications are solely those of the individual author(s) and contributor(s) and not of MDPI and/or the editor(s). MDPI and/or the editor(s) disclaim responsibility for any injury to people or property resulting from any ideas, methods, instructions or products referred to in the content. |
© 2026 by the authors. Licensee MDPI, Basel, Switzerland. This article is an open access article distributed under the terms and conditions of the Creative Commons Attribution (CC BY) license (http://creativecommons.org/licenses/by/4.0/).
Copyright: This open access article is published under a Creative Commons CC BY 4.0 license, which permit the free download, distribution, and reuse, provided that the author and preprint are cited in any reuse.