

Submitted:
29 June 2026
Posted:
30 June 2026
You are already at the latest version
Abstract
Adsorptive interactions between adsorbents and toxic contaminants are significantly exploited to the advantage of water treatment goals. In this study, adsorptive interactions in aqueous solution between Pb (II) ions and a lowly toxic and structurally robust metal organic framework, zinc-trimesate framework (Zn-H3btc), were evaluated using thermodynamic, equilibrium and kinetic models to establish the capacity of the material to adsorb Pb (II) ions from water. Zn-H3btc was synthesized by refluxing mixtures of zinc nitrate and trimesic acid in DMF solvent and characterized using FTIR, SEM, EDS, PXRD, TGA and DTG methods. Adsorption experiments were carried out on basis of variation of initial concentration, contact time, pH, adsorbent dosage, and temperature. Langmuir isotherm was the best fitting isotherm. Maximum monolayer adsorption capacity of Zn-H3btc was 54.05 mg/g. Kinetic studies revealed a pseudo-second order controlled adsorption process, and hence chemisorption mechanism. The thermodynamic parameters, Gibb’s free energy, ∆G, activation energy, Ea, sticking probability, S*, and isosteric heat of adsorption ∆Hx, indicated that the adsorption process was spontaneous, and required a minimal energy barrier, however, had a fairly large amount of isosteric heat (133.39 kJ/mol) released. The findings revealed that Zn-H3btc would be effective in the adsorption of Pb (II) ions from solution.
Keywords:
adsorption
; metal-organic framework
; zinc
; trimesic acid
; lead
; equilibrium isotherm
; thermodynamics
; kinetic
1. Introduction
Industrialization drives economic growth and development, but not without associated negative impacts on earth’s resources [1]. Water pollution is one of the negative consequences of industrialization, and heavy metal pollution of water bodies is the most concerning [2]. While some heavy metals, when found at low concentrations, are essential to the physiology of humans and other living systems (Fe, Cu and Zn) [3], some others such as As, Pb, Ag, and Cd are lethal even at such low concentrations [3,4], due primarily to their high tendencies to bioaccumulate and increase to intolerable levels in the body [5].
Lead is among the prioritized metals for water quality monitoring standards of many legislations globally [6], ranked only below arsenic in terms of toxicity and potential for exposure [7,8]. Its deleterious impact on humans, vegetation and the aquatic and terrestrial fauna are well reported [3,7,9]. In humans, lead can toxify virtually every system of the body [10], and can disrupt cellular functions through two significant pathways. Firstly, lead can initiate oxidative stress through: the formation of reactive oxygen species, reduction of antioxidant defenses, cell membrane damage, inhibition of heme production enzymes, disruption of protein functions by a strong binding to their sulfhydryl groups [11,12]. Secondly, lead can displace relevant bivalent and monovalent cations such as calcium, zinc, iron and sodium to create imbalance in cell metabolism and cause significant alterations in biological processes such as cell adhesion, cellular signaling, protein folding, maturation, apoptosis, ionic transportation, enzyme regulation, and release of neurotransmitters [10,13]. In plants, lead uptake induces oxidative stress, and in addition disrupts metabolic process, and cause growth impairments [14,15].
The extent of lead toxicity depends on concentration and duration of exposure [8]. Industrially generated lead-containing waste waters pose a threat to the health of ecosystems, and humans, if they are introduced continuously into recipient bodies, poorly treated [3]. Thus, they must be subjected to thorough treatments to reduce lead levels to insignificant amounts before discharge into the environment. Maximum permissible levels for lead in treated industrial wastewater, and drinking water, as set by various environmental governing bodies such as the World Health Organization (WHO), European Union (EU), US Environmental Protection Agency (USEPA), Nigerian Federal Ministry of Environment (NFME), and South African National Standards (SANS), ranges from 0.01–0.5mg/L for treated industrial water and their receiving water body, 0.01–0.1mg/L for treated industrial wastewater meant for reuse in agricultural irrigation, and 0.001–0.01 mg/L for drinking water [16].
Wastewater treatment and water purification efforts to meet legislative criteria and standards for control of lead contamination of drinking and surface water has remained enormously challenging [24,25]. Conventional technologies for removal of lead from water include ion exchange, membrane filtration, reverse osmosis, coagulation, flocculation, bio/phytoremediation and adsorption [26,27,28]. These methods may be effective, but some have limited usage due to their high economic costs, operational difficulties and unavailability [22]. These factors necessitates the continuous innovative search for alternative technologies to existing ones, which affords the merits of improved efficiency, cost effectiveness, accessibility, availability, sustainability and environmental friendliness. This has remained a part of the global effort to tackling lead contamination of the environment [25,28,30,31].
Adsorption technology is the most prominent method for wastewater treatment and water purification [23,25] owing to its operational and design simplicity, high performance efficiency, and economic viability [23]. Although, conventional adsorbents such as activated carbons, zeolite, silica gel, and agricultural byproducts remain attractive as materials for application in heavy metals removal from water [26] recent advances in adsorptive removal of heavy metals are more focused on the application of advanced material such as graphene oxides [27], and carbon nanotubes [27,28], metal-oxide nanoparticles [29] metal-organic frameworks. These materials offer pore structures, pore sizes and surface areas that enhance adsorbent-adsorbate interactions [30].
Lead chemistry can be exploited for advantages in water treatment using relevant materials that can bind to the metal for their elimination from water [31]. Metal-organic frameworks, MOFs, are ideal choices for lead binding in water, given their numerous metal coordination spheres, functionalizable linkers and appreciable water stability [32,33].
MOFs, are hybrid materials composed of metal clusters, and organic ligands, which acts as linkers. The metal cluster are held together by the organic linkers in a repeating pattern to form a large, infinitely extended 2D or 3D framework [34]. The materials have received numerous attention due to their excellent porosity, ultrahigh surface area, tunable properties, design simplicity and wide range of applications [35].
The choice of a zinc based metal-organic framework for this pilot study was mainly due to its low toxicity, and high availability [36]. Further, trimesic acid (1,3,5-benzene tricarboxylic acid) is preferred for the Zn-MOF in this study due to its rigidity, chemical robustness and sufficient stability [37,38,39]. The combination is anticipated to produce a zinc-trimesate salt (Zn-H3btc) with various pore geometries attributable to the presence of three carboxylic acid groups.
2. Materials and Methods
2.1. List of Reagents
The following reagents were obtained from commercial sources in South Africa and used without further purifications. N,N-Dimethylformamide [HCON(CH3)2, 98%], trimesic acid (1,3,5-benzene tricarboxylic acid), methanol (CH3OH) 99.9%, Zinc(II)nitrate [Zn(NO3)2], Lead(II)nitrate [Pb(NO3)2], and polyvinyl alcohol [(CH2CH(OH))]n PVA, fully hydrolysed, were purchased from Sigma Aldrich (Johannesburg, South Africa).
2.2. Preparation of Zn-H3btc
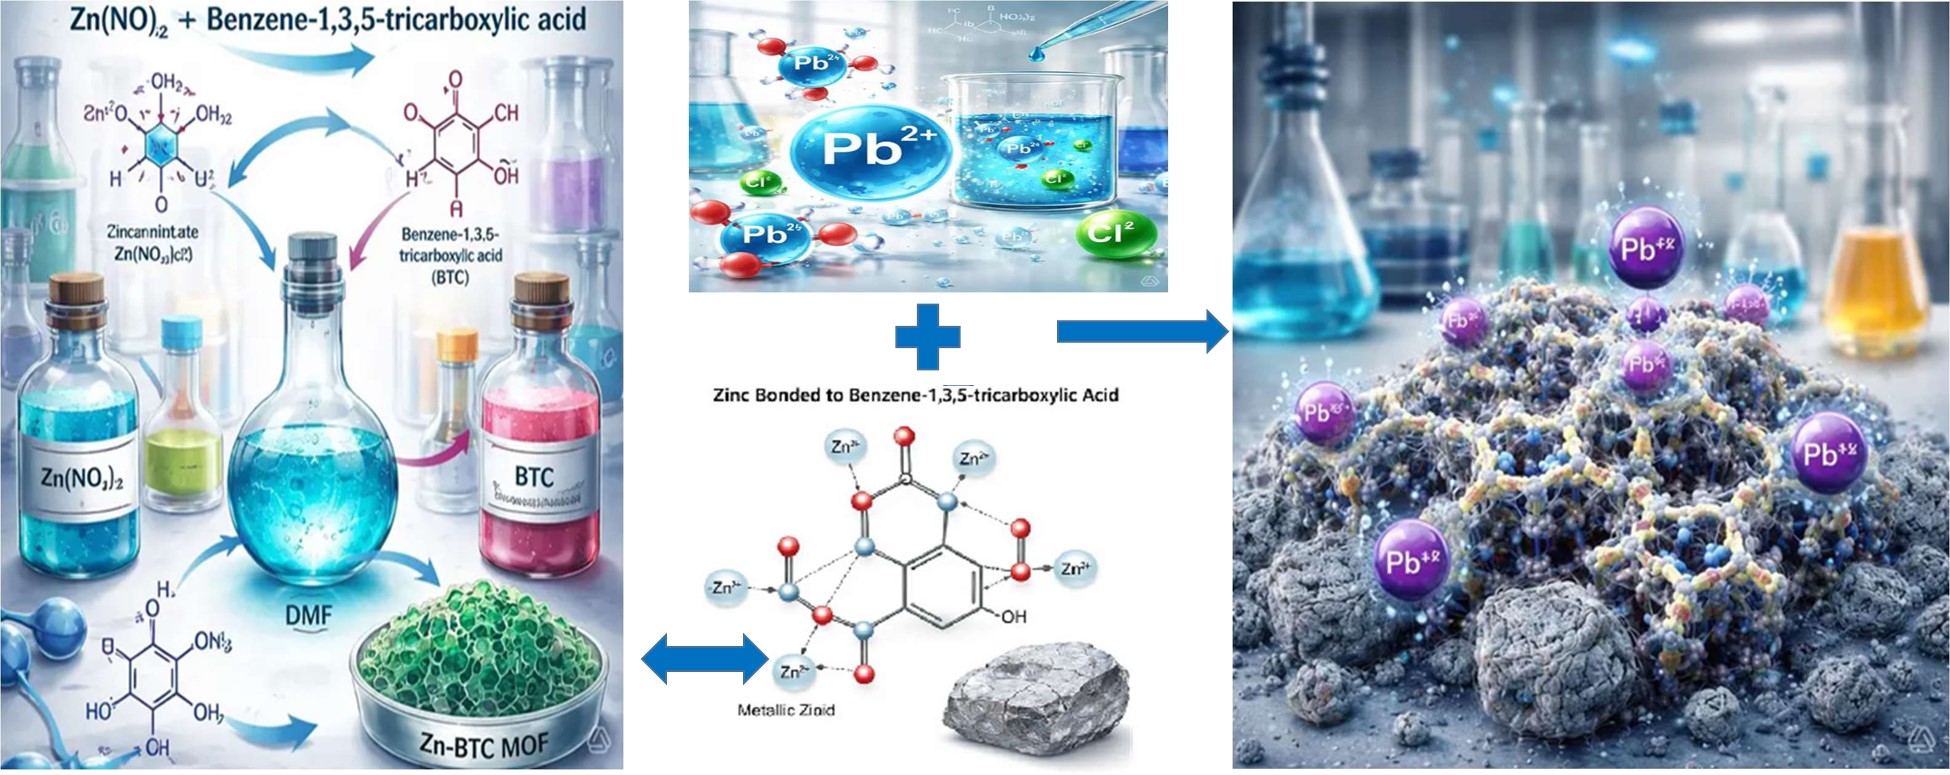
Zn-H3btc MOF was prepared based on the method described by Vala et al. (2016), with some modifications [39]. A mixture of ZnNO3.6H2O (2g), trimesic acid (2g) and DMF (40mL) were put in a beaker and stirred until the salt and the ligand were completely dissolved. The resultant solution was transferred into a round bottom flask and refluxed under continuous stirring at 100 °C for 16 h. After cooling to room temperature, the resulting white solid was filtered and washed with DMF to remove any unreacted ligand. The solid was recovered by centrifugation and washed several times with methanol to remove all traces of the occluded DMF molecules. The white powder formed was dried in an oven at 40 °C for 1h and stored in an airtight bottle.
2.3. List of Methods for Zn-H3btc Characterization
The as-synthesized Zn-H3btc was subjected to the following characterization methods in its pristine condition:
2.3.1. Fourier Transform Infrared (FT-IR):
Perkin-Elmer (USA) Spectrum 400 Model FT-IR/FT Spectrometer was used to examine the bonds and functional groups on the as-synthesized Zn-H3btc. Dry specimen of the material was placed on crystal and mounted in a near infrared (NIR) cell. The spectra were collected at spectral resolution of 4.0 cm−1. The measurement ranges for wavenumber were 4000 to 520 cm−1.
2.3.2. Thermogravimetric Analysis (TGA):
The thermogravimetric analysis of the material was carried out using a Perkin Elmer TGA 4000 thermogravimeter. The as-synthesized Zn-H3btc materials were heated in an inert nitrogen atmosphere at a gas flow rate of 3.2 bars. The dynamic measurement was made between ambient temperature and 900 °C with a ramp rate of 10 °C/min.
2.3.3. Scanning Electron Microscopy/Energy Dispersive X-Ray Spectroscopy (SEM/EDS):
Scanning electron microscopic images were acquired on a Nova NanoSEM200 operated at 10.0 kV equipped with energy dispersive X-ray spectroscopy (EDS) module from EDAX. The EDS unit was used for elemental analysis.
2.3.4. Powdered X-Ray Diffraction Analysis (PXRD):
X-ray diffractometric patterns of metal organic frameworks were studied with a Shimadzu XRD-7000 MAXIma X, diffractometer operated at 45 kV and 40 mA with monochromated copper Kα1 radiation of wavelength (ʎ = 1.540598) and Kα2 radiation of wavelength (ʎ = 1.544426). Scan speed of 1s/step and a step size of 0.03°. Equipped with Orion DC inverter chiller RKE1500B-V.
2.4. Batch Adsorption Experiments
Pb (II) adsorption studies of the pristine Zn-H3btc were carried out in a batch process using a multispeed laboratory orbital shaker, Labcon 3100U, set at a shaking speed of 100 rpm. The adsorption studies were based on variation of Pb (II) ion concentrations, contact time, solution pH, temperature and dosage of Zn-H3btc adsorbent. Working solutions were prepared from 500 mg/L stock solution made by dissolving 500 mg of PbNO3 salt in deionized water in a 1 L volumetric flask.
Effect of initial concentration were tested for initial Pb (II) ion solution concentration from 20 to 60 mg/L, using 20 mL volume of Pb (II) solution, Zn-H3btc dosage of 20 mg and agitation of Zn-H3btc/Pb (II) mixture for 50 min, while maintaining a constant temperature and pH of 25 °C and 6.9 respectively.
Effect of contact time studies were carried out for times ranging from 10–50 min, using 20 mL volume of solution, adsorbent dosage of 20 mg, Pb (II) solution concentration of 40 mg/L, while maintaining a constant temperature and pH.
Effect of pH were carried out for pH 3 to 7 using 20 mL volume of solution, adsorbent dosage of 20 mg, Pb (II) solution concentration of 40 mg/L, and agitation time of 50 min.
Variation of temperature studies were carried out in a low temperature water bath, Labcon 3095U, at temperatures of 17 °C, 28 °C, and 38 °C, using 20 mL solution volume, 20 mg of Zn-H3btc, 60 min agitation time, for five different concentrations, 20, 30, 40, 50 and 60 mg/L, and pH kept constant across all solutions.
Effect of adsorbent dosage was carried out for 10 mg, 20 mg, 30 mg, 40 mg, and 50 mg of H3-btc with 20 mL solution volume, 50 min agitation time, and constant temperature and pH.
All final concentrations of Pb (II) ion solutions after adsorption tests were analyzed using Atomic Absorption/Emission Spectrophotometer, a product of Buck Scientific, 200A (AAES).
3. Results
3.1. Characterization Study of Zn-H3btc
3.1.1. Fourier Transform Infrared (FTIR)
The FTIR spectra of Zn-H3btc is presented in Figure 1a. The spectrum is different from that of trimesic acid (Figure 1b) indicating the formation of a new product in the reaction of trimesic acid with zinc ion. The peak at 1639 cm−1 is the C=O stretching vibration of the MOF, while the small sharp peak at 1618 cm−1 is the asymmetric stretching vibration of the π-bond of the aromatic ring. The peak at 1538 cm−1 is asymmetric stretching vibration of the carboxylate group. The peaks at 1437 cm−1, a doublet, are assigned as symmetric stretching vibrations of the π-bonds of the tricarboxylate anion group. The sharp peak at 1104 cm−1 and peak at 1365 cm−1 is the C-O stretching vibration of the carboxylic acid group. This peak has shifted as result of the reaction of TMA and zinc ion. The new peak at 932 cm−1 is assigned as the O-metal vibration formed by the reaction of zinc metal with the carboxylate. The peaks at 764 to 719 cm−1 which are stretching vibrations of the benzene ring are shifted to new positions due to the reaction. The peak at 577 cm−1 is a shifted peak of the 537 cm−1 found in the TMA. This peak corresponds to the ring in and out of plane bending vibration of the benzene ring [40,41,42].
3.1.2. Scanning Electron Microscopic (SEM)
The surface morphology of the as-synthesized Zn-H3btc was determined by the scanning electron microscope. This is given Figure 2. Scanning electron microscopy (SEM) is a powerful imaging technique that enables high-resolution visualization of surface morphologies [41]. SEM works on the principle of electron beam scanning across the sample surface, and the interaction of these electrons with the surface generates various signals that provide valuable information about the sample’s topography, composition, and crystallinity. The images displayed well-defined crystalline structures, varying particle sizes, and different surface features. The transition metal ions significantly influenced the morphology and microstructure of the investigated MOF. It can be observed that Zn-H3btc displayed smaller, spherical crystals with smoother surfaces. The SEM analysis also provided insights into the porosity and interconnectivity of the MOFs, indicating their potential for application in adsorption and separations. The SEM of as-synthesized Zn-H3btc show rod-like structure which are small in size. The rod-like structure of the as-synthesized material could be an indication of a “termination” in the reaction process. The reaction of a linker and a metal ion to form an MOF is sometimes [43] assumed to be a “polymerization” type of reaction with indeterminable length. These rod-like structures are therefore an indication that this reaction propagates in a direction and not in a random order.
3.1.3. Energy Dispersive X-Ray Spectroscopy (EDS)
The EDS spectrum of Zn-H3btc (Figure 3), show the elements carbon, oxygen, zinc, and calcium (see Table 1). The presence of calcium in this as-synthesized material can be attributed to impurity from the synthesis process. The very low percentage (0.6%) of calcium also present is an indication that it is an impurity. The percentage of the elements are carbon (49.7%), oxygen (26.8%), zinc (22.8%) and calcium (0.6%). The graph shows a successful reaction between the metal and the linker trimesic acid. The elements of the MOF are at about 1.0 keV (kilo electron volt) while unreacted zinc resonated at about 8.5 keV. The graph shows a good distribution between the elements of carbon, oxygen, and zinc. There is heterogeneity and impurity originating from this synthesis. The standard deviation of 1.1, 0.9, 0.9 and 0.1 for calcium show the data points to dispersed from the mean.
3.1.4. Powdered X-Ray Diffraction (PXRD)
The powdered X-ray diffraction spectrum for zinc metal organic framework is presented in Figure 4. The diffractogram show several sharp peaks from 2 of 11.8 to 39.4. The XRD patterns of pure trimesic acid is presented to show the changes and successful synthesis of metal organic frameworks of various metals. The diffraction pattern of the trimesic acid shows characteristic peaks in the range of 2 degree from 5 to 40. The peaks at 11°, 13°, 24°, 28° and 30° corresponding to 010, 101, 020, 121 and 310 crystallographic planes. The XRD pattern of Zn-H3btc shows new peaks different from those of the trimesic acid indicating the formation of the product. The characteristic peaks of the Zn-H3btc are found at 10.8°, 12.4°, 19.4°, 23.8°, 27.9° and several others confirming the successful synthesis of Zn-H3btc.
3.1.5. Thermogravimetric & Derivative Thermogravimetric Analysis (TGA/DTG)
The thermogravimetric and derivative thermogravimetric analysis of Zn-H3btc is presented in Figure 5a. The TGA shows several weight loss regions. Weight losses are observed at 94, 145, 265, 306, 495 and 521 °C respectively. These weight loss behavior of Zn-H3btc are similar to those of previous reports for Zinc based metal-organic frameworks [40] The highest percentage weight loss of about twenty percent, in the synthesized MOF occurred at about 521 °C. The Zn-H3btc becomes stable with increase in temperature from 521 to 900 °C. These weight loss regimes in Zn-H3btc is indicative of several absorbed molecules. This thermal decomposition behavior of Zn-H3btc highlights its suitability for application in water as an adsorbent.
The derivative or differential thermogravimetric analysis of Zn-H3btc (Figure 5b) show the peak temperatures during the decomposition process. The graph shows five endothermic processes at 145, 265, 306, 495 and 521 °C respectively.
3.2. Variation of Adsorption Parameters: Initial Concentration, pH, Contact Time, Adsorbent Dosage and Temperature
The results of the effect of initial concentration on the performance of Zn-H3btc in the adsorption of lead ions in solution, investigated for the concentrations 20, 30, 40, 50 and 60 mg/L are presented in Figure 6a. The plot of percentage adsorption against concentration, show that the percentage of Pb (II) ions adsorbed from the respective solutions were 80.818, 53.786, 50.649, 51.417 and 64.257%, revealing that the adsorption percentage tends to decrease as initial concentration of Pb (II) in solution increased. Nevertheless, while percentage adsorption decreased, adsorption capacity increased with increase in initial concentration. The calculated values were 16.164, 16.136, 20.260, 25.709, and 38.554 mg/g. This result indicates the presence of numerous active sites on the metal-organic framework for adsorption of Pb (II) ions.
The effect of pH on adsorption capacity of Zn-H3btc for Pb (II) is presented in Figure 6b. The plot of adsorption capacity, Qe (mg/g) against pH, show the adsorption of lead ions in solution to increase with increase in pH from pH 3.0 and peaked at pH of 6.0 with percentage Pb (II) ion adsorption of 96.448%. Beyond this pH (pH 6), percentage adsorption began to decrease. This in effect, suggest that the surface area of the MOF was completely occupied by lead ions. From the result, we find that the optimum removal efficiency of the lead ions occur in the pH range 5–7. Below this range, Pb (II) ion tends to face competition with high concentration of H+ for active sites on the adsorbent.
The effect of time for adsorption of lead ions onto Zn-H3btc is presented in Figure 6c. The plot of percentage adsorption against time in minutes, show the adsorption of lead ions in solution to increase with increase in time. The maximum adsorption of lead ions took place at 10 min. This relative short time required to reach equilibrium is an indication of rapid uptake of lead ions.
The effect of Zn-H3btc dosage on percentage of Pb (II) ion adsorbed is presented in Figure 6d. The plot of percentage adsorbed against adsorbent dosage (g), show that the adsorption of lead ions in solution increased with increase in adsorbent dosage from 0.01 g to 0.04 g. At an adsorbent dosage of 0.04g, the percentage adsorbed was 72.19%. This shows that at lower adsorbent concentration, number of active sites for adsorption is lower.
The effect of temperature on adsorption of Pb (II) ions onto Zn-H3btc is presented in Figure 6e,f, respectively representing plots of adsorption capacity, Qe (mg/g) against inverse of absolute temperature, 1/T, and plot of percentage adsorbed at different solution concentrations. Plot of Qe against inverse of absolute temperature (Figure 6e) show an increase in adsorption capacity with increase in concentration. On the other hand, percentage adsorbed decreased as temperature increased (Figure 6f). Temperature therefore affected adsorption of Pb (II) ions on the as-synthesized Zn-H3btc.
3.3. Adsorption Data Evaluation
Various equilibrium, kinetic and thermodynamic models (equations) were employed to interpret the data and establish the extent of adsorption. The uptake capacity of Zn-H3btc for Pb (II) ion was computed using the material balance equation for batch adsorption studies:
Where is adsorption capacity, mg/g, of Zn-H3btc, is metal ion concentration in solution, mg/L, at equilibrium, C0, the initial metal ion solution (mg/L), V, the volume of solution in litres and M, the dry weight of Zn-H3btc used in (g).
3.4. Equilibrium Isotherms
The equilibrium isotherms applied on the experimental data were the Langmuir, Freundlich and Temkin isotherms.
Langmuir: This isotherm represents monolayer or single adsorbate layer coverage of a homogenous surface. The linear form of the equation is given in Equation (2) below:
Where Ce, Qe, Qm, and KL represents adsorbate concentration at equilibrium, adsorption capacity of adsorbent, maximum monolayer adsorption capacity of adsorbent at equilibrium and Langmuir equilibrium constant, respectively. The Langmuir isotherm was obtained by plotting Ce/Qe against Ce. The essential feature of the Langmuir isotherm is the separation factor Sf, a dimensionless parameter applied to predict favorability of adsorption [44].
Where is initial concentration of adsorbate in solution. A value of > 1, indicates unfavourable adsorption, = 1 represents linear adsorption, 0 < < 1 indicates favourable adsorption, while = 0 irreversible adsorption.
Freundlich Isotherm: Herbert Freundlich adsorption isotherm is suitable for heterogeneous systems and is specifically for a multilayer adsorption. The equation is written as:
Where Qe and Ce are adsorption capacity and concentration at equilibrium respectively. The isotherm was obtained by plotting ln Qe versus ln Ce from which the constants KF and n were derived from the intercept and slope respectively. KF is the Herbert Freundlich adsorption capacity that indicates whether the adsorption system under investigation is favourable and how well the adsorption occurred. n is the adsorption intensity or hopping number, and denotes the favourability and fitness of the Freundlich model. Values of the reciprocal of the hopping number, 1/n, that are <1 but >0 indicates adsorption favourability [45,46].
Temkin: The Temkin adsorption isotherm focuses on the heat of adsorption during the adsorption process. Temkin isotherm stems from the understanding that adsorption heat, heat resulting from molecular interactions, between adsorbate and adsorbent during sorption will decrease with corresponding increase in surface coverage. The linear equation is presented in Equation (5).
Where Qe and Ce are adsorption capacity and concentration at equilibrium respectively. KT and BT are constants representing Temkin’s isotherm constant and heat of adsorption respectively. R and T are universal gas constant and absolute temperature respectively. Plots of Qe versus ln Ce provides BT as the slope and KT as intercept.
The residual plots for all three adsorption isotherms are presented in Figure 7. The values of the parameters are given in Table 2. A comparison of correlation coefficients, R2 values reveal that among the isotherms applied, the Langmuir adsorption isotherm is the best fitting isotherm for the adsorption of Pb (II) onto Zn-H3btc. This implies a dominance of monolayer adsorption. However, contrastingly, a multilayer adsorption was reported in a previous study which investigated the adsorption of Pb (II) ions by Zn-terephthalate framework (Zn-H2bdc) [5]. With the Freundlich isotherm’s R2 value also being fairly high (0.9256), is an indication of the possibility of a multilayer adsorption occurring concurrently, but to a lesser extent. The Langmuir monolayer maximum adsorption capacity was found to be 54.05 mg/g. This is a fairly large value and indicates adsorption favorability. This favourability is confirmed by the values of the separation factor, Sf, being 0 < Sf < 1 (Figure 8). In addition, the Freundlich constant’s value of 77.74 mg/g (L/mg)1/n, the reciprocal of the hopping number, 1/n, being 0.25 all suggests favourability and seamless binding of Pb (II) onto Zn-H3btc. The Temkin isotherm constant, KT is the equilibrium binding constant corresponding to the maximum binding energy. The calculated value of 5.459 L/g is fairly high, indicating a sufficient binding energy for interaction between Pb (II) and surfaces of Zn-H3btc. BT is the same as the adsorption heat (q), and exhibits a linear relationship with enthalpy as shown in Equation (6) [47].
From Equation (6), it is observed that the positive BT value obtained, 66.26 J/mol, correlates an adsorption process characterized by a decrease in adsorption heat, which by implication is exothermic.
3.5. Adsorption Kinetics
Kinetic models are useful for determining mechanisms of adsorptions as well as the optimum operating conditions in case of upscaling. Zero, first, second, pseudo-second order kinetic equations were applied to the batch adsorption data obtained. Their respective linear equations are given in Equations (7) to (11).
Zero order:
Qt = k0 t.
First order
ln Ct = ln C0 − k1t.
Second order
Pseudo-first order
First order
ln Qe − Qt = ln Qe − k1t.
Pseudo-second order
Where Qt is adsorption capacity at time, t, Qe represent adsorption capacity at equilibrium, Ct, k0, k1, k2 are zero order, first order, and second order rate constants respectively. The graphical plots are presented in Figure 9. The kinetic equations for zero, first, second, and pseudo-first orders did not produce straight line plots. The plot for a pseudo-second order (Figure 9e) reaction produced a straight line. This is an indication that the adsorption of Pb (II) ions on Zn-H3btc followed pseudo-second order kinetics, which is based on the mechanism of chemisorption.
3.6. Intra-Particle Diffusion
Intra-particle diffusion process is characterized by a relationship between the adsorption capacity at time, t (denoted by Qt) and the square root of time (√t). This is presented in equation 12 below:
Where C is a proportionality constant corresponding to the boundary layer thickness and Ki is intra-particle rate constant (mg/g min½). Ki and C are obtained as slope and intercept respectively when Qt is plotted against t½. As reported by Weber and Morris (1963), if the rate limiting step is due to intra-particle diffusion, then a plot of Qt versus t½ will yield a straight line passing through the origin. If the plot does not pass through the origin, then it is an indication that some degree of boundary layer control is in operation and some other kinetic models other than intra-particle diffusion may have controlled the adsorption process [48].
Graphical plots of intra-particle diffusion kinetics are presented in Figure 10 and the findings presented as a summary in Table 3. As is observed, the plot does not pass through the origin and it is not a straight line, an indication that the rate limiting is not intra-particle diffusion. Rather, given the correlation coefficient, R2, values from the pseudo second order kinetic model, it is clear that the movement of adsorbate particles in the adsorbent could be explained better by pseudo second order kinetics.
3.7. Thermodynamic Studies
Thermodynamic evaluation of the adsorption of Pb (II) ions on the as-synthesized Zn-H3btc were carried out by determining the following parameters: isosteric heat of adsorption, , activation energy, Ea, sticking probability, S*, Standard Gibb’s free energy change ΔG0, change in enthalpy, ΔH0, and change in entropy, ΔS0. These parameters were calculated from the Clausius-Clapeyron, Arrhenius, Van’t Hoff, and Gibbs equations, presented in equations 12 to 15 respectively [49].
Where R is gas constant in kilojoules, Ce is equilibrium concentration of Pb (II) ions, T is absolute temperature of solution, and K is a constant. was derived from the slope when ln Ce was plotted against 1/T.
While is the surface coverage, Ea, and S*, the energy of activation and sticking probability respectively were derived from the slope and intercept of the plot of ln (1 − ) against 1/T.
Kc is a constant derived from the ratio of the adsorption capacity of adsorbent, Qe, to the equilibrium concentration of adsorbate, Ce. ΔH0 and ΔS0 were derived from the slope and intercept respectively, when ln Kc values were plotted against values of the reciprocal of the absolute temperature, 1/T.
ΔG was derived using the Gibbs equation shown below.
The plots of the thermodynamic variables are presented in Figure 11a–c. The values of the parameters are presented in Table 4 and Table 5. It can be observed from Table 4 that the values of ΔG are negative, indicating that the adsorption process was spontaneous.
Important thermodynamic indicators of adsorption favorability are the Activation Energy (Ea), Sticking Probability (S*), and Isosteric Heat of Adsorption (ΔHx). These are presented in Table 5. Activation energy (Ea), of a reaction is considered as the magnitude of the potential barrier on a surface with respect to the initial and final thermodynamic states. If the activation energy of an adsorption process falls in the range 5 to 40 kJ/mol, the process is considered to be physiosorption. If above 40 kJ then it is regarded as chemisorption dominated process [50]. The derived activation of 14.42 kJ for Pb (II) on Zn-H3btc indicates a favorably low adsorption barrier, such that could be achieved even at room temperature.
The sticking probability, S*, is a measure of the potential of an adsorbate to remain on the adsorbent. Sticking probability are categorized as follows:
S* > 1. Adsorbate unsticking to adsorbent, no sorption;
S* = 1, Linear sticking relationship between adsorbate and adsorbent. A possible mixture of physisorption and chemisorption;
S* = 0. Indefinite sticking of adsorbate to adsorbent, chemisorption mechanism predominant.
0 < S* < 1. Favourable sticking of adsorbate to adsorbent, physisorption mechanism predominant.
A value of 0.014 obtained from the Arrhenius equation plot indicate a favorable sticking of Pb (II) onto the investigated Zn-H3btc.
The Isosteric heat of adsorption, is a measure of the enthalpy of an adsorption process, and a measure of the quantity of heat released in the course of an adsorption [50]. It also reveals the mechanism of an adsorption process, whether by physisorption or by chemisorption. Physisorption is often characterized by low isosteric heat of adsorption (<80.0 kJ/mol). On the other hand, when the heat released during adsorption is above 80 kJ/mol and up to 400 kJ/mol, the process is chemisorption, and involves actual breaking/formation of chemical bonds [51]. The value of the isosteric heat of adsorption for this study was calculated to be 133.39 kJ/mol (Table 5). This high value is an indication of a chemisorptive interaction between Pb (II) ion and Zn-H3btc, envisaged in some reports as a displacement of Zn (II) ions in the MOF structure by Pb (II) ions [17]. This observation does not agree with the result of the activation energy (14.42 kJ/mol) which depicts a physisorption process. The adsorption process under investigation could be a typical case of a two-stage adsorption where physisorption occur before chemisorption [52].
+k2t.
Pseudo-first order
ln Qe − Qt = ln Qe − k1t.
Pseudo-second order
Where Qt is adsorption capacity at time, t, Qe represent adsorption capacity at equilibrium, Ct, k0, k1, k2 are zero order, first order, and second order rate constants respectively. The graphical plots are presented in Figure 9. The kinetic equations for zero, first, second, and pseudo-first orders did not produce straight line plots. The plot for a pseudo-second order (Figure 9e) reaction produced a straight line. This is an indication that the adsorption of Pb (II) ions on Zn-H3btc followed pseudo-second order kinetics, which is based on the mechanism of chemisorption.
4. Discussion
This study has included Zn-H3btc to the growing list of adsorbents for removal of lead ions from water, with its high maximum monolayer adsorption capacity of 54.05 mg/g. A table of comparison of Zn-H3btc with existing natural and synthetic adsorbents for lead removal is presented in Table 6. It is shown that Zn-H3btc outperforms many conventional lignocellulosic materials reported in literature [60,61], and also observed to perform relatively good in a much shorter contact time and much lower initial lead ion concentration, compared to the experimental conditions reported for some highly performed activated materials, and functionalized MOFs [62,63,64].
The Pb (II) ion adsorption capacity of Zn-H3btc obtained from this study presents it as an adsorbent for a potential industrial wastewater application, in its pristine condition. Future direction of research to validate its applicability could focus on adopting other eco-friendlier synthesis methods, such as hydrothermal or mechanochemical methods. In addition its pore size distribution, average crystallite size, surface area and surface charges, all of which were not carried out in this present study, should be resolved. These would enable a more vivid interpretation of its adsorption performance. Further, studies on its reusability and capacity for a multi-stage utilization in wastewater treatment could also be significant in the validation of the findings of this study. However, performance upscaling studies involving functionalization and/or surface modification with the use of eco-unfriendly chemicals are not recommended.
5. Conclusions
A metal organic framework, Zn-H3btc, was synthesized by mixing zinc ions and trimesic acid, for application as a robust lowly toxic porous material for removal of Pb (II) ions from water, as part of the global effort to curb lead pollution. The study involved the characterization of the material using relevant instrumental technologies, including Fourier transform infrared spectroscopy, powdered x-ray diffraction, scanning electron microcopy, energy dispersive X-ray spectroscopy, thermogravimetry, and differential thermogravimetry. These did confirm the successful preparation of the metal-organic framework and revealed its characteristics intrinsic properties. The material was used in its pristine condition for adsorption of Pb (II) ions from aqueous solutions. The adsorption study was carried out with respect to variation of initial concentration of Pb (II) ion, contact time, pH, adsorbent dosage, and temperature, thereafter, the measured data were analyzed with relevant thermodynamic, equilibrium, and kinetic model equations, including Arrhenius, Clausius-Clapeyron, van’t Hoff, and Gibb’s, Langmuir isotherm, Freundlich isotherm, Temkin isotherm, zero-order kinetics, first-order kinetics, second-order kinetics, pseudo-first order kinetics and pseudo-second order kinetic equations. The adsorption data revealed that adsorption capacity of Zn-H3btc increased as initial concentration of Pb (II) solution increased. A contact time of 10 min was enough for completion of adsorption from a solution of concentration 40 mg/L, pH ~ 6.9 and temperature of 298K. Optimum pH of adsorption occurred in the pH range 5–7. Percentage adsorption decreased with increase in temperature. Langmuir isotherm was the best fitting isotherm. The maximum adsorption capacity of Zn-H3btc for Pb (II) ions was 54.05 mg/g. This value indicated fairly good Pb (II) ion adsorption performance by the investigated adsorbent. Values of other Langmuir parameters such as the separation factor (0 < Sf < 1) also depicted Pb (II) ion adsorption favorability. The kinetic study revealed that the adsorption process was pseudo-second order controlled, and hence a chemisorptive process. Thermodynamic parameters such as Gibb’s free energy , activation energy, Ea, sticking probability, S*, and isosteric heat of adsorption, indicated that the adsorption process was spontaneous, required a minimal energy barrier, however, had a fairly large amount of isosteric heat released, further confirming its chemisorptive nature. The findings revealed that Zn-H3btc would be effective in the adsorption of Pb (II) ions from solution.
Supplementary Materials
The following supporting information can be downloaded at the website of this paper posted on Preprints.org.
Author Contributions
Conceptualization, F.M. and C.D.; methodology, C.D.; software, C.D.; validation, C.D., F.M. and S.U.; formal analysis, C.D. and S.U; investigation, C.D. and S.U; resources, C.D., F.M. and S.U.; data curation, C.D and S.U.; writing—original draft preparation, C.D. and S.U.; writing—review and editing, C.D., F.M. and S.U.; visualization, C.D. and S.U.; supervision, F.M.; project administration, C.D. and S.U.; funding acquisition, F.M. All authors have read and agreed to the published version of the manuscript.
Funding
This research was funded by Center for Scientific and Industrial Research, South Africa. The APC was funded by Vaal University of Technology, Vanderbijlpark, South Africa.
Data Availability Statement
The original contributions presented in this study are included in the article/Supplementary Material. Further inquiries can be directed to the corresponding author.
Acknowledgments
The authors wish to acknowledge the management of Vaal University of Technology Vanderbijlpark, South Africa whose administration provided access to resources for the accomplishment of this research. They also wish to acknowledge and thank Professor Ezekiel Dixon Dikio for his invaluable role during this research, lending his vast experience, knowledge and technical support.
Conflicts of Interest
The authors declare no conflicts of interest.
Abbreviations
The following abbreviations are used in this manuscript:
| Zn | Zinc |
| btc | Benzene-1,3,5-tricarboxylic acid |
| Pb | Lead |
| mg | Milligram |
| L | Liter |
| kJ | kilojoules |
References
- Alorabi, A.Q. Effective Removal of Malachite Green from Aqueous Solutions Using Magnetic Nanocomposite: Synthesis, Characterization, and Equilibrium Study. Adsorpt. Sci. Technol. 2021, 2021, 1–15. [Google Scholar] [CrossRef]
- Hammud, H.H.; El-Shaar, A.; Khamis, E.; Mansour, E.-S. Adsorption Studies of Lead by Enteromorpha Algae and Its Silicates Bonded Material. Adv. Chem. 2014, 2014, e205459. [Google Scholar] [CrossRef]
- Fisher, R.M.; Gupta, V. Heavy Metals. In StatPearls; StatPearls Publishing: Treasure Island, FL, USA, 2026. [Google Scholar]
- Agbozu, I.E.; Opuene, K.; Ukachuku, S. Adsorption of Lead ions from aqueous solution by sawdust waste. J. Nig. Env. Soc. 2008, 4, 67–71. [Google Scholar] [CrossRef]
- Ukachuku, S.; Dikio, D.E. Aqueous sequestration of Lead Ions by Zn-based metal-organic framework (MOF5): Equilibrium, kinetics, and pH studies. Worl D. News Nat. Sci. 2023, 49, 1–13. [Google Scholar]
- Environment, U.N. Lead|UNEP—UN Environment Programme. Available online: https://www.unep.org/topics/chemicals-and-pollution-action/chemicals-management/pollution-and-health/heavy-metals/lead (accessed on 14 March 2026).
- Pourrut, B.; Shahid, M.; Dumat, C.; Winterton, P.; Pinelli, E. Lead uptake, toxicity, and detoxification in plants. Rev. Env. Contam. Toxicol. 2011, 213, 113–136. [Google Scholar] [CrossRef] [PubMed]
- Ilyas, M.Z.; Sa, K.J.; Ali, M.W.; Lee, J.K. Toxic effects of lead on plants: Integrating multi-omics with bioinformatics to develop Pb-tolerant crops. Planta 2024, 259, 18. [Google Scholar] [CrossRef] [PubMed]
- Knollmann-Ritschel, B.E.C.; Markowitz, M. Lead Poisoning. Acad. Pathol. 2017, 4, 2374289517700160. [Google Scholar] [CrossRef] [PubMed]
- Wani, A.L.; Ara, A.; Usmani, J.A. Lead toxicity: A review. Interdiscip. Toxicol. 2015, 8, 55–64. [Google Scholar] [CrossRef] [PubMed]
- Lopes, A.C.B.A.; Peixe, T.S.; Mesas, A.E.; Paoliello, M.M.B. Lead Exposure and Oxidative Stress: A Systematic Review. Rev. Env. Contam. Toxicol. 2016, 236, 193–238. [Google Scholar] [CrossRef] [PubMed]
- Flora, G.; Gupta, D.; Tiwari, A. Toxicity of lead: A review with recent updates. Interdiscip. Toxicol. 2012, 5, 47–58. [Google Scholar] [CrossRef] [PubMed]
- Jaishankar, M.; Tseten, T.; Anbalagan, N.; Mathew, B.B.; Beeregowda, K.N. Toxicity, mechanism and health effects of some heavy metals. Interdiscip. Toxicol. 2014, 7, 60–72. [Google Scholar] [CrossRef] [PubMed]
- Ali, M.; Nas, F.S. The effect of lead on plants in terms of growing and biochemical parameters: A review. MOJ Ecol. Environ. Sci. 2018, 3. [Google Scholar] [CrossRef]
- Gupta, M.; Dwivedi, V.; Kumar, S.; Patel, A.; Niazi, P.; Yadav, V.K. Lead toxicity in plants: Mechanistic insights into toxicity, physiological responses of plants and mitigation strategies. Plant Signal Behav. 2024, 19, 2365576. [Google Scholar] [CrossRef] [PubMed]
- Guidelines for Drinking-Water Quality—NCBI Bookshelf. Available online: https://www.ncbi.nlm.nih.gov/books/NBK579461/ (accessed on 14 March 2026).
- Lead Regulations|US EPA. Available online: https://www.epa.gov/lead/lead-regulations (accessed on 1 April 2026).
- EU Law on Lead in Drinking Water: A Guide to Compliance—Aquatechnik. Available online: https://www.aquatechnik.it/en/guide-to-the-new-eu-regulations-on-potable-water/ (accessed on 1 April 2026).
- Pratap, B.; Nand, S.; Kumar, S.; Kumar, P.; Bharagava, R.N.; Dutta, V. Assessment of Water Quality Status and Heavy Metals Contamination in River Kali-East, India using Pollution Indexes and Health Hazards. Wat. Air Soil Pollut. 2025, 236, 246. [Google Scholar] [CrossRef]
- aodesign, “Is Your Borehole Water Safe to Drink?|Borehole Water Quality & SANS 241 Standards,” GEOSS South Africa (Pty) Ltd. Available online: https://geoss.co.za/is-your-borehole-water-safe-to-drink/ (accessed on 1 April 2026).
- Maliehe, T.S.; Mavingo, N.; Selepe, T.N.; Masoko, P.; Mashao, F.M.; Nyamutswa, N. Quantitative Assessment of Human Health Risks Associated with Heavy Metal and Bacterial Pollution in Groundwater from Mankweng in Limpopo Province, South Africa. Int. J. Envir. Res. Public Health 2024, 21, 1489. [Google Scholar] [CrossRef]
- Nag, R.; Cummins, E. Human health risk assessment of lead (Pb) through the environmental-food pathway. Sci. Total Envir. 2022, 810, 151168. [Google Scholar] [CrossRef]
- Kinuthia, G.K.; Ngure, V.; Beti, D.; Lugalia, R.; Wangila, A.; Kamau, L. Levels of heavy metals in wastewater and soil samples from open drainage channels in Nairobi, Kenya: Community health implication. Sci. Rep. 2020, 10, 8434. [Google Scholar] [CrossRef]
- Yang, J.; Bai, H.; Zhang, F.; Liu, J.; Winarta, J.; Wang, Y.; Mu, B. Effects of Activation Temperature and Densification on Adsorption Performance of MOF MIL-100(Cr). J. Chem. Eng. Data 2019, 64, 5814–5823. [Google Scholar] [CrossRef]
- Vidu, R.; Matei, E.; Predescu, A.M.; Alhalaili, B.; Pantilimon, C.; Tarcea, C.; Predescu, C. Removal of Heavy Metals from Wastewaters: A Challenge from Current Treatment Methods to Nanotechnology Applications. Toxics 2020, 8, 101. [Google Scholar] [CrossRef] [PubMed]
- Yirdaw, G. Efficient removal of lead (II) from paint factory wastewater using Noug stalk activated carbon: A sustainable adsorption approach. Heliyon 2025, 11, e42281. [Google Scholar] [CrossRef] [PubMed]
- Ahmad, I.; Asad, U.; Maryam, L.; Masood, M.; Saeed, M.F.; Jamal, A.; Mubeen, M. Treatment Methods for Lead Removal from Wastewater. In Lead Toxicity: Challenges and Solution; Kumar, N., Jha, A.K., Eds.; Environmental Science and Engineering; Springer Nature Switzerland: Cham, Switzerland, 2023; pp. 197–226. ISBN 978-3-031-37326-8. [Google Scholar]
- Sanjay, K.; Kumar, A.G. Lead removal from industrial wastewater: A review of removal methods. Int. J. Creat. Res. Thoughts 2021, 9, 68–71. [Google Scholar]
- Kumar, V.; Dwivedi, S.K.; Oh, S. A critical review on lead removal from industrial wastewater: Recent advances and future outlook. J. Water Process Eng. 2022, 45, 102518. [Google Scholar] [CrossRef]
- Worku, A.K.; Ayele, D.W.; Teshager, M.A.; Omar, M.; Yerkrang, P.P.; Elgaddafi, R.; Alemu, M.A. Recent advances in wastewater treatment technologies: Innovations and new insights. Energy Rev. 2025, 4, 100164. [Google Scholar] [CrossRef]
- López-Jiménez, J.M.; Alvizuri-Tintaya, P.A.; Chávez-Lizárraga, G.A.; Lo-Iacono-Ferreira, V.G.; Torregrosa-López, J.I.; Lora-García, J. Lead Removal by Reverse Osmosis: Seeking Sustainability in the Operation of Advanced Technologies: A Preliminary Study. Sustainability 2025, 17, 7270. [Google Scholar] [CrossRef]
- Hussain, A.; Ahmed, S. (Eds.) Advanced Treatment Techniques for Industrial Wastewater; Advances in Environmental Engineering and Green Technologies; IGI Global: Hershey, PA, USA, 2019; ISBN 978-1-5225-5754-8. [Google Scholar]
- Wojtkowska, M.; Barszcz, W.; Bogacki, J. Comparative study of Waste-Derived and conventional sorbents for heavy metal removal from water. Sci. Rep. 2025, 15, 45188. [Google Scholar] [CrossRef] [PubMed]
- Syed, S.S.; Jacob, L.; Banat, F.; Rizk, N.; Segneri, V.; Alam, K.; Hai, A. Adsorption of heavy metal ions and organic pollutants from refining wastewater by magnetically synthesized silver nanoparticles coated with graphene oxide. Sci. Rep. 2026, 16, 7681. [Google Scholar] [CrossRef] [PubMed]
- Kakar, U.M.; Tauanov, Z.; Azet, S.; Ahmadi, N.A.; Hassand, M.H.; Sarwari, A.; Monib, A.W.; Niazi, P. Carbon Nanotubes as Adsrbents for Heavy Metals: Hydrargyrum Removal from Water. J. Chem. Stud. 2024, 3, 7–20. [Google Scholar]
- Tesi, O.G.; Ukachuku, S.; Kpomah, B.; Overah, L.C.; Akpeji, B.H.; Dolor, A.O.; Okpara, K.E.; El-Mansi, M. SYNTHESIS AND CHARACTERIZATION OF MAGNETITE-Eichornia crassipes NANOCOMPOSITE BY CHEMICAL CO-PRECIPITATION METHOD FOR VARIOUS APPLICATIONS. J. Chem. Soc. Niger. 2025, 50, 352–362. [Google Scholar]
- Ul Haq, I.; Ahmad, W.; Ahmad, I.; Shah, A.; Yaseen, M.; Muhammad, T. Integrated Photocatalytic Oxidation and Adsorption Approach for the Robust Treatment of Refinery Wastewater Using Hybrid TiO2/AC. Catalysts 2023, 13, 193. [Google Scholar] [CrossRef]
- Mekonen Ayele, N. Efficient Removal Lead (II) from the Environment by Adsorption Using Low-Cost Adsorbent Materials. Am. J. Mech. Mater. Eng. 2022, 6, 1. [Google Scholar] [CrossRef]
- Ukachuku, S.; Dikio, E.D. Aqueous sequestration of Lead Ions by Zn-based metal-organic framework (MOF5): Equilibrium, kinetics, and pH studies. World News Nat. Sci. 2023, 49. [Google Scholar] [CrossRef]
- Ihsanullah, I. Applications of MOFs as adsorbents in water purification: Progress, challenges and outlook—ScienceDirect. Curr. Opin. Environ. Sci. Health 2022, 26, 100335. [Google Scholar]
- Sharmin, E.; Zafar, F. Introductory Chapter: Metal Organic Frameworks (MOFs). In Metal-Organic Frameworks; Zafar, F., Sharmin, E., Eds.; InTech: London, UK, 2016; ISBN 978-953-51-2662-1. [Google Scholar]
- Eddaoudi, M.; Kim, J.; Rosi, N.; Vodak, D.; Wachter, J.; O’Keeffe, M.; Yaghi, O.M. Systematic Design of Pore Size and Functionality in Isoreticular MOFs and Their Application in Methane Storage. Science 2002, 295, 469–472. [Google Scholar] [CrossRef] [PubMed]
- Abdelwahab, M.A.; Abdelhamid, A.M.; Eliwa, A.S.; Abdelhamid, A.M.; Abdelhady, S.; Auf, S.; Awad, H.A.; Abdelkader, R.M.; Ghanem, J.; Mohamed, M.H.; et al. Synthesis and characterization of novel zinc–organic framework for the effective removal of Alizarin Red S. Sci. Rep. 2025, 15, 43275. [Google Scholar] [CrossRef] [PubMed]
- Chattopadhyay, K.; Mandal, M.; Maiti, D.K. A review on zirconium-based metal–organic frameworks: Synthetic approaches and biomedical applications. Mater. Adv. 2024, 5, 51–67. [Google Scholar] [CrossRef]
- Felix Sahayaraj, A.; Joy Prabu, H.; Maniraj, J.; Kannan, M.; Bharathi, M.; Diwahar, P.; Salamon, J. Metal–Organic Frameworks (MOFs): The Next Generation of Materials for Catalysis, Gas Storage, and Separation. J. Inorg. Organomet. Polym. 2023, 33, 1757–1781. [Google Scholar] [CrossRef]
- Vala, R.; Wankasi, D.; Dikio, E. Morphology and adsorption of chromium ion on uranium 1,2,4,5-benzenetetracarboxylic acid metal organic framework (MOF). Hem. Ind. 2016, 70, 565–572. [Google Scholar] [CrossRef]
- Dikio, D.E.; Farah, A.M. Synthesis, Characterization and Comparative Study of Copper and Zinc Metal Organic Frameworks. Chem. Sci. Trans. 2013, 2. [Google Scholar] [CrossRef]
- Sarawade, P.; Tan, H.; Polshettiwar, V. Shape- and Morphology-Controlled Sustainable Synthesis of Cu, Co, and In Metal Organic Frameworks with High CO2 Capture Capacity. ACS Sustain. Chem. Eng. 2013, 1, 66–74. [Google Scholar] [CrossRef]
- Shooto, N.; Wankasi, D.; Sikhwivhilu, L.; Dikio, E. Modified Electro-spun Polyvinyl Alcohol Nanofibers Used as Super Adsorbing Material for Lead Ions in Aqueous Solution. J. Res. Sci. Teach. 2016, 13, 233–242. [Google Scholar] [CrossRef] [PubMed]
- Ma, Z.; Zou, J.; Hu, C.; Zhu, W.; Khan, D.; Zeng, X.; Ding, W. Effects of trimesic acid-Ni based metal organic framework on the hydrogen sorption performances of MgH2. Int. J. Hydrogen Energy 2019, 44, 29235–29248. [Google Scholar] [CrossRef]
- Sun, C.-J.; Sun, L.-Z.; Sun, X.-X. Graphical Evaluation of the Favorability of Adsorption Processes by Using Conditional Langmuir Constant. Ind. Eng. Chem. Res. 2013, 52, 14251–14260. [Google Scholar] [CrossRef]
- Chiban, M.; Soudani, A.; Sinan, F.; Persin, M. Single, binary and multi-component adsorption of some anions and heavy metals on environmentally friendly Carpobrotus edulis plant. Colloids Surf. B Biointerfaces 2011, 82, 267–276. [Google Scholar] [CrossRef] [PubMed]
- Singh, A.K. Nanoparticle Ecotoxicology. In Engineered Nanoparticles; Elsevier: Amsterdam, The Netherlands, 2016; pp. 343–450. ISBN 978-0-12-801406-6. [Google Scholar]
- Ukachuku, S.; Abasi, C.Y. Solid-Liquid sorption studies of Ni, Cd, and Pb on unmodified and modified avocado pear seed. Ann. Appl. Sci. 2021, 7, 23–28. [Google Scholar] [CrossRef]
- Weber, W.J.; Morris, J.C. Kinetics of Adsorption on Carbon from Solution. J. Sanit. Engrg. Div. 1963, 89, 31–59. [Google Scholar] [CrossRef]
- Ukachuku, S.; Dikio, E.D. Comparative Evaluation of the Adsorptive Affinity of Zn-H2¬BDC/H3BTC Framework for Cationic and Anionic Dyes: Equilibrium, Kinetic and Thermodynamic Approach. Asian J. Chem. 2026, 38, 1599–1612. [Google Scholar] [CrossRef]
- Girish, C.R. Determination of thermodynamic parameters in adsorption studies: A review. Chem. Pap. 2025, 79, 5687–5706. [Google Scholar] [CrossRef]
- Tun, H.; Chen, C.-C. Isosteric heat of adsorption from thermodynamic Langmuir isotherm. Adsorption 2021, 27, 979–989. [Google Scholar] [CrossRef]
- Landau, L.D.; Akhiezer, A.I.; Lifshitz, E.M. SURFACE PHENOMENA. In General Physics; Elsevier: Amsterdam, The Netherlands, 1967; pp. 276–293. ISBN 978-0-08-009106-8. [Google Scholar]
- Brudey, T.; Largitte, L.; Jean-Marius, C.; Tant, T.; Dumesnil, P.C.; Lodewyckx, P. Adsorption of lead by chemically activated carbons from three lignocellulosic precursors. J. Anal. Appl. Pyrolysis 2016, 120, 450–463. [Google Scholar] [CrossRef]
- Das, A.; Bar, N.; Das, S.K. Pb(II) adsorption from aqueous solution by nutshells, green adsorbent: Adsorption studies, regeneration studies, scale-up design, its effect on biological indicator and MLR modeling. J. Colloid Interface Sci. 2020, 580, 245–255. [Google Scholar] [CrossRef] [PubMed]
- Taye, A.; Mehretie, S.M.; Admassie, S. Adsorption of lead(II) ions using KOH-activated carbon derived from water hyacinth. Bull. Chem. Soc. Eth. 2023, 37, 1369–1382. [Google Scholar] [CrossRef]
- Erdem, M.; Ucar, S.; Karagöz, S.; Tay, T. Removal of lead (II) ions from aqueous solutions onto activated carbon derived from waste biomass. Sci. World J. 2013, 2013, 146092. [Google Scholar] [CrossRef] [PubMed]
- Farooq, K.; Siddique, M.; Alzahrani, K.J.; Alsharif, K.F.; Alzahrani, F.M. Zinc-based metal–organic frameworks for high-efficiency adsorption of Pb(II) and Cu(II) ions from an aqueous solution: Synthesis, characterization, and performance evaluation. Prog. React. Kinet. Mech. 2025, 50, e015. [Google Scholar] [CrossRef]
- Forghani, M.; Azizi, A.; Livani, M.J.; Kafshgari, L.A. Adsorption of lead(II) and chromium(VI) from aqueous environment onto metal-organic framework MIL-100(Fe): Synthesis, kinetics, equilibrium and thermodynamics. J. Solid State Chem. 2020, 291, 121636. [Google Scholar] [CrossRef]
- Zheng, Y.; Rao, F.; Zhang, M.; Li, J.; Huang, W. Efficient, selective, and reusable metal–organic framework-based adsorbent for the removal of Pb(II) and Cr(VI) heavy-metal pollutants from wastewater. Clean. Eng. Technol. 2021, 5, 100344. [Google Scholar] [CrossRef]
- Wang, H.; Wang, S.; Wang, S.; Fu, L.; Zhang, L. Efficient metal-organic framework adsorbents for removal of harmful heavy metal Pb(II) from solution: Activation energy and interaction mechanism. J. Environ. Chem. Eng. 2023, 11, 109335. [Google Scholar] [CrossRef]
Figure 1.
FTIR Spectrum (a) Zn-H3btc (b) trimesic acid.
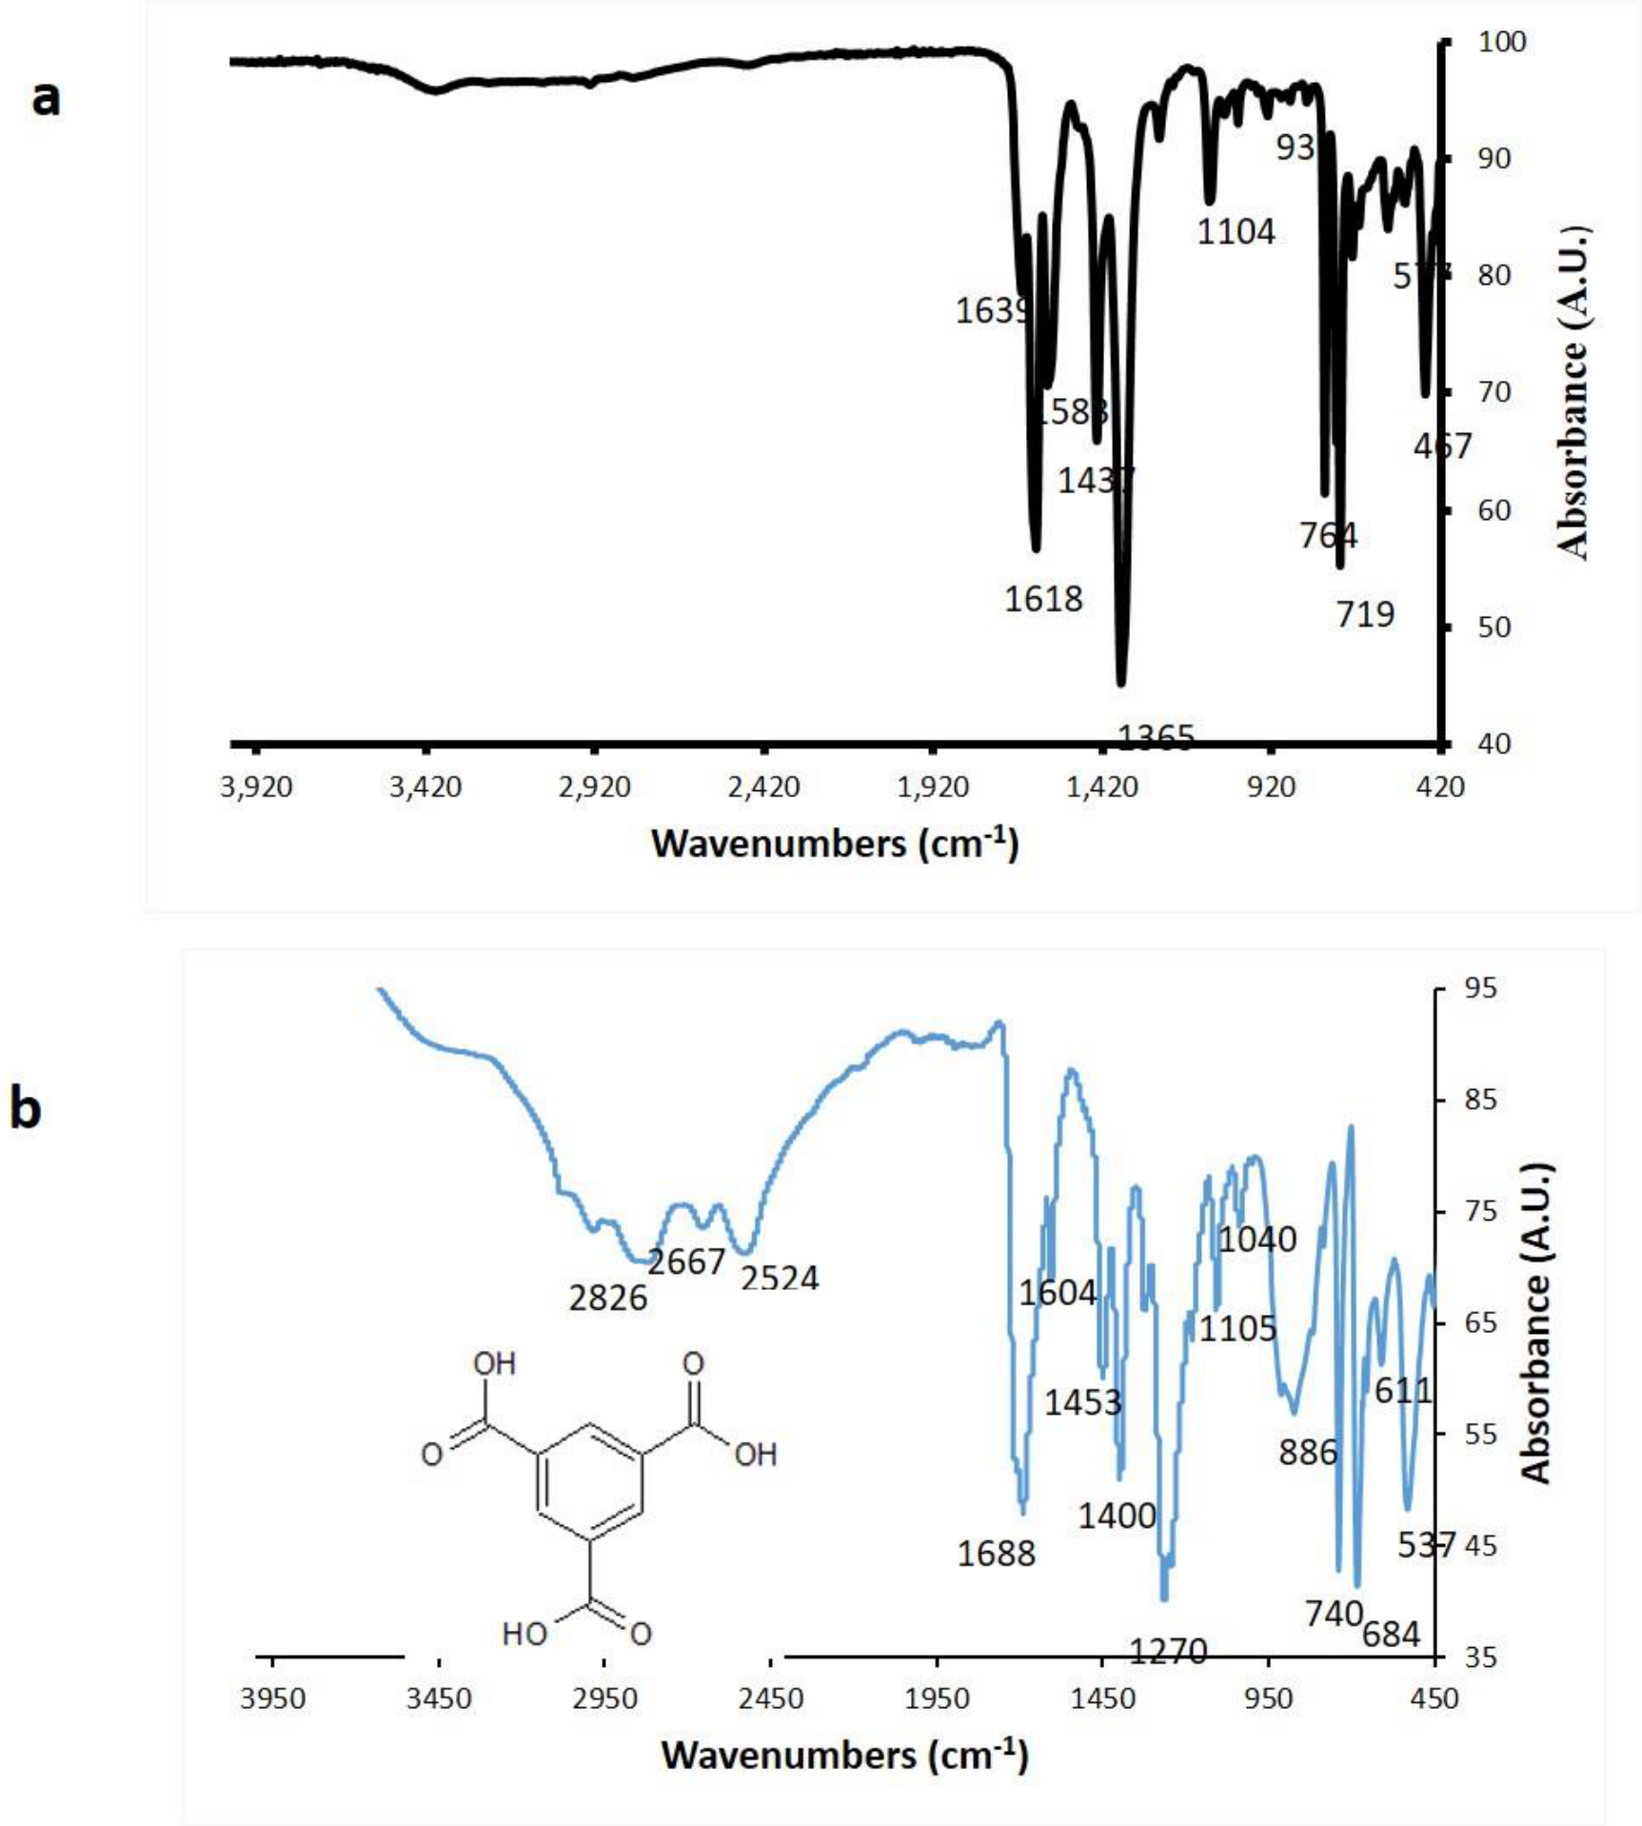
Figure 2.
Scanning Electron Micrograph (SEM) of Zn-H3btc, (a) 20 μm scale, 2840 times magnification (b) 10 μm scale, 4830 times magnification.
Figure 2.
Scanning Electron Micrograph (SEM) of Zn-H3btc, (a) 20 μm scale, 2840 times magnification (b) 10 μm scale, 4830 times magnification.
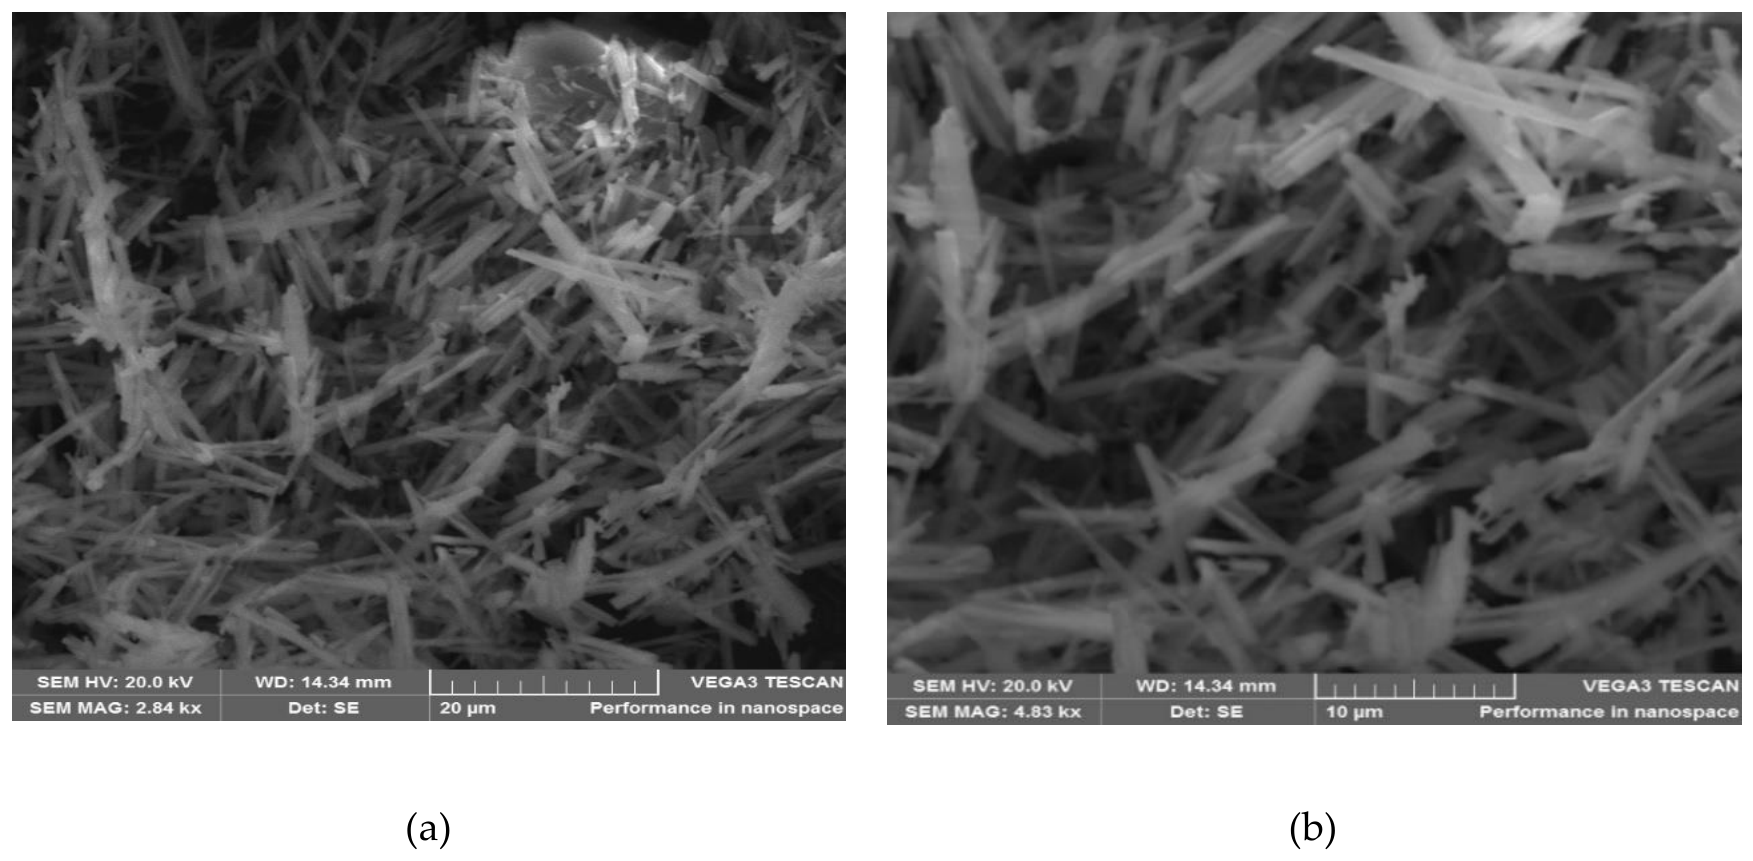
Figure 3.
Energy Dispersive X-Ray Spectroscopy (EDS) of Zn-H3btc.
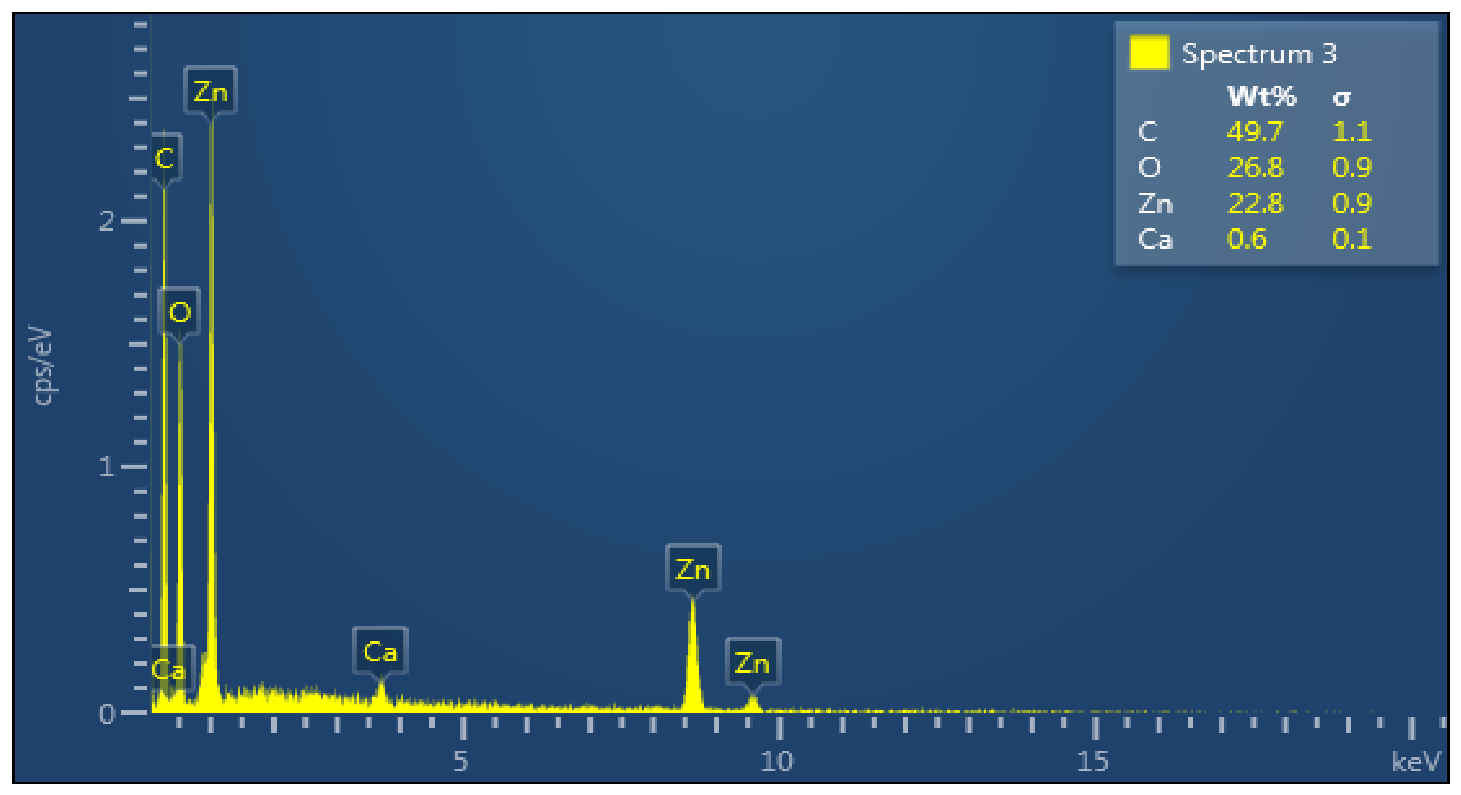
Figure 4.
X Ray Diffractogram of Zn-H3btc and inset, XRD of trimesic acid.
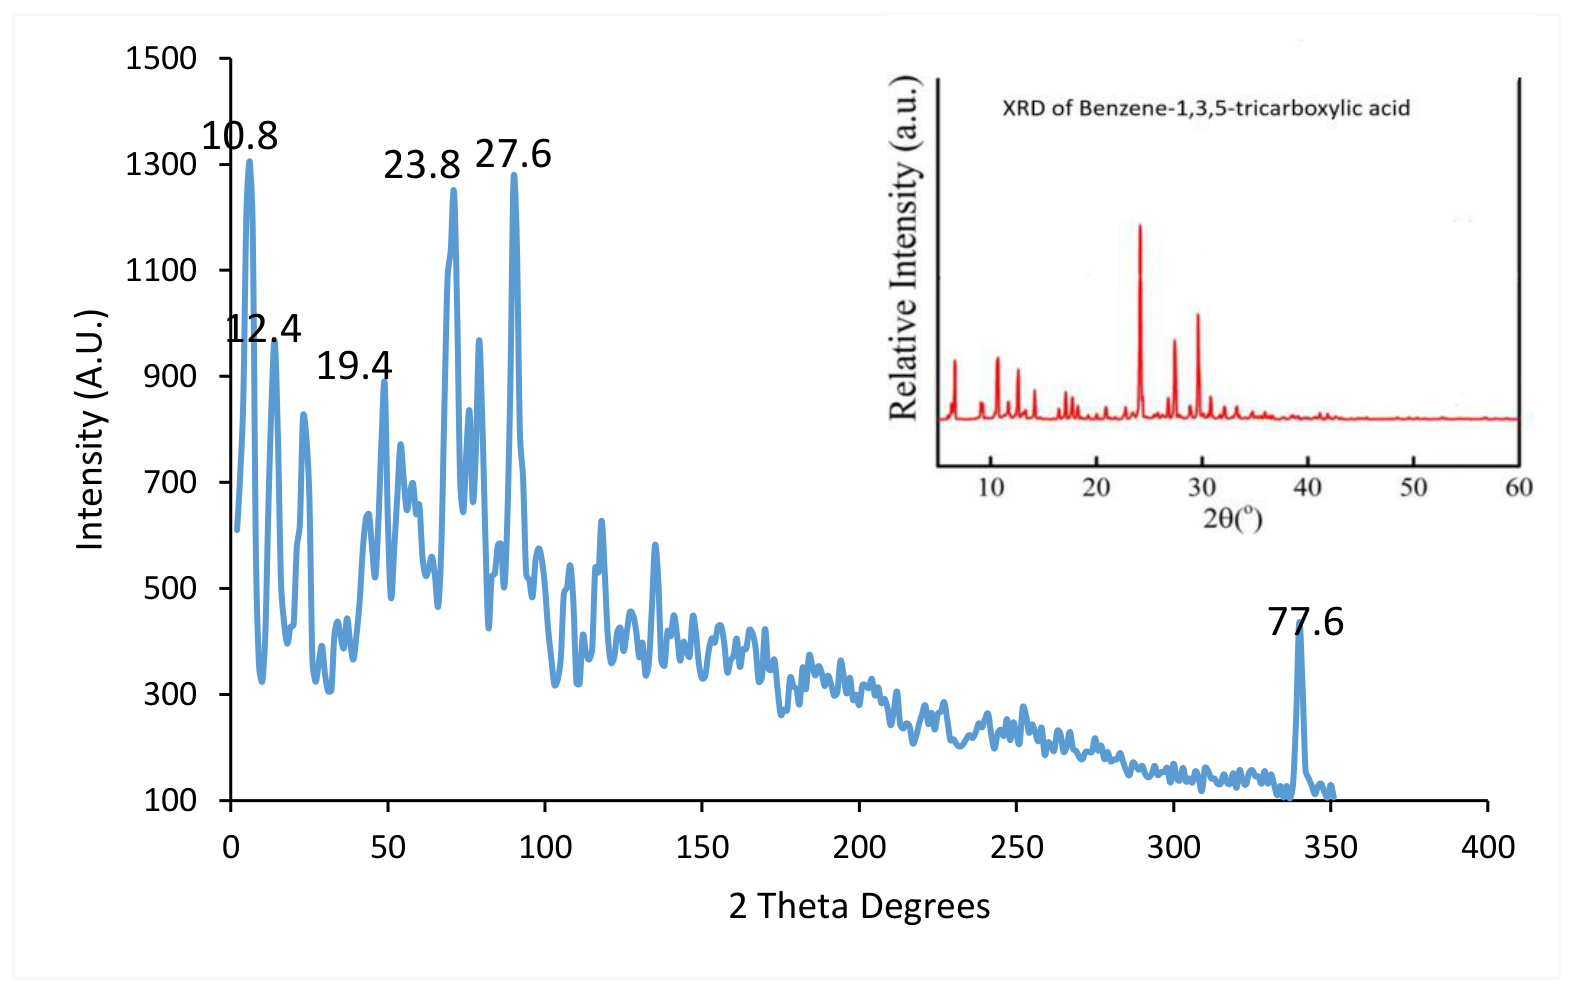
Figure 5.
Thermal analysis of Zn-H3btc (a) Thermogravimetric analysis (TGA) (b) Derivative thermogravimetric DTG analysis.
Figure 5.
Thermal analysis of Zn-H3btc (a) Thermogravimetric analysis (TGA) (b) Derivative thermogravimetric DTG analysis.
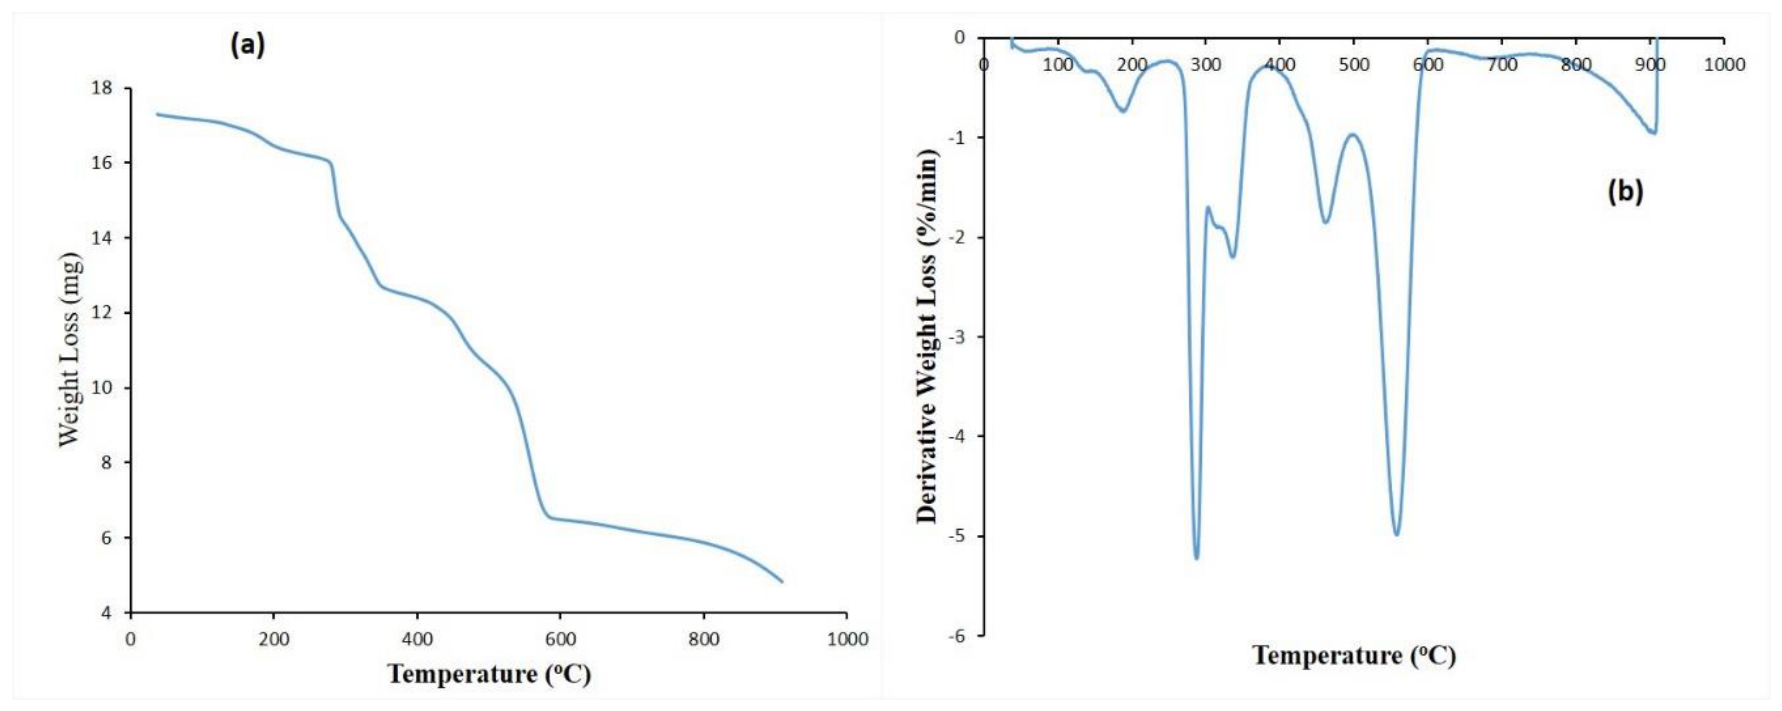
Figure 6.
Performance of Zn-H3btc in the adsorption of Pb (II) ions based on variation of solution concentration (a) pH (b) time (c) adsorbent dosage (d) and temperature (e,f).
Figure 6.
Performance of Zn-H3btc in the adsorption of Pb (II) ions based on variation of solution concentration (a) pH (b) time (c) adsorbent dosage (d) and temperature (e,f).
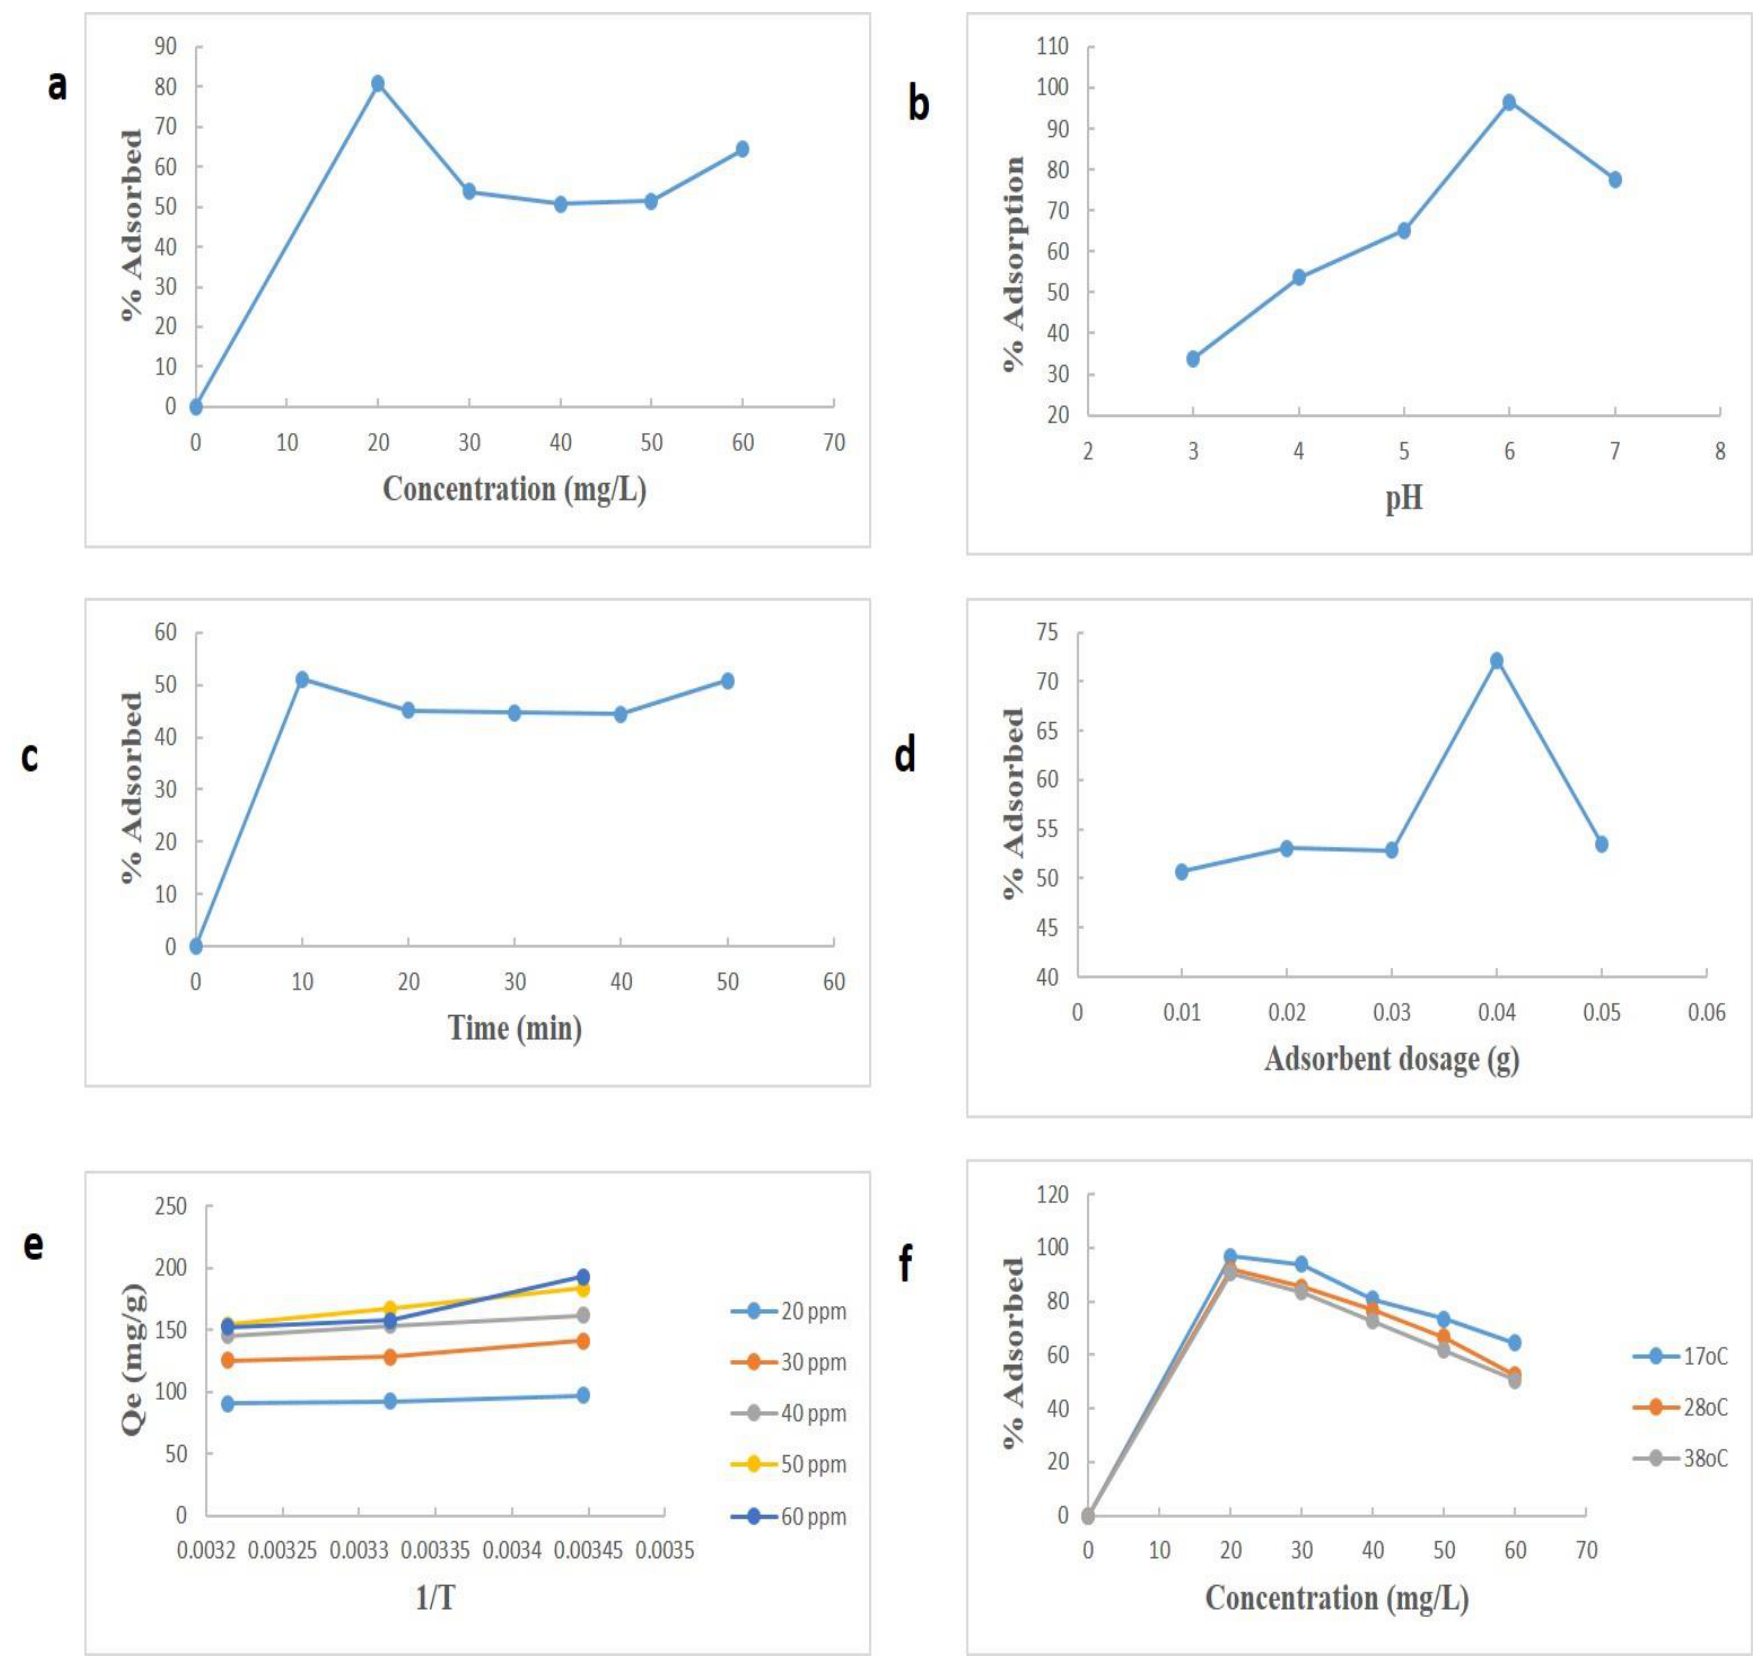
Figure 7.
Equilibrium isotherms for adsorption of Pb (II) on Zn-H3btc (a) Langmuir (b) Freundlich and (c) Temkin.
Figure 7.
Equilibrium isotherms for adsorption of Pb (II) on Zn-H3btc (a) Langmuir (b) Freundlich and (c) Temkin.
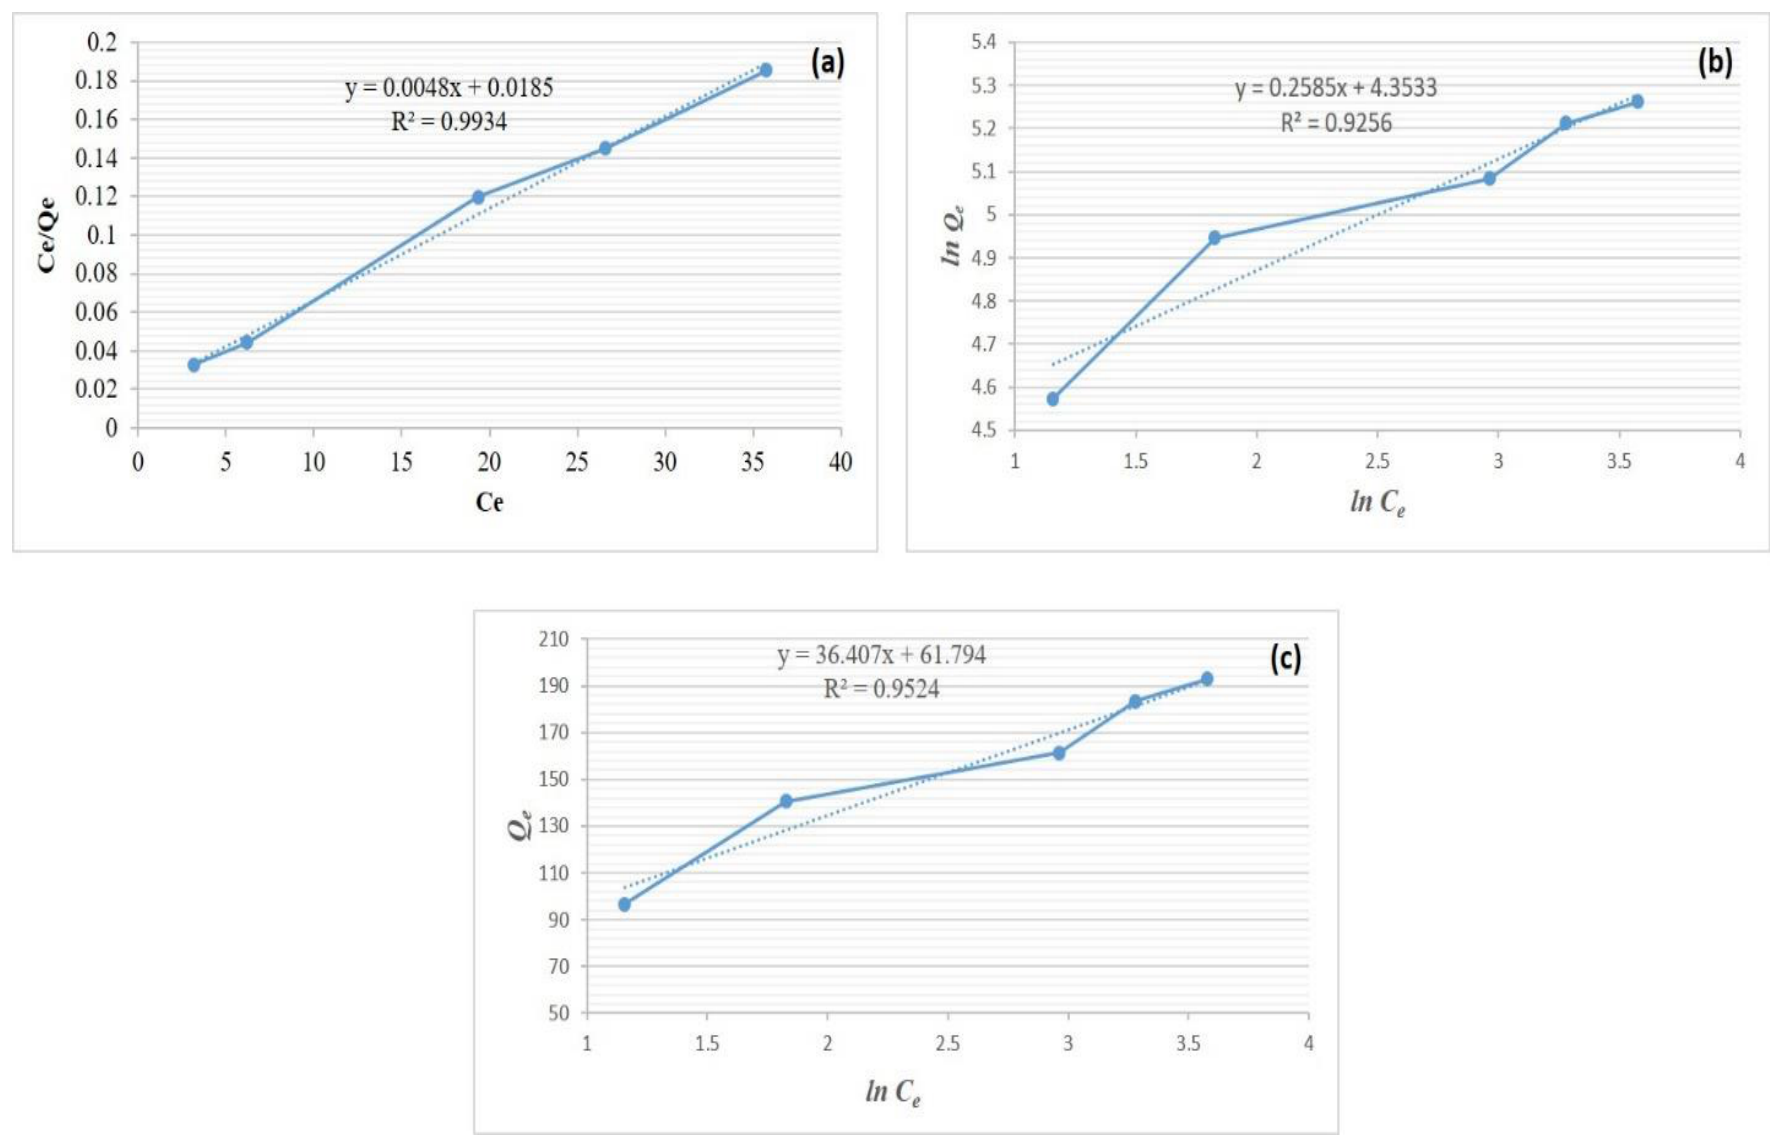
Figure 8.
Values of separation factor, RL for various initial concentration, C0 and the ensuing curve.
Figure 8.
Values of separation factor, RL for various initial concentration, C0 and the ensuing curve.
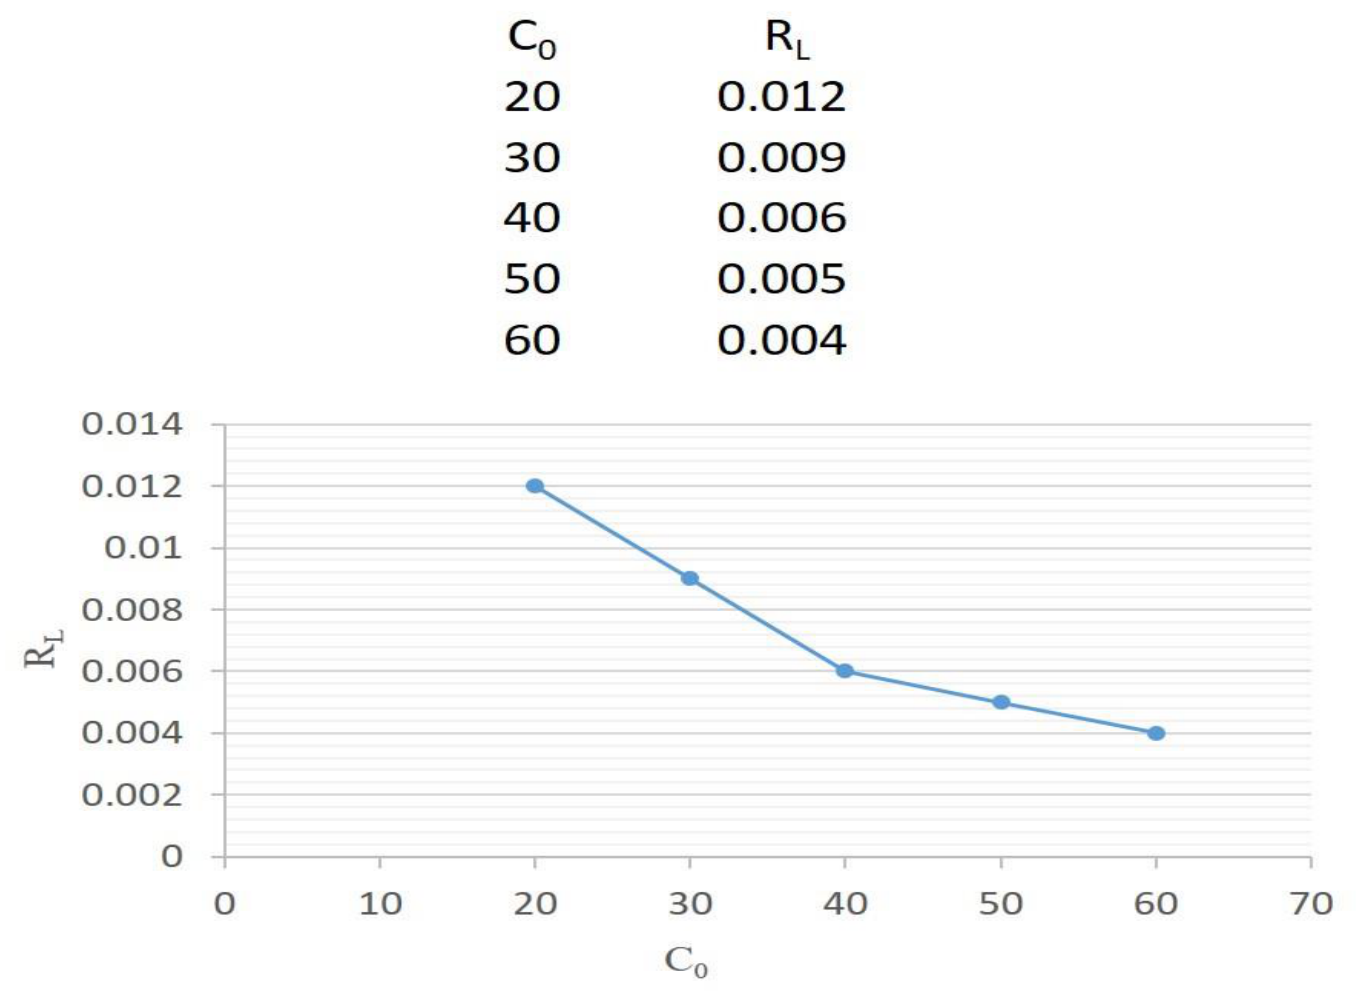
Figure 9.
Kinetic plots for adsorption of Pb (II) ions on Zn-H3btc. (a) zero order (b) first order (c) second order (d) pseudo-first order and (e) pseudo-second order.
Figure 9.
Kinetic plots for adsorption of Pb (II) ions on Zn-H3btc. (a) zero order (b) first order (c) second order (d) pseudo-first order and (e) pseudo-second order.
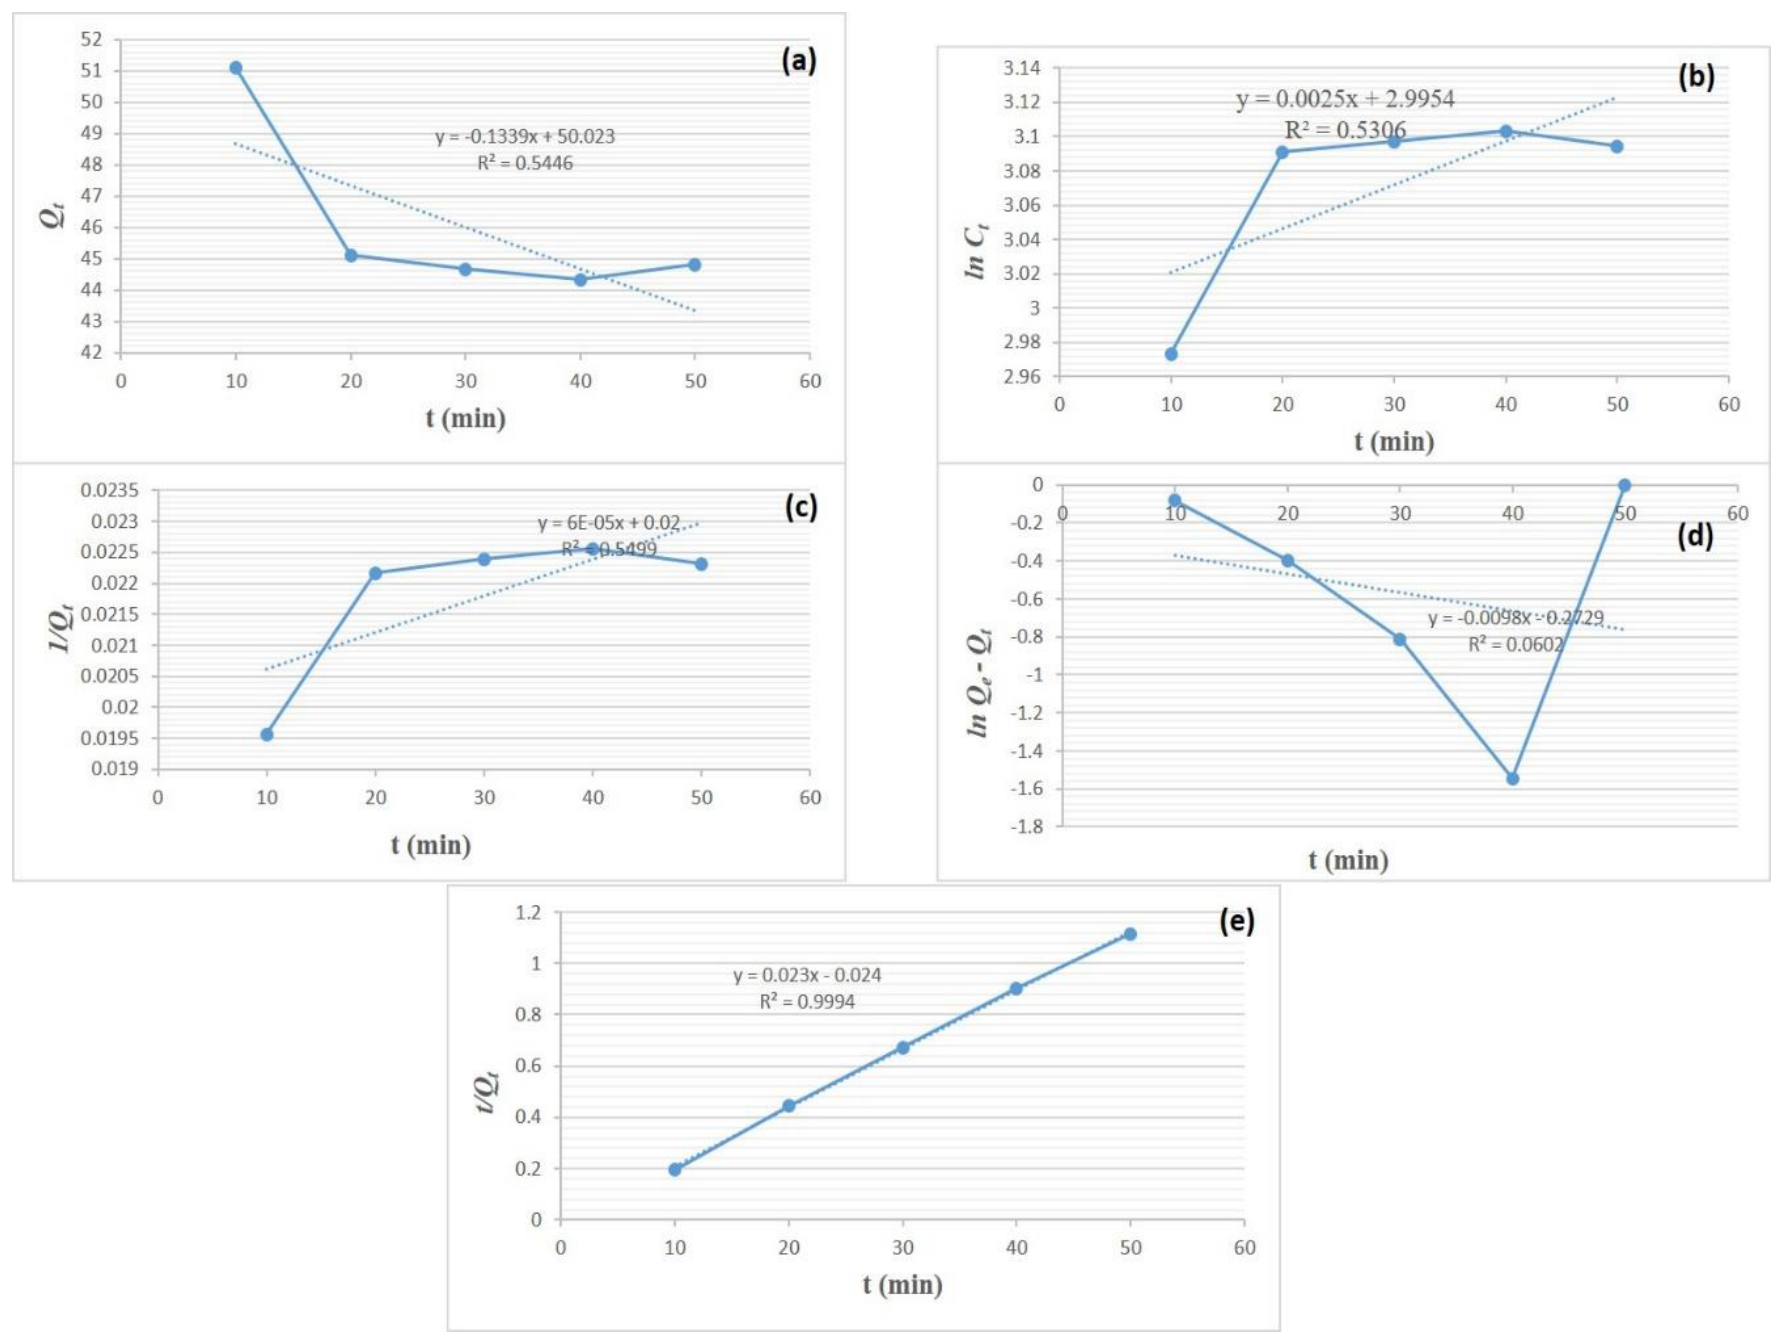
Figure 10.
Intra-particle diffusion plots for the adsorption of Pb (II) ions on Zn-H3btc.
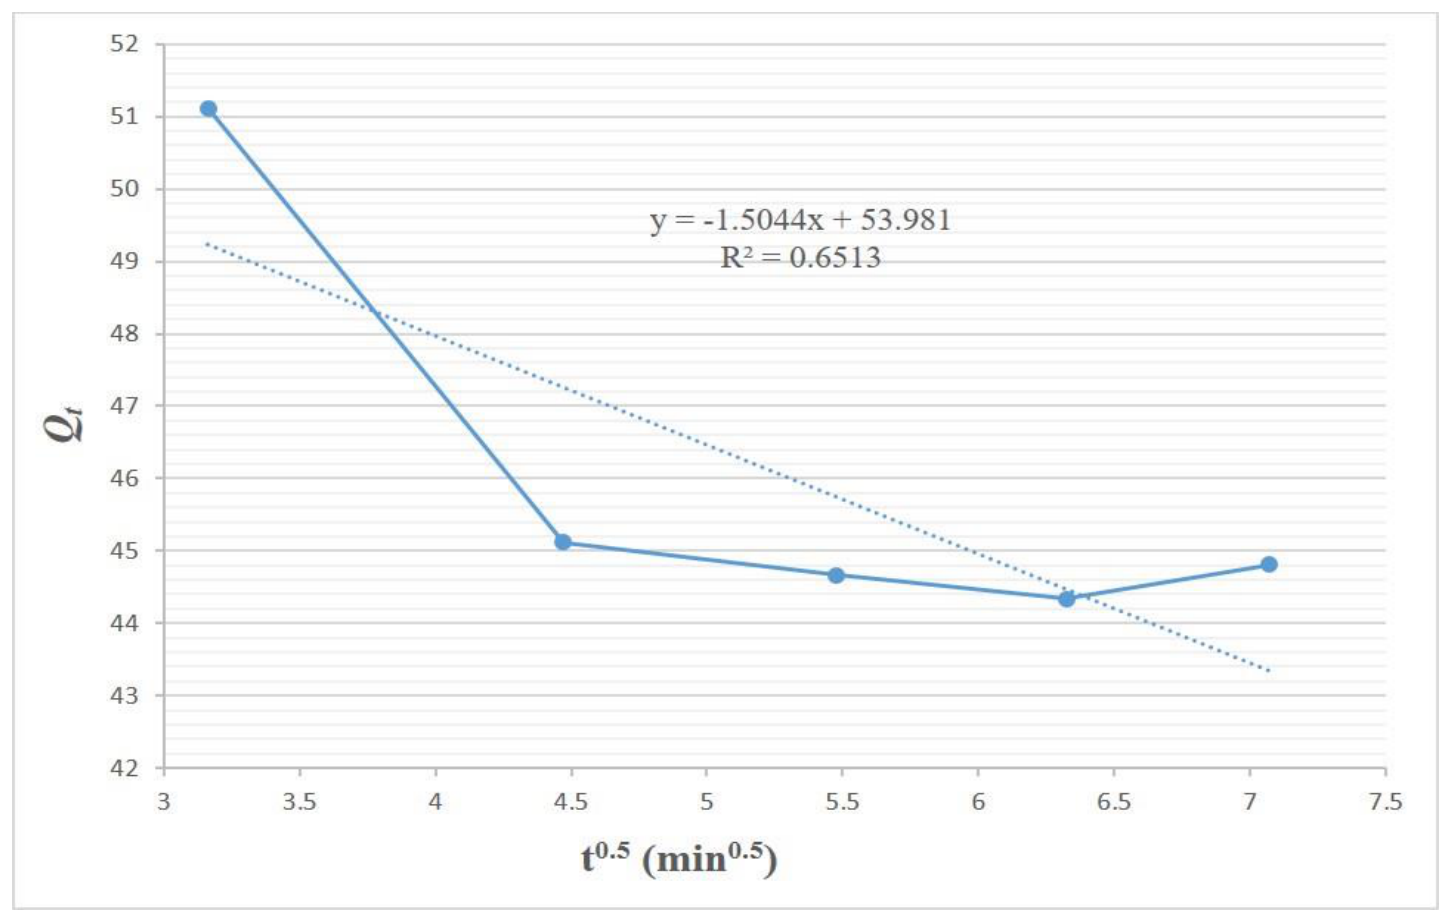
Figure 11.
Thermodynamic linear equations plots (a) Clausius-Clapeyron (b) Arrhenius (c) and Van’t Hoff.
Figure 11.
Thermodynamic linear equations plots (a) Clausius-Clapeyron (b) Arrhenius (c) and Van’t Hoff.
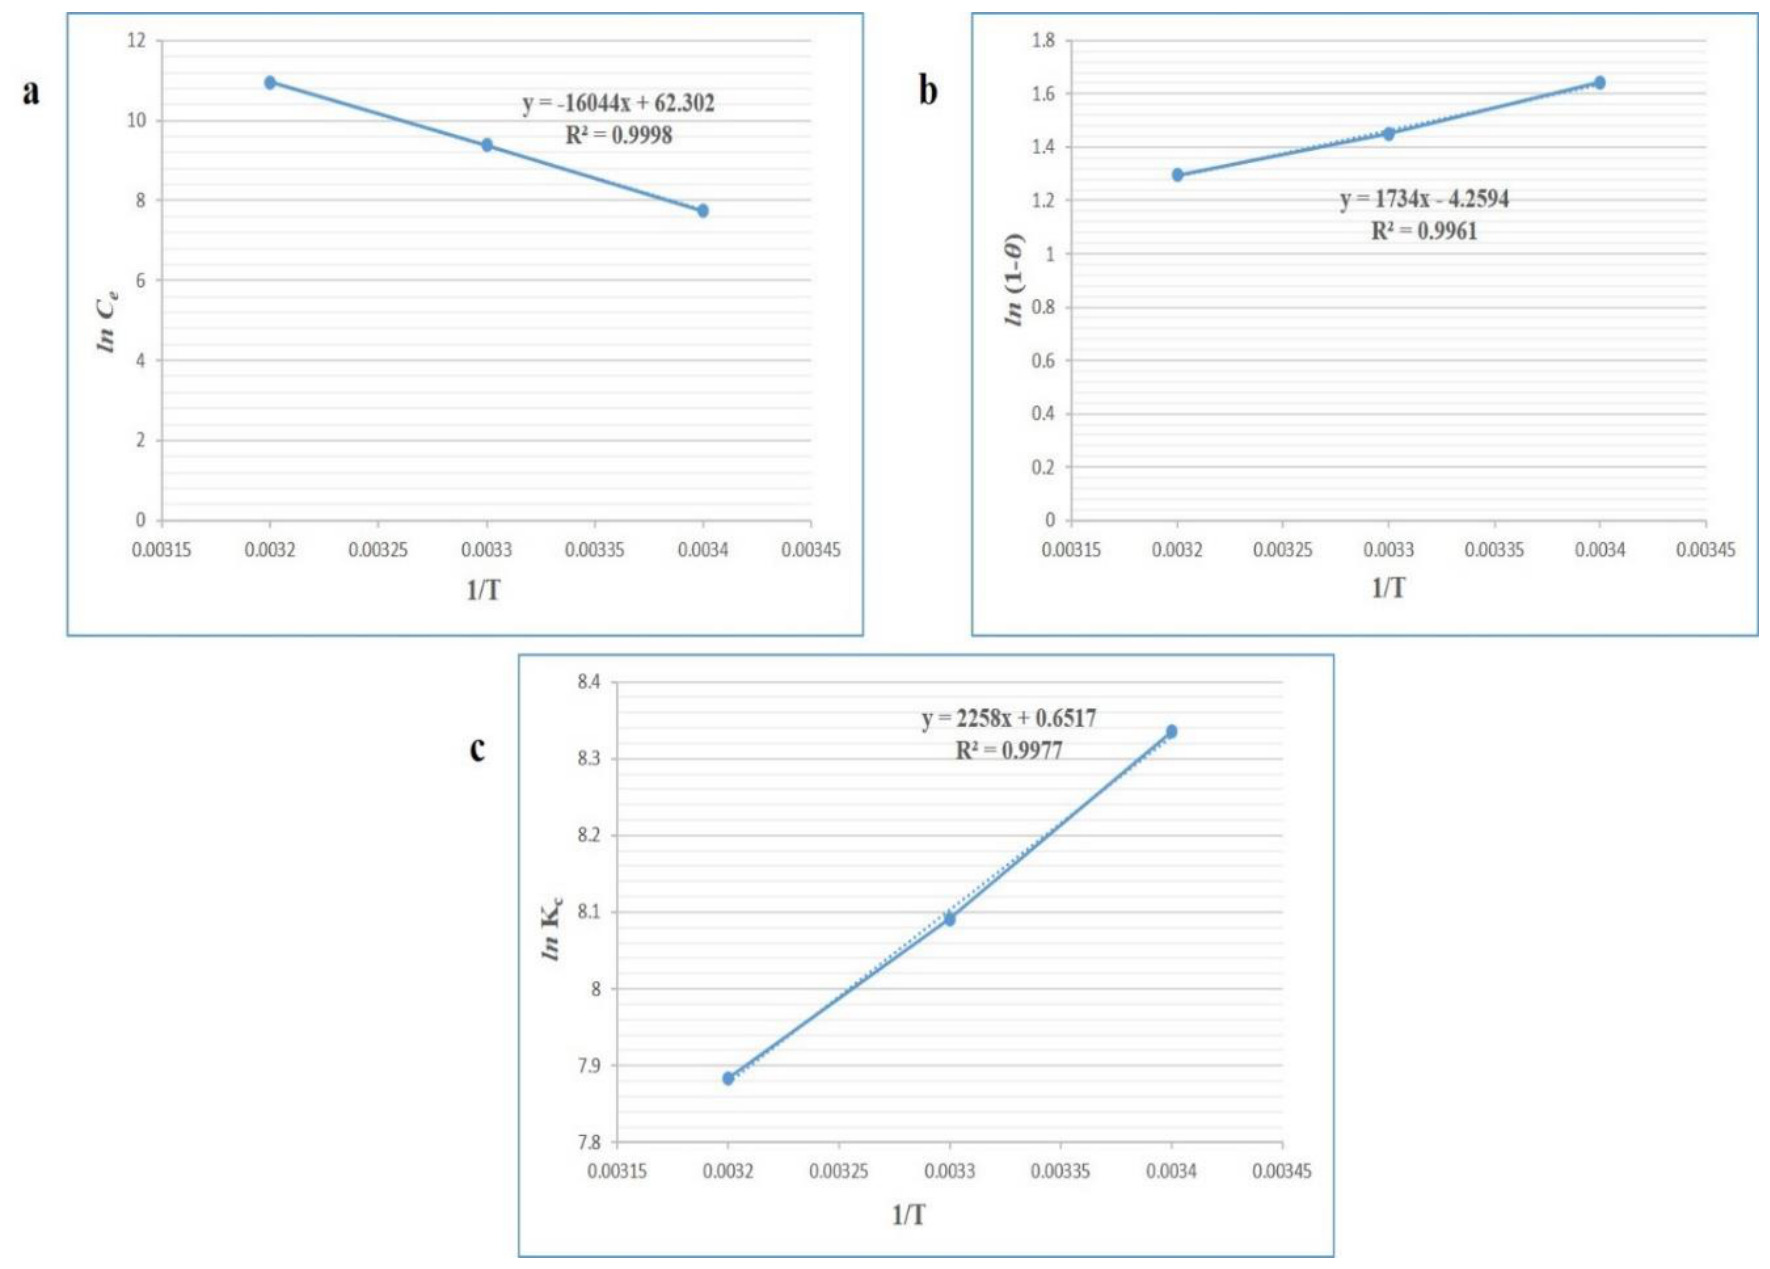

Table 1.
This is a table of results obtained from EDS spectrum of Zn-H3btc.
| List of Elements | Reaction Peak Intensity (Reacted (cps/eV)) | Unreacted Peak Intensity (cps/eV) |
Impurity Intensity Distance (keV) | Percentage Weight (%) | Standard Deviation |
|---|---|---|---|---|---|
| C | 2.4 | - | - | 49.7 | 1.1 |
| O | 1.6 | - | - | 26.8 | 0.9 |
| Zn | 2.5 | 0.6 | 8.5 | 22.8 | 0.9 |
| Ca | 0.6 | 0.1 | 3.5 | 0.6 | 0.1 |
Table 2.
Langmuir, Freundlich and Temkin Isotherms Parameters derived for Pb (II) adsorption onto Zn-H3btc.
Table 2.
Langmuir, Freundlich and Temkin Isotherms Parameters derived for Pb (II) adsorption onto Zn-H3btc.
| LANGMUIR | FREUNDLICH | TEMKIN | ||||||
|---|---|---|---|---|---|---|---|---|
| R2 | Qm | KL | R2 | KF | 1/n | R2 | KT | |
| 0.9934 | 54.05 mg/g | 3.85 L/mg | 0.9256 | 77.74 mg/g (L/mg)1/n | 0.26 | 0.9524 | 5.459 L/g | 66.26 J/mol |
Table 3.
Table of intra-particle diffusion values for adsorption of Pb (II) onto Zn-H3btc.
| R2 | Ki (mg/g min½) | C |
|---|---|---|
| 0.6513 | −1.5044 | 53.981 |
Table 4.
ΔH, ΔS, and ΔG values obtained from Van’t Hoff and Gibbs equations.
|
ΔH (kJ/kmol) |
ΔS (kJ/K/mol) |
ΔG (kJ/mol) |
R2 | ||
|---|---|---|---|---|---|
| 18.77 | 0.0054 | 290 K | 301 K | 311 K | 0.9977 |
| 20.34 | 20.40 | 20.45 | |||
Table 5.
Thermodynamic parameters derived from Arrhenius and Clausius-Clapeyron plots.
| Parameters | Results | |
|---|---|---|
| Arrhenius equation plot | S* | 0.014 |
| Ea | 14.42 kJ/mol | |
| R2 | 0.9978 | |
| Clausius-Clapeyron equation plots | K | 62.30 |
| 133.39 kJ/mol | ||
| R2 | 0.9998 |
Table 6.
Comparison of adsorption performances of Zn-H3btc to some previously reported adsorbents.
| Type of Adsorbent | Adsorbent Dosage Studied (g) | Contact Time (Minute) | Maximum Initial Concentration of Lead Ion Studied (mg/L) | Qm (mg/g) | Ref. |
|---|---|---|---|---|---|
| H2SO4 activated almond shells | 0.5 | NA | 20 | 4.5 | [53] |
| H2SO4 activated Guava seeds | 0.5 | NA | 20 | 11 | [53] |
| Neem leaves | NA | NA | NA | 22.33 | [54] |
| Walnut shell | NA | NA | NA | 3.59 | [54] |
| KOH activated water hyacinth leaf | 1 | 240 | 800 | 206 | [55] |
| K2CO3 activated soybean oil cake | 0.05 | 100 | 1000 | 476.2 | [56] |
| Zinc-2-methylimidazolate framework (MOF) | 0.05 | 90 | 50 | 29 | [57] |
| MIL-100 (Fe) | NA | NA | NA | 23.46 | [58] |
| Cd1.5(btc)(bibp)·2H2O]·H2O | 0.01 | 180 | 1000 | 537.6 | [59] |
| Aminated Zr-5-formylsalicylate Framework | N/A | 180 | N/A | 472.7 | [60] |
|
Zn-H3btc |
0.02 | 50 | 60 | 54.05 | This study |
REF—References, NA—Not available.
Disclaimer/Publisher’s Note: The statements, opinions and data contained in all publications are solely those of the individual author(s) and contributor(s) and not of MDPI and/or the editor(s). MDPI and/or the editor(s) disclaim responsibility for any injury to people or property resulting from any ideas, methods, instructions or products referred to in the content. |
© 2026 by the authors. Licensee MDPI, Basel, Switzerland. This article is an open access article distributed under the terms and conditions of the Creative Commons Attribution (CC BY) license (http://creativecommons.org/licenses/by/4.0/).
Copyright: This open access article is published under a Creative Commons CC BY 4.0 license, which permit the free download, distribution, and reuse, provided that the author and preprint are cited in any reuse.