

Submitted:
27 June 2026
Posted:
29 June 2026
You are already at the latest version
Abstract
Complex diseases challenge one of the oldest assumptions in medicine: that illness can be reduced to a single cause. Instead, increasing evidence suggests that many pathologies emerge from the collective dynamics of components interacting across molecular, cellular, physiological, behavioral, and ecological scales. Thus, we revisit the fundamental question of what a disease is through the lens of complex systems theory. In particular, we argue that diseases are better understood as emergent dynamical states of living systems that arise from the breakdown, reorganization, or destabilization of regulatory networks. Within this framework, mathematical models can describe health and disease as alternative attractors in a multidimensional state space, and disease onset often reflects critical transitions driven by stress, perturbation, or loss of resilience. Therefore, concepts from nonlinear dynamics, network theory, ecology, and statistical physics (such as bifurcations, hysteresis, phase transitions, and multistability) provide a unifying language to describe phenomena as diverse as patient comorbidity, psychiatric disorders, cancer progression, epidemic spreading, or neurodegeneration. We also discuss how multiscale models can bridge molecular mechanisms with organism-level behavior to reveal universal principles of complex diseases. This perspective implies that the future of medicine may depend on understanding not only the components of biological systems, but also the laws governing their collective organization, which could open new avenues for prediction, prevention, and control.
Keywords:
diseases
; network medicine
; complexity
; tipping points
; evolution
1. Introduction
What is a disease? How does it emerge? Can we define a theoretical framework to explain how diseases persist and transform? The answers to these questions have evolved throughout history, reflecting advances in medicine and biology as well as changes in a wide variety of human societies and environments [1].
Traditionally, human conditions have been understood to arise from two distinct causes: internal failures of regulation (related to development, aging, or homeostasis) or external factors (such as pathogens, toxins, or environmental stressors). In practice, however, many important disorders cannot be fully understood based solely on such causes. Instead, disease is increasingly viewed as the interaction between intrinsic susceptibility and external perturbations, linking pathology to organismal, ecological, and evolutionary dynamics [2], which challenges reductionist explanations centered on single genes, pathogens, or physiological defects.
A promising alternative approach involves framing human pathology not as a localized malfunction, but as a complex disease. That is, an emergent dynamical state of interconnected systems driven by nonlinear interactions across multiple scales, from molecules and cells to organisms, populations, and environments.
This reality highlights the need for theoretical models that capture the fundamental properties of such non-trivial collective systems. As illustrated in Figure 1, complex systems and network science provide quantitative tools for mapping and analyzing these properties, from multiscale interactions and feedback loops to systemic instabilities in disease [3,4].
From this perspective, we explore how concepts such as attractors, criticality, homeostasis, and resilience provide a common framework for understanding diverse complex diseases [5,6,7,8]. Specifically, we discuss how mathematical models can help characterize pathological states and the transitions between health and illness. In addition, we show how these models reflect common dynamical principles underlying disease emergence, persistence, and recovery across comorbidity, cancer, infectious diseases, and neurological disorders.
2. Diseases as Networks
Organ systems form a highly integrated architecture that maintains physiological function through multiscale, self-regulated coordination mechanisms [9,10]. This is a recurrent pattern in biology, from gene regulation and protein interactions to brain connectomes and ecosystems [11]. However, this integration also represents an important vulnerability, since it allows local failures to propagate across multiple body systems [12].
Chronic obstructive pulmonary disease, for instance, not only affects the lungs: it induces systemic inflammation and cardiovascular complications [13]. Similarly, diabetes begins as a metabolic disorder but progressively alters renal, neural, and vascular systems [14]. Even Alzheimer’s disease (AD), the most common neurodegenerative condition, involves widespread effects beyond the nervous system, such as metabolic and inflammatory alterations [15]. Hence, considering these interactions across organs and functions is key to understanding how diseases emerge, persist, and must be treated [16].
Such feedbacks are not limited to organic comorbidity, but can also describe how neurological and behavioral disorders manifest: diffuse signs, like anxiety or stress, do interact in non-trivial ways and can induce major changes in the patient’s state of mind, even when latent causes appear to have subsided [17,18,19,20]. A clear example of this is major depression (MD), a mental health disorder that affects nearly 17% of the population [21].
Network science provides a natural framework to study these phenomena from a system-agnostic perspective. An effective dynamical model can be constructed from the following principle: symptoms are not independent manifestations of isolated problems, but interacting components within an underlying dynamical system [22]. A symptom here is understood as an observable (e.g., fever, fatigue, or pain) that becomes active when the latent biological processes drive it across a threshold and thus expresses as a phenotype. Hence, symptom interactions reflect statistical co-activation patterns driven by the underlying biological processes.
Let be a graph whose nodes represent symptoms connected through edges , which can be binary or weighted (Figure 1a). We define a set of symptoms , where indicates the absence or presence of a given symptom. Symptom interactions are encoded in a weighted adjacency matrix defining the interaction graph (Figure 1b). The total input received by symptom i is
where denotes the neighborhood of node (i) (Figure 1b, shaded area), c controls the strength of symptom interaction, and is an external stress or vulnerability parameter that increases activation.
The probability that a symptom becomes active is then
where is the corresponding activation threshold. Subsequently, the system’s global state can be characterized by defining the mean activity : low values of x correspond to healthy states, while high values indicate widespread activation of symptoms.
A useful approximation can be obtained by replacing the heterogeneous network with a homogeneous parameter. In this homogeneous mean-field approximation, , so that
with an effective global activation threshold .
Thus, shifts the activation threshold effectively to , which increases the probability of activation even when symptom reinforcement is weak. If we assume that the average symptom activity relaxes continuously toward its expected activation level with characteristic timescale , this yields
The first term describes recovery, the second captures reinforcement through the symptom network, and c controls the overall stress level or symptom connectivity.
Starting from a healthy state (A), gradual changes in stress eventually drive the system to a tipping point (B), where a sudden transition to the disease state (C) occurs. Close to the transition, the dynamics can be approximated by a cubic equation, whose fixed points define the folded surface shown in Figure 1d:
Because of hysteresis, reducing stress does not restore health immediately: recovery follows a different path and only occurs after crossing a second threshold (D). Consequently, the transition to pathology becomes a critical phenomenon where small perturbations near tipping points can trigger abrupt and long-lasting changes in system behavior. This simple theoretical approximation allows studying the stochastic dynamics of transitions between healthy and pathological states, loss of resilience, and disease chronification.
Another way of looking at this system is to consider the associated potential function , which allows us to rewrite the model as derived from a potential, namely:
This potential does not represent a physical energy but a stability landscape: its minima are attractors (healthy and disease states), and their depth encodes resilience to perturbations [23]. Thus, this formalism can also characterize the system’s phase transitions [24].
In our case, gives a quartic function, analogous to Figure 1d (bottom) for two given parameter values associated with healthy states (H) and disease (D). When the healthy attractor becomes shallow due to increasing stress, the system becomes metastable, and fluctuations can cause a sudden transition (). Because the disease attractor may remain stable even after stress is reduced, recovery requires crossing a second threshold, thereby generating hysteresis and persistent pathological states.
3. Ecology and Disease
A key feature underlying the hallmarks of cancer [27,28] is intratumoral heterogeneity, which generates the genetic and phenotypic diversity fueling adaptation, metastasis, and therapy resistance [29]. Tumors behave as evolving ecosystems composed of diverse interacting cell populations (Figure 1e,f) where competition, cooperation, and niche construction shape disease progression [30]. Thus, cancer exemplifies the interplay between ecology, evolution, and development in disease dynamics [31].
Understanding how this diversity arises and persists is therefore a central ecological problem. Mathematical models have shown how interactions among tumor, host, sensitive, and resistant cell populations, together with spatial constraints, can maintain heterogeneity and drive tumor evolution [26,32,33]. These studies have also inspired ecology-based therapeutic strategies that explicitly account for these evolutionary and ecological interactions.
Since genetic and phenotypic diversity in tumors can be extremely high [29], low-dimensional models might miss certain emergent properties of the disease. Instead, a natural step to model tumors as communities of many interacting phenotypes is to describe them as multispecies ecosystems using generalized Lotka–Volterra (gLV) equations (Figure 1g, [34,35]):
Here, and define the growth and ecological adaptation of phenotype within the tumor microenvironment, while captures interactions among phenotypes [36,37]. Importantly, the interactions involving competition [38], predation [39], and facilitation [40] can vary widely in sign and magnitude across tumors, which leads to highly heterogeneous ecological networks.
Such diversity of cancer cells and their interactions has major consequences. When interactions are strong and heterogeneous, gLV models predict rugged landscapes with multiple attractors [34], allowing abrupt transitions between ecological states, including drug-resistant configurations [35] (Figure 1h). This helps explain why maximum-dose therapies often fail: treatment may not only eliminate sensitive cells, but also perturb the ecosystem and drive transitions toward resistant states.
Furthermore, recent work in bacterial ecology shows that coexistence among many competing species can persist under strong competitive constraints [41,42], potentially explaining the remarkable heterogeneity observed in tumors. Overall, these results suggest that tumors display emergent properties characteristic of complex ecosystems, limiting the effectiveness of reductionist “magic-bullet” therapies.
4. Thresholds and Epidemic Spreading
Although infectious diseases may be thought of as continuous and gradual processes, a key characteristic of epidemic and pandemic outbreaks is that they occur only when transmission exceeds critical thresholds. Since these sharp transitions determine whether the pathogen spreads among susceptible populations, infectious diseases constitute a paradigmatic example of tipping point dynamics with profound biological, economic, and social implications [43,44]. Thus, studying these thresholds is paramount to epidemiology, public health, and disease prevention through vaccination.
The susceptible-infected-susceptible (SIS) model provides a formal framework to study infections that do not confer long-lasting immunity. This has been used not only for biological infections, but also for other contagion-like processes in networks [45].
Consider a contact network (Figure 1j) described by an adjacency matrix , where if the nodes i and j interact and otherwise. Let denote the probability that node i is infected at time t. In the most general case, transmission and recovery rates may vary between nodes and links. Denoting by the transmission rate from node j to node i, and by the recovery rate of node i, the SIS mean-field dynamics is (Figure 1k):
(). The first term represents recovery processes, while the second term accounts for infection coming from neighboring infected nodes. This formulation allows for heterogeneous susceptibilities, heterogeneous infectivities, weighted interactions, and nonuniform recovery dynamics [46]. The disease-free equilibrium is given by .
A simpler and analytically transparent situation is obtained by assuming homogeneous spreading and recovery dynamics, namely and , for all nodes and links. Equation (8) then reduces to
The disease-free state again corresponds to . Linearization gives , implying that the epidemic threshold is controlled by the largest eigenvalue of the adjacency matrix:
For , outbreaks remain subcritical and decay to the disease-free state. For , the infection survives, and an endemic state emerges.
To gain insight into the epidemic threshold, consider a homogeneous network where all nodes have approximately the same (average) degree . In this limit, the node-dependent probabilities can be replaced by a single average infected fraction, , leading to the mean-field equation
The fixed points are the disease-free state, , and the endemic state
which exists only if . The epidemic threshold is therefore
Below this threshold, infections disappear, whereas above it, a stable endemic state emerges continuously:
The infected fraction , then, is the order parameter, while the effective spreading rate acts as the control parameter that drives the transition [43].
This mechanism provides the theoretical basis for vaccination strategies that reduce transmission below the epidemic threshold. Nevertheless, real contact networks are strongly heterogeneous, since they often contain hubs and highly connected individuals that drastically lower or even eliminate the effective threshold [46]. Accordingly, epidemic spreading and vaccination outcomes may differ substantially from homogeneous mean-field predictions, which highlights the importance of network structures in epidemiology.
Box 1. Networks in health and disease
Health and disease can be represented as dynamical states of interacting molecular, cellular, and other variables of clinical interest. In network medicine, genes, proteins, metabolites, cells or phenotypes are modeled as nodes, and their biochemical, regulatory or functional dependencies are links. Accordingly, disease is not simply assigned to a single altered component, but to perturbations of a subnetwork: a disease module embedded in the interactome [47] or in a multilayer representation of multi-omic data [4,48,49]. This framework allows us to explain why mutations, environmental exposures or drugs may have system-wide effects that depend on network context, including the systemic importance of a node (e.g., centrality) and its synergetic relationships with other nodes defining a specific (dys)function (e.g., module membership). Taking into account the underlying interdependencies among relevant biological processes across multiple scales, from molecular to organ, allows one to map the propagation of state perturbations that can lead to altered states characterizing disease.
A more general network-constrained dynamics [4] can be written as
where denotes the adjacency set of unit , is its state, and denotes the states of its neighbors. The first line is fully general: the dynamics of node i may depend on its own state, on the joint state of all its neighbors, on local and contextual parameters, and on perturbations. The second line is the pairwise additive approximation used in many current formulations, assuming that the effect of the network can be decomposed into edge-level contributions across layers , weighted by the strength of the interaction encoded by . Here, represents genetic, environmental, or therapeutic perturbations, captures uncertainty, and denote, respectively, node-specific and interaction-specific parameters, which may encode molecular, cellular, disease- or patient-dependent variability.
5. Disease as Multiscale Systems
Human disease involves processes where many components interact in intricate ways, and major changes can occur abruptly. Decomposing these processes into simpler parts and identifying a molecular cause has previously led to extraordinary results in biomedicine [55]. Nevertheless, many important conditions resist this decompositional approach because they are rooted in highly interconnected physiological systems where the underlying processes are deeply interdependent [48]. This leads to emergent properties: behaviors that arise from interactions among components and cannot be predicted by examining those components in isolation [56].
In these systems, moving from one scale to the next introduces new variables and laws. As a result, higher-level properties cannot be straightforwardly deduced from a complete description of lower-level components. Causality flows both upward and downward, since a molecular disturbance can reorganize cellular dynamics, but tissues or system-level states can equally constrain and reshape molecular processes [57].
Multiscale models provide a framework to approximate such emergent properties [58]. Instead of a single unified description, they rely on a structured hierarchy of scale-dependent formalisms, which can be connected to study how disturbances initiated at one scale propagate, amplify, or dampen as they manifest in other levels [59].
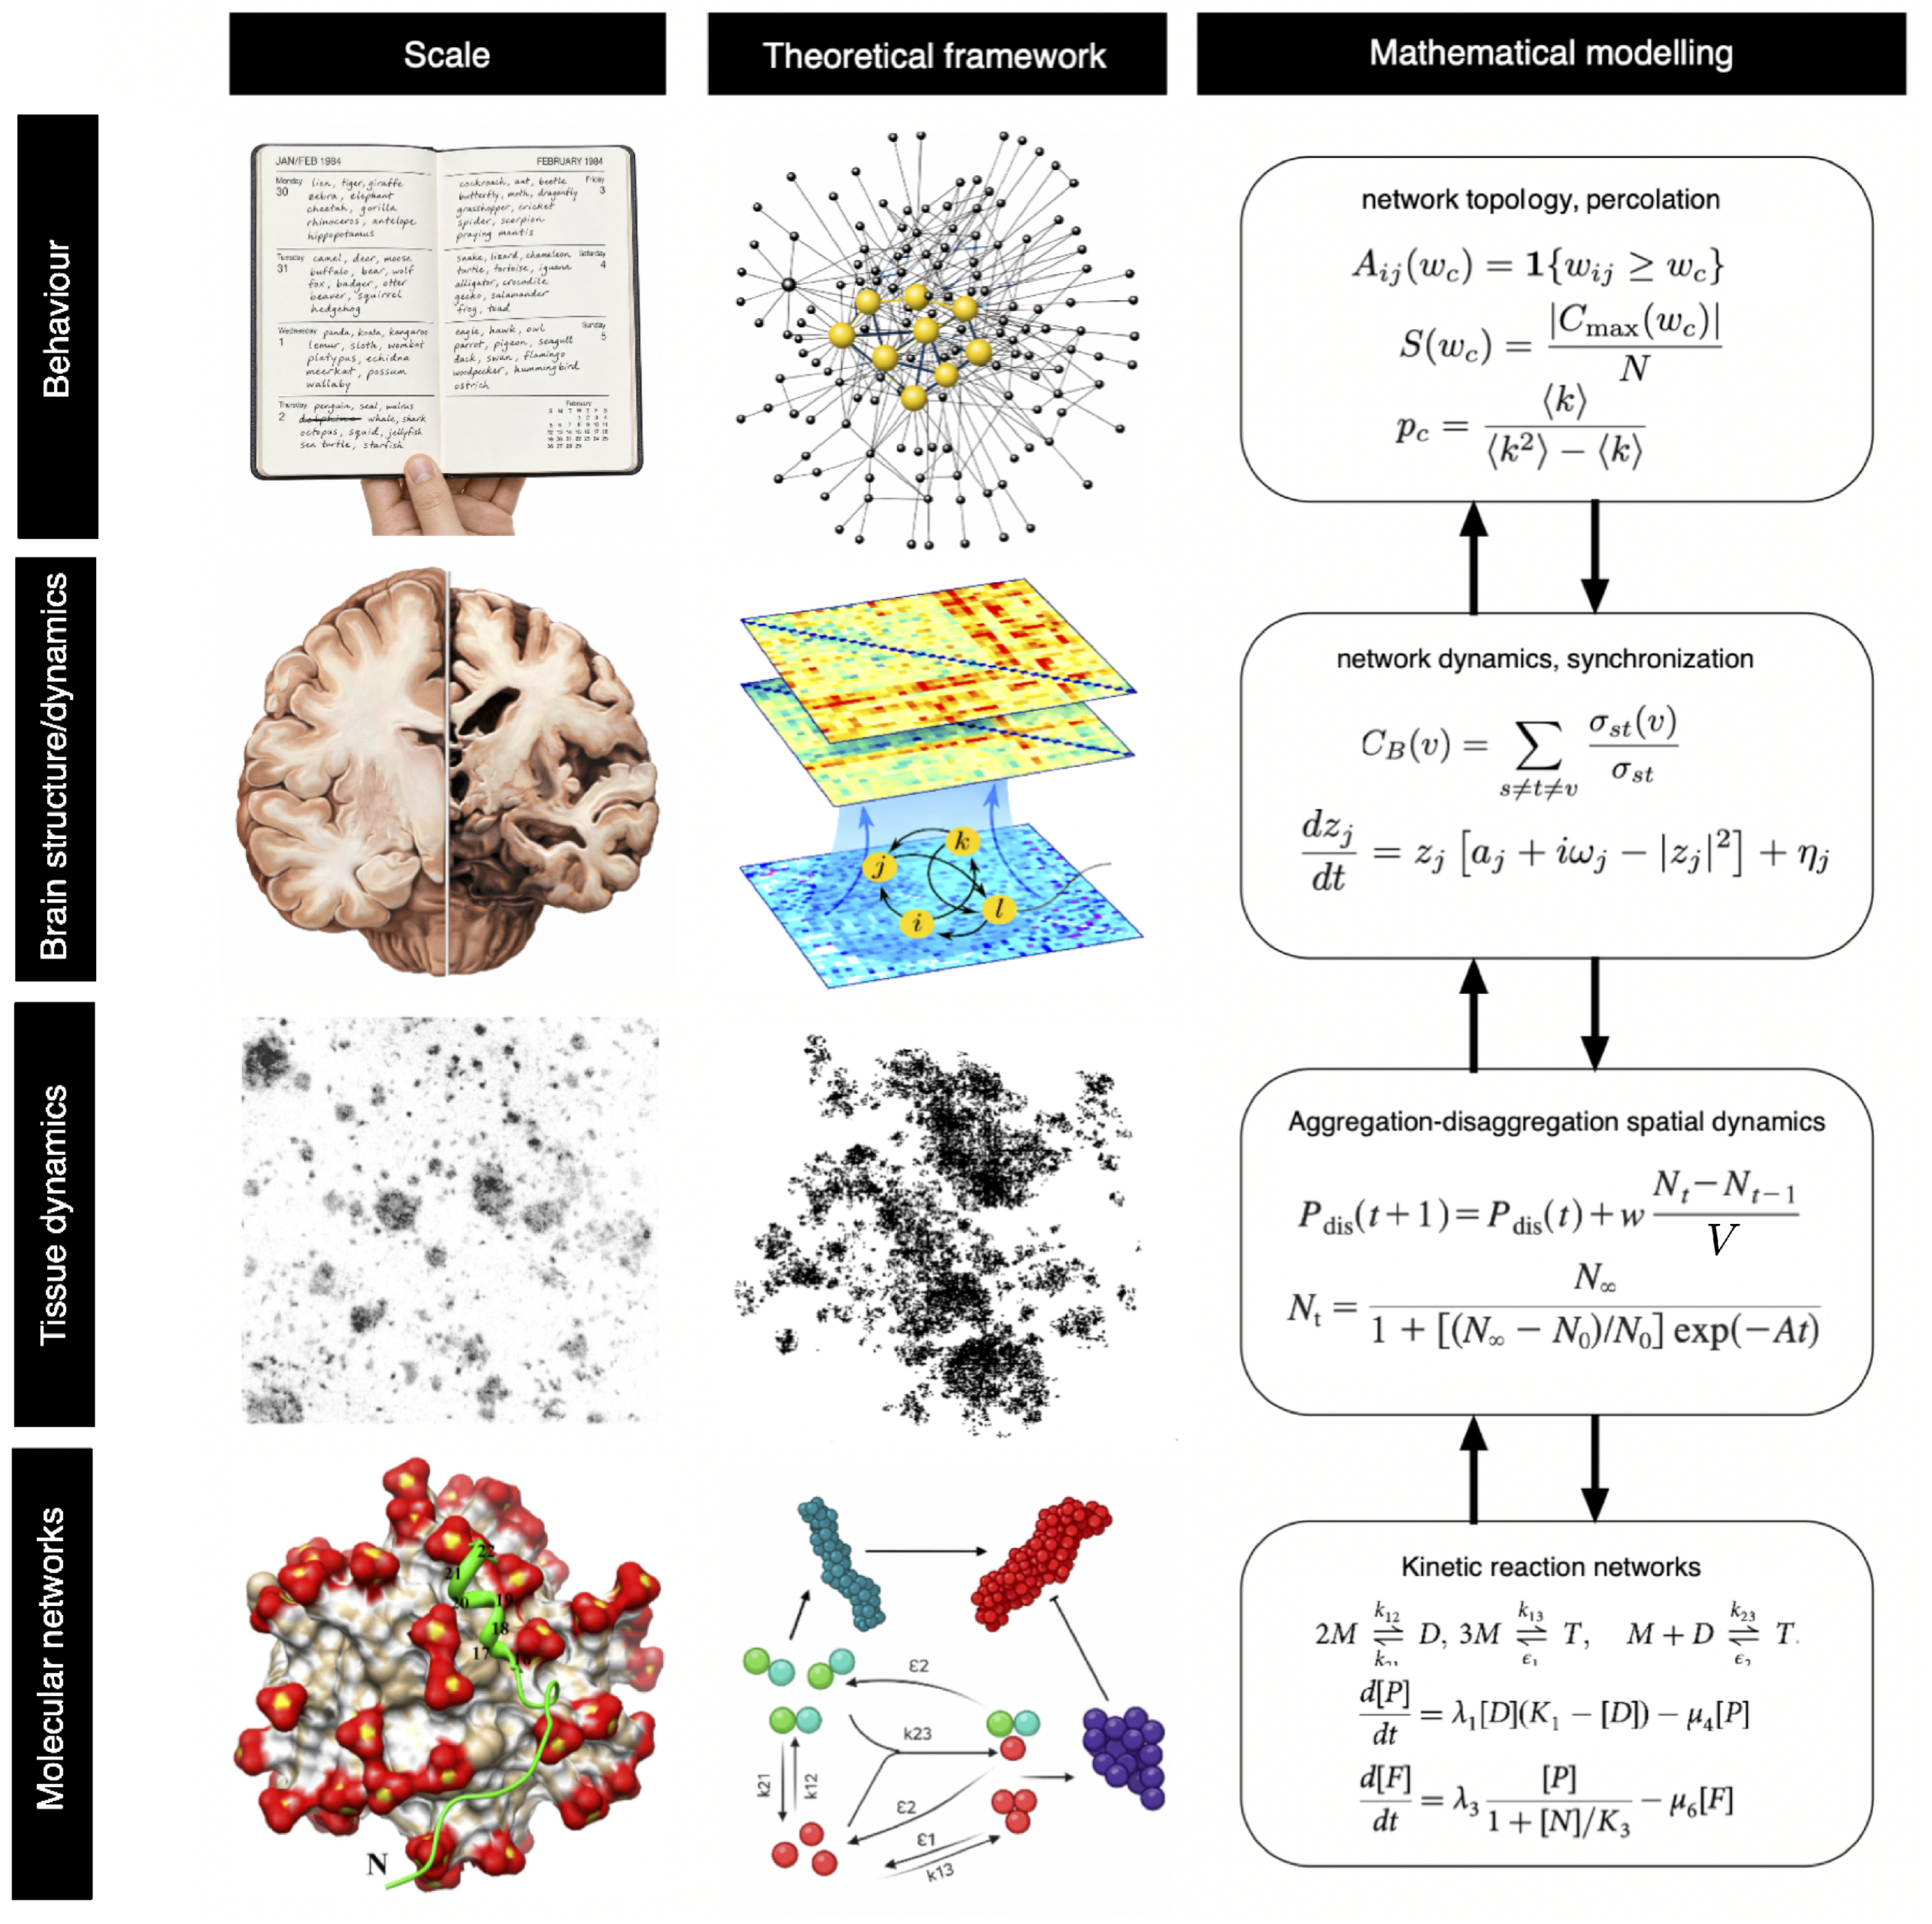
As shown in Figure 2, AD is a clear example of this kind of multi-scale process. To further illustrate this, we discuss formal representations that can be used to study its relevant mechanisms across various scales.
From the molecular perspective, the accumulation of amyloid- plaques and tau neurofibrillary tangles is considered central to the pathology [60]. This can be represented as reversible reactions among monomers , dimers , and trimers , whose downstream dynamics govern the accumulation of plaques and fibrils :
This model provides a basis for why amyloid- burden does not reliably predict clinical onset, since fixed-point analysis reveals regimes where self-limiting pathology and irreversible growth coexist as stable solutions.
But what about the spatially heterogeneous patterns that result from aggregation dynamics? Local plaque formation at the tissue scale can be modeled on a 2D discrete lattice as a density that grows logistically under a carrying capacity , with initial density and growth rate A. In turn, disaggregation probability obeys the following law [61]:
Parameters A and w cannot be directly derived from the molecular equations: they absorb the collective effects of neuroinflammation, synaptic loss, and glia reactivity, which ultimately influence whole-brain organization.
At that scale, the local dynamics of each brain region (j) can be modeled as a Stuart-Landau oscillator [62]
where the bifurcation parameter controls whether a region sustains oscillations or settles to a fixed point . Consequently, neurodegeneration acts as a distributed reduction in , progressively shifting the network toward a fragmented, incoherent activity regime. Such pathological changes eventually manifest in the behavioral plane, including cognitive decline, memory loss, confusion, and personality changes [63].
Cognitive deficits can be formally linked to the topological disintegration of the patient’s functional network. In particular, defining a thresholded adjacency matrix , the size of the largest connected component serves as an order parameter for network integrity. If we assume an uncorrelated random network [64], percolation theory predicts the following critical threshold:
Below this threshold, the functional network fragments abruptly. The heterogeneity term implies that hub-rich networks are more resilient to random failures yet disproportionately sensitive to targeted attacks on high-degree nodes [65,66]. This is precisely the failure mode that AD appears to exploit in its early stages.
6. Discussion
The perspective of complex systems suggests that human disease should not be viewed as a static entity or the result of isolated failures, but as emergent dynamics arising from interactions across multiple scales.
As discussed in the case studies above, elemental models show that abrupt transitions are key: bistability and hysteresis in symptom networks, thresholds governing epidemic outbreaks, or amyloid- aggregation dynamics, all reflect the importance of tipping points separating qualitatively different regimes, even in seemingly gradual processes. Health and disease, then, correspond to regions in an underlying dynamic landscape, and the onset of disease is often associated with a loss of resilience or transitions between alternative attractors [67].
Remarkably, heterogeneity can reshape thresholds in ways that homogeneous descriptions cannot capture. The ecological interactions among tumor subpopulations generate rugged landscapes with attractors that drive drug resistance, while intricate network structures can drastically reduce or even eliminate the thresholds predicted by mean-field models. Furthermore, many of these processes display emergent properties, so multiscale descriptions are required to characterize their behavior.
Acknowledgments
RS thanks the members of the Complex Systems Lab for their valuable discussions and insights. RS was supported by an AGAUR 2021 SGR0075 grant, AEI-PID2023-152129NB-I00 grant and by the Santa Fe Institute. JR receives support from a Joan Oró research grant (2025 FI-1 00332) co-funded by Generalitat de Catalunya and the European Union. GA-G was supported by a Marie Skłodowska-Curie Actions Postdoctoral Fellowship under project FRAGILEPRINTS - 101105029. Views and opinions expressed are, however, those of the author(s) only and do not necessarily reflect those of the European Union or the CNRS. Neither the European Union nor the CNRS can be held responsible for them. The funders had no role in study design, data collection and analysis, decision to publish, or preparation of the manuscript. MDD was partially supported by the MUR - PNC (DD n. 1511 30-09-2022) Project no. PNC0000002, DigitAl lifelong pRevEntion (DARE) and the INFN grant “LINCOLN”.
References
- Porter, R. The Cambridge illustrated history of medicine; Cambridge University Press, 2001. [Google Scholar]
- Nesse, R.M.; Williams, G.C. Evolution and the origins of disease. Sci. Am. 1998, 279, 86–93. [Google Scholar] [CrossRef] [PubMed]
- Artime, O.; De Domenico, M. From the origin of life to pandemics: emergent phenomena in complex systems. Philos. Trans. R. Soc. A Math. Phys. Eng. Sci. 2022, 380. [Google Scholar] [CrossRef]
- d’Andrea, V.; Loscalzo, J.; De Domenico, M. Challenges and opportunities in the network medicine of complex diseases. In Med; 2025. [Google Scholar]
- Odum, H.T. Systems Ecology: An Introduction; John Wiley & Sons: New York, 1983. [Google Scholar]
- Holling, C.S. Engineering resilience versus ecological resilience. Eng. Within Ecol. Constraints 1996, 31, 32. [Google Scholar]
- Rabinovich, M.I.; Varona, P.; Selverston, A.I.; Abarbanel, H.D. Dynamical principles in neuroscience. Rev. Mod. Phys. 2006, 78, 1213–1265. [Google Scholar] [CrossRef]
- Wiener, N. Cybernetics: Or Control and Communication in the Animal and the Machine; MIT Press: Cambridge, MA, 1948. [Google Scholar]
- Bashan, A.; Bartsch, R.P.; Kantelhardt, J.W.; Havlin, S.; Ivanov, P.C. Network physiology reveals relations between network topology and physiological function. Nat. Commun. 2012, 3, 702. [Google Scholar] [CrossRef] [PubMed]
- Kitano, H. Systems biology: a brief overview. science 2002, 295, 1662–1664. [Google Scholar] [CrossRef] [PubMed]
- Newman, M.E. The structure and function of complex networks. SIAM Rev. 2003, 45, 167–256. [Google Scholar] [CrossRef]
- Kitano, H. Biological robustness. Nat. Rev. Genet. 2004, 5, 826–837. [Google Scholar] [CrossRef] [PubMed]
- Barnes, P.J. Chronic obstructive pulmonary disease: effects beyond the lungs. PLoS Med. 2010, 7, e1000220. [Google Scholar] [CrossRef] [PubMed]
- Forbes, J.M.; Cooper, M.E. Mechanisms of diabetic complications. Physiol. Rev. 2013, 93, 137–188. [Google Scholar] [CrossRef] [PubMed]
- Heneka, M.T.; Carson, M.J.; El Khoury, J.; Landreth, G.E.; Brosseron, F.; Feinstein, D.L.; Jacobs, A.H.; Wyss-Coray, T.; Vitorica, J.; Ransohoff, R.M.; et al. Neuroinflammation in Alzheimer’s disease. Lancet Neurol. 2015, 14, 388–405. [Google Scholar] [PubMed]
- Esper, A.M.; Martin, G.S. The impact of cormorbid conditions on critical illness. Crit. Care Med. 2011, 39, 2728–2735. [Google Scholar] [CrossRef] [PubMed]
- Borsboom, D.; Cramer, A.O.; Schmittmann, V.D.; Epskamp, S.; Waldorp, L.J. The small world of psychopathology. PLoS ONE 2011, 6, e27407. [Google Scholar] [CrossRef] [PubMed]
- Stam, C.J. Modern network science of neurological disorders. Nat. Rev. Neurosci. 2014, 15, 683–695. [Google Scholar] [CrossRef] [PubMed]
- McNally, R.J. Network analysis of psychopathology: controversies and challenges. Annu. Rev. Clin. Psychol. 2021, 17, 31–53. [Google Scholar] [CrossRef] [PubMed]
- Van der Maas, H.L. Complex-systems research in psychology ** This monograph explores psychological models through the lens of complexity science. Applies chaos, bifurcation, self-organization, psychological network analysis, and agent-based modeling to subjects like perception, depression, addiction, cognitive development, and polarization. In Santa Fe: The SFI Press Scholars Series.; 2024. [Google Scholar]
- Borsboom, D. A network theory of mental disorders. World Psychiatry 2017, 16, 5–13. [Google Scholar] [CrossRef] [PubMed]
- van de Leemput, I.A.; Wichers, M.; Cramer, A.O.; Borsboom, D.; Tuerlinckx, F.; Kuppens, P.; Van Nes, E.H.; Viechtbauer, W.; Giltay, E.J.; Aggen, S.H.; et al. Critical slowing down as early warning for the onset and termination of depression. Proc. Natl. Acad. Sci. 2014, 111, 87–92. [Google Scholar] [PubMed]
- Strogatz, S.H. Nonlinear dynamics and chaos: with applications to physics, biology, chemistry, and engineering; Chapman and Hall/CRC, 2024. [Google Scholar]
- Solé, R.V. Phase transitions; Princeton University Press, 2011; Vol. 16. [Google Scholar]
- Halu, A.; De Domenico, M.; Arenas, A.; Sharma, A. The multiplex network of human diseases. npj Syst. Biol. Appl. 2019, 5, 15. [Google Scholar] [CrossRef] [PubMed]
- González-García, I.; Solé, R.V.; Costa, J. Metapopulation dynamics and spatial heterogeneity in cancer. Proc. Natl. Acad. Sci. 2002, 99, 13085–13089. [Google Scholar] [CrossRef] [PubMed]
- Hanahan, D.; Weinberg, R.A. Hallmarks of cancer: the next generation. cell 2011, 144, 646–674. [Google Scholar] [CrossRef] [PubMed]
- Hanahan, D. Hallmarks of cancer: new dimensions. Cancer Discov. 2022, 12, 31–46. [Google Scholar] [CrossRef] [PubMed]
- Marusyk, A.; Almendro, V.; Polyak, K. Intra-tumour heterogeneity: a looking glass for cancer? Nat. Rev. Cancer 2012, 12, 323–334. [Google Scholar] [CrossRef] [PubMed]
- Solé, R.; Valverde, S.; Rodriguez-Caso, C.; Sardanyés, J. Can a minimal replicating construct be identified as the embodiment of cancer? Bioessays 2014, 36, 503–512. [Google Scholar] [CrossRef] [PubMed]
- Aguadé-Gorgorió, G.; Costa, J.; Solé, R. An oncospace for human cancers. BioEssays 2023, 45, 2200215. [Google Scholar] [CrossRef]
- Gatenby, R.A. Population ecology issues in tumor growth. Cancer Res. 1991, 51, 2542–2547. [Google Scholar] [PubMed]
- Gatenby, R.A.; Silva, A.S.; Gillies, R.J.; Frieden, B.R. Adaptive therapy. Cancer Res. 2009, 69, 4894–4903. [Google Scholar] [CrossRef] [PubMed]
- Bunin, G. Ecological communities with Lotka-Volterra dynamics. Phys. Rev. E 2017, 95, 042414. [Google Scholar] [CrossRef] [PubMed]
- Aguadé-Gorgorió, G.; Anderson, A.R.; Solé, R. Modeling tumors as complex ecosystems * A systematic review of the use of generalized models of ecological dynamics applied to the modelling of cancer dynamics and its interactions with the immune system. Iscience 2024, 27. [Google Scholar] [PubMed]
- Pienta, K.J.; McGregor, N.; Axelrod, R.; Axelrod, D.E. Ecological therapy for cancer: defining tumors using an ecosystem paradigm suggests new opportunities for novel cancer treatments. Transl. Oncol. 2008, 1, 158–164. [Google Scholar] [CrossRef] [PubMed]
- Dujon, A.M.; Aktipis, A.; Alix-Panabières, C.; Amend, S.R.; Boddy, A.M.; Brown, J.S.; Capp, J.P.; DeGregori, J.; Ewald, P.; Gatenby, R.; et al. Identifying key questions in the ecology and evolution of cancer. Evol. Appl. 2021, 14, 877–892. [Google Scholar] [PubMed]
- Farrokhian, N.; Maltas, J.; Dinh, M.; Durmaz, A.; Ellsworth, P.; Hitomi, M.; McClure, E.; Marusyk, A.; Kaznatcheev, A.; Scott, J.G. Measuring competitive exclusion in non–small cell lung cancer. Sci. Adv. 2022, 8, eabm7212. [Google Scholar] [CrossRef] [PubMed]
- Hamilton, P.T.; Anholt, B.R.; Nelson, B.H. Tumour immunotherapy: lessons from predator–prey theory. Nat. Rev. Immunol. 2022, 22, 765–775. [Google Scholar] [CrossRef] [PubMed]
- Axelrod, R.; Axelrod, D.E.; Pienta, K.J. Evolution of cooperation among tumor cells. Proc. Natl. Acad. Sci. 2006, 103, 13474–13479. [Google Scholar] [CrossRef] [PubMed]
- Chang, C.Y.; Bajić, D.; Vila, J.C.; Estrela, S.; Sanchez, A. Emergent coexistence in multispecies microbial communities. Science 2023, 381, 343–348. [Google Scholar] [CrossRef] [PubMed]
- Aguadé-Gorgorió, G.; Kéfi, S. Emergent coexistence and the limits of reductionism in ecological communities. PLoS Comput. Biol. 2026, 22, e1014116. [Google Scholar] [CrossRef] [PubMed]
- Anderson, R.M.; May, R.M. Infectious diseases of humans: dynamics and control; Oxford University Press, 1991. [Google Scholar]
- Clark, D. Germs, genes, & civilization: How epidemics shaped who we are today; FT Press, 2010. [Google Scholar]
- Solé, R.; Elena, S.F. Viruses as complex adaptive systems; Princeton University Press, 2018. [Google Scholar]
- Pastor-Satorras, R.; Castellano, C.; Van Mieghem, P.; Vespignani, A. Epidemic processes in complex networks. Rev. Mod. Phys. 2015, 87, 925–979. [Google Scholar] [CrossRef]
- Barabási, A.L.; Gulbahce, N.; Loscalzo, J. Network medicine: a network-based approach to human disease. Nat. Rev. Genet. 2011, 12, 56–68. [Google Scholar] [PubMed]
- De Domenico, M. More is different in real-world multilayer networks. Nat. Phys. 2023, 19, 1247–1262. [Google Scholar] [CrossRef]
- De Domenico, M.; Allegri, L.; Caldarelli, G.; d’Andrea, V.; Di Camillo, B.; Rocha, L.M.; Rozum, J.; Sbarbati, R.; Zambelli, F. Challenges and opportunities for digital twins in precision medicine from a complex systems perspective ** This perspective highlights how digital twins can integrate mechanistic theory, multiscale modeling, and AI-driven data analysis into predictive frameworks capable of capturing disease as a dynamic systems-level process rather than a static molecular defect. npj Digit. Med. 2025, 8, 37. [Google Scholar] [PubMed]
- Verstraete, N.; Jurman, G.; Bertagnolli, G.; Ghavasieh, A.; Pancaldi, V.; De Domenico, M. CovMulNet19, integrating proteins, diseases, drugs, and symptoms: a network medicine approach to COVID-19. Netw. Syst. Med. 2020, 3, nsm–2020. [Google Scholar]
- Morselli Gysi, D.; Do Valle, I.; Zitnik, M.; Ameli, A.; Gan, X.; Varol, O.; Ghiassian, S.D.; Patten, J.J.; Davey, R.A.; Loscalzo, J.; et al. Network medicine framework for identifying drug-repurposing opportunities for COVID-19. Proc. Natl. Acad. Sci. 2021, 118, e2025581118. [Google Scholar] [CrossRef] [PubMed]
- Gupta, C.; Xu, J.; Jin, T.; Khullar, S.; Liu, X.; Alatkar, S.; Cheng, F.; Wang, D. Single-cell network biology characterizes cell type gene regulation for drug repurposing and phenotype prediction in Alzheimer’s disease. PLoS Comput. Biol. 2022, 18, e1010287. [Google Scholar] [CrossRef] [PubMed]
- Shanthamallu, U.S.; Kilpatrick, C.; Jones, A.; Rubin, J.; Saleh, A.; Barabási, A.L.; Akmaev, V.R.; Ghiassian, S.D. A Network-Based Framework to Discover Treatment-Response–Predicting Biomarkers for Complex Diseases Illustrates how network medicine and systems-level representations of disease can transform precision medicine by identifying predictive biomarkers as emergent properties of interacting molecular networks rather than isolated genes, proteins, or pathways. J. Mol. Diagn. 2024, 26. [Google Scholar] [CrossRef] [PubMed]
- Xiong, D.; Qiu, Y.; Zhao, J.; Zhou, Y.; Lee, D.; Gupta, S.; Torres, M.; Lu, W.; Liang, S.; Kang, J.J.; et al. A structurally informed human protein–protein interactome reveals proteome-wide perturbations caused by disease mutations. Nat. Biotechnol. 2024. [Google Scholar] [CrossRef] [PubMed]
- Lazebnik, Y. Can a biologist fix a radio?—Or, what I learned while studying apoptosis. Cancer Cell 2002, 2, 179–182. [Google Scholar] [CrossRef] [PubMed]
- Anderson, P.W. More is different: broken symmetry and the nature of the hierarchical structure of science. Science 1972, 177, 393–396. [Google Scholar] [PubMed]
- Noble, D. A theory of biological relativity: no privileged level of causation. Interface Focus 2012, 2, 55–64. [Google Scholar] [PubMed]
- De Domenico, M. Decoding the architecture of living systems. Rep. Prog. Phys. 2026, 89, 014601. [Google Scholar] [CrossRef]
- West, G.B. The importance of quantitative systemic thinking in medicine. The Lancet 2012, 379, 1551–1559. [Google Scholar] [CrossRef]
- Jack, C.R., Jr.; Bennett, D.A.; Blennow, K.; Carrillo, M.C.; Dunn, B.; Haeberlein, S.B.; Holtzman, D.M.; Jagust, W.; Jessen, F.; Karlawish, J.; et al. NIA-AA research framework: toward a biological definition of Alzheimer’s disease. Alzheimer’s Dement. 2018, 14, 535–562. [Google Scholar] [CrossRef]
- Urbanc, B.; Cruz, L.; Buldyrev, S.; Havlin, S.; Hyman, B.; Stanley, H. Dynamic feedback in an aggregation-disaggregation model. Phys. Rev. E 1999, 60, 2120. [Google Scholar] [CrossRef]
- Montaña-Valverde, G.; Martínez-Molina, N.; Aquilué-Llorens, D.; Patow, G.; Kringelbach, M.L.; Hinzen, W.; Deco, G. Disrupted Brain Hierarchical Organization in Alzheimer’s Disease Progression ** Presents a systematic dynamical network picture of Alzheimer’s disease, from the structural (network) to the dynamical systems approach, across multiple scales. medRxiv 2025. [Google Scholar] [PubMed]
- Nichols, E.; Szoeke, C.E.; Vollset, S.E.; Abbasi, N.; Abd-Allah, F.; Abdela, J.; Aichour, M.T.E.; Akinyemi, R.O.; Alahdab, F.; Asgedom, S.W.; et al. Global, regional, and national burden of Alzheimer’s disease and other dementias, 1990–2016: a systematic analysis for the Global Burden of Disease Study 2016. Lancet Neurol. 2019, 18, 88–106. [Google Scholar]
- Pósfai, M.; Barabási, A.L. Network science; Cambridge University Press: Cambridge, UK, 2016; Vol. 3. [Google Scholar]
- Albert, R.; Jeong, H.; Barabási, A.L. Error and attack tolerance of complex networks. nature 2000, 406, 378–382. [Google Scholar] [CrossRef] [PubMed]
- Artime, O.; Grassia, M.; De Domenico, M.; Gleeson, J.P.; Makse, H.A.; Mangioni, G.; Perc, M.; Radicchi, F. Robustness and resilience of complex networks ** Provides a unifying theoretical framework to understand how perturbations, network structure, resilience, and critical transitions govern the emergence, propagation, and systemic collapse of pathological states across biological scales. Nat. Rev. Phys. 2024, 6, 114–131. [Google Scholar]
- Del Sol, A.; Balling, R.; Hood, L.; Galas, D. Diseases as network perturbations. Curr. Opin. Biotechnol. 2010, 21, 566–571. [Google Scholar] [CrossRef] [PubMed]
- Bossa, M.N.; Sahli, H. A multidimensional ODE-based model of Alzheimer’s disease progression. Sci. Rep. 2023, 13, 3162. [Google Scholar] [PubMed]
- Aguilar, B.; Gibbs, D.L.; Reiss, D.J.; McConnell, M.; Danziger, S.A.; Dervan, A.; Trotter, M.; Bassett, D.; Hershberg, R.; Ratushny, A.V.; et al. A generalizable data-driven multicellular model of pancreatic ductal adenocarcinoma. Gigascience 2020, 9, giaa075. [Google Scholar] [CrossRef] [PubMed]
Figure 1.
Modeling complex diseases and critical transitions. (a-d) Symptom-network representation of disease dynamics. (a) A co-occurrence graph of Symptoms [25]. These graphs can be represented by pairs (, ) that interact through weighted connections () within a local neighborhood () (b), generating a collective activity variable (, A) which can be described by a mean-field approximation (c). Increasing stress or connectivity may induce abrupt transitions between healthy (H) and diseased (D) states, illustrated by the bifurcation landscape and potential functions in panel (d). (e-h) Ecological and community-level models of interacting cellular populations in cancer, illustrated in (e) by a microscope view of a colon tissue involving dysplasia (image courtesy of Robert Gatenby). In (f), a 3D tumor model (adapted from [26]) coexists and is indicated in different colors. They are coupled through an interaction matrix A, see (g). The dynamics can generate multiple stable attractor states (, , ), with transitions between them triggered by perturbations (h), thus indicating the existence of a landscape involving multiple attractor states (h, bottom). (i-l) Epidemic spreading on contact networks, illustrated in (i) by a picture of the intensive care unit during the COVID-19 pandemic (Gustavo Basso, CC BY-SA 4.0). Individuals are connected through a transmission network (j), which can be made of diverse kinds of agents. In the SIS dynamics (k), the propagation model is characterized by infection probabilities (), transmission rates (), recovery rates (), and network structure (). Under homogeneous assumptions, the model reduces to a mean-field description with average prevalence . The system exhibits an epidemic threshold separating disease eradication () from an endemic phase (), as illustrated in panel (l).
Figure 1.
Modeling complex diseases and critical transitions. (a-d) Symptom-network representation of disease dynamics. (a) A co-occurrence graph of Symptoms [25]. These graphs can be represented by pairs (, ) that interact through weighted connections () within a local neighborhood () (b), generating a collective activity variable (, A) which can be described by a mean-field approximation (c). Increasing stress or connectivity may induce abrupt transitions between healthy (H) and diseased (D) states, illustrated by the bifurcation landscape and potential functions in panel (d). (e-h) Ecological and community-level models of interacting cellular populations in cancer, illustrated in (e) by a microscope view of a colon tissue involving dysplasia (image courtesy of Robert Gatenby). In (f), a 3D tumor model (adapted from [26]) coexists and is indicated in different colors. They are coupled through an interaction matrix A, see (g). The dynamics can generate multiple stable attractor states (, , ), with transitions between them triggered by perturbations (h), thus indicating the existence of a landscape involving multiple attractor states (h, bottom). (i-l) Epidemic spreading on contact networks, illustrated in (i) by a picture of the intensive care unit during the COVID-19 pandemic (Gustavo Basso, CC BY-SA 4.0). Individuals are connected through a transmission network (j), which can be made of diverse kinds of agents. In the SIS dynamics (k), the propagation model is characterized by infection probabilities (), transmission rates (), recovery rates (), and network structure (). Under homogeneous assumptions, the model reduces to a mean-field description with average prevalence . The system exhibits an epidemic threshold separating disease eradication () from an endemic phase (), as illustrated in panel (l).
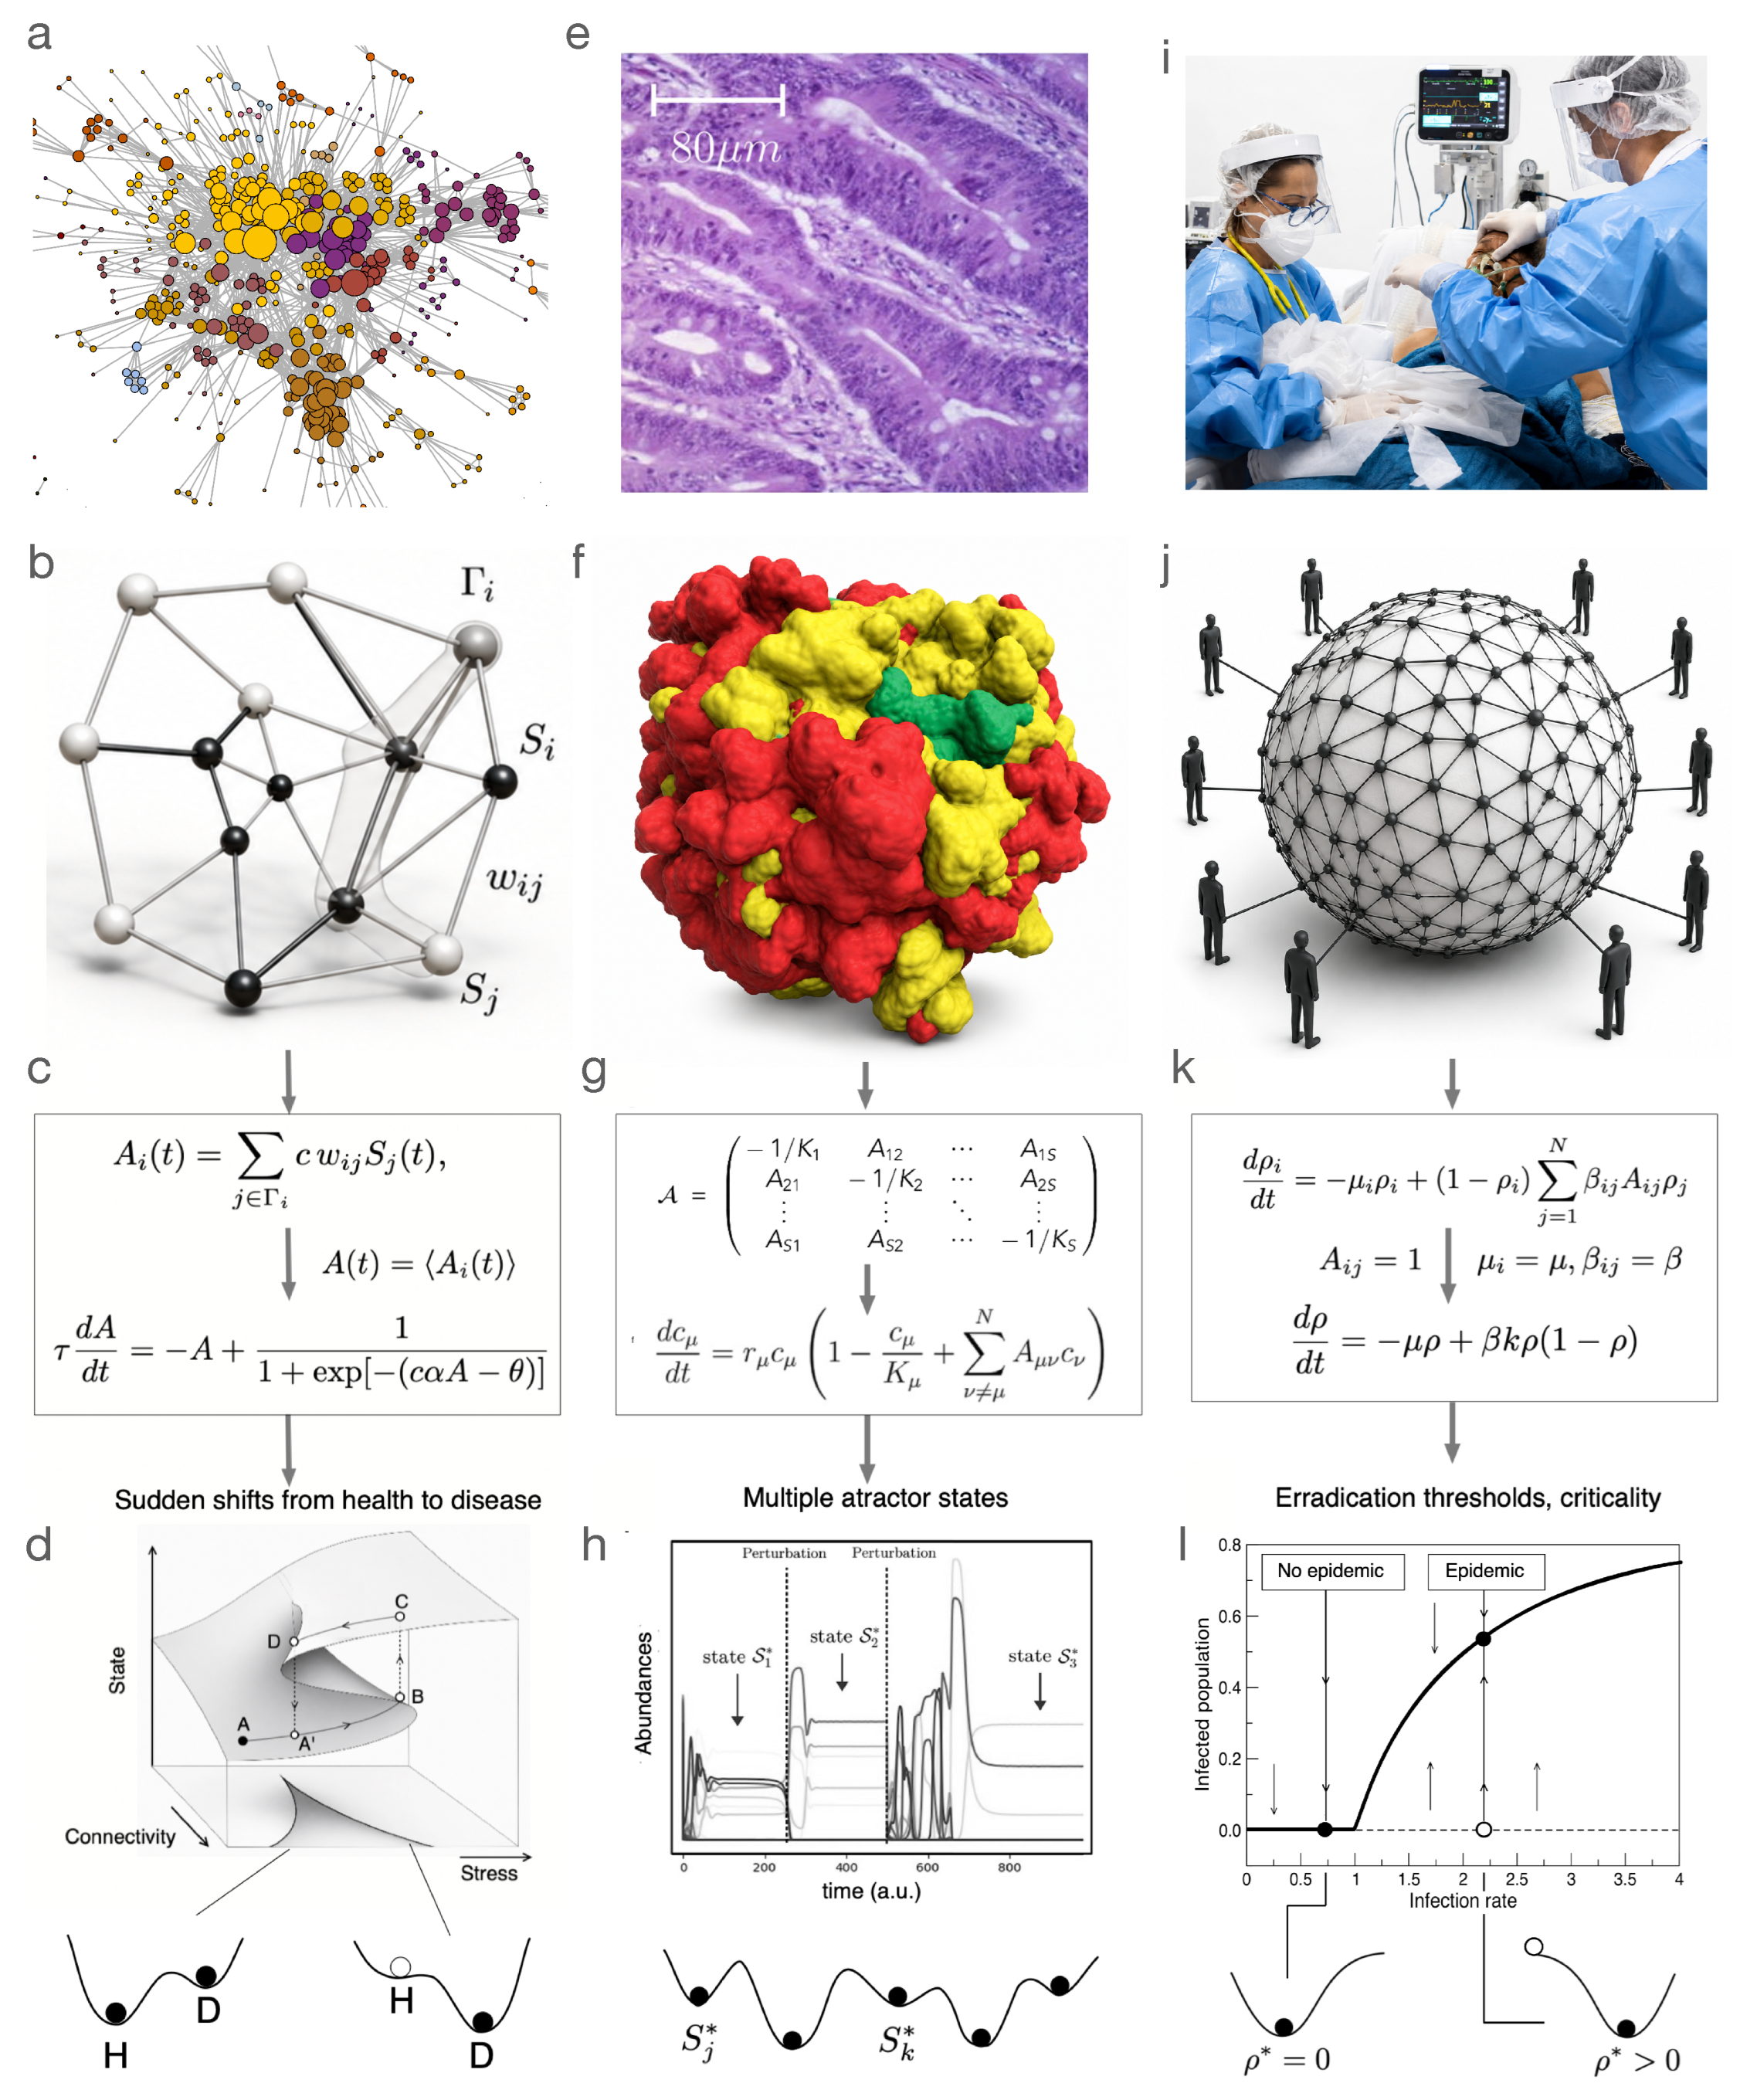
Figure 2.
Multiscale organization of Alzheimer’s disease and corresponding theoretical models. An illustration of the progression from molecular pathology to behavioral impairment in Alzheimer’s disease, along with mathematical frameworks used to model each level. The left column shows representative empirical observations at each scale, the central column highlights the associated theoretical abstractions, and the right column summarizes the corresponding mathematical models. First, protein interactions are described by kinetic equations governing the oligomerization of amyloid- or tau. Next, amyloid- and tau deposits are described as spatial processes of aggregation and disaggregation, giving rise to heterogeneous and percolation patterns. At the brain network scale, alterations in structural and functional connectivity are characterized using models of network centrality, efficiency, and dynamic synchronization, including the dynamics of stochastic oscillators. Finally, cognitive deficits are studied through linguistic co-occurrence networks, whose degradation is analyzed using network topology and percolation theory, applied to the results of time-limited word-generation tasks.
Figure 2.
Multiscale organization of Alzheimer’s disease and corresponding theoretical models. An illustration of the progression from molecular pathology to behavioral impairment in Alzheimer’s disease, along with mathematical frameworks used to model each level. The left column shows representative empirical observations at each scale, the central column highlights the associated theoretical abstractions, and the right column summarizes the corresponding mathematical models. First, protein interactions are described by kinetic equations governing the oligomerization of amyloid- or tau. Next, amyloid- and tau deposits are described as spatial processes of aggregation and disaggregation, giving rise to heterogeneous and percolation patterns. At the brain network scale, alterations in structural and functional connectivity are characterized using models of network centrality, efficiency, and dynamic synchronization, including the dynamics of stochastic oscillators. Finally, cognitive deficits are studied through linguistic co-occurrence networks, whose degradation is analyzed using network topology and percolation theory, applied to the results of time-limited word-generation tasks.
Disclaimer/Publisher’s Note: The statements, opinions and data contained in all publications are solely those of the individual author(s) and contributor(s) and not of MDPI and/or the editor(s). MDPI and/or the editor(s) disclaim responsibility for any injury to people or property resulting from any ideas, methods, instructions or products referred to in the content. |
© 2026 by the authors. Licensee MDPI, Basel, Switzerland. This article is an open access article distributed under the terms and conditions of the Creative Commons Attribution (CC BY) license (http://creativecommons.org/licenses/by/4.0/).
Copyright: This open access article is published under a Creative Commons CC BY 4.0 license, which permit the free download, distribution, and reuse, provided that the author and preprint are cited in any reuse.