

Submitted:
29 June 2026
Posted:
29 June 2026
Read the latest preprint version here
Abstract
Pixel-level annotation remains a major bottleneck for semantic segmentation, motivating methods that synthesize image-label pairs directly from generative models. Prior synthetic dataset generators typically obtain pseudo-labels from cross-attention maps or learned decoders over generative features; however, recent text-to-image (T2I) models increasingly use multimodal diffusion transformers (MM-DiTs), where concept localization is no longer exposed through a single cross-attention pathway but instead distributed across many layers and attention heads. Existing MM-DiT localization methods address this by aggregating saliency across heads, but we observe that this averaging can dilute clean target localizers due to attention head heterogeneity. We introduce HEADHUNTER, a training-free, open-vocabulary segmentation framework that uses aggregate concept saliency as a self-guided proxy to select the single attention head that best localizes a queried textual concept, yielding cleaner segmentation masks. We then use HEADHUNTER to turn target classes into training data automatically: a large language model (LLM) diversifies prompts, an MM-DiT generates images, HEADHUNTER produces pseudo-labels, and a vision language model (VLM) verifies each image-mask pair before acceptance. On PASCAL VOC2012, HEADHUNTER achieves 79.2 mIoU in zero-shot single-class segmentation, outperforming MM-DiT head aggregation. Using only our generated image-label pairs, DeepLabV3 with a ResNet-101 backbone reaches 64.9 mIoU on VOC2012 validation, matching or outperforming comparable synthetic dataset generators and showing that the proposed pipeline produces effective dense labels without human intervention. Code: https://github.com/Rohanl2298/HEADHUNTER.
Keywords:
dataset generation
; semantic segmentation
; diffusion transformer interpretability
1. Introduction
Dense visual understanding tasks such as semantic segmentation depend on pixel-level annotations, which remain among the most expensive and time-consuming labels to acquire. Annotating a single image can take up to 90 minutes [1], and in certain domains the relevant labeled data frequently does not even exist due to issues such as privacy or confidentiality [2,3]. To sidestep these limitations, a growing body of work generates image-label pairs directly from generative models. Early methods such as DatasetGAN [4] and BigDatasetGAN [5] train a shallow decoder on a small number of manually labeled images to synthesize pixel-level annotations from the feature space of a generative adversarial network (GAN) [6]. More recently, the emergence of text-to-image (T2I) diffusion models, which generate highly realistic images from natural language prompts, has exposed a localization cue in the cross-attention between text and image tokens [7]. DiffuMask exploits this T2I cross-attention to localize class regions and refine them into masks via a trained affinity network [8]; Dataset Diffusion extends this with self-attention and large language model (LLM)-generated prompts to improve mask quality [9]; DatasetDM trains a perception decoder over the diffusion latent space to emit annotations for a range of dense tasks [10]; and MosaicFusion aggregates and thresholds cross-attention maps across layers and diffusion timesteps to produce instance masks [11].
The aforementioned approaches, however, are all built on U-Net-based diffusion models. The current generation of T2I models has shifted toward the multimodal diffusion transformer (MM-DiT) architecture, which replaces U-Net’s single cross-attention pathway with joint self-attention over concatenated image and text tokens [12,13]. As such, an emerging line of work has begun to probe how MM-DiTs localize textual concepts. ConceptAttention [14] shows that linearly projecting image and concept tokens into attention layer output space yields spatial saliency maps; and Seg4Diff [15] identifies specific “semantic grounding expert” layers whose image-to-text (I2T) attention aligns text tokens with coherent image regions. While their MM-DiT layer selection protocols vary, both methods ultimately aggregate saliency across all attention heads to form the final coarse segmentation mask, yet we observe this to be particularly detrimental to fine boundary detail. Our observation is that MM-DiTs contain a rich bank of concept-sensitive heads; some are noisy, some respond to context, others to object parts, and some are clean target concept localizers. Rather than averaging them, we ask which single head best localizes a given concept (see Figure 1).
Our method, HEADHUNTER, is a training-free, open-vocabulary MM-DiT segmentation framework that uses aggregated concept saliency as a self-guided proxy to score individual attention heads and emit the mask of the highest-agreeing head, achieving strong zero-shot segmentation performance (79.2 mIoU on single-class PASCAL VOC2012 [16]) and producing clean pseudo-labels for target concepts. We leverage this capability to apply HEADHUNTER to synthetic dataset generation, where the goal is not merely to segment existing images, but to create effective image-label pairs for training segmentation models. We propose a fully automatic annotated dataset synthesis pipeline: for a given concept, an LLM generates a diverse scene prompt; an MM-DiT synthesizes the corresponding image; HEADHUNTER extracts a pseudo-label for seed-based refinement; and a vision language model (VLM) performs QA. We evaluate the synthetic datasets generated by our method using the VOC2012 segmentation benchmark, achieving a competitive 64.9 mIoU relative to comparable synthetic dataset generators. To summarize, our contributions are:
- We show that aggregating MM-DiT attention heads discards fine boundary detail, and that selecting a single concept-aligned head yields sharper segmentation masks.
- We introduce HEADHUNTER, a training-free, open-vocabulary MM-DiT segmentation framework that selects this head using aggregate concept saliency as a self-guided proxy, achieving strong zero-shot segmentation performance.
- We propose a fully automatic annotated dataset synthesis pipeline built around HEADHUNTER, producing image-label pairs for target concepts without any human annotation, delivering competitive segmentation performance on the VOC2012 benchmark.
2. Related Work
2.1. Synthetic Dataset Generation for Semantic Segmentation
Manual pixel-level annotation remains a central bottleneck in semantic segmentation, and synthetic dataset generation seeks to address this challenge by generating image-label pairs directly from generative models. In addition to dataset diversity, the primary challenge of this line of research lies in the fact that the annotation mechanism used must localize the target object reliably enough to train segmentation models.
GANs. DatasetGAN [4] is one of the earliest examples of a synthetic dataset generator for semantic segmentation, training a lightweight decoder over GAN features from a small number of manually labeled images to synthesize additional images with dense labels. BigDatasetGAN [5] scales this idea to ImageNet-level class diversity [17] by annotating a small number of generated images per class and learning a feature interpreter over the generator’s internal representations. These methods demonstrate that the feature space of GANs can support dense annotation, but their masks depend on a supervised decoder trained from manually-annotated labels, while their outputs are tied to the GAN’s training distribution, and therefore, can only produce in-domain concepts.
Diffusion Models. The emergence of T2I diffusion models introduced an alternative pathway for synthetic dataset generation. Unlike GANs, text-conditioned diffusion models are pretrained on highly diverse image-text pairs (e.g., LAION-5B [18]) and can consequently render arbitrary scenes from natural language prompts for concepts from practically any domain. Additionally, the cross-attention between text tokens and image regions provides a spatial correspondence between each prompt word and the pixels it describes, a localization cue that can be used to form pseudo-labels. DiffuMask [8] leverages this capability to localize class-specific regions and synthesize image-label pairs, but observes that raw attention is too coarse for semantic segmentation and therefore trains an AffinityNet [19] to propagate and refine these activations into dense masks. Dataset Diffusion [9] uses an LLM for prompt design and constructs masks from a combination of cross-attention and self-attention maps, generating large VOC and COCO-style [20] synthetic datasets. DatasetDM [10] learns a perception decoder over the latent space of a pre-trained T2I diffusion model to enable the synthesis of images with paired dense annotations for perception tasks such as semantic segmentation and depth estimation. MosaicFusion [11] tackles large vocabulary instance segmentation by generating multiple objects in a composed image and obtaining instance masks through cross-attention maps aggregated across layers and timesteps, followed by thresholding and edge-aware refinement.
Our approach differs from these synthetic dataset generators in both architecture and annotation mechanism, as shown in Table 1. Rather than learning a decoder over generative features (DatasetGAN [4], BigDatasetGAN [5], DatasetDM [10]), or aggregating U-Net cross-attention maps into the final mask (DiffuMask [8], Dataset Diffusion [9], MosaicFusion [11]), we operate on a frozen MM-DiT and select the single attention head that best localizes a target concept, achieving an entirely training-free automatic annotated dataset synthesis pipeline.
2.2. Concept Localization in Diffusion Transformers
Many early diffusion-based concept localization and segmentation methods exploited the cross-attention maps of U-Net-based T2I diffusion models, where image features attend to text tokens through a relatively explicit conditioning pathway [21]. Current DiT-based models, however, replace the U-Net backbone with transformer blocks over latent image patches, exposing a sequence of image tokens processed by multi-head attention [22]. MM-DiTs extend this idea to T2I generation by jointly processing image and text tokens, allowing bidirectional information flow between modalities rather than a one-way cross-attention conditioning stream [12]. As a result, concept localization in MM-DiTs is relatively challenging, as text-image interaction is distributed across many layers, tokens, and heads, rather than concentrated in dedicated cross-attention modules.
Multimodal Attention. ConceptAttention [14] is one of the first works to show that MM-DiT representations can be used for dense visual localization. It introduces a separate concept token stream and computes dot-product similarity between concept and image patch representations in attention output space to produce spatial saliency maps for textual concepts. The concept tokens are updated alongside the image and prompt representations across MM-DiT layers, but are isolated through one-directional attention. This allows for concept token contextualization without altering image appearance, enabling open-vocabulary textual concepts to be queried on an image. Seg4Diff [15] instead analyzes the I2T attention of MM-DiTs and identifies particular “semantic grounding expert” layers where I2T attention aligns text tokens with spatially coherent image regions. By extracting these maps for classname tokens and reshaping them over latent image patches, class-specific masks can be generated for zero-shot open-vocabulary segmentation. It further proposes a lightweight LoRA fine-tuning strategy that uses annotated images to amplify semantic grouping, improving segmentation performance while also enhancing T2I synthesis quality.
Despite differing in their concept localization strategies, both methods aggregate saliency across all attention heads within selected MM-DiT layers to form segmentation masks. Our observation, as shown in Figure 1, is that semantic localization within these heads is not uniform, and that averaging dilutes stronger individual heads, degrading boundary precision and often merging target concepts with context. Our approach therefore uses aggregate MM-DiT concept saliency as a self-guided proxy to score individual attention heads and emit the mask of the single best head, yielding sharper pseudo-labels for target concepts without requiring any training or ground-truth (GT) labels.
3. Preliminaries
3.1. Rectified Flow Modelling Framework
MM-DiTs such as Stable Diffusion 3 [12] and FLUX.1 [13] are trained as rectified flow models [23], learning a velocity field along straight-line trajectories between data and noise distributions. Given an image latent and noise , the intermediate latent at time is given as
The corresponding conditional velocity is . A velocity model , conditioned on the encoded prompt , is trained with the flow matching objective
At inference time, an image is generated by integrating the learned ODE backward from to starting from
3.2. Multimodal Attention Mechanism
Our method operates on intermediate attention layer representations computed by at selected points along the rectified flow trajectory. The noised image latent is patchified into an image token stream , and the prompt is encoded into a prompt token stream . At multimodal attention layer , the model maintains image and prompt streams and . For attention head , queries, keys, and values are produced using modality-specific projections
where , , and , denote image and prompt projection matrices, respectively. We write scaled dot-product attention as
The image and prompt projections are concatenated along the token dimension and processed jointly by self-attention over the concatenated multimodal sequence before being split back into individual image and prompt outputs
which are combined across heads and passed through output projection and residual updates to produce and .
3.3. Saliency Maps from Multimodal Attention
Following [14], we augment the MM-DiT structure with a separate concept token stream , where each of the rows corresponds to a queried textual concept (e.g., “dog”, “car”). The initial concept embeddings are obtained by encoding the concept strings using the same text encoder used for the prompts. At each , concept tokens are treated as text-like tokens and reuse the prompt projection matrices
One-directional attention is performed to contextualize concept tokens without altering the original image or prompt streams
Concept localization is computed layer-wise in attention output space and then aggregated across selected layers to produce a saliency map
where and denote the head-aggregated image and concept representations at layer . In Section 4.2, we instead retain the per-head output representations and before head aggregation and select a single layer-head saliency map that best localizes the target concept.
4. Method
We introduce HEADHUNTER, a training-free open-vocabulary MM-DiT segmentation framework that emits the mask of the single best concept-aligned attention head using aggregate saliency as a self-guided proxy. We integrate HEADHUNTER as the annotation mechanism within a fully automated annotated dataset synthesis pipeline, as shown in Figure 2.
4.1. Prompt and Concept Generation
The first stage of the dataset synthesis pipeline produces, for each target class, a set of generation prompts and associated metadata. Following prior work that uses LLMs for prompt design [9], we employ Qwen3.6-27B [24] as a prompt planner to map out these specifications. Given a target class, the planner returns a text prompt , concept set for a target concept , and QA requirements for a VLM. Further details are given in Appendix A.
Prompt Diversity. To enhance the visual diversity of images generated by the T2I model, we instruct the LLM to vary text prompts along axes such as camera viewpoint, framing and scale, pose and orientation, background features, and object appearance. This differs from lexical prompt augmentation, where prompts are varied primarily through synonymous rewrites (e.g., “a red car driving on a city street” → “a red car racing through the city”). We empirically find that such synonymous variants often leave the visual scene relatively unchanged, and therefore explicitly disallow them to prevent the accumulation of visually redundant images.
Prompt Subcategories. Additionally, we instruct the LLM to form a series of subcategories for classes such as animals (e.g., dogs, cats) and vehicles (e.g., cars, boats) to improve their visual diversity following the findings of [8]. As shown in Figure 3, these classes are typically biased toward fairly standard representations in MM-DiTs, however, they exhibit large variability in the real-world (e.g., dog breeds → chihuahua, pug, etc.). We ablate the effects of prompt diversity to segmentation performance in Section 5.4.
Concept Sets. Each specification generated by the LLM carries two concept sets. The selection set contains the target and a generic “background” concept which acts as a catch-all competing channel; and the proxy set , which additionally includes context nouns describing the scene (e.g., “grass”, “sky”). These scene-specific nouns give salient non-target image regions their own concept channels, preventing context activations from leaking into the target channel and yielding a cleaner proxy mask. We further examine the impact of this design choice in Section 5.4.
4.2. Self-Guided Attention Head Selection
Given a generated image and its concept lists and , the second stage of the dataset synthesis pipeline produces a concept saliency map by selecting the single attention head that best localizes the target. Recall from Section 3.3 that per-head output representations and are formed by applying one-directional attention over concept queries and image and concept keys and values. For , each row of corresponds to a single queried concept. Let denote the index corresponding to the target concept . We compute saliency maps for candidate heads as
where the softmax is taken over the concept dimension and denotes the number of image tokens. Candidates are evaluated over layers and heads , yielding total saliency maps. Further details on layer selection are provided in Appendix B. Each candidate map is min-max normalized over image tokens. To rank them without GT masks, we construct a self-guided proxy using . Applying Eq. (11) gives a multi-channel proxy saliency map , which is binarized to form by assigning each image token to its highest-scoring proxy concept and retaining only tokens assigned to the target
where indexes image tokens and converts a Boolean condition into a binary mask. Each candidate head is then binarized at its own mean activation and scored by its agreement with using a two-class mIoU which rewards agreement on both the target and the background
Finally, we select the highest scoring head and emit the corresponding saliency map for thresholding and refinement
4.3. Mask Generation and Dataset QA
Mask Generation. The final stage of the dataset synthesis pipeline converts into a dense label and verifies whether the generated image-label pair is suitable for inclusion in the synthetic dataset. We first resize from to using bicubic upsampling and min-max normalize it, giving . The initial binary mask is then obtained by thresholding via
where indexes image pixels and is an Otsu threshold [25]. Because the raw thresholded mask can occasionally contain isolated activations, disconnected fragments, or small responses to surrounding context, we apply a lightweight cleanup step that anchors the mask around the dominant target support and removes isolated components, producing a cleaned mask . To alleviate the coarseness inherited from the token grid, we use SAM2 [26] prompted by to improve boundary adherence, as shown in Figure 4. We first compute a bounding box enclosing the localized region. Next, we select a positive foreground point inside this region so that SAM2 can identify which object within the box should be segmented. The generated image and box-point prompt are then passed to SAM2, which returns a boundary-refined segmentation mask .
Dataset QA. Because dataset synthesis is automatic, individual samples may contain undesirable flaws such as mask noise. Each image-label pair is therefore verified by a VLM before being admitted into the final dataset. We use Qwen3-VL [27] for this purpose and instruct it to adhere to the QA requirements generated by the LLM in Section 4.1 to assess target concept presence in the generated image as well as mask localization correctness. For each sample we render a composite QA image containing , , and a translucent mask overlay, and present it to the VLM together with the text prompt , target concept , and mask policy data. Further details are provided in Appendix C. A sample is accepted only when the target object is present, the mask covers the visible target structure, and background regions are excluded. Masks are rejected when they omit aspects of a target structure, miss a target instance, select a distractor, or leak into background regions. The accepted synthetic dataset for class is therefore
where denotes the QA pass decision made by the VLM. We ablate the contribution of the QA stage to segmentation performance in Section 5.4.
5. Experiments
5.1. Experimental Setup
We perform two experiments using the PASCAL VOC2012 [16] benchmark. First, we evaluate HEADHUNTER as a zero-shot segmenter against other interpretability baselines. We then assess the proposed dataset synthesis pipeline against comparable dataset generators for semantic segmentation, measuring the pipeline as a whole rather than the annotation mechanism in isolation, since the selected head seeds the refinement of Section 4.3 rather than producing the final mask.
Zero-Shot Segmentation. Following the protocol established in [14], we use a subset of 930 VOC2012 images that contain a single foreground class to evaluate HEADHUNTER as a zero-shot segmenter. For this task we encode each image into the MM-DiT latent space, diffuse it to the midpoint of the rectified flow trajectory by adding Gaussian noise, and extract the single best concept-aligned attention head. We only use the Otsu thresholded binary mask for evaluation (i.e., no mask cleanup or SAM2 refinement per Section 4.3).
Dataset Synthesis. We generate synthetic training data with FLUX.1-dev [13] using 20 sampling steps and a resolution of . For each VOC2012 class, Qwen3.6-27B [24] generates 250 prompts with corresponding concept sets. We use two fixed seeds per prompt to generate 500 images per class for a total of 10k training images. QA specifications generated by the LLM are used by Qwen3-VL [27] for dataset filtering, and samples that fail are automatically regenerated. Generating and verifying a single sample takes approximately 20 seconds on an NVIDIA RTX Pro 6000 GPU.
Downstream Training. We train DeepLabV3 [28] with ResNet-50 and ResNet-101 backbones [29] using the synthetic data generated by our pipeline. Generated images and masks are resized from to for training. All models are trained using the same fixed optimization, loss, and augmentation protocol, with full details provided in Appendix D. We evaluate segmentation performance on the full VOC2012 validation set of 1,449 images.
Evaluation Metrics. We report the mean intersection over union (mIoU) for all experiments. For the zero-shot segmentation task we follow [14] and compute mIoU over two classes: the target foreground and the background. For the dataset synthesis task we compute the standard mIoU averaged over all 20 VOC2012 classes.
5.2. Zero-Shot Segmentation
We first evaluate HEADHUNTER as a zero-shot segmenter to assess the thesis that individual attention heads localize target concepts better than the corresponding head-aggregated output. Table 2 reports single-class mIoU following the protocol described in Section 5.1 against ConceptAttention [14] and several other interpretability baselines. We omit Seg4Diff [15] as it reports no comparable single-class result and is not training-free. HEADHUNTER achieves 79.2 mIoU. ConceptAttention reports 76.5 on FLUX.1-schnell; reproduced on FLUX.1-dev it reaches 76.9. Since ConceptAttention aggregates concept saliency across heads, this 2.3 point gap supports the central hypothesis of this work: semantic localization is not uniformly distributed across heads, and aggregation can dilute stronger target-localizing heads, impacting segmentation performance. The larger gap relative to the gradient-based (Grad-CAM [30]) and attention-based (DAAM [31]) methods is consistent with the localization capabilities of these approaches, suggesting that their segmentation masks may be too coarse for accurate segmentation.
5.3. Synthetic Dataset Evaluation
We next evaluate the proposed dataset synthesis pipeline by training downstream semantic segmenters on the generated image-label pairs. Table 3 compares the mIoU of our dataset against comparable works DiffuMask [8] and Dataset Diffusion [9] on the VOC2012 validation set.
With a ResNet-101 backbone, our dataset reaches the highest result of 64.9 mIoU, exceeding Dataset Diffusion by 1.1 points at the same number of training images, and matching their best reported result of 64.8 mIoU, which they obtain with four times as much data (40k images). Using the ResNet-50 backbone we reach 60.7 mIoU, marginally below Dataset Diffusion while using 75% less training data, and exceeding DiffuMask by 3.3 points despite the latter using six times more images. For reference, the real VOC2012 training set attains 77.4 and 79.9 mIoU with the ResNet-50 and ResNet-101 backbones respectively, highlighting the domain gap that remains between synthetic and real-world data.
Per-Class Analysis. Table 4 reports per-class IoU for both backbones, with ResNet-101 showing consistent gains over ResNet-50 for nearly all classes. Our dataset performs particularly well on animals and vehicles, exceeding 80 IoU for aeroplane, car, cat, and cow, and almost reaching 90 IoU for bird and bus. For many other categories we record results in the 70-80 IoU range, and even achieve a notable 56.3 IoU for television (Dataset Diffusion [9] reports a score nearly half this). The weakest results are indoor furniture and thin-structure classes such as bicycles, which are particularly challenging to localize due to the resolution ceiling of the token grid. The open area between the spokes and rim often falls below the grid resolution and so the saliency map fills these regions in. While boundary refinement can sharpen the outer silhouette, it cannot recover these internal gaps, inflating the predicted mask and reducing IoU.
Table 5 compares selected per-class results (classes common to both baselines) against DiffuMask and Dataset Diffusion at matched backbones. Against DiffuMask (ResNet-50), our dataset achieves higher IoU on 10 of the 13 classes, including the difficult furniture classes chair (+9.0) and sofa (+9.7), as well as cow (+13.7) and dog (+9.1). Against Dataset Diffusion (ResNet-101), we lead on 8 of 13 classes, with large margins on car (+17.0), bird (+16.6), and cow (+11.5); the remaining classes are competitive, with Dataset Diffusion narrowly ahead on a few (e.g., horse, sheep).
Qualitative Results. Figure 5 presents representative synthetic image-mask pairs produced by the pipeline across a range of VOC classes. The annotations align very closely with object boundaries and correctly separate distinct instances in multi-object scenes, such as individual boats, birds, taxis, people, and monitors. These examples illustrate that the proposed pipeline produces accurate, well-localized masks across diverse object types, supporting the quantitative results reported.
Segmentation Predictions. Figure 6 shows predictions made on VOC2012 validation images from DeepLabV3 (ResNet-101 backbone) trained entirely on our synthetic dataset. The predicted masks exhibit close alignment with the GT across a range of classes and remain relatively robust in complex scenes with multiple object instances (e.g., boats and people).
5.4. Ablation Studies
We separate the ablations into two groups. First, Figure 7, Figure 8, Figure 9 and Figure 10 isolate the design choices underpinning HEADHUNTER. Second, Table 6 assesses the contribution of each stage of the dataset synthesis pipeline to semantic segmentation performance.
Number of Selected Heads. Figure 7 reports zero-shot single-class mIoU as we aggregate the top-h attention heads ranked by HEADHUNTER. Selecting a single head performs best at 79.2 mIoU. Aggregating a small number of heads remains competitive, indicating that the proxy identifies a useful set of concept-localizing heads. Performance drops most sharply when averaging across all 24 heads, falling to 76.9 mIoU and indicating that the localization signal is concentrated in a small subset of heads that aggregation dilutes.
Self-Guided Head Selection. HEADHUNTER selects the single best concept-localizing attention head without GT supervision. To assess its effectiveness, we compare the selected head against an oracle that, for each image, picks the candidate head with the highest true IoU against the GT mask. In zero-shot single-class segmentation the selected head recovers 91% of oracle mIoU (Figure 8), confirming that proxy agreement identifies near-optimal heads on the majority of images.
Selection Distribution. To evaluate whether HEADHUNTER simply discovers a single globally useful attention head, we examine head selection frequency on VOC2012 single-class. Figure 9 shows that selections are broadly distributed and that the most frequent head is only selected for 2.2% of all evaluated images. This indicates that HEADHUNTER does not collapse to a single fixed head, but instead performs image-dependent selection from a heterogeneous set of concept-sensitive heads.
Concept Sets. The proxy mask uses the target, background, and scene-specific context concepts, giving salient non-target regions their own channels. Restricting to a binary set drops selection quality from 79.2 to 69.3 mIoU, with the multi-concept proxy producing a better mask on 88% of images. As shown in Figure 10, the additional context channels draw context activations away from the target, yielding a cleaner proxy mask and a stronger reference for selection.
Table 6 reports targeted dataset synthesis pipeline ablations on selected classes, with the remainder held fixed. For each ablation, only the dog and car synthetic samples are regenerated under the modified configuration; the downstream segmenter is then retrained on the resulting synthetic dataset and evaluated on the full VOC2012 validation set. These two classes provide complementary diagnostics: dog stresses intra-class appearance variation, while car stresses structured scenes with frequent distractors.
Mask Refinement. Removing mask refinement and training with coarse binary masks () degrades both classes relatively uniformly, reducing dog IoU by 14.8 points and car by 12.1 points (overall mIoU falls by 4.6), reflecting its role as a general boundary sharpening step.
Prompt Diversity. Replacing the diverse LLM-curated prompts with generic ones produces the largest single-class drop in the ablation, with dog IoU falling 20.1 points. As discussed in Section 4.1, dog appearance varies widely across breeds, and generic prompts collapse this variability toward a few standardized representations (Figure 3), leaving the segmenter poorly exposed to the intra-class diversity it must generalize over. Car is less dramatically affected but still drops 12.6 points, with overall mIoU down 5.2.
QA Verification. Removing the VLM-based QA stage most affects car, with a 13.7 point drop, the largest effect of any component on this class. Car scenes commonly contain distractor objects such as other vehicles and pedestrians (irrespective of using negative prompts), and capture support structures (e.g., the road) in saliency maps, corrupting the candidate mask. The VLM is instructed to reject such incorrectly localized samples, and without it the resulting noisy labels degrade the segmenter. Dog is less affected, dropping 11.4 points, with overall mIoU down 5.2.
5.5. Limitations
Resolution Ceiling. Concept saliency is computed over a token grid, and structures finer than a single token are difficult to localize. Thin and perforated objects such as bicycles are most affected, since the gaps between spokes and rim fall below the grid resolution and are filled in by the saliency map. This is a property of the saliency resolution rather than the head selection, and it limits performance on thin-structure classes.
Concept Entanglement. For semantically related concepts, attention tends to activate jointly rather than selectively due to an inherited limitation of the saliency extraction mechanism [14]. Because HEADHUNTER selects among heterogeneous heads, it can only recover a clean target when a well-localized head exists, but it does not perform explicit concept disentanglement and cannot reliably separate concepts that the underlying saliency conflates (Figure 11).
Domain Gap. The synthetic-to-real domain gap is inherent to generated datasets and is shared across comparable works [8,9]. As reported in Section 5.3, it has a marked impact on segmentation performance, with our dataset sitting roughly 15 points below real-only training on VOC2012.
Compute Cost. Dataset generation is computationally demanding, taking up to 20 seconds per image on an RTX Pro 6000 GPU. While the annotation step itself is relatively fast (approximately 2 seconds), diffusion sampling over 20 steps takes roughly 16 seconds, followed by about 2 seconds for VLM-based QA. Producing the final synthetic dataset used in this study took roughly 4 full days.
6. Conclusions
We presented HEADHUNTER, a training-free, open-vocabulary segmentation framework that selects a single concept-aligned attention head from a frozen MM-DiT using aggregate concept saliency as a self-guided proxy. We showed that aggregating attention heads discards fine boundary detail, whereas selecting the single best localizing head yields sharper masks, and that this selection can be performed without GT supervision, recovering 91% of oracle mIoU on the VOC2012 zero-shot segmentation benchmark and reaching a competitive 79.2 mIoU. Built around this annotation mechanism, our fully automated dataset synthesis pipeline produces image-label pairs for target concepts without human intervention, with segmenters trained on datasets it generates reaching a competitive 64.9 mIoU (VOC2012) relative to comparable dataset generators.
Several directions remain open for future work. The token grid resolution limits the localization of very thin structures, which higher resolution attention or learned upsampling could address. Additionally, closely related concepts tend to get entangled, resulting in inaccurate segmentation; a natural next step would be to pursue disentanglement. The pipeline is also bounded by the training distribution of the generative model (e.g., FLUX.1-dev); extending it to specialized domains such as medical or industrial imagery would likely require adaptation, for example LoRA fine-tuning, but would enable the synthesis of highly specialized datasets. Finally, reducing the per-sample generation cost through faster diffusion samplers, and scaling the evaluation to larger benchmarks such as COCO [20], would broaden the applicability of the approach.
Author Contributions
Conceptualization, R.L.; methodology, R.L.; software, R.L.; validation, R.L.; formal analysis, R.L.; investigation, R.L.; resources, R.L., S.K., M.S., I.M.; data curation, R.L.; writing—original draft preparation, R.L.; writing—review and editing, R.L.; visualization, R.L.; supervision, S.K., M.S., I.M.; project administration, S.K., M.S., I.M. All authors have read and agreed to the published version of the manuscript.
Funding
This research received no external funding.
Data Availability Statement
The datasets developed and used in this study are available upon request from the corresponding author due to data storage limitations. The code developed and used in this study is publicly available at https://github.com/Rohanl2298/HEADHUNTER.
Conflicts of Interest
The authors declare no conflict of interest.
Abbreviations
The following abbreviations are used in this manuscript:
| CA | Cross Attention |
| DiT | Diffusion Transformer |
| GT | Ground Truth |
| I2T | Image-to-Text |
| LLM | Large Language Model |
| mIoU | Mean Intersection over Union |
| MM-DiT | Multimodal Diffusion Transformer |
| QA | Quality Assurance |
| SA | Self Attention |
| SAM2 | Segment Anything Model 2 |
| SD | Stable Diffusion |
| T2I | Text-to-Image |
| VLM | Vision Language Model |
| VOC | Visual Object Classes |
Appendix A. Prompt Planner Specifications
The LLM-based prompt planner produces the structured specifications used to generate synthetic image-label pairs. For each target class, we instruct the LLM to return a text prompt together with the target concept, proxy concepts, expected target count, mask policy, and QA requirements. The planner is instructed to make prompts visually diverse but easy to mask: the target should be visually dominant, mostly visible, and isolated from other VOC object classes. Diversity is encouraged through camera viewpoint, scale, pose, background/support, and appearance, rather than through synonym-only rewrites. The output is returned as strict JSON and is deterministically validated before being passed to the image generation and HEADHUNTER stages.

Table A1.
Prompt planner outputs.
| Output | Purpose |
|---|---|
| Prompt | Conditions the MM-DiT T2I model |
| Target Concept | Defines the object queried by HEADHUNTER |
| Proxy Concepts | Provides the concepts used for localization and the proxy mask |
| Expected Target Count | Indicates whether multiple visible instances should be masked |
| Mask Policy | Specifies which visible target pixels should be included |
| QA Requirements | Provides sample-specific checks used by the VLM QA stage |
The planner is constrained to produce simple, single target concepts whenever possible. Proxy concepts are required to be classifier-style labels rather than descriptive phrases (e.g., “grass”, “sky”, “floor” rather than “green lawn”, “blue sky”, or “wooden floor”). The prompt validator rejects common failure modes such as missing targets, non-target VOC objects, broad scene descriptions, incompatible class context (e.g., “a dog flying in the sky”), and proxy concept lists that omit the target.
Appendix B. Multimodal Attention Extraction Settings
All experiments use FLUX.1-dev [13] as the MM-DiT backbone. The transformer contains 19 dual-stream DiT blocks followed by 38 single-stream DiT blocks, with 24 attention heads per block. The same candidate set is used for zero-shot evaluation and synthetic dataset generation.
Table B1.
Multimodal attention extraction settings.
| Component | Setting |
|---|---|
| Backbone | FLUX.1-dev |
| Dual-stream DiT blocks | 19 |
| Single-stream DiT blocks | 38 |
| Attention heads per block | 24 |
| Candidate layers | All dual-stream MM-DiT layers |
| Candidate heads | All 24 heads per selected layer |
| Candidate maps per image | 19 × 24 = 456 |
Appendix C. Dataset QA Specifications
The VLM-based QA stage filters candidate synthetic image-label pairs before they are admitted into the final dataset. For each sample, we instruct the VLM to follow a series of criteria to assess the final refined mask. It is provided with: a composite QA image containing the generated image, binary mask, translucent overlay, and the generation prompt, target concept, expected target count, and mask policy. It returns a strict JSON verdict indicating whether the sample should be accepted.
Table C1.
Dataset QA criteria.
| Criterion | Instruction |
|---|---|
| Target Presence | The target object must be visible in the generated image |
| Count Consistency | The number of masked instances must match the target count |
| Target Coverage | The mask must cover the visible target structure |
| Non-Target Exclusion | Background/support/non-target regions must be excluded |
| Major Failures | Reject masks that miss structure/targets or fail the above |
| Minor Failures | Non-structural omissions/boundary issues may pass |
| Output Format | Return JSON only incl. the pass/fail decision with a reason |
The acceptance decision is based on the following critical QA fields returned by the VLM: target presence, count consistency, target coverage, non-target exclusion, and major failures. Samples are only accepted if all critical checks pass.
Appendix D. Segmentation Model Training Details
We train all downstream segmentation models using a fixed protocol so that differences in VOC2012 validation performance reflect the quality of the synthetic image-label pairs rather than changes in model tuning. Generated images and masks are resized from to for training. Each accepted synthetic sample contributes one semantic segmentation label: pixels inside the final mask are assigned to the requested target class , while all remaining pixels are assigned to background. For multi-instance samples, all accepted target instances are assigned to the same foreground class. PASCAL VOC annotations are used only for evaluation.
Table D1.
Segmentation Model Training Protocol.
| Component | Setting |
|---|---|
| Training Data | QA-accepted synthetic image-label pairs |
| Evaluation Data | PASCAL VOC2012 validation set |
| Classes | 21 VOC classes: 20 foreground classes + background |
| Label Construction | → all non-mask pixels → background |
| Segmenter | DeepLabV3 |
| Backbones | ResNet-50, ResNet-101 |
| Generated Resolution | |
| Training Resolution | |
| Optimizer | AdamW |
| Weight Decay | 10-4 |
| Batch Size | 8 |
| Training Iterations | 5,000 |
| Precision | Mixed precision |
| Learning Rate Schedule | Polynomial decay, power 0.9 |
| ResNet-50 Learning Rates | backbone, classifier |
| ResNet-101 Learning Rates | backbone, classifier |
| Loss | Pixel-wise cross-entropy + foreground Dice + auxiliary classifier cross-entropy |
| Loss Weights | Dice weight 0.5, auxiliary cross-entropy weight 0.4 |
| Augmentations | Random resized crop, horizontal flip, color jitter, Gaussian blur, perspective transform |
References
- Lin, H.; Upchurch, P.; Bala, K. Block Annotation: Better Image Annotation for Semantic Segmentation with Sub-Image Decomposition 2020. [CrossRef]
- The Future of Artificial Intelligence in the Face of Data Scarcity. Comput. Mater. Contin. 2025, 84, 1073–1099. [CrossRef]
- Roux, R.L.; Khaksar, S.; Sepehri, M.; Murray, I. A Hybrid Game Engine–Generative AI Framework for Overcoming Data Scarcity in Open-Pit Crack Detection. Mach. Learn. Knowl. Extr. 2026, 8. [CrossRef]
- Zhang, Y.; Ling, H.; Gao, J.; Yin, K.; Lafleche, J.-F.; Barriuso, A.; Torralba, A.; Fidler, S. DatasetGAN: Efficient Labeled Data Factory with Minimal Human Effort 2021.
- Li, D.; Ling, H.; Kim, S.W.; Kreis, K.; Barriuso, A.; Fidler, S.; Torralba, A. BigDatasetGAN: Synthesizing ImageNet with Pixel-Wise Annotations 2022.
- Goodfellow, I.J.; Pouget-Abadie, J.; Mirza, M.; Xu, B.; Warde-Farley, D.; Ozair, S.; Courville, A.; Bengio, Y. Generative Adversarial Networks 2014.
- Rombach, R.; Blattmann, A.; Lorenz, D.; Esser, P.; Ommer, B. High-Resolution Image Synthesis with Latent Diffusion Models 2022.
- Wu, W.; Zhao, Y.; Shou, M.Z.; Zhou, H.; Shen, C. DiffuMask: Synthesizing Images with Pixel-Level Annotations for Semantic Segmentation Using Diffusion Models 2024.
- Nguyen, Q.; Vu, T.; Tran, A.; Nguyen, K. Dataset Diffusion: Diffusion-Based Synthetic Dataset Generation for Pixel-Level Semantic Segmentation 2023.
- Wu, W.; Zhao, Y.; Chen, H.; Gu, Y.; Zhao, R.; He, Y.; Zhou, H.; Shou, M.Z.; Shen, C. DatasetDM: Synthesizing Data with Perception Annotations Using Diffusion Models 2023.
- Xie, J.; Li, W.; Li, X.; Liu, Z.; Ong, Y.S.; Loy, C.C. MosaicFusion: Diffusion Models as Data Augmenters for Large Vocabulary Instance Segmentation 2024. [CrossRef]
- Esser, P.; Kulal, S.; Blattmann, A.; Entezari, R.; Müller, J.; Saini, H.; Levi, Y.; Lorenz, D.; Sauer, A.; Boesel, F.; et al. Scaling Rectified Flow Transformers for High-Resolution Image Synthesis 2024.
- Black Forest Labs FLUX.1 2024.
- Helbling, A.; Meral, T.H.S.; Hoover, B.; Yanardag, P.; Chau, D.H. ConceptAttention: Diffusion Transformers Learn Highly Interpretable Features 2025.
- Kim, C.; Shin, H.; Hong, E.; Yoon, H.; Arnab, A.; Seo, P.H.; Hong, S.; Kim, S. Seg4Diff: Unveiling Open-Vocabulary Segmentation in Text-to-Image Diffusion Transformers 2025.
- Everingham, M.; Van Gool, L.; Williams, C.; Winn, J.; Zisserman, A. The Pascal Visual Object Classes (VOC) Challenge. Int. J. Comput. Vis. 2010, 88, 303–338. [CrossRef]
- Deng, J.; Dong, W.; Socher, R.; Li, L.-J.; Li, K.; Fei-Fei, L. ImageNet: A Large-Scale Hierarchical Image Database. In Proceedings of the 2009 IEEE Conference on Computer Vision and Pattern Recognition; June 2009; pp. 248–255. [CrossRef]
- Schuhmann, C.; Beaumont, R.; Vencu, R.; Gordon, C.; Wightman, R.; Cherti, M.; Coombes, T.; Katta, A.; Mullis, C.; Wortsman, M.; et al. LAION-5B: An Open Large-Scale Dataset for Training next Generation Image-Text Models 2022.
- Ahn, J.; Kwak, S. Learning Pixel-Level Semantic Affinity with Image-Level Supervision for Weakly Supervised Semantic Segmentation 2018.
- Lin, T.-Y.; Maire, M.; Belongie, S.; Bourdev, L.; Girshick, R.; Hays, J.; Perona, P.; Ramanan, D.; Zitnick, C.L.; Dollár, P. Microsoft COCO: Common Objects in Context 2015. [CrossRef]
- Petit, O.; Thome, N.; Rambour, C.; Soler, L. U-Net Transformer: Self and Cross Attention for Medical Image Segmentation 2021. [CrossRef]
- Peebles, W.; Xie, S. Scalable Diffusion Models with Transformers 2023.
- Liu, X.; Gong, C.; Liu, Q. Flow Straight and Fast: Learning to Generate and Transfer Data with Rectified Flow 2022. [CrossRef]
- Qwen Team Qwen3.6-27B: Flagship-Level Coding in a 27B Dense Model Available online: https://qwen.ai/blog?id=qwen3.6-27b (accessed on 21 June 2026).
- Otsu, N. A Threshold Selection Method from Gray-Level Histograms. IEEE Trans. Syst. Man Cybern. 1979, 9, 62–66. [CrossRef]
- Ravi, N.; Gabeur, V.; Hu, Y.-T.; Hu, R.; Ryali, C.; Ma, T.; Khedr, H.; Rädle, R.; Rolland, C.; Gustafson, L.; et al. SAM 2: Segment Anything in Images and Videos 2024.
- Bai, S.; Cai, Y.; Chen, R.; Chen, K.; Chen, X.; Cheng, Z.; Deng, L.; Ding, W.; Gao, C.; Ge, C.; et al. Qwen3-VL Technical Report 2025.
- Chen, L.-C.; Papandreou, G.; Schroff, F.; Adam, H. Rethinking Atrous Convolution for Semantic Image Segmentation 2017. [CrossRef]
- He, K.; Zhang, X.; Ren, S.; Sun, J. Deep Residual Learning for Image Recognition 2015.
- Selvaraju, R.R.; Cogswell, M.; Das, A.; Vedantam, R.; Parikh, D.; Batra, D. Grad-CAM: Visual Explanations from Deep Networks via Gradient-Based Localization. Int. J. Comput. Vis. 2020, 128, 336–359. [CrossRef]
- Tang, R.; Liu, L.; Pandey, A.; Jiang, Z.; Yang, G.; Kumar, K.; Stenetorp, P.; Lin, J.; Ture, F. What the DAAM: Interpreting Stable Diffusion Using Cross Attention 2022. [CrossRef]
Figure 1.
Motivation for HEADHUNTER. Individual MM-DiT attention heads exhibit heterogeneous concept localization behavior. Aggregating saliency maps across heads can dilute strong target localizers and degrade fine boundary detail. HEADHUNTER instead selects a single concept-aligned head, marked in green, producing a sharper segmentation mask than the corresponding head-aggregated output.
Figure 1.
Motivation for HEADHUNTER. Individual MM-DiT attention heads exhibit heterogeneous concept localization behavior. Aggregating saliency maps across heads can dilute strong target localizers and degrade fine boundary detail. HEADHUNTER instead selects a single concept-aligned head, marked in green, producing a sharper segmentation mask than the corresponding head-aggregated output.
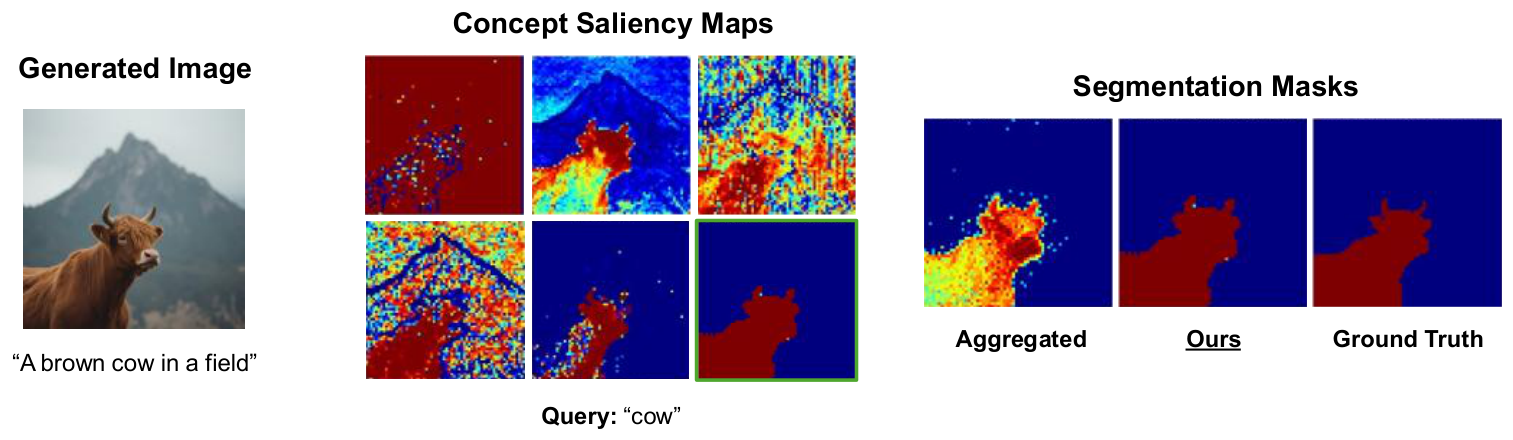
Figure 2.
Overview of the proposed dataset synthesis pipeline. An LLM generates a diverse text prompt and concept set which are used for image synthesis and concept localization. HEADHUNTER extracts multimodal attention for the target concept and aggregates it to form a proxy mask used for self-guided selection of the single attention head which best localizes the concept. The generated image and final mask are then verified by a VLM for target concept presence and mask correctness before accepting the pair into the synthetic dataset.
Figure 2.
Overview of the proposed dataset synthesis pipeline. An LLM generates a diverse text prompt and concept set which are used for image synthesis and concept localization. HEADHUNTER extracts multimodal attention for the target concept and aggregates it to form a proxy mask used for self-guided selection of the single attention head which best localizes the concept. The generated image and final mask are then verified by a VLM for target concept presence and mask correctness before accepting the pair into the synthetic dataset.
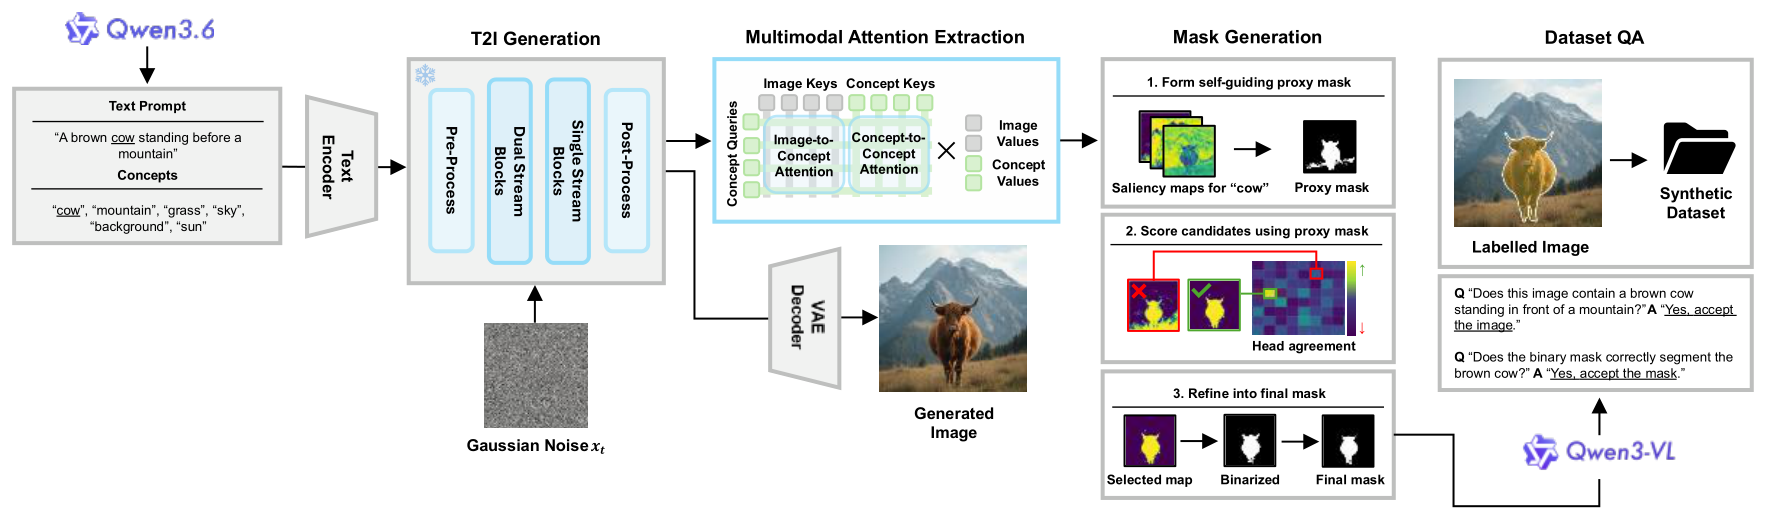
Figure 3.
Impact of class subcategories on generated image diversity. We instruct the prompt planner to use subcategories, such as different dog breeds, to ensure intra-class diversity in generated samples.
Figure 3.
Impact of class subcategories on generated image diversity. We instruct the prompt planner to use subcategories, such as different dog breeds, to ensure intra-class diversity in generated samples.
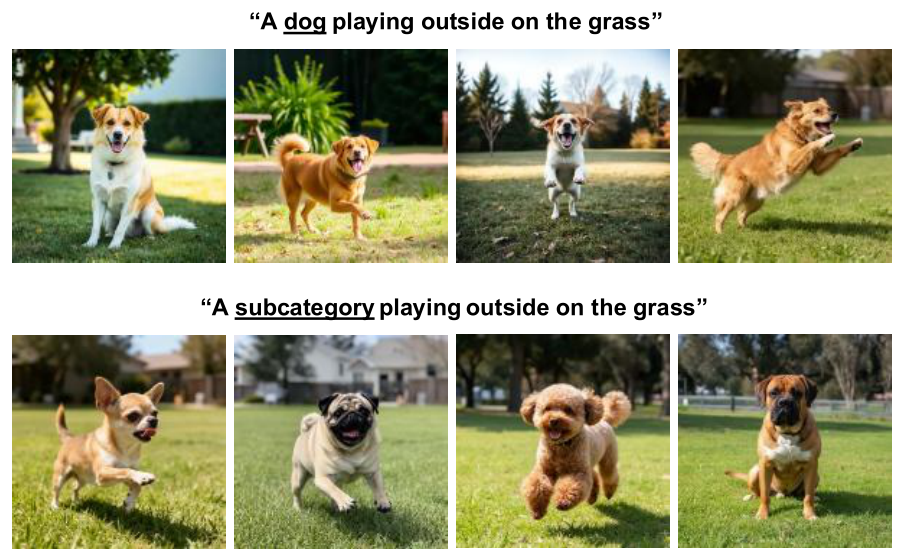
Figure 4.
Mask refinement. The HEADHUNTER selected saliency map is upsampled, thresholded, and lightly cleaned to form a coarse binary mask . We derive a box-point prompt from by enclosing the localized foreground support and selecting a positive point inside the mask. SAM2 then uses the generated image and box-point prompt to refine the object boundary, producing the final mask shown in yellow.
Figure 4.
Mask refinement. The HEADHUNTER selected saliency map is upsampled, thresholded, and lightly cleaned to form a coarse binary mask . We derive a box-point prompt from by enclosing the localized foreground support and selecting a positive point inside the mask. SAM2 then uses the generated image and box-point prompt to refine the object boundary, producing the final mask shown in yellow.
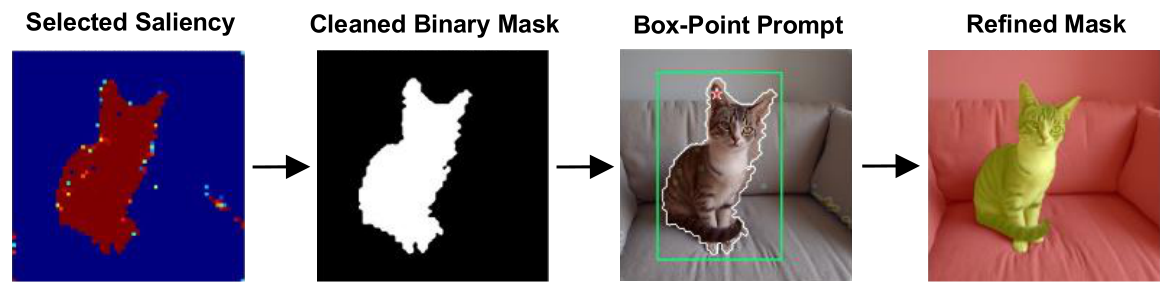
Figure 5.
Representative synthetic image-mask pairs generated by the pipeline. For each example, the generated image is shown alongside the corresponding mask overlaid on the image.
Figure 5.
Representative synthetic image-mask pairs generated by the pipeline. For each example, the generated image is shown alongside the corresponding mask overlaid on the image.
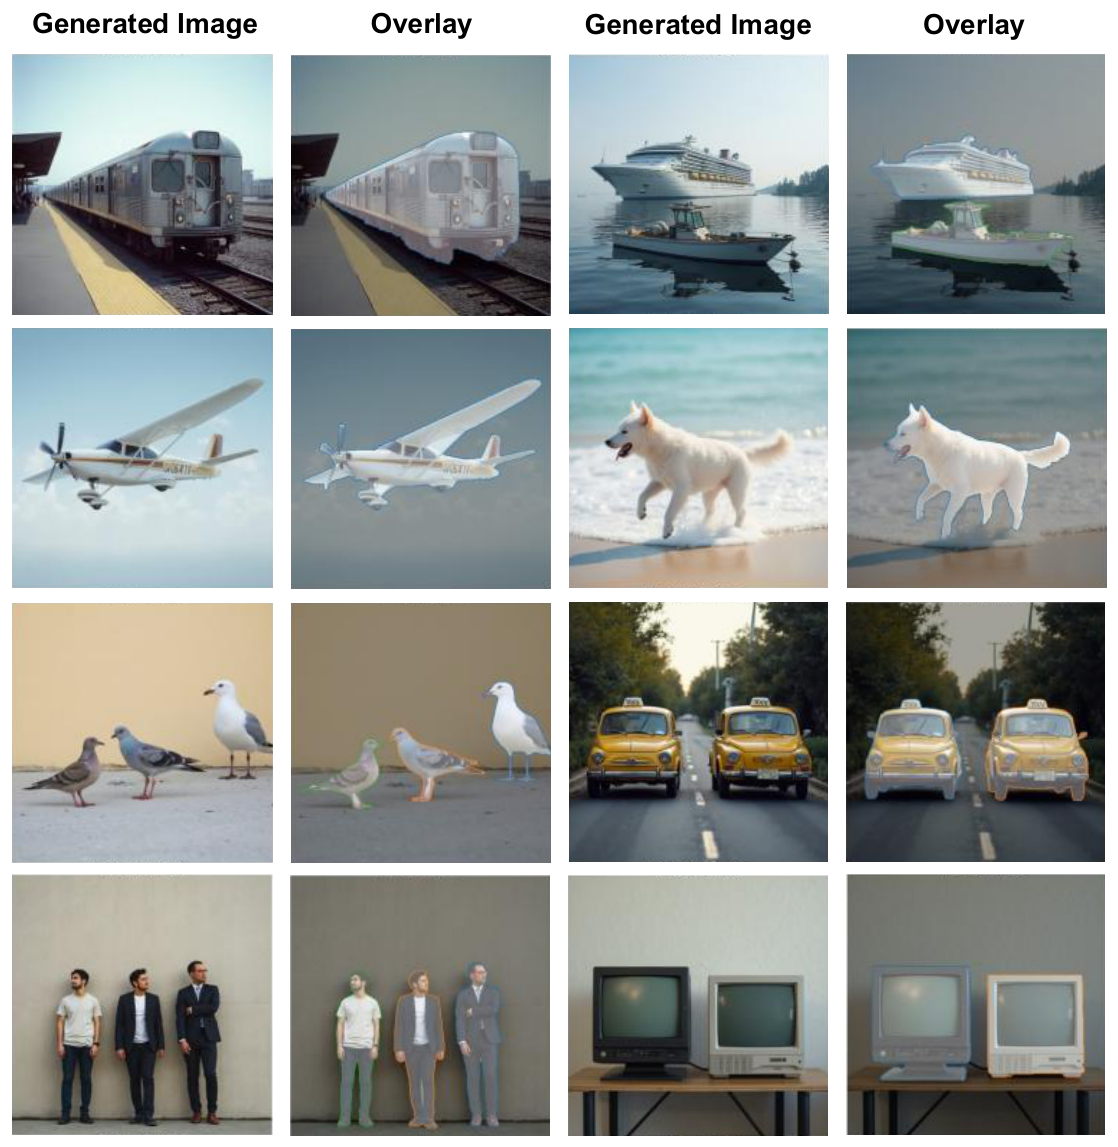
Figure 6.
Representative segmentation predictions made on VOC2012 validation images. For each example, the VOC2012 image, GT mask, and predicted mask are shown.
Figure 6.
Representative segmentation predictions made on VOC2012 validation images. For each example, the VOC2012 image, GT mask, and predicted mask are shown.
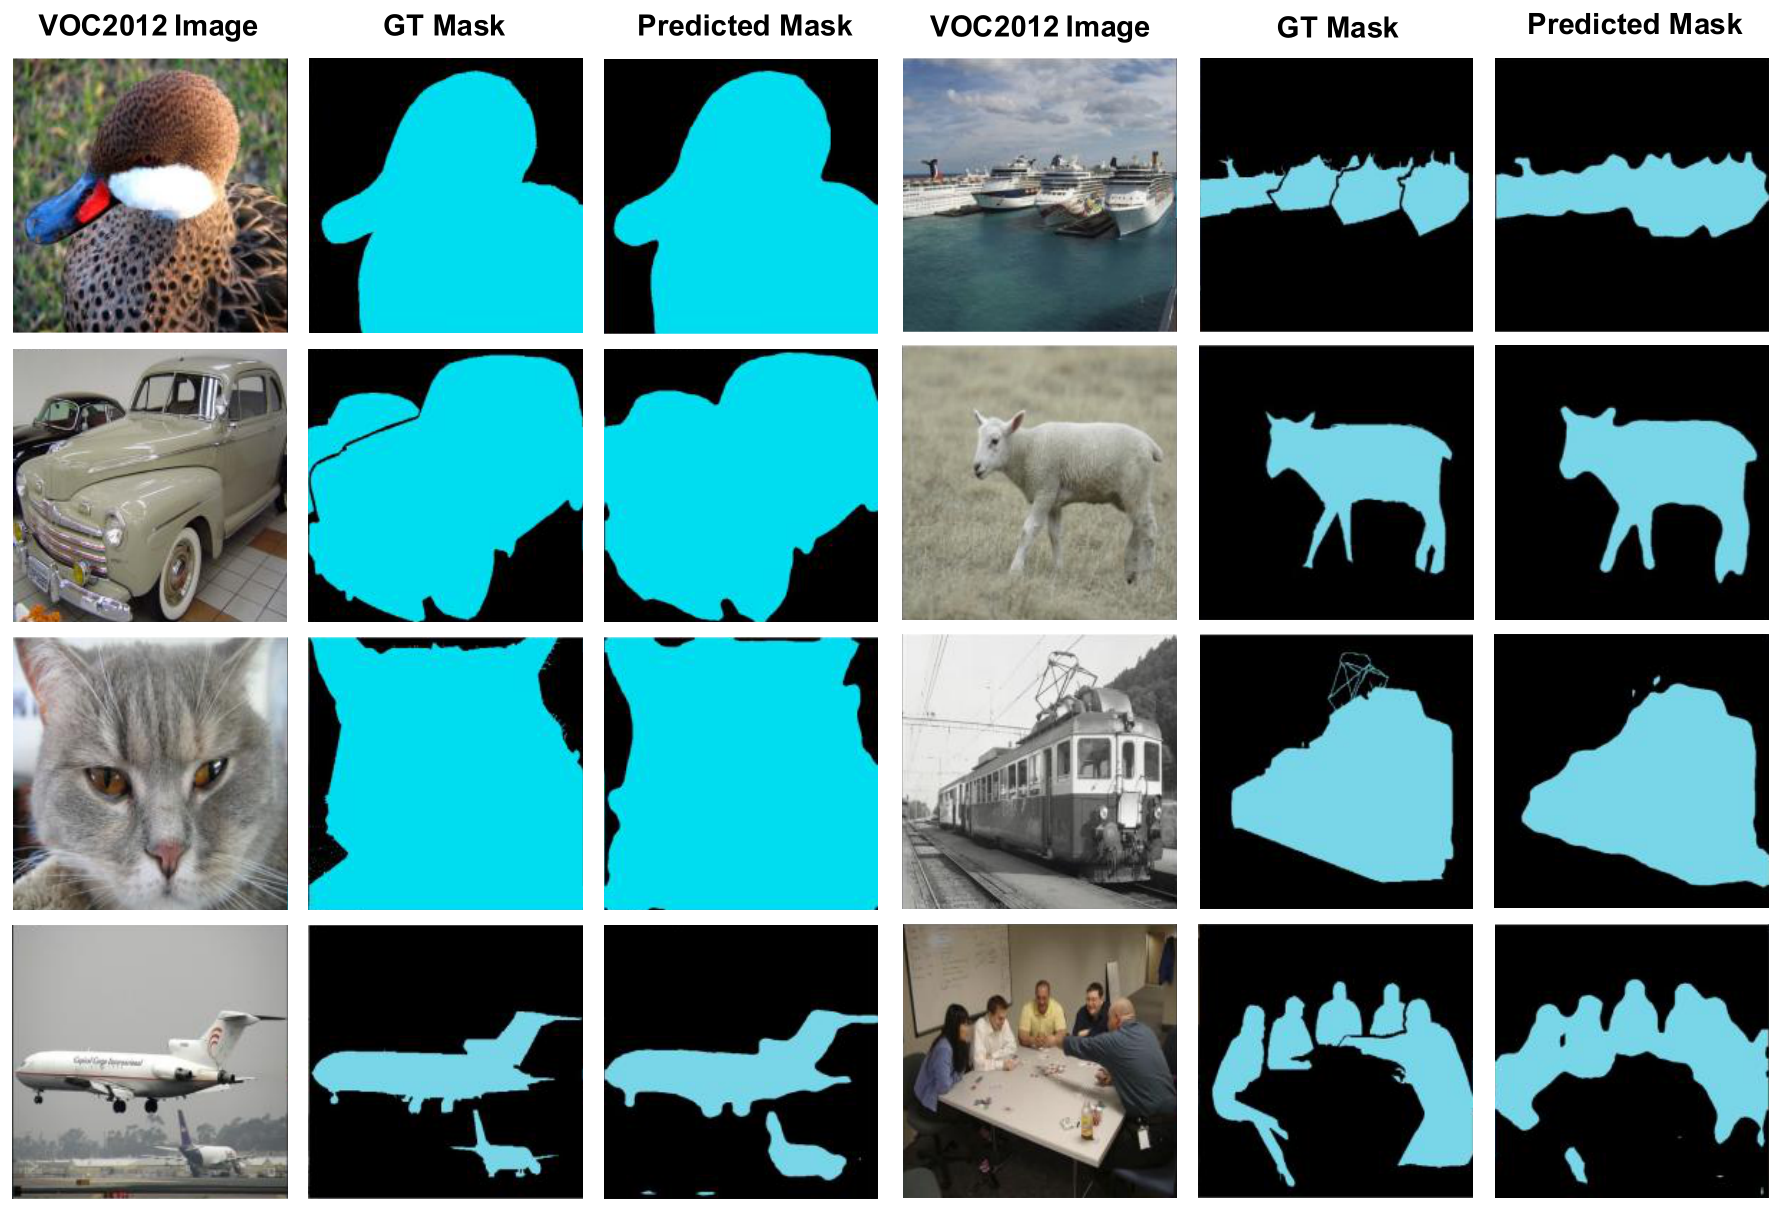
Figure 7.
Effect of attention head aggregation on zero-shot single-class segmentation. The top head (orange) performs best; aggregation of a subset of top heads remains more competitive than full averaging (grey).
Figure 7.
Effect of attention head aggregation on zero-shot single-class segmentation. The top head (orange) performs best; aggregation of a subset of top heads remains more competitive than full averaging (grey).
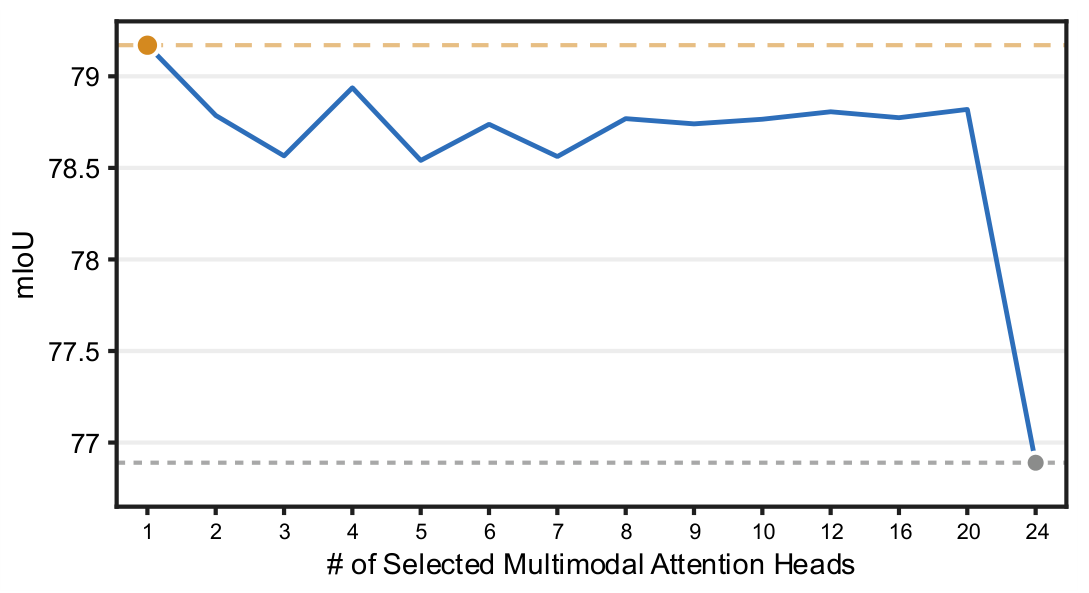
Figure 8.
Head selection vs. oracle on zero-shot single-class segmentation. HEADHUNTER identifies near-optimal heads without any supervision, recovering 91% of the oracle mIoU.
Figure 8.
Head selection vs. oracle on zero-shot single-class segmentation. HEADHUNTER identifies near-optimal heads without any supervision, recovering 91% of the oracle mIoU.
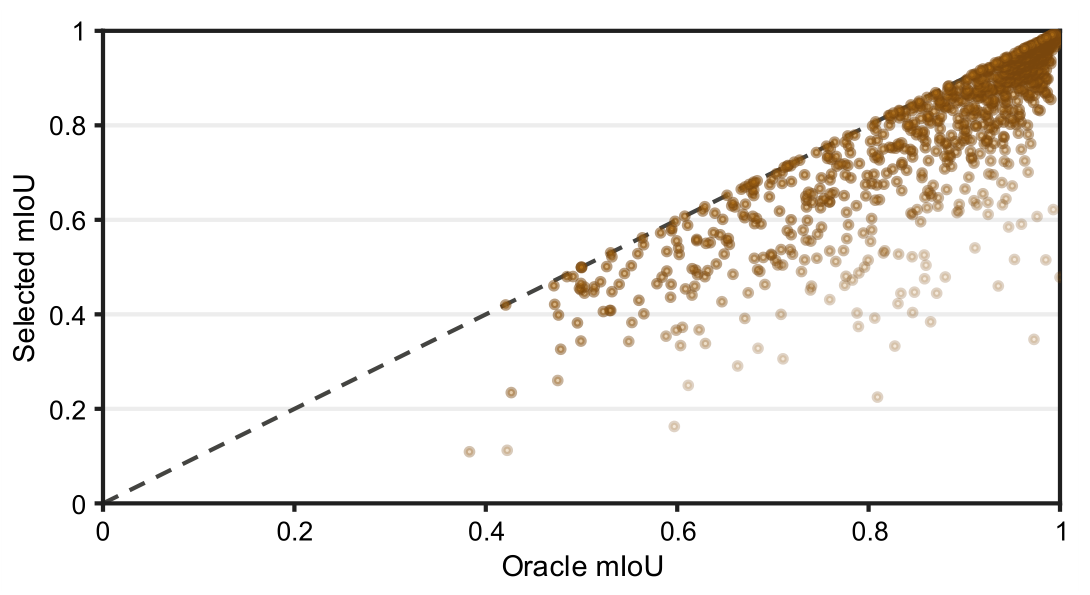
Figure 9.
Selection distribution on VOC2012 single-class. Each cell shows the frequency of evaluated images for which a given head is selected by HEADHUNTER.
Figure 9.
Selection distribution on VOC2012 single-class. Each cell shows the frequency of evaluated images for which a given head is selected by HEADHUNTER.
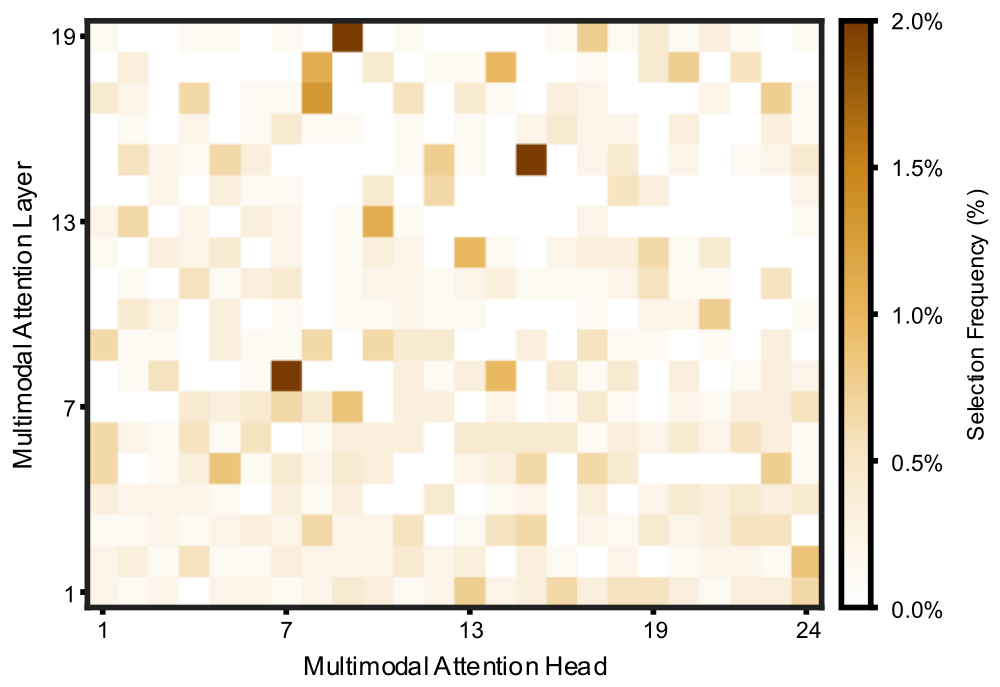
Figure 10.
Effect of proxy concept set on mask quality. Given the same input image, context activations leak into the target under the binary proxy, while the richer multi-concept proxy assigns those regions to their own channels, concentrating saliency on the target and producing a segmentation mask closer to the GT.
Figure 10.
Effect of proxy concept set on mask quality. Given the same input image, context activations leak into the target under the binary proxy, while the richer multi-concept proxy assigns those regions to their own channels, concentrating saliency on the target and producing a segmentation mask closer to the GT.
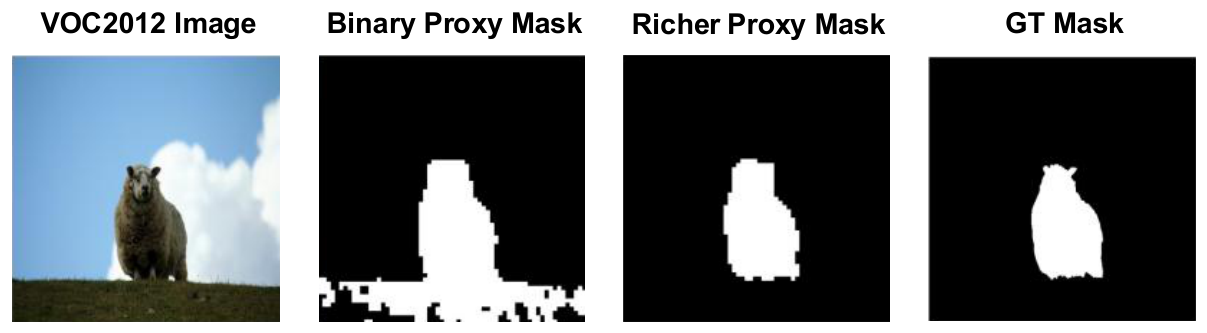
Figure 11.
Concept entanglement between semantically related concepts. Numbered markers (1–5) indicate five queried concepts from the scene, with saliency maps for each shown below. Semantically related concepts entangle, as shown by the maps for “dog” and “cat”, with the former ‘absorbing’ both animals, leaving the latter essentially empty. The remaining, semantically distant concepts localize cleanly, indicating that entanglement arises specifically between closely related concepts (e.g., animals).
Figure 11.
Concept entanglement between semantically related concepts. Numbered markers (1–5) indicate five queried concepts from the scene, with saliency maps for each shown below. Semantically related concepts entangle, as shown by the maps for “dog” and “cat”, with the former ‘absorbing’ both animals, leaving the latter essentially empty. The remaining, semantically distant concepts localize cleanly, indicating that entanglement arises specifically between closely related concepts (e.g., animals).
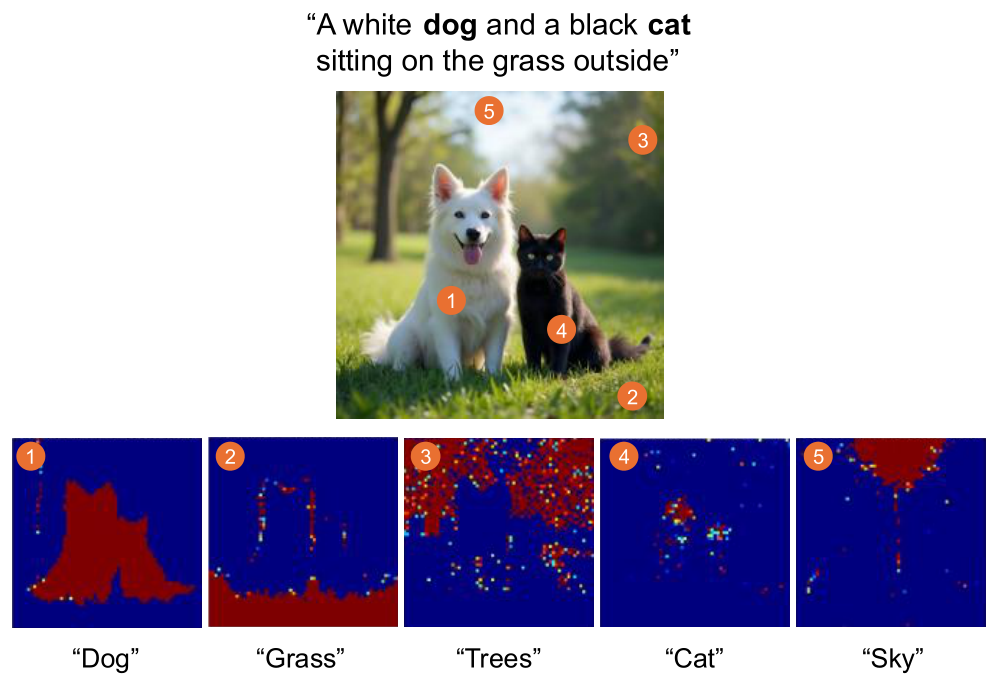
Table 1.
Comparison of related work on synthetic dataset generation for semantic segmentation.
| Method | Generator | Annotation Mechanism | Training Free |
|---|---|---|---|
| DatasetGAN [4] | GAN | Feature decoder | ✗ |
| BigDatasetGAN [5] | GAN | Feature decoder | ✗ |
| DiffuMask [8] | U-Net SD | CA | ✗ |
| Dataset Diffusion [9] | U-Net SD | CA + SA | ✓ |
| DatasetDM [10] | U-Net SD | Latent decoder | ✗ |
| MosaicFusion [11] | U-Net SD | CA | ✓ |
| Ours | MM-DiT | Selected MM-DiT head | ✓ |
Abbreviations: SD - Stable Diffusion; CA - Cross-Attention; SA - Self-Attention.
Table 2.
Zero-shot single-class segmentation results on VOC2012.
| Method | Architecture | mIoU |
|---|---|---|
| Grad-CAM [30] | CLIP ViT | 44.9 |
| DAAM [31] | SD2 U-Net | 45.0 |
| DAAM [31] | SDXL U-Net | 56.0 |
| ConceptAttention [14] | FLUX.1-schnell | 76.5 |
| ConceptAttention [14] (reproduced) | FLUX.1-dev | 76.9 |
| Ours | FLUX.1-dev | 79.2 |
Table 3.
Comparison of segmentation results on VOC2012 against comparable synthetic dataset generators.
Table 3.
Comparison of segmentation results on VOC2012 against comparable synthetic dataset generators.
| Dataset | Segmenter | Backbone | # Images | mIoU |
|---|---|---|---|---|
| Dataset Diffusion [9] | DeepLabV3 | ResNet-101 | 10k/40k | 63.8/64.8 |
| Ours | DeepLabV3 | ResNet-101 | 10k | 64.9 |
| DiffuMask [8] | Mask2Former | ResNet-50 | 60k | 57.4 |
| Dataset Diffusion [9] | DeepLabV3 | ResNet-50 | 40k | 61.6 |
| Ours | DeepLabV3 | ResNet-50 | 10k | 60.7 |
Table 4.
Per-class segmentation results on VOC2012 across ResNet-50 and ResNet-101 backbones.
| Class | ResNet-50 | ResNet-101 | Class | ResNet-50 | ResNet-101 |
|---|---|---|---|---|---|
| Aeroplane | 83.0 | 83.0 | Dining Table | 9.0 | 10.9 |
| Bicycle | 31.8 | 31.3 | Dog | 74.2 | 77.5 |
| Bird | 83.3 | 89.9 | Horse | 68.9 | 73.8 |
| Boat | 58.4 | 70.0 | Motorbike | 64.5 | 74.5 |
| Bottle | 61.9 | 72.2 | Person | 67.3 | 70.2 |
| Bus | 76.5 | 88.2 | Potted Plant | 38.0 | 43.0 |
| Car | 78.4 | 81.8 | Sheep | 72.5 | 76.7 |
| Cat | 79.5 | 84.5 | Sofa | 36.4 | 39.4 |
| Chair | 23.7 | 16.3 | Train | 74.1 | 78.1 |
| Cow | 77.1 | 80.7 | TV/Monitor | 55.4 | 56.3 |
Table 5.
Comparison of per-class segmentation results on VOC2012 classes reported by comparable baselines.
Table 5.
Comparison of per-class segmentation results on VOC2012 classes reported by comparable baselines.
| Class | DiffuMask [8] | Ours (ResNet-50) |
Dataset Diffusion [9] | Ours (ResNet-101) |
|---|---|---|---|---|
| Aeroplane | 80.7 | 83.0 | 81.6 | 83.0 |
| Bird | 86.7 | 83.3 | 73.3 | 89.9 |
| Boat | 56.9 | 58.4 | 62.2 | 70.0 |
| Bus | 81.2 | 76.5 | 85.5 | 88.2 |
| Car | 74.2 | 78.4 | 64.8 | 81.8 |
| Cat | 79.3 | 79.5 | 78.2 | 84.5 |
| Chair | 14.7 | 23.7 | 21.6 | 16.3 |
| Cow | 63.4 | 77.1 | 69.2 | 80.7 |
| Dog | 65.1 | 74.2 | 71.8 | 77.5 |
| Horse | 64.6 | 68.9 | 78.2 | 73.8 |
| Person | 71.0 | 67.3 | 70.8 | 70.2 |
| Sheep | 64.7 | 72.5 | 77.8 | 76.7 |
| Sofa | 26.7 | 36.4 | 41.8 | 39.4 |
Table 6.
Targeted ablation of dataset synthesis pipeline components.
| Configuration | Dog | Car | mIoU |
|---|---|---|---|
| Full (ours) | 77.5 | 81.8 | 64.9 |
| − Mask refinement | 62.7 (−14.8) | 69.7 (−12.1) | 60.3 (−4.6) |
| − Prompt diversity | 57.4 (−20.1) | 69.2 (−12.6) | 59.7 (−5.2) |
| − QA verification | 66.1 (−11.4) | 68.1 (−13.7) | 59.7 (−5.2) |
Disclaimer/Publisher’s Note: The statements, opinions and data contained in all publications are solely those of the individual author(s) and contributor(s) and not of MDPI and/or the editor(s). MDPI and/or the editor(s) disclaim responsibility for any injury to people or property resulting from any ideas, methods, instructions or products referred to in the content. |
© 2026 by the authors. Licensee MDPI, Basel, Switzerland. This article is an open access article distributed under the terms and conditions of the Creative Commons Attribution (CC BY) license (http://creativecommons.org/licenses/by/4.0/).
Copyright: This open access article is published under a Creative Commons CC BY 4.0 license, which permit the free download, distribution, and reuse, provided that the author and preprint are cited in any reuse.