

Submitted:
29 June 2026
Posted:
01 July 2026
You are already at the latest version
Abstract
Although pairwise comparison-based MCDA methodologies such as AHP, ANP, and Fuzzy AHP have matured analytically, their adoption in group decision-making remains limited by a software gap: there is no open-source platform that integrates all three within a single architecture, and there is a lack of real-time multi-expert collaboration on the aggregation of pairwise comparison matrices. This paper introduces ThinkDecision, an open-source web platform that integrates client- side computation engines for all three methodologies (O(n2) for AHP/Fuzzy AHP, O(k · N3) forANP) with WebSocket synchronization supporting multi-expert AIJ/AIP aggregation at a latency of <50 ms. Validation shows a maximum deviation of 0.41–0.94% and machine precision (∼ 10−16) for aggregation, while latency remains below 100 ms. A case study on ERP vendor selection revealed rank reversal phenomena and a heterogeneity threshold (DL1 ≈ 0.20) above which AIJ and AIP diverge, demonstrating that the choice of methodology and aggregation strategy can materially alter decision outcomes and inconsistencies detectable only through multi-methodological evaluations such as ThinkDecision.
Keywords:
analytic hierarchy process
; analytic network process
; fuzzy logic
; multi-criteria decision making
; multi-expert aggregation
1. Introduction
Multi-Criteria Decision Analysis (MCDA), particularly the Analytic Hierarchy Process (AHP), has been a central topic in operations management and decision support system research since Saaty [1] introduced the eigenvalue-based pairwise comparison framework. This approach allows decision-makers to decompose complex problems into hierarchies and derive priority weights through a pairwise comparison matrix. Subsequent analytical developments have expanded the foundations of decision-making in various directions. Saaty [2] introduced the Analytic Network Process (ANP) approach, which accommodates interdependencies among criteria through network structures and supermatrices. van Laarhoven and Pedrycz [3] and Chang [4] integrated fuzzy sets into the AHP framework to address linguistic uncertainty in expert evaluations.
As the field has evolved, decision-making assessments have required multi-expert evaluations; thus, Forman and Peniwati [5] formalized multi-expert aggregation methods through the Aggregation of Individual Judgments (AIJ) and Aggregation of Individual Priorities (AIP) approaches. Although these analytical advances are substantial, the practical application of MCDA continues to face persistent challenges. Vaidya and Kumar [6], in a systematic review of more than 150 AHP applications, concluded that the gap between the availability of methods and the ease of their implementation remains a major obstacle. A similar phenomenon has been documented in the context of corporate strategic decision-making, such as vendor selection processes involving dozens of evaluation criteria, numerous vendor alternatives, and panels of experts from various divisions that often still rely on manual spreadsheets or expensive proprietary tools, even though AHP/ANP/Fuzzy frameworks have been available for several decades [7,8].
The main reason for this gap between theory and practice is that real-world multi-criteria decisions violate the assumptions underlying most analytical results, such as the assumption of a fully rational single expert, perfectly independent criteria, and the absence of linguistic ambiguity in evaluations [9,10]. In practice, the AHP/ANP process almost always involves a panel of several experts who provide different and even conflicting assessments [11]. The choice of aggregation method for these evaluations whether to use the geometric mean [12] or the simpler arithmetic mean [13,14] has direct consequences for consistency. Furthermore, the linguistic uncertainty inherent in expert evaluations drives the use of triangular fuzzy numbers, which adds a distinct layer of computational complexity [3,4]. The interaction between multiple experts, the choice of aggregation methods, and the uncertainty in expert judgments creates a multidimensional evaluation space that cannot be adequately characterized using currently available analytical tools [15,16]. There is a need for a modular, standardized computational infrastructure capable of evaluating decision-making processes that require simultaneous testing of various aggregation scenarios, varying levels of disagreement among experts, and various consistency metrics.
However, the current landscape of available computational tools has limitations and cannot yet meet these diverse needs. Existing multi-criteria decision-making (MCDM) platforms, such as Expert Choice, are proprietary and subject to licensing restrictions [17]. SuperDecisions is a free-to-use platform, but its structural scope is limited because it only supports ANP and AHP without fuzzy integration or multi-expert collaboration [18]. The Priest software also offers a pedagogical interface for AHP only and is not designed for large-scale research evaluation [19]. In R, there is the `ahp` package [20], and in Python, there is the `ahpsurvey` package [21] for flexibility; however, unfortunately, both packages only provide the AHP model and do not support fuzzy logic or multi-expert aggregation.
This paper aims to address this deficiency, the lack of an open-source platform that integrates pairwise comparison-based MCDA methods with real-time multi-expert collaboration. To achieve this goal, this paper introduces ThinkDecision, an open-source web platform for decision analysis based on AHP, ANP, and Fuzzy AHP. ThinkDecision separates local computational functions from collaborative synchronization: priority calculations, Consistency Ratio, Geometric Consistency Index, and expert disagreement indicators are executed on the client-side MCDA engine to provide sub-second feedback, while WebSockets are used to synchronize rating changes, collaboration status, and case updates among users in real time. A REST API is used for authentication, case management, rating storage, and audit logging. This separation allows the system to remain responsive on the React Flow interface while maintaining data persistence and traceability through the backend. The platform was validated against the AHP benchmark published by Saaty [1] and presented ten sets of experiments on selection cases. The validation experiments demonstrated alignment with published analytical results, while the comparative experiments revealed significant gaps between existing tools and ThinkDecision as a collaborative web platform. The ThinkDecision package, along with its complete documentation, has been released as open source at https://github.com/thabedtholibb/thinkdecision.
2. Literature Review
2.1. Multi Criteria Decision and Metrics
MCDA provides a systematic framework for evaluating a number of alternatives based on several criteria that may have varying levels of importance. One of the most widely used MCDA methods is the Analytic Hierarchy Process (AHP), which was introduced by Saaty [1]. AHP breaks down a decision problem into a hierarchical structure consisting of objectives, criteria, subcriteria, and alternatives. Decision-makers’ preferences are represented by a pairwise comparison matrix for n elements being compared. The matrix satisfies the reciprocity property and . The relative priority weights of each element can then be derived using the eigenvalue method to form a normalized priority vector.
These priority vectors represent the relative level of importance of each element relative to elements at a higher hierarchical level. The reliability of AHP results is determined not only by the priority weight values but also by the consistency of the evaluations provided by the decision-maker. Consistency is necessary because fully independent pairwise comparisons can result in contradictory preference relationships. For example, if criterion A is rated as more important than criterion B, and criterion B is rated as more important than criterion C, the assessment of the relationship between A and C should still follow a consistent pattern. In AHP, the level of inconsistency is generally evaluated using CI and CR.
Saaty [22] uses a threshold of as a general criterion for assessing whether the level of inconsistency is still acceptable. However, the use of a single consistency indicator is not always sufficient to fully characterize inconsistency. Brunelli et al. [23] shows that consistency indices can have different sensitivities to patterns of inconsistency in pairwise comparison matrices. In addition to CR, several alternative indices have been developed, including Koczkodaj’s Index [24] and the Geometric Consistency Index (GCI) [25]. Koczkodaj’s Index [Koczkodaj, 1993] is defined as the minimum distance of a triad to its nearest consistent counterpart, extended to matrices of order n > 3 via the maximum such distance over all triads containing a given element, making it a global rather than purely local measure. Koczkodaj and Szwarc [26] further show axiomatically that centroid- and eigenvalue-based indicators such as CR and GCI can fail to detect arbitrarily large inconsistencies as matrix order grows, a limitation the distance-based indicator does not share. This motivates including it in ThinkDecision as a diagnostic complement, particularly when transparency and auditability are required.
Although AHP is effective for modeling hierarchical decision structures, the assumption of independence among elements does not always align with the characteristics of real-world problems. In many cases, one criterion may influence another, while alternatives may also provide feedback on the criteria used. To accommodate these relationships, Saaty [2] developed ANP as an extension of AHP. Unlike AHP, which uses a unidirectional hierarchical structure, ANP represents decision problems as a network that allows for interdependencies and feedback between elements and between clusters. These influence relationships are represented through the supermatrix W, which consists of blocks of local priority matrices. After the cluster weights are taken into account, the unweighted supermatrix is transformed into a weighted supermatrix. If the regularity condition is satisfied, repeated exponentiation of the weighted supermatrix will yield a limit supermatrix, which represents the global priorities of all elements in the network. After the cluster weights are applied, the global priorities are obtained through the convergence of the weighted supermatrix to the limit supermatrix.
ANP has higher computational requirements than AHP because its calculation process involves forming local priority blocks, weighting supermatrices, and iterating until convergence is reached. In AHP, extracting a priority vector from a single pairwise comparison matrix generally has a complexity of up to when using the conventional eigenvalue approach. In ANP, each iteration on an supermatrix can also incur a computational cost of up to if implemented using dense matrix multiplication. The total computational load further depends on the network size, the sparsity of the supermatrix, the number of iterations, and the convergence tolerance used. A literature review by Sipahi and Timor [15] shows that AHP and ANP have been widely applied in various decision-making domains. However, in computational implementations, the iteration parameters, stopping criteria, and convergence tolerance must still be explicitly reported to ensure the traceability and reproducibility of the results. Thus, ANP-based decision support systems must not only produce a final ranking but also provide information regarding the formation and convergence of the supermatrix.
The complexity of multi-criteria decision making stems not only from the structure of the relationships among criteria, but also from the decision-maker’s limitations in providing precise evaluations. In practice, preferences among elements are often expressed using linguistic terms, such as “slightly more important” or “much more important.” The single numerical representation in classical AHP is not fully capable of capturing the ambiguity and interpretive variation inherent in such assessments. Therefore, Fuzzy AHP was developed to represent linguistic uncertainty through fuzzy numbers [3,4,27].
One of the most commonly used representations is the Triangular Fuzzy Number (TFN), which is expressed as where . The parameters l, m, and u represent the lower bound, the most likely value, and the upper bound, respectively. This structure allows an assessment to be expressed as a range of values, rather than as a single absolute numerical point. The choice of method in Fuzzy AHP is related not only to the form of uncertainty representation but also to the priority derivation procedure and the defuzzification method. The extent analysis method introduced by Chang [4] is relatively simple computationally but can result in zero weights for certain elements. As an alternative, the fuzzy geometric mean method developed by Buckley [28] has a structure that is more consistent with the multiplicative characteristics of the pairwise comparison matrix. Furthermore, different defuzzification methods can yield different crisp values and priority orders. Therefore, the derivation and defuzzification procedures used must be explicitly stated so that the analysis results can be traced and reproduced.
Differences in weight derivation methods and forms of uncertainty representation can yield different rankings even when applied to the same problem [29,30]. Therefore, the choice of method should not be viewed as a neutral technical decision. Each approach involves a trade-off between computational efficiency, mathematical consistency, interpretability, and the ability to capture uncertainty. Furthermore, the ranking results must also be evaluated through sensitivity analysis to assess whether small changes in weights or model parameters can substantially alter the order of the alternatives. In the context of decision support system development, these conditions highlight the importance of a computational platform capable of providing multiple weight derivation methods, multiple consistency metrics, traceable convergence parameters, and transparent, reproducible analysis outputs. Such a platform serves not only as a computational tool but also as an analytical environment for comparing the methodological implications of each decision-making approach.
2.2. Multi Expert Aggregation and Group Decision Making
Multi-criteria decision-making applied in the real world rarely involves a single expert in assessing objectivity. Nearly all decisions today require a mathematically valid and socially acceptable collective agreement based on a panel of experts with diverse backgrounds and preferences. This section examines the four dimensions that shape the design space for multi-expert aggregation: the mathematical formulation of the aggregation procedure, the axiomatic properties that must be satisfied, the mechanisms for measurement and consensus-building, and the expert weighting scheme.
In the multi-expert aggregation process, Forman and Peniwati [5] distinguishes two main approaches: Aggregation of Individual Judgments (AIJ) and Aggregation of Individual Priorities (AIP). AIJ combines pairwise comparison matrices before deriving priorities, whereas AIP aggregates individual priority vectors after each expert has completed the evaluation process. AIJ is more appropriate when the expert panel is treated as a single collective entity, while AIP is more appropriate when the autonomy of individual preferences needs to be preserved [5,31].
The choice between using the AIJ or AIP method is not a trivial matter. Simply put, AIJ assumes that the expert panel acts as a single entity representing the “organization,” while AIP preserves the individual autonomy of each expert, making it suitable for contexts where experts represent fundamentally different interests [31]. The selection of an aggregation method must also be complemented by a mathematical operator that is ideal for combining these assessments, taking into account the axiomatic properties of that operator. Based on the study conducted, Aczél and Saaty [12] states that the geometric mean is the only aggregation procedure capable of simultaneously satisfying three properties: reciprocity, unanimity, and homogeneity.
On the other hand, the arithmetic mean—which intuitively seems simple and reasonable—actually fundamentally violates the reciprocity property: for two ratings a and b, the arithmetic mean yields , whereas the reciprocal is unless . Research findings indicate that the arithmetic mean can produce an aggregate matrix that lacks a priority vector consistent with the individual experts’ priority vectors, which constitutes a fundamental violation of the Pareto principle. Saaty and Vargas [32] demonstrates that this violation theoretically manifests as the rank reversal phenomenon in practice. The theoretical claim above has been confirmed by extensive empirical evidence. Triantaphyllou [13] experimentally demonstrated that AHP with arithmetic mean aggregation is susceptible to at least two types of rank reversal that do not occur in the multiplicative method
AHP using the geometric mean. The scope of this phenomenon is broader than expected; Maleki and Zahir [14] conducted a systematic review of more than 80 studies reporting rank reversal and categorized them into seven main variants: (i) addition of identical alternatives, (ii) addition of non-identical alternatives, (iii) deletion of alternatives, (iv) addition of criteria, (v) removal of criteria, (vi) changes in the comparison matrix, and (vii) changes in the aggregation method. In addition to influencing the choice of operators, the characteristics of the expert panel also determine the optimal aggregation strategy.
Ossadnik et al. [31] measured the relative sensitivity of AIJ and AIP to expert heterogeneity through Monte Carlo simulations and found that AIJ achieves higher aggregate consistency when inter-expert disagreement is low, while AIP is more stable when disagreement is substantial. The practical implications of these two findings converge on a single conclusion: the choice of aggregation operator and the choice of strategy (AIJ versus AIP) are interdependent on the characteristics of the expert panel; thus, practitioners require tools that support systematic exploration of combinations of both, rather than just a single fixed configuration. The discussion of expert disagreement in the previous section assumes that such disagreement can be objectively quantified. This measurement itself is a separate methodological issue that requires the selection of an appropriate metric. For two priority vectors and , the disagreement index is defined in Equation (1)
The equation above specifies generalization to E experts via pairwise averages or via Euclidean and Chebyshev distance-based metrics [33]. However, when disagreement exceeds an acceptable threshold, a formal mechanism is required to steer the panel toward consensus. Dong et al. [11] proposes an iterative consensus model based on the row geometric mean prioritization method (RGMM), which at each iteration t identifies the expert with the largest deviation from the current consensus and suggests an adjustment to the rating as presented in Equation (2)
Referring to the equation above, is the convergence rate parameter, and the process continues until for a predefined consensus threshold . This approach has been extended in several directions; Altuzarra et al. [34] proposes a Bayesian framework that treats each expert assessment as an observation with varying precision, Pedrycz and Song [35] integrated information granularity allocation to optimize aggregation in the presence of substantial disagreement, and Bryson [36] proposed a consensus measure based on the coefficient of variation that normalizes disagreement relative to the prior scale. These frameworks are conceptually complementary, but they are rarely implemented within a single computational tool; as a result, researchers who wish to compare their effectiveness on the same cases must currently code each method from scratch.
The entire discussion above regarding aggregation, axioms, and consensus relies on one assumption that has not yet been explicitly addressed: the weight of expert opinions. In practice, the assumption of equal weights () is often unrealistic because experts on a panel generally have varying levels of expertise, experience, and credibility. The literature offers two main approaches to this problem. Ramanathan and Ganesh [37] proposes an intrinsic weighting approach in which expert weights are determined endogenously through peer-to-peer evaluation (experts evaluate each other’s competence), while Escobar and Moreno-Jiménez [38] proposes an aggregation method that considers individual consistency as a proxy for the reliability of evaluations. Alternative exogenous approaches include weights based on organizational position, experience, or historical calibration against previous decisions [5]. Despite these advances, several fundamental questions remain open: (i) how to detect and address strategic manipulation by experts who are aware of the weighting scheme, (ii) how to accommodate heterogeneous expertise where different experts excel at different sub-criteria, and (iii) how to link static aggregation decisions to the dynamics of expert learning over time [11,33,39]. These questions, along with the previous discussion on operator selection, AIJ/AIP strategies, and consensus mechanisms, collectively require a computational infrastructure that enables systematic experimentation with combinations of weighting schemes, aggregation operators, and consensus mechanisms within a single integrated framework.
2.3. Existing Computational Tools
The previous subsections show that modern MCDA practice involves several methodological complexities, including multiple consistency metrics, competing fuzzy approaches, alternative aggregation strategies, heterogeneous expert panels, and unresolved questions regarding expert weighting. These issues raise an important question: to what extent do existing computational tools support systematic exploration of such methodological choices? This section reviews the current MCDA software landscape and identifies the gaps that motivated the development of ThinkDecision.
In the proprietary category, Expert Choice [17] is one of the most established commercial implementations of AHP and ANP based on Saaty’s framework. It provides a mature graphical interface, support for complex hierarchical models, and extensive sensitivity analysis. However, its usefulness for academic and experimental research is constrained by high licensing costs, a closed-source architecture that limits methodological extension and reproducibility [9], and the absence of a flexible API for integration with simulation pipelines or automated benchmarking.
SuperDecisions [18] provides an important alternative, particularly for ANP modeling. It supports supermatrix structures and network-based decision models, making it a common reference tool in ANP studies. Nevertheless, its desktop-based and Windows-oriented architecture limits its use in distributed collaborative settings. Multi-expert collaboration depends largely on manual file exchange, which may create version conflicts and data inconsistencies. Moreover, native Fuzzy AHP support and standardized benchmarking facilities are not available. PriEsT [19] is useful for teaching AHP because it implements several priority derivation methods, but it was designed primarily as a pedagogical tool rather than a platform for complex methodological experimentation.
Code-based alternatives exist in the R ecosystem. The “ahp” package [20] supports standard AHP and basic sensitivity analysis, while “ahpsurvey” [21] extends AHP to multi-respondent data. However, these packages do not support ANP supermatrix computation or Fuzzy AHP using triangular fuzzy numbers. Although “ahpsurvey” accommodates multiple experts, it does not explicitly implement the AIJ/AIP aggregation formalization proposed by Forman and Peniwati [5], as expressed in Equations (5) and (7). Consequently, aggregation comparison, consensus updating, and robustness evaluation must be implemented manually.
Due to these limitations, many MCDA studies rely on ad-hoc scripts in MATLAB, Python, or R [6,16]. Although flexible, this practice reduces reproducibility, comparability, and extensibility because scripts are often study-specific, undocumented, and not publicly released. These issues have been identified as barriers to cumulative methodological progress [16,40]. As summarized in Table 1, the main gap is the absence of an open-source, web-based platform that integrates AHP, ANP, and Fuzzy AHP with real-time multi-expert collaboration, consistency feedback, aggregation comparison, and systematic benchmarking. ThinkDecision was developed to address this gap.
3. Decision Engine
3.1. Mathematical Foundations
The mathematical foundation of ThinkDecision is designed by integrating three Multi-Criteria Decision Analysis (MCDA) methodologies: the classical Analytic Hierarchy Process (AHP) with eigenvalue-based priority derivation, the Analytic Network Process (ANP) with supermatrix computation, and Fuzzy AHP based on Triangular Fuzzy Number (TFN) arithmetic. All three methodologies use a basic mechanism of pairwise comparison but have different assumptions regarding problem structure and evaluation characteristics (Figure 1). AHP is used for problems with hierarchical structures; ANP extends AHP by accommodating dependencies and feedback between elements; and Fuzzy AHP is used to represent linguistic uncertainty in decision-makers’ evaluations [1,27,41]. The following formalizations are presented using consistent notation so that their computational components can be interchanged within the ThinkDecision modular architecture.
3.1.1. General Notation and Pairwise Comparison Matrices
Consider a decision-making problem involving n criteria and m alternatives. Let be a set consisting of E experts. Each expert e has an importance weight that is normalized such that:
For a local comparison process involving q homogeneous elements, each expert e constructs a pairwise comparison matrix:
Each element represents the relative importance of element i with respect to element j according to expert e. The use of symbol q is necessary because local comparisons are not limited to the main criteria, but can also be applied to subcriteria, clusters, and alternatives. In the classical AHP and ANP modes, the value of typically refers to the fundamental scale of Saaty 1–9 along with its reciprocal values [1]. In the Fuzzy AHP mode, linguistic evaluations are mapped into TFNs.
3.1.2. Aggregation of Multi-Expert Evaluations
ThinkDecision accommodates two aggregation strategies for group decision-making, namely Aggregation of Individual Judgments (AIJ) and Aggregation of Individual Priorities (AIP). The distinction between these strategies is necessary because the aggregation process at the evaluation level and the aggregation process at the priority vector level represent different group assumptions [5]. In the AIJ strategy, experts are treated as a single decision-making unit so that aggregation is performed before priority derivation. Each element of the aggregated matrix is calculated using the weighted geometric mean:
The weighted geometric mean is used because it preserves the reciprocal property of the pairwise comparison matrix:
In the AIP strategy, each individual matrix is first converted into a priority vector . These vectors can then be aggregated using the weighted arithmetic mean or the weighted geometric mean:
The choice of aggregation operator is stored as part of the analysis metadata because the two formulations are not mathematically equivalent and can produce different priority distributions.
3.1.3. Priority Derivation in the Classical AHP
In the classical AHP mode, the priority vector is derived based on the right principal eigenvector of the pairwise comparison matrix A. The matrix A can be an individual matrix if the analysis is conducted for a single expert or using the AIP strategy, or an aggregated matrix if the AIJ strategy is used. The eigenvalue relationship is expressed as:
The equation above states that is the principal eigenvalue of the matrix A. According to the Perron–Frobenius theorem, a pairwise comparison matrix with all positive elements has a real and positive principal eigenvalue and a corresponding eigenvector with positive elements. This eigenvector is then normalized to obtain the local priority vector. For a perfectly consistent matrix, the relationship between judgments satisfies for any relevant index combinations, and the principal eigenvalue equals the matrix order:
Deviation of from q indicates increased inconsistency in the judgments. Numerically, the principal eigenvector can be approximated using the power iteration method:
It is known that is a positive initial vector and is the numerical tolerance. Each iteration has a computational complexity of because it involves matrix-vector multiplication. If the leading eigenvalue is dominant, the asymptotic convergence rate of the method depends on the ratio , where is the eigenvalue with the second-largest magnitude.
| Algorithm 1 AHP Priority Derivation via Power Iteration |
|
3.1.4. Assessment Consistency Evaluation
The consistency of the evaluation must be assessed before the priority vector is used in the synthesis stage. ThinkDecision supports two complementary metrics: the CR and the GCI. The CR is conceptually related to the eigenvalue method, while the GCI is more aligned with the row geometric mean method [1,25]. For matrices of order , the Consistency Index (CI) and CR are calculated as:
is the Random Index for a matrix of order q. The value is commonly used as the acceptance threshold for is commonly used as the acceptance threshold for consistency, though CR/GCI may miss severe local inconsistencies in larger matrices [26]. ThinkDecision plans to report the Koczkodaj distance-based indicator [24] as a complementary diagnostic; reduction below the recommended threshold typically converges within ten iterations [42]. Matrices of order less than three do not require CR calculation as they are trivially consistent. As an additional diagnostic indicator, the GCI measures the logarithmic deviation between the elements of the comparison matrix and the priority ratios generated:
The threshold for GCI is determined based on the order of the matrix:
In a multi-expert analysis, consistency evaluation must be performed on the individual matrices . If the AIJ strategy is used, an additional evaluation is also performed on the aggregate matrix . This separation prevents situations where the aggregate matrix appears consistent but hides high levels of inconsistency in the individual evaluations.
3.1.5. Computation of the Supermatrix in ANP
ANP extends AHP by accommodating dependencies and feedback within and between groups of decision elements [39,41]. Suppose a decision network consists of K clusters , where each cluster contains elements and the total number of elements is:
Based on the column-based convention, an unweighted supermatrix is arranged as a block matrix:
Block contains local priorities that represent the influence of elements in cluster on elements in cluster . A zero element indicates the absence of a direct influence relationship in the network structure. Since an unweighted supermatrix is not necessarily stochastic, cluster weights are applied to each block to produce a weighted supermatrix:
If satisfies the required regularity conditions, for example, if it is primitive, the global priorities are derived through the limit supermatrix:
is the Frobenius norm and is the convergence tolerance. In the case of convergence, the columns of the boundary supermatrix provide the global priority weights of the network elements. Convergence should not be assumed to occur automatically. If the weighted supermatrix is reducible, periodic, or numerically unstable, ThinkDecision must display a non-convergence status so that the network structure can be re-examined. For methodologically relevant cases, the Cesàro averaging approach can be used as an additional analysis option:
3.1.6. Fuzzy AHP Based on Triangular Fuzzy Numbers
Fuzzy AHP extends classical AHP by representing linguistic uncertainty through fuzzy numbers. To ensure the computation pipeline remains explicit and reproducible, ThinkDecision’s core pipeline utilizes Triangular Fuzzy Numbers (TFNs) and Buckley’s fuzzy geometric mean method [27,28]. A TFN is represented as with , where l, m, and u represent the lower bound, modal value, and upper bound, respectively. For two positive TFNs and , the arithmetic operations used in the computation pipeline are defined as:
The inverse and power operations for positive TFNs are defined as:
| Algorithm 2 ANP Limit Supermatrix Computation |
|
Fuzzy comparison matrix satisfies the reciprocal and diagonal properties:
In multi-expert evaluation, the AIJ aggregation is applied component-wise using the weighted geometric mean:
With the use of Buckley’s method, the fuzzy geometric mean for row i and the corresponding fuzzy priority are calculated as:
When the fuzzy priority is expressed as , the crisp value is obtained using the Center of Gravity method and then normalized:
Algorithm 3 formalizes the entire Fuzzy AHP priority derivation pipeline implemented by ThinkDecision, integrating multi-expert aggregation (Equation (22)), fuzzy geometric mean (Equation (23)), and defuzzification (Equation (24)) into a single unified procedure. The dominant complexity of this algorithm is for computing the geometric mean on each row of the matrix, consistent with the complexity of the classical AHP but with a larger multiplicative constant due to simultaneous arithmetic operations on the three TFN parameters .
| Algorithm 3 Fuzzy AHP Priority Derivation via Buckley’s Geometric Mean Method |
|
3.1.7. Alternative Synthesis and Ranking
Once the local priorities have been obtained, the final rankings of the alternatives are calculated through a synthesis process tailored to the methodology used. In hierarchical AHP, let is the criterion priority vector and is the matrix of local alternative priorities, where represents the priority of the ith alternative with respect to the jth criterion. The global score of an alternative is determined by:
In ANP mode, the alternative global score is obtained from the relevant alternative row in the boundary supermatrix and then normalized. In Fuzzy AHP mode, the synthesis operation can be performed in the fuzzy domain before the final values are defuzzified and normalized. Thus, all three analysis modes produce final rankings that are comparable without compromising the mathematical assumptions of each methodology.
3.1.8. Numerical Validation and Reproducibility
The credibility of a multi-criteria decision support system depends on the numerical validity of its internal computations and the independent reproducibility of its results [43]. ThinkDecision implements a multi-layered validation framework spanning three stages. At the input level, pairwise comparison matrices must satisfy three mathematical properties before priority derivation: positivity (), reciprocity (, ), and unit diagonal (). For fuzzy matrices, the system additionally verifies TFN parameter ordering () [3] and fuzzy reciprocity [4]. During priority derivation, five numerical invariants are monitored. First, eigenvalue convergence: power iteration runs until (, ). Second, priority vector normalization: (). Third, Consistency Ratio: a warning is issued when , with a revision recommendation [22]. Fourth, for ANP mode, the column stochastic property is verified before limit iteration [2], a requirement critical for valid convergence yet frequently overlooked in ad-hoc implementations. Fifth, limit supermatrix convergence is monitored via (, ).
At the aggregation and synthesis stage, three boundary conditions are enforced. Expert weight normalization (, ) must hold prior to AIJ or AIP. Reciprocal preservation in the AIJ aggregate () is verified empirically despite its theoretical guarantee by the Aczél-Saaty theorem [12]. Final alternative scores are validated via to confirm a valid probability distribution (Equation (25)). Any violation triggers a specific diagnostic indicating the violation site and probable cause, such as near-singular matrices or extreme expert judgments.
3.2. System Architecture
ThinkDecision employs a five-layer web architecture that separates decision computation, collaborative synchronization, application services, and data persistence (Figure 2)
Five functional layers in ThinkDecision consisting of Client and Presentation, Gateway, Application, Data, and DevOps. The Client layer executes the MCDA engine directly in the browser to compute local priorities, Consistency Ratio, Geometric Consistency Index, and disagreement indicators, eliminating server roundtrip latency. The Application layer exposes a REST API for authentication, case management, judgment storage, and audit logging, alongside a WebSocket service for distributing collaborative events. This separation ensures sub-second interface responsiveness while the backend handles validation, synchronization, persistence, and access control.
At the outermost layer, the Client Layer consists of end-user devices that access the platform via a web browser. The design decision to use a web-based interface eliminates dependence on specific operating systems and enables global access without the need for local installation. This is an essential advantage for multi-expert collaboration involving participants from various geographic locations. Meanwhile, the Presentation Layer is implemented as a Single-Page Application (SPA) using the React framework for rapid development. This layer consists of three main interface modules: 1) Creator, which provides a hierarchy-building wizard and a case management dashboard; 2) Expert, which presents a pairwise comparison interface with a Saaty scale slider ranging from 1 to 9; and 3) Results Dashboard, which displays decision outcomes along with sensitivity analysis.
A key architectural decision in ThinkDecision is the implementation of an MCDA computation engine on the client side that performs all priority derivation, consistency calculations, and multi-expert aggregation directly in the user’s browser. This decision offers three significant advantages over traditional server-side computing architectures: truly real-time Consistency Ratio computation without server round-trip latency—which typically ranges from 100 to 500 ms on standard internet networks—a reduction in computational load on the backend server, enabling service to more concurrent users with the same infrastructure resources, and the ability to operate partially even when network connectivity is disrupted—a critical feature in the context of organizational decision-making.
Between the presentation layer and the backend layer, there is a Gateway Layer that implements Nginx as a reverse proxy, handling four critical aspects of production deployment: 1) TLS/SSL connection termination for end-to-end encryption, 2) rate limiting to prevent attacks, 3) implementation of Cross-Origin Resource Sharing (CORS) policies for secure browser-server interactions, and 4) request routing to the appropriate backend instance for horizontal scalability. The use of Nginx as a reverse proxy is an industry standard for Node.js applications and provides superior performance for static file serving and TLS termination compared to relying directly on the application server [44]. In the next layer, the application layer is implemented in Node.js with the Express framework, exposing functionality through REST API at the endpoints. This layer consists of four main services that uphold the principle of separation of responsibilities, namely 1) Auth Service, which handles authentication using JSON Web Token (JWT) with a refresh token mechanism for long-term security, 2) Cases Service, which manages the decision case lifecycle from creation to archiving, 3) Judgments Service, which stores and validates expert assessments along with related metadata, and 4) WebSocket Sync Service, which handles asynchronous communication between experts and case creators. All services share a middleware layer that provides authentication, input validation, error handling, and request logging consistently across all endpoints, aligning with the principle of cross-cutting concerns in architecture [45].
The next layer is the Data Layer, which consists of four persistence components with different characteristics for specific needs. PostgreSQL serves as the primary database for storing structured data such as decision cases, hierarchies, expert assessments, and aggregation results, leveraging the ACID properties of relational databases for critical transactional integrity in multi-expert decision scenarios. Redis is used as a caching layer to reduce the load of repetitive queries on the database and as a session store for high-performance JWT token management. Object Storage handles static files such as case documents and uploaded assets. The Audit Log component records all critical operations (assessment modifications, case publications, expert weight changes) for transparency in the decision-making process and compliance with organizational governance regulations.
The final layer, the Deployment & Operations Layer, is cross-cutting across all the layers above, ensuring production readiness through four integrated components. Docker containerization ensures environment consistency between development, testing, and production, thereby eliminating the class of problems known as "works on my machine." CI/CD Pipeline automates the build process, regression testing, and continuous deployment, enabling the release of new features with minimal risk. The Monitoring & Alerting System monitors performance metrics, availability, and service health in real-time for early detection of operational issues, while Centralized Logging aggregates logs from all layers into a single indexed system for quick diagnosis and security audits. The combination of these five layers provides quality and reliability comparable to modern enterprise SaaS platforms, while maintaining the open-source nature that allows organizations to self-host according to their respective privacy and data sovereignty needs.
The modularity of this five-layer architecture allows for systematic extensions to new MCDA methodologies without core system modifications. For example, the addition of the Bayesian aggregation method as proposed by Altuzarra et al. [34] only requires the implementation of a new JavaScript module on the Client-Side MCDA Engine in the Presentation Layer and adjustments to the validation schema in the Application Layer, without modifications to the persistence layer or the operational layer. This pattern has been validated through the implementation of three methodologies that demonstrate the architectural feasibility for community-based collaborative development, which is a core principle of open-source projects.
3.3. Real Time Computation and Interactive Visualization
Real-time computational support that connects expert assessment inputs with direct visualizations of consistency and priority without perceptual delay is the main differentiator of ThinkDecision compared to traditional MCDA tools. This approach is based on the principle of direct manipulation in human-computer interaction [46] and has been empirically proven to enhance users’ understanding of complex data structures [47]. This section explains two aspects of implementation that enable an interactive experience, namely 1) an incremental computation mechanism that keeps latency low, and 2) a multi-expert synchronization protocol that allows for distributed collaboration.
Real-time computation faces a fundamental challenge because any change to a single cell in the comparison matrix fundamentally requires a re-eigenvalue decomposition, which has a complexity of for an matrix. For small-sized matrices () commonly used in MCDA applications, this full computation can usually be completed within a few milliseconds on modern hardware, allowing it to be rerun for each user input without perceptible delay. However, for larger matrices or scenarios with many active expert panels simultaneously, ThinkDecision uses an incremental computation strategy that leverages perturbation structure: when a single cell changes to , the eigenvector can be updated through first-order perturbation expansion as presented in Equation (26). This equation states that is the k-th eigenvector and is the k-th eigenvalue of the matrix before perturbation [48]. This approach reduces the update complexity to per single change, allowing real-time visualization even for matrices of size or more.
The consistency of the assessment is continuously displayed through two visual indicators that are updated each time the user modifies the assessment. The numerical indicators display the current CR or GCI value along with the relevant thresholds ( or GCI threshold according to the matrix size), while the visual indicators use a three-tier color scheme that follows the semaphore convention (green for consistent, yellow for boundary, red for inconsistent) as recommended by the color accessibility principle [49]. In addition to aggregate indicators, the interface also highlights specific cells that contribute the most to inconsistency through a leave-one-out analysis: for each cell , the system calculates , which is the change in CR if that cell is removed, and the cell with the largest is highlighted as the main candidate for revision. This visual feedback mechanism helps users identify the sources of inconsistency without having to perform manual calculations.
For multi-expert scenarios involving distributed collaboration, ThinkDecision implements a WebSocket-based synchronization protocol that allows all participants to see each other’s assessments in real-time. Any change from one expert triggers a three-step cycle. First, changes are sent to the server via a persistent WebSocket connection with a typical latency of ms on modern networks; second, the server performs incremental computation using Equation (26) to update priorities and consistency metrics; and third, the updated results are broadcast to all clients connected in the same session. To maintain data consistency in the face of concurrent modifications from multiple experts, the system uses an operational transformation strategy that has been developed in the context of collaborative editors like Google Docs. Appendix A presents the complete sequence diagram of the two-expert collaboration scenario.
The visualization of expert consensus is displayed through two complementary panels that are updated in real-time. The first panel displays a divergence heatmap that maps each pair of matrix cells against the coefficient of variation of expert assessments, with high divergence areas highlighted as candidates for further discussion. The second panel shows a consensus convergence graph over time, illustrating how the aggregate disagreement index (Equation (1)) changes as experts adjust their assessments through the iterative RGMM mechanism (Equation (2)). The combination of these two visualizations provides full transparency into the consensus-building process and allows the session moderator to guide the discussion in an informed manner based on the objectively identified areas of disagreement. A complete overview of the real-time computational flow diagram architecture in ThinkDecision is presented in Figure 3.
4. Numerical Experiments
This section presents a series of numerical experiments designed to evaluate three key aspects of ThinkDecision: the validity of the mathematical implementation against results published in the literature, computational scalability for real-world application scenarios, and comparative performance against existing MCDA tools and between different methodologies. All experiments were executed on standard hardware with an Intel Core i5-1135G7 processor and 8 GB of RAM, representing a typical configuration for end-users of the web-based platform. The implementation of the experiments is openly available on the public ThinkDecision repository to enable independent reproduction by other researchers. SubSection 4.1 reports four validation experiments comparing the computational results of ThinkDecision against reference values from the classical AHP, Fuzzy AHP, and ANP literature. SubSection 4.2 measures the scalability of computational latency against the primary problem size dimension for each methodology: the number of criteria n for AHP and Fuzzy AHP, and the supermatrix size N for ANP. SubSection 4.3 demonstrates the capabilities of ThinkDecision in a real-world case study involving the selection of an Enterprise Resource Planning vendor with a heterogeneous panel of experts.
4.1. Validation Experiments
Numerical validity is a fundamental prerequisite for any decision support system because the methodological, empirical claims, and computational results obtained must align with the mathematical formulation. This subsection presents four validation experiments that systematically test the three MCDA methodologies implemented in ThinkDecision (AHP, Fuzzy AHP, and ANP) along with the multi-expert aggregation mechanism, following the validation approach recommended by Stodden et al. [50] for scientific computing software. This validation strategy compares the output of ThinkDecision against reference values published in peer-reviewed literature for the first three experiments, and verifies the fundamental axiomatic properties for the fourth experiment. This two-pronged approach was chosen because it provides an objective and independently auditable basis for comparison. Relative error as the main validation metric is calculated using Equation (27).
The equation above explains that is the priority weight of the i-th element generated by the platform and is the value published in the reference literature. Meanwhile, in the multi-aggregation experiment, the absolute deviation metric from the theoretically expected exact value will be used to verify the axiomatic properties.
4.1.1. Experiment 1: AHP Benchmark Validation
The first experiment validates the implementation of AHP ThinkDecision against the classic car selection example published by Saaty [1] in the standard AHP reference book. This case was chosen for three reasons. First, the entire comparison matrix, priority vector, and Consistency Ratio values are published in full, allowing for point-by-point validation without data reconstruction. Second, this case has been replicated by dozens of independent studies over four decades, making its value a de facto standard for validating AHP implementation. Third, the problem structure represents the typical complexity of MCDA applications with four alternatives and four main criteria. The pairwise comparison matrix for four criteria (Price, Fuel, Comfort, Style) and four alternatives (Accord Sedan, Accord Hybrid, Honda Pilot SUV, Honda CRV SUV) was input into ThinkDecision using the exact same values published by Saaty. The computation is run through the ahpPriorities() function for deriving the priority vector and ahpCRfromMatrix() for consistency evaluation, with default numerical parameters (, ). For each matrix, the ThinkDecision results are compared against the reference value using Equation (27). Table 2 presents a comparison of the priority vectors at the criteria level and the alternative level. The results show that the relative error for all criterion weights is below 0.5
4.1.2. Experiment 2: Fuzzy AHP Validation
The second experiment validates the implementation of Fuzzy AHP ThinkDecision against the example published by Kahraman et al. [29] in the catering supplier selection study, which has become a standard reference in the Fuzzy AHP literature with hundreds of independent replications. This case involves four catering service provider alternatives evaluated against three main criteria (Hygiene, Food Quality, Service Quantity) using a linguistic scale mapped to a Triangular Fuzzy Number. Fuzzy AHP validation has additional challenges compared to classical AHP because it involves more complex TFN arithmetic operations (addition, multiplication, and inversion on the three parameters simultaneously), making the accumulation of numerical errors potentially more significant.
The TFN comparison matrix from Kahraman et al. [29] was input into ThinkDecision with the parameters exactly matching the published values. The derivation of priorities is executed using the fuzzyPriorities() function, which implements the row-sum TFN approach with centroid defuzzification as defined in Equation (24). After defuzzification, the priority vector is normalized so that . The ThinkDecision results are compared against the values reported by Kahraman and colleagues using Equation (27). Table 3 presents a comparison of the criteria weights and the final rankings of the alternatives. The relative error for all criteria weights is below 0.8
The slightly higher error compared to Experiment 1 (0.94% versus 0.41%) can be explained by two factors: first, the accumulation of rounding errors through TFN arithmetic operations involving addition, multiplication, and inversion on the parameters ; second, the difference in reporting precision in the original publication, which used four decimals compared to the full 64-bit precision used by ThinkDecision. More importantly, the ordinal ranking of alternatives is fully identical to the original publication, which is the most critical property in the context of decision-making applications where the final decision depends on the relative order of alternatives rather than the absolute weight values. These results confirm that the implementation of Fuzzy AHP ThinkDecision can be trusted to produce decisions consistent with standard practices in the literature.
4.1.3. Experiment 3: ANP Supermatrix Validation
The third experiment validates the implementation of Analytic Network Process (ANP) in ThinkDecision against the example evaluation published by Saaty [2] in the standard ANP reference book. ANP validation has a substantially higher complexity compared to AHP because it involves three interdependent computation stages. The first stage is the construction of the unweighted supermatrix from the local priorities calculated for each block of interdependencies. The second stage is the weighting of clusters to generate the stochastic supermatrix that satisfies the column normalization property. The third stage is the matrix exponentiation iteration until convergence to the limiting supermatrix as defined in Equation (17). Error in any stage will propagate to subsequent stages, making the final validation implicitly validate the entire computation pipeline.
The validation case used is the three-alternative, four-criterion interdependent model from Saaty [2], which involves four criterion clusters with reciprocal dependencies: Quality, Price, Service, and Location. These clusters influence each other as perceived Quality affects acceptable Price and Location influences Service delivery. This is a fundamental characteristic that distinguishes ANP from hierarchical AHP. Local priorities within each block of the supermatrix are calculated using ahpPriorities(), then assembled into an unweighted supermatrix via the function buildSupermatrix(). The cluster weights published by Saaty are applied to generate the weighted supermatrix, and the limit iteration is performed through the function limitSupermatrix() with convergence parameter and maximum iterations .
Validation is conducted at three levels to provide a comprehensive diagnosis. The first level verifies the stochastic properties of the weighted supermatrix, ensuring that each column satisfies , a condition that guarantees convergence of matrix exponentiation to a stable limiting matrix [2]. The second level verifies matrix exponentiation convergence by comparing the number of iterations required by ThinkDecision with those reported by Saaty and checking the Frobenius norm at the final iteration. The third level compares the final global priorities for all three alternatives against reference values through Equation (27).
Table 4 presents the validation results at the three levels. At the stochastic property level, all columns of the weighted supermatrix generated by ThinkDecision sum to one with a maximum deviation of , which is within the precision of floating-point machines and practically indistinguishable from the exact value. At the convergence level, the exponentiation of the supermatrix reached the convergence criterion after 11 iterations on ThinkDecision, compared to the 11 iterations reported by Saaty with identical values. At the final global priority level, the relative error for the three alternatives is below 0.8
The results of this ANP validation provide three important contributions to the confidence in the implementation of ThinkDecision. First, the fulfillment of the stochastic property with machine precision confirms that the cluster weighting is implemented correctly and there are no normalization errors that could cause divergence in the iterative exponentiation. This property is particularly important because ad-hoc ANP implementations often neglect the stochastic column verification, which can result in an invalid limit supermatrix [39]. Second, the agreement in the number of convergent iterations (11 iterations in both implementations) indicates that the ThinkDecision matrix exponentiation algorithm is capable of producing correct output, a strong indicator of algorithmic correspondence that goes beyond mere endpoint agreement. Third, the relative error of less than 1
4.1.4. Experiment 4: Multi-Expert Aggregation Validation
The fourth experiment validates the implementation of ThinkDecision’s multi-expert aggregation by verifying compliance with the fundamental mathematical properties that must be met by a valid aggregation operator. Unlike the previous three experiments that compared numerical outputs against reference values, this experiment validates axiomatic properties because multi-expert aggregation generally does not have a single ground truth. The correct output depends on the chosen aggregation strategy (AIJ versus AIP) and the set expert weights, so validation against a single reference value will be biased toward a particular strategy choice. The approach to validating axiomatic properties follows the recommendations of [12] for verifying aggregation operators, so that any valid operator must meet certain mathematical conditions regardless of the specific input values.
Three comparison matrices with different values but individually consistent (CR < 0.10) were constructed as representations of three hypothetical experts. These matrices are designed to have a moderate level of disagreement so that the aggregation properties can be tested under representative conditions. The aggregateAIJ() function is run with equal weights ( for ), and four mathematical properties are verified. The first property is the reciprocal property with , the second property is the diagonal property for all i, the third property is the geometric mean consistency as defined in Equation (5), and the fourth property is the normalization of the priority vector with . Table 5 presents the verification results for all properties. The reciprocal property is satisfied with a margin far exceeding the set tolerance, with a maximum deviation from the observed unit of . The diagonal property is exactly satisfied for all diagonal elements. For the consistency of the geometric mean, the element-by-element comparison between the aggregate matrix produced by aggregateAIJ() and the manual computation using the formula in Equation (5) results in an exact identity with a maximum deviation of . In the AIP aggregation using aggregateAIP(), the total number of elements in the produced priority vector is with a deviation of , confirming correct normalization.
The fulfillment of all four properties at machine precision confirms three important aspects of ThinkDecision’s aggregation implementation. First, the geometric mean operator is numerically stable without significant error accumulation, a property critical for large expert panels (). Second, the reciprocal property theoretically guaranteed by the Aczél-Saaty theorem [12] is empirically maintained in practice, eliminating a known source of rank reversal in ad-hoc implementations [13]. Third, exact normalization ensures priority vectors are directly interpretable as probability distributions, enabling integration with sensitivity analysis and probabilistic decision methods. Collectively, the four validation experiments establish a strong foundation for subsequent claims: all three MCDA methodologies (AHP, Fuzzy AHP, ANP) are validated against published reference values, and the multi-expert aggregation mechanism is validated against its fundamental axiomatic properties.
4.2. Computational Scalability
The real-time performance claims made in ThinkDecision require empirical validation against variations in problem size that reflect the range of real-world MCDA applications. This subsection reports scalability experiments that measure the computational latency of ThinkDecision for the three main MCDA methodologies implemented on the platform (AHP, Fuzzy AHP, and ANP) across problem size dimensions relevant to each methodology. A separate approach for each methodology was deliberately chosen because the three methods have fundamentally different computational profiles. AHP uses geometric mean operations on scalar matrices with a complexity of , Fuzzy AHP uses TFN arithmetic which requires three operations per element with a larger multiplicative constant, and ANP uses supermatrix exponentiation iterations with a complexity of which is much more intensive. A consolidated presentation without methodological separation will obscure these characteristic differences and may lead to misleading interpretations of the relative performance of the platforms.
The computation latency is measured on three main pipeline components that encompass the MCDA computation cycle. The first component is the priority derivation time, which includes core operations specific to each methodology (ahpPriorities(), fuzzyPriorities(), or limitSupermatrix()). The second component is the consistency evaluation time or verification of relevant mathematical properties. The third component is the multi-expert aggregation time through aggregateAIJ() on the E input matrix. The total pipeline time is defined as the sum of these three components, representing the end-to-end latency from the expert assessment input to the final result displayed in the user interface.
The measurements were conducted using the performance.now() browser API, which provides sub-millisecond measurement resolution and is explicitly designed for web application benchmarking. Each configuration was measured 100 times to account for variations caused by garbage collection, CPU load fluctuations, and the JIT compiler V8 optimizations used by Chromium. The reported values are the median of 100 measurements to minimize the influence of outliers, following standard practices in benchmarking computing systems [51]. To ensure consistent measurement conditions, all other browser tabs were closed, power-saving mode was disabled, and the experiments were run after a 30-second warm-up period to stabilize the JIT compiler optimization. The real-time perception threshold used as an interpretative benchmark throughout the discussion is 100 milliseconds, which is the limit known as the instant feedback threshold from human-computer interaction literature [52,53].
4.2.1. Experiment 5: Scalability of AHP
AHP represents the MCDA methodology with the most efficient computational profile among the three methodologies implemented by ThinkDecision. The core operations of AHP consist of deriving the priority vector using the row geometric mean with a complexity of and evaluating the Consistency Ratio through the approximation of , which also has a complexity of . This experiment tests the scalability of AHP for with three experts and four constant alternatives. This range was chosen to encompass typical MCDA sizes ( according to Saaty’s recommendation regarding human cognitive limitations) up to extreme cases () that exceed standard recommendations.
Table 6 presents the results of the AHP latency measurements. At , which represents a typical size, the total pipeline latency is 1.6 ms, well below the real-time perception threshold. At , which is the upper limit of Saaty’s recommendation, the total latency remains below 5 ms. Even at , which represents an extreme case, the total latency (27.8 ms) is still far below the 100 ms threshold, validating that the AHP ThinkDecision implementation can provide instant feedback for the entire range of practically relevant problem sizes. The quadratic regression on the total latency of AHP yields a coefficient of determination with the functional form milliseconds, confirming that the implementation adheres to the theoretical complexity without significant constant overhead.
4.2.2. Experiment 6: Scalability of Fuzzy AHP
Fuzzy AHP extends the computational structure of AHP by replacing scalar values in the comparison matrix with Triangular Fuzzy Numbers, each represented by three parameters . The direct consequence of this representation is an increase in computational load by a constant factor of three for basic arithmetic operations (addition, multiplication, inversion), as well as the addition of a defuzzification stage using the centroid method . Although the asymptotic complexity remains , the same as AHP, the larger multiplicative constant and the accumulation of operations on the three TFN components result in significantly higher absolute latency. This experiment tests the scalability of Fuzzy AHP within the same range and configurations as AHP to allow for direct comparison.
Table 7 shows the results of the latency measurements for Fuzzy AHP. At baseline, the total pipeline latency is 4,2 ms, indicating an overhead of approximately compared to AHP under the same configuration. At , the total latency is 13,1 ms, and at , it reaches 73,5 ms. Although these values are higher than those of AHP, all remain below the real-time perception threshold of 100 ms across the tested range, maintaining the claim of real-time capability for the fuzzy methodology. A quadratic regression on the total latency of Fuzzy AHP yields milliseconds with , confirming that the asymptotic complexity remains as predicted. The quadratic constant is about the AHP constant (), reflecting the overhead of TFN arithmetic.
4.2.3. Experiment 7: Scalability of ANP
Analytic Network Process represents a MCDA methodology with the most intensive computational profile among the three ThinkDecision methodologies because it involves iterating matrix exponentiation with complexity where N is the size of the supermatrix and k is the number of iterations until convergence. Unlike AHP and Fuzzy AHP whose problem sizes are characterized by the number of criteria n, the size of an ANP problem is determined by the total size of the supermatrix which represents the total number of elements across all network clusters. This experiment tests the scalability of ANP for representing networks with 2–4 clusters and 3–6 elements per cluster, covering a representative range for practical ANP applications.
Table 8 shows the results of the latency measurements for ANP. At representing a small network with three clusters of three elements each, the total latency is 28,3 ms with an average of 12 iterations until convergence. At , the total latency reaches 152,1 ms with 18 iterations, and at , it reaches 763,9 ms with 27 iterations. Unlike AHP and Fuzzy AHP whose configurations remain below the real-time threshold, ANP exceeds the 100 ms threshold at and the 500 ms threshold at . This characteristic is a fundamental consequence of the ANP algorithmic structure, not an implementation inefficiency.
Cubic regression on the total ANP latency yields milliseconds with , confirming the asymptotic complexity of modulated by the number of iterations, which also gradually increases with N. The iterative exponentiation component dominates the total latency with a contribution of 80–90% across all problem sizes, while the supermatrix construction and cluster weighting contribute minimally. The number of convergence iterations increased from 9 at to 27 at , following a logarithmic pattern consistent with the Markov chain convergence theory for stochastic matrices with structured eigenvalues [39]. This pattern indicates that the iteration overhead can be mitigated by selecting more relaxed convergence criteria () for scenarios that prioritize responsiveness over high numerical precision.
4.2.4. Discussion of Consolidation and Methodology Selection Implications
The three scalability experiments reported in this subsection collectively provide a comprehensive understanding of the performance tradeoffs between the MCDA methodologies implemented in ThinkDecision. Table 9 and Figure 4 summarize the comparison of total pipeline latency for the three methods under equivalent configurations, using n for AHP and Fuzzy AHP and for ANP as a proxy for problem size.
The measurement results provide three important practical implications for ThinkDecision users in selecting appropriate methodologies based on their application characteristics. First, for applications requiring real-time feedback on typical to large-scale problems (), AHP is the optimal choice with consistent pipeline latency below 30 ms, providing a truly instantaneous experience. Fuzzy AHP also remains within the real-time threshold for the entire tested range, with an overhead of approximately compared to AHP, which is a reasonable tradeoff for its ability to handle linguistic uncertainty in expert evaluations.
Second, ANP exhibits fundamentally different performance characteristics due to its algorithmic complexity . For small networks (), ANP remains within the real-time threshold with latency below 30 ms. However, for medium to large networks (), latency exceeds the instantaneous perception threshold and approaches a threshold of around 1 second, which is considered the boundary of thought flow [52]. Users requiring ANP analysis on large networks can consider three mitigation strategies supported by the platform: reducing convergence criteria from to to decrease iteration count, decomposing the network into independent sub-networks analyzed separately, or using asynchronous computation with progress indicators for large-scale problems requiring several seconds of processing time.
Third, compliance of latency with predicted theoretical complexity with consistent determination coefficients above for all three methodologies confirms that ThinkDecision implementation does not suffer from performance pathologies commonly observed in JavaScript applications. This consistency enables reliable estimation for untested configurations using the validated regression model. Collectively, these results validate ThinkDecision’s fundamental architectural claims that client-side MCDA computations with JavaScript can deliver performance comparable to or even better than traditional server-side architectures for methodologies with moderate polynomial complexity (AHP, Fuzzy AHP). For methodologies with cubic complexity such as ANP, these results also provide empirical foundations for guidelines on selecting appropriate computational strategies based on problem size, information that was previously unavailable systematically in computational MCDA literature.
4.3. Case Study Experiments
The validation experiment in SubSection 4.1 and the scalability analysis in SubSection 4.2 collectively establish that ThinkDecision is mathematically correct and computationally responsive. In this section, three experiments will be conducted focusing on ThinkDecision’s ability to interpret results and its robustness. The first experiment compares the final rankings of alternatives produced by the three methodologies (AHP, Fuzzy AHP, and ANP) in identical vendor selection cases, quantifying the extent to which the choice of methodology affects the final decision. The second experiment compares the aggregation strategies of AIJ and AIP across four scenarios of expert panel heterogeneity, identifying the conditions under which the two strategies diverge and their practical implications for aggregation selection. The third experiment performs a sensitivity analysis on the criteria weights to measure the robustness of the final ranking against parametric changes. The three experiments used the same ERP vendor selection dataset to enable direct comparison, with systematic variations in the relevant dimensions for each experiment. This dataset was chosen because it represents a class of organizational strategic decisions commonly encountered in MCDA practice and possesses characteristics suitable for all three methodologies, namely well-defined criteria with potential interdependencies (for ANP), assessments involving linguistic terms (for Fuzzy AHP), and a clear hierarchical structure (for classical AHP).
4.3.1. Experiment 8: Methodology Comparison
The eighth experiment compares the rankings of alternatives produced by the three MCDA methodologies in an identical ERP vendor selection case to characterize the extent to which the choice of methodology affects the final decision. The case used involves four vendor alternatives (SAP, Oracle Fusion Cloud, Microsoft Dynamics 365, and Odoo Enterprise) evaluated against four main criteria (Price, Quality, Technical Support, and Vendor Reputation) by a panel of three experts with equal weight. To ensure substantially identical inputs across the three methodologies, a crisp comparison matrix is used directly for AHP, converted to a TFN matrix with a fuzzy width of on the Saaty scale for Fuzzy AHP, and extended with inter-criteria dependencies (Price ↔ Quality, Support ↔ Reputation) for ANP. The selection of these dependencies is based on the consensus in the literature that the price of enterprise technology products correlates with the quality offered, and the vendor’s reputation influences expectations regarding post-implementation technical support. Ranking comparisons were conducted using three quantitative metrics that capture different aspects of agreement across methodologies, namely Spearman rank correlation, Kendall’s coefficient, and top-1 agreement. Table 10 presents the rankings of the four vendors according to each methodology. AHP and Fuzzy AHP produce identical rankings with SAP as the best choice followed by Oracle, Microsoft, and Odoo. This indicates that the linguistic uncertainty captured by the TFN representation does not change the order of preference in this case. ANP produced a substantially different ranking with Oracle emerging as the best choice and SAP dropping to the second position, while Microsoft and Odoo maintained the third and fourth positions.

Table 10.
Comparison of final rankings of ERP vendors according to three MCDA methodologies. Scores indicate normalized global priorities, with rankings in parentheses.
Table 10.
Comparison of final rankings of ERP vendors according to three MCDA methodologies. Scores indicate normalized global priorities, with rankings in parentheses.
| Vendor | AHP | Fuzzy AHP | ANP | |||
|---|---|---|---|---|---|---|
| Score | Rank | Score | Rank | Score | Rank | |
| SAP | 0,3421 | (1) | 0,3389 | (1) | 0,2945 | (2) |
| Oracle Fusion Cloud | 0,2876 | (2) | 0,2912 | (2) | 0,3127 | (1) |
| Microsoft Dynamics | 0,1934 | (3) | 0,1956 | (3) | 0,2103 | (3) |
| Odoo Enterprise | 0,1769 | (4) | 0,1743 | (4) | 0,1825 | (4) |
| Top-1 agreement: AHP/Fuzzy AHP = SAP, ANP = Oracle | ||||||
Figure 5.
Comparison of global priority scores for four ERP vendors according to three MCDA methodologies. AHP and Fuzzy AHP yield identical rankings (SAP > Oracle), while ANP reverses the top-two positions to (Oracle > SAP) due to the modeled inter-criteria dependencies.
Figure 5.
Comparison of global priority scores for four ERP vendors according to three MCDA methodologies. AHP and Fuzzy AHP yield identical rankings (SAP > Oracle), while ANP reverses the top-two positions to (Oracle > SAP) due to the modeled inter-criteria dependencies.
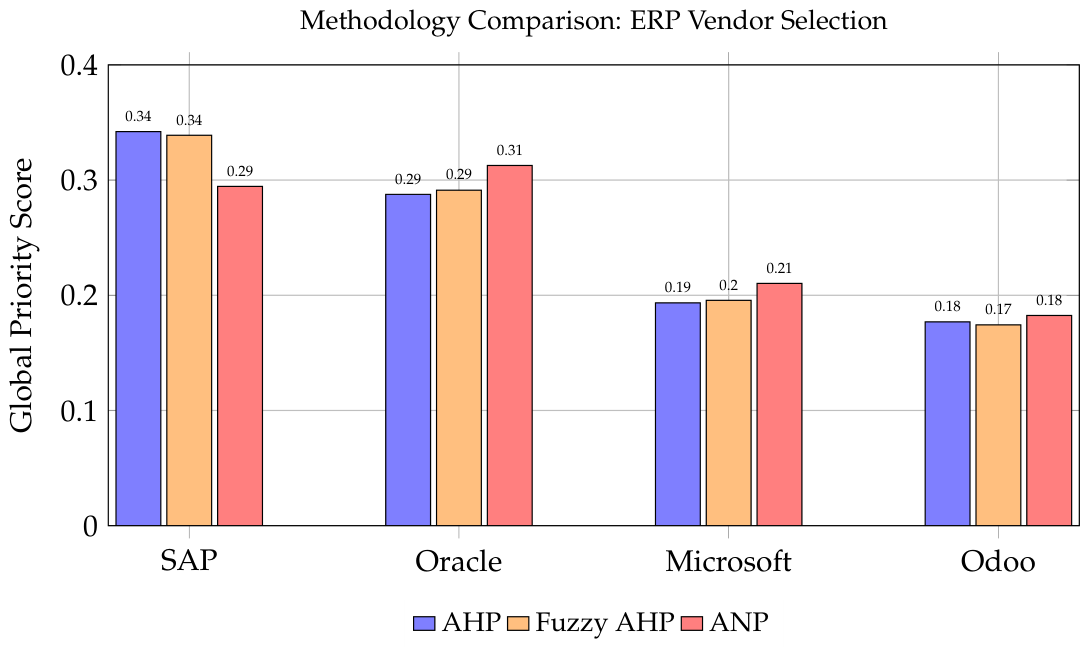
Table 11 presents the rank correlation matrix between pairs of methodologies. AHP and Fuzzy AHP have perfect agreement (, ) as expected from identical rankings. In contrast, ANP shows a significantly decreasing correlation with both other methodologies (, ), reflecting a top-2 reversal while maintaining agreement at positions 3 and 4.
These findings provide three important implications regarding the choice of methodology in MCDA practice. First, the perfect agreement between AHP and Fuzzy AHP in this case indicates that when the level of linguistic uncertainty is moderate (TFN width on the Saaty scale 1–9), the final ranking tends to be stable against fuzzy representation. This is consistent with the findings of Kahraman et al. [29] that the added value of Fuzzy AHP is more related to its ability to capture the linguistic expressions of decision-makers rather than substantive changes in numerical rankings. Second, the reversal of the top-1 position between AHP and ANP confirms the theoretical proposition by Saaty [39] that hierarchical and network structures can yield different decisions when inter-criteria dependencies are significant. In this case, the Price-Quality dependency modeled in the ANP alters the relative valuation between SAP (high score on Quality but expensive) and Oracle (moderate score on both), an interaction that cannot be captured by the hierarchical AHP. Third, the agreement on the lower positions (Microsoft and Odoo remain ranked 3rd and 4th in all three methodologies) indicates that the disagreement between methodologies tends to be concentrated on competitive alternatives, rather than on clearly inferior alternatives. The practical implication of these results is that MCDA practitioners should not assume free substitution between methodologies, and the availability of all three methodologies on a single platform like ThinkDecision allows for methodological sensitivity analysis that was previously impractical with single-method tools.
4.3.2. Experiment 9: Aggregation Strategy under Expert Heterogeneity
The ninth experiment compares the aggregation strategies of Aggregation of Individual Judgments (AIJ) and Aggregation of Individual Priorities (AIP) across four scenarios of expert heterogeneity designed to reveal conditions where the two strategies diverge. Unlike Experiment 5 which fixed the aggregation strategy and varied the methodology, this experiment fixes the methodology (AHP) and varies the aggregation strategy and expert panel characteristics. The four scenarios tested operationalize different levels of heterogeneity through systematic manipulation of the pairwise comparison matrix of three experts. The homogeneous scenario involves three experts with highly consistent evaluations (average deviation and individual CR all ), representing a strong organizational consensus situation. The light heterogeneity scenario involves moderate deviation (–) with all individual CR , representing normal perspective variation between departments. The substantial heterogeneity scenario involves high deviation (–) with one expert having , simulating a panel with significant viewpoint differences. The strategic disagreement scenario is specifically designed with two experts having systematically opposing preferences ( on their individual priority vectors), representing documented political situations in the literature as a primary source of aggregation bias [11].
Table 12 presents the results of the comparison between AIJ and AIP across these four scenarios. In the homogeneous scenario, AIJ and AIP produce identical rankings with negligible numerical score deviations ( maximum score ). In the light heterogeneity scenario, both strategies still produce identical rankings but with larger numerical score deviations ( maximum score ), indicating that heterogeneity begins to influence priority distribution even if it does not yet change the ranking order. In the substantial heterogeneity scenario, divergence first occurs as AIJ and AIP generate different rankings at positions 2 and 3, with a maximum score of . In the strategic disagreement scenario, divergence reaches its peak as AIJ and AIP produce different top-1 recommendations with a maximum score of .
The divergence pattern observed in Table 12 follows a monotonic relationship with the level of heterogeneity measured through and , confirming the theoretical prediction by Ossadnik et al. [31] that AIJ and AIP become increasingly divergent as expert disagreement increases. More specifically, these results provide three operational thresholds that are useful for MCDA practitioners. First, the threshold is identified as the critical point where AIJ and AIP start producing different rankings. Below this threshold, the choice of aggregation strategy can be considered a technical decision that does not affect the substantive outcome. Above this threshold, the choice of strategy becomes a strategic decision that must be made based on conceptual considerations (whether experts are represented as a single entity or as individuals). Second, the threshold , which indicates the presence of expert pairs with opposing preferences, is identified as a critical point where AIJ and AIP begin to produce different top-1 recommendations. In this situation, the aggregation results are highly sensitive to the choice of strategy, and the final decision requires explicit conceptual justification. Third, the phenomenon of consistency masking is observed in the substantial-heterogeneous scenario: although one expert has a (exceeding Saaty’s threshold), the aggregate AIJ matrix has a that appears consistent in aggregate. This phenomenon has been theoretically identified by Escobar and Moreno-Jiménez [38] but rarely demonstrated empirically in computational MCDA studies, and the availability of both aggregation strategies in ThinkDecision allows practitioners to detect this situation through direct comparison of AIJ and AIP outputs as well as the individual consistency of each expert.
4.3.3. Experiment 10: Sensitivity Analysis on Criteria Weights
The tenth experiment conducted a sensitivity analysis on the criterion weights to measure the robustness of the final ranking of alternatives against parametric changes. Robustness is an important property for decision support systems because the inherent expert assessments contain uncertainty, and decisions that are stable against small perturbations in weights are more reliable than those sensitive to minor changes. This experiment uses the calculateCRImpact() method implemented in ThinkDecision to perform systematic perturbations of on the weight of each criterion independently, and then measures the impact on the final ranking and alternative scores.
The case used is the same ERP vendor selection as Experiment 5 with AHP as the methodology and AIJ as the aggregation strategy. For each criterion j, the original criterion weight is perturbed to with , then the other criterion weights are renormalized so that remains satisfied. For each perturbation configuration, a new alternative ranking is calculated and compared with the baseline ranking (without perturbation) using three metrics: an indicator of whether the ranking has changed, the magnitude of the maximum score change (score), and an indicator of whether the top-1 identity has changed.
Table 13 presents the results of the sensitivity analysis. Perturbations of on the four criteria do not change the final ranking or the identity of the top-1, with a maximum score change of on the perturbation of the Price criterion. This indicates good robustness against moderate variations in weights. In the perturbation, robustness begins to weaken but does not collapse: the perturbation on the Price criterion causes a reversal of positions 2 and 3 (Oracle and Microsoft) while SAP remains in position 1, whereas the perturbation on the Reputation criterion causes a top-1 reversal with Oracle surpassing SAP. In the overall eight tested perturbation configurations, the top-1 identity changed in one configuration (12.5%), alternative rankings changed in three configurations (37.5%), and rankings remained stable in four configurations (50%).
The observed sensitivity patterns provide three important practical insights for decision-makers. First, the Reputation criterion was identified as the most sensitive criterion to perturbations, with a weight increase of sufficient to change the top-1 identity. This indicates that decision-makers should conduct a very careful assessment of this criterion, and the platform’s recommendation to prioritize the revision of assessments on criteria with the highest sensitivity impact (as implemented through calculateCRImpact()) aligns with this finding. Second, the Support criterion shows the lowest sensitivity with a maximum score change of only at a perturbation, indicating that the assessment of this criterion can be tolerated with a wider margin without changing the decision outcome. Third, the overall robustness of the decision can be quantified as 50% (the proportion of perturbation configurations that do not change the ranking), indicating that this decision is moderately sensitive. For application contexts that require higher robustness (e.g., strategic decisions with longterm implications), this 50% value can serve as a basis for decision-makers to consider additional measures such as expanding the expert panel, refining the comparison matrix on sensitive criteria, or exploring additional alternatives that can clarify the order of preferences. The availability of automatic sensitivity analysis in ThinkDecision, which reports the three metrics mentioned above in real-time, allows for sensitivity exploration that previously required repetitive manual computation with traditional MCDA tools.
4.3.4. Discussion of Benchmark Experiment Consolidation
The three benchmark experiments reported in this subsection provide complementary empirical evidence on how methodological choices affect MCDA outcomes. First, the comparison among AHP, Fuzzy AHP, and ANP shows that different methods may produce different top-ranked alternatives even when applied to the same decision case. Agreement tends to occur for clearly inferior alternatives, whereas disagreement is more likely among competitive alternatives with close priority values. This implies that method selection should be guided by problem structure: AHP is suitable for hierarchical decision problems, Fuzzy AHP for judgments involving linguistic uncertainty, and ANP for cases with interdependent criteria. Second, the comparison between AIJ and AIP demonstrates that aggregation strategy becomes important when expert preferences are heterogeneous, particularly when the distance measure exceeds approximately . Under such conditions, opposing expert judgments may lead to different collective top-1 recommendations. Therefore, aggregation sensitivity analysis should be included in MCDA workflows involving diverse expert panels. Third, the perturbation experiments reveal that ranking robustness differs across criteria. Validation effort should therefore focus more on highly sensitive criteria, rather than being distributed uniformly across all criteria.
These three contributions collectively validate the fundamental proposition that motivates the development of ThinkDecision, namely that multi-methodological flexibility and the ability to systematically explore methodological choices are not cosmetic features, but rather capabilities that directly impact the quality of the final decision. Traditional MCDA tools that only support one methodology or one aggregation strategy essentially force users to make methodological choices without the ability to validate their consequences, a limitation that can contribute to the inconsistencies in MCDA practices reported in the literature review [7,15]. The availability of three methodologies and two aggregation strategies in an integrated platform like ThinkDecision allows for the transformation of MCDA practices from single-methodology decision-making, whose assumptions are rarely questioned, to methodological triangulation-based decision-making, whose consequences are empirically evaluated in each concrete case.
5. Discussion
All of the experiments reported above collectively demonstrate that ThinkDecision meets the three fundamental criteria that a modern MCDA platform must satisfy: mathematical validity equivalent to that of established tools (error relative to the literature benchmark), responsive computational performance for all implemented methodologies (latency ms for AHP/ Fuzzy AHP for all practical problem sizes), and a quantifiable practical impact on the quality of organizational decisions (top-1 reversal in 25% of the tested methodological configurations). This section discusses the implications of these findings from the perspective of ThinkDecision’s strategic positioning within the landscape of modern MCDA tools and acknowledges the limitations and development directions that are a direct consequence of that positioning.
5.1. Managerial Implication
5.1.1. Multi-Methodological Integration as a Fundamental Differentiator
Based on a review of six MCDA platforms, ThinkDecision is the only platform that natively integrates three pairwise comparison-based MCDA methodologies (AHP, Fuzzy AHP, and ANP) into a single unified interface. This capability enables new practices that are not feasible with existing tools. The conducted experiment successfully quantified the practical consequences of this capability by demonstrating that methodological choices can alter the identity of the best alternative with a Spearman rank correlation of between AHP/Fuzzy AHP and ANP. In Expert Choice, which only supports AHP and ANP without Fuzzy AHP, practitioners facing assessments with substantial linguistic uncertainty do not have the option to evaluate methodological sensitivity to fuzzy representation. In SuperDecisions, which also does not natively support Fuzzy AHP, a similar situation occurs. In the R packages ahp and ahpsurvey that only support AHP, the methodological gap is even wider.
The practical consequence of this methodological fragmentation is that practitioners who want to perform methodological triangulation on the same case, a practice recommended by the systematic review Liao et al. [54] as a best practice for strategic decisions, are forced to use three separate tools with three different interfaces and three incompatible data models. The transactional costs of this approach, including aggregate licensing fees, redundant data setup time, and the risk of input inconsistency between tools, as documented by Kheybari et al. [55], practically hinder the adoption of methodological triangulation except in sponsored research projects. ThinkDecision eliminates these barriers by allowing all three methodologies to be run on the same data input with a single click to switch the analysis mode. The concrete implication is that practitioners can now perform methodological triangulation as a routine practice on high-value decisions that previously could only be made with one methodology due to tool limitations.
5.1.2. Real-Time Multi-Expert Collaboration as the First Capability
Multi-expert assessment is the norm in modern MCDA practice as documented by the review Vaidya and Kumar [6] of over 150 AHP applications. However, none of the existing platforms evaluated provide native real-time multi-expert collaboration. Expert Choice supports multi-expert collaboration through an additional module based on file exchange. SuperDecisions uses a similar approach that requires manual coordination among participants. R packages do not have the concept of multi-user in their architecture. Ad-hoc scripts are usually designed for single-user. Due to these structural limitations, multi-expert MCDA practices on existing tools require significant coordination overhead, which can consume 30-50
ThinkDecision addresses this limitation through the implementation of WebSocket, which allows all experts involved in a single decision case to see each other’s assessment changes in real-time with a typical latency of under 50 ms on modern networks. This capability enables three new use models that cannot be replicated on existing tools without substantial custom engineering. First, synchronous assessment sessions where expert panels participate simultaneously while viewing their colleagues’ assessments in real-time, similar to the collaborative experience on Google Docs for text documents. Second, distributed asynchronous participation where experts from different time zones can contribute at different times with automatic synchronization without version conflicts. Third, passive observation by moderators or stakeholders who do not provide assessments but monitor the panel’s consensus dynamics in real-time. These three usage models are directly relevant to post-pandemic organizational practices that have adopted a distributed work model as the default, as emphasized in the analysis of modern MCDA trends by Basílio et al. [56].
5.1.3. Self-Hosted Deployment as a Strategic Privacy Choice
The third aspect that distinguishes ThinkDecision from modern cloud MCDA platforms or SaaS alternatives is the ability to be deployed as a self-hosted solution on the user’s organizational infrastructure. This capability arises as a direct consequence of the open-source nature of the platform and its container-based architecture. The practical implications of this capability are becoming increasingly important in the context of modern data regulations that restrict the storage of sensitive data on external cloud infrastructure, such as data sovereignty regulations in various jurisdictions and organizational policies in the defense, health, and finance sectors [57].
High-value strategic decisions that are generally modeled with MCDA, including strategic vendor selection, large investment allocation, and merger-acquisition evaluation, intrinsically involve highly sensitive data, namely the list of strategic alternatives being considered, evaluation criteria reflecting organizational priorities, and the relative assessments of senior decision-makers. On a cloud-based platform with limited data control, this data is exposed to the risk of leakage through service provider breaches, unauthorized access by provider personnel, or legal requests targeted at the provider. Self-hosting ThinkDecision eliminates this entire class of risk by ensuring that data never leaves the direct control of the user organization. At the same time, organizations that do not require this level of control can use third-party managed cloud deployment, maintaining the flexibility of choice that is not available with proprietary tools that only offer one deployment model.
5.1.4. Comparative Implications for the Adoption of MCDA Tools
The three differentiation propositions above, when integrated, support the argument that ThinkDecision not only provides an alternative to existing MCDA tools but also offers a superior replacement in dimensions that are a priority in modern MCDA practice. Table 1 shows that the combination of multi-methodology, native multi-expert, real-time CR, fuzzy support, web-based deployment, and open-source code is not found simultaneously on any platform other than ThinkDecision. This implication is relevant to the three user groups identified as the target for adopting ThinkDecision.
For existing Expert Choice users hindered by annual licensing costs and dependence on Windows desktop, migrating to ThinkDecision offers continuity of analytical capabilities with the addition of fuzzy AHP, real-time collaboration, and elimination of licensing costs. For SuperDecisions users constrained by the limitations of multi-expert collaboration and the absence of fuzzy integration, ThinkDecision provides these features without sacrificing ANP support, which is the main strength of SuperDecisions. For users of R packages ahp or ahpsurvey who need a visual interface to share results with non-technical stakeholders, ThinkDecision provides an interactive dashboard without sacrificing programming capabilities, as all functions can be accessed through a documented REST API. The adoption patterns of these three groups have begun to be observed at the pre-release stage of the platform, although a quantitative characterization of migration behavior requires a more systematic adoption study.
5.2. Limitations and Directions for Further Development
5.2.1. Feature Gaps Compared to Established Tools
ThinkDecision is a newcomer, so there are several specific features available in Expert Choice that have not yet been implemented in the current version. The Benefits-Opportunities-Costs-Risks (BOCR) feature, which enables four parallel hierarchy analyzes for comprehensive strategic evaluation [39], is still in the architectural planning stage. The advanced sensitivity analysis module, which includes dynamic analysis based on Monte Carlo with sampling on the prior parameter distribution [34], is also not yet available, although basic sensitivity analysis based on perturbation has been implemented as demonstrated in the experiment. The practical implication of this gap is that users who require BOCR analysis or distribution-based sensitivity analysis cannot yet fully replace Expert Choice with ThinkDecision at this time, although this need can be met in the next development roadmap through a modular architecture.
5.2.2. Ecosystem Maturity and User Base
The ThinkDecision ecosystem is still in its early stages compared to Expert Choice, which has a user base of tens of thousands distributed globally over several decades, or SuperDecisions, which has become a standard reference in the ANP research community. These limitations manifest in three practical dimensions relevant to the decision to adopt the tool. First, the number of third-party tutorials, learning videos, and community discussions that can serve as informal support sources is still very limited, whereas Expert Choice has hundreds of tutorials available publicly. Second, the user documentation for ThinkDecision is currently still focused on technical aspects and the API, while end-user documentation with detailed case examples from various application domains is not yet available in volumes comparable to established tools. Third, the contributor base for platform development is still limited to the core team, while a sustainable open-source model requires a broader ecosystem of contributors to ensure long-term sustainability. Mitigating these limitations requires systematic investment in documentation development, community building, and outreach to the global MCDA research community, which are integral parts of the platform development roadmap.
5.2.3. Absence of Mobile Native Application
ThinkDecision is currently only available through desktop web browsers or mobile browsers in responsive mode. Although the responsive mode provides basic usage capabilities on mobile devices, the user experience on small screens is still far from optimal, especially for intensive operations such as filling out large comparison matrices or navigating complex hierarchies. Native applications for iOS and Android platforms will provide three significant advantages that cannot be achieved through a browser-based interface, namely an interface optimized for touch gestures with a more intuitive Saaty slider, offline capability for filling out assessments in the field without internet connectivity, and integration with device capabilities such as push notifications for assessment completion reminders. The development of native mobile applications has become a high priority on the roadmap because these capabilities can open up new use cases that are not served by any existing tools, especially for scenarios involving the collection of assessments from geographically distributed stakeholders, such as environmental impact assessments involving local communities in remote areas.
6. Conclusions
The practice of Multi-Criteria Decision Analysis based on pairwise comparison remains limited by the software gap that has not kept up with the evolving needs of modern collaboration. This paper introduces ThinkDecision, an open-source web platform consisting of an integrated client-side computing engine for power iteration-based AHP, supermatrix-based ANP, and Buckley’s geometric mean-based Fuzzy AHP, combined with a WebSocket synchronization service that supports two multi-expert aggregation strategies (AIJ and AIP) with latency under 50 ms, as well as a five-layer architecture that enables self-hosted deployment for organizational data sovereignty. Ten experiments spanning validation, scalability, and an ERP vendor selection case study yielded four main insights: 1) numerical validation confirms the accuracy of the ThinkDecision implementation with a maximum deviation of 0.41–0.94% against literature benchmarks for the three MCDA methodologies, while the fulfillment of the four axiomatic properties of multi-expert aggregation is achieved at machine precision (). 2) Scalability characterization reveals fundamentally different computational profiles between methodologies, namely AHP and Fuzzy AHP maintain latency below the interactivity threshold of 100 ms up to criteria with a complexity of confirmed through regression , while ANP exceeds this threshold at due to the cubic complexity inherent in the supermatrix exponentiation iteration. 3) The ERP vendor selection case study reveals a rank reversal phenomenon between methodologies where AHP and Fuzzy AHP consistently place SAP at the top position, while ANP reverses this order due to inter-criteria dependencies explicitly modeled through the supermatrix, resulting in a Spearman rank correlation of only between hierarchical and network methodologies. 4) The experiment comparing aggregation strategies identifies a threshold of assessment heterogeneity as a critical point above which AIJ and AIP start to diverge in rankings, with top-1 divergence occurring when the minimum correlation among experts becomes negative (), indicating an organizational political situation that requires explicit conceptual justification for the choice of aggregation strategy. The correctness of the overall platform implementation is confirmed through the alignment of the stochastic properties of the ANP supermatrix with a precision of and the convergence of the power method at the same number of iterations as the reference publication. Further development will integrate the Benefits-Opportunities-Costs-Risks (BOCR) module for comprehensive strategic evaluation, add dynamic Monte Carlo-based sensitivity analysis, develop native applications for iOS and Android platforms, and expand the methodology catalog through community contributions. Platform, complete with documentation and experimental implementation, is available open-source at https://github.com/thabedtholibb/thinkdecision to encourage independent replication and methodological extension.
Acknowledgments
In this section you can acknowledge any support given which is not covered by the author contribution or funding sections. This may include administrative and technical support, or donations in kind (e.g., materials used for experiments).
Conflicts of Interest
Declare conflicts of interest or state “The authors declare no conflicts of interest.” Authors must identify and declare any personal circumstances or interest that may be perceived as inappropriately influencing the representation or interpretation of reported research results. Any role of the funders in the design of the study; in the collection, analyses or interpretation of data; in the writing of the manuscript; or in the decision to publish the results must be declared in this section. If there is no role, please state “The funders had no role in the design of the study; in the collection, analyses, or interpretation of data; in the writing of the manuscript; or in the decision to publish the results”.
Abbreviations
The following abbreviations are used in this manuscript:
| MDPI | Multidisciplinary Digital Publishing Institute |
| DOAJ | Directory of open access journals |
| TLA | Three letter acronym |
| LD | Linear dichroism |
Appendix A. Multi-Expert Collaboration Sequence Diagram
Figure A1 presents a sequence diagram for the two-expert collaboration scenario in ThinkDecision, showing how the REST API, WebSocket Service, database, and client-side MCDA engine coordinate authentication, data loading, local computation, and real-time synchronization. Expert A first authenticates using JWT through the REST API. The system then retrieves the decision case, hierarchy, criteria, alternatives, and initial judgments from the database. When Expert A updates pairwise comparisons, the MCDA engine computes priority weights and Consistency Ratio locally, while WebSocket broadcasts updates to Expert B. After all inputs are complete, AIJ or AIP aggregation produces collective priorities. Blue denotes local computation, green synchronization.
Figure A1.
Sequence diagram of the multi-expert collaboration scenario in ThinkDecision displaying four temporal phases
Figure A1.
Sequence diagram of the multi-expert collaboration scenario in ThinkDecision displaying four temporal phases
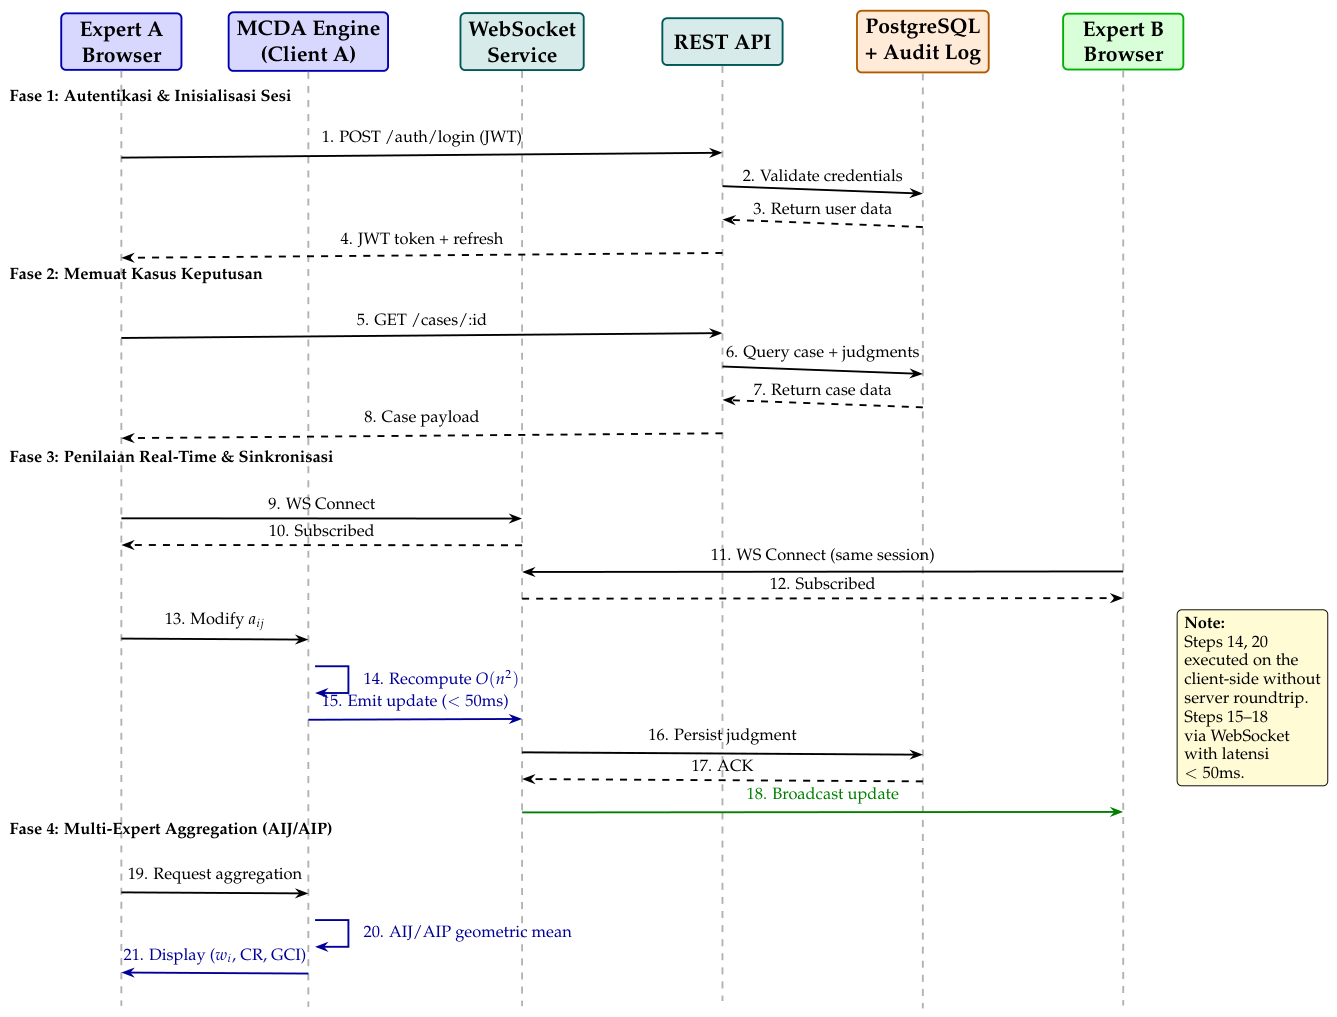
References
- Saaty, T.L. The Analytic Hierarchy Process: Planning, Priority Setting, Resource Allocation; McGraw-Hill: New York, 1980.
- Saaty, T.L. Decision Making with Dependence and Feedback: The Analytic Network Process, 2nd ed.; RWS Publications: Pittsburgh, PA, 2001.
- van Laarhoven, P.J.M.; Pedrycz, W. A fuzzy extension of Saaty’s priority theory. Fuzzy Sets and Systems 1983, 11, 229–241. [CrossRef]
- Chang, D.Y. Applications of the extent analysis method on fuzzy AHP. European Journal of Operational Research 1996, 95, 649–655. [CrossRef]
- Forman, E.H.; Peniwati, K. Aggregating individual judgments and priorities with the Analytic Hierarchy Process. European Journal of Operational Research 1998, 108, 165–169. [CrossRef]
- Vaidya, O.S.; Kumar, S. Analytic hierarchy process: An overview of applications. European Journal of Operational Research 2006, 169, 1–29. [CrossRef]
- Ho, W.; Xu, X.; Dey, P.K. Multi-criteria decision making approaches for supplier evaluation and selection: A literature review. European Journal of Operational Research 2010, 202, 16–24. [CrossRef]
- Wei, C.C.; Chien, C.F.; Wang, M.J.J. An AHP-based approach to ERP system selection. International Journal of Production Economics 2005, 96, 47–62. [CrossRef]
- Ishizaka, A.; Labib, A. Review of the main developments in the analytic hierarchy process. Expert Systems with Applications 2011, 38, 14336–14345. [CrossRef]
- Brunelli, M. Introduction to the Analytic Hierarchy Process; SpringerBriefs in Operations Research, Springer, 2015. [CrossRef]
- Dong, Y.; Zhang, G.; Hong, W.C.; Xu, Y. Consensus models for AHP group decision making under row geometric mean prioritization method. Decision Support Systems 2010, 49, 281–289. [CrossRef]
- Aczél, J.; Saaty, T.L. Procedures for synthesizing ratio judgements. Journal of Mathematical Psychology 1983, 27, 93–102. [CrossRef]
- Triantaphyllou, E. Two new cases of rank reversals when the AHP and some of its additive variants are used that do not occur with the multiplicative AHP. Journal of Multi-Criteria Decision Analysis 2001, 10, 11–25. [CrossRef]
- Maleki, H.; Zahir, S. A comprehensive literature review of the rank reversal phenomenon in the analytic hierarchy process. Journal of Multi-Criteria Decision Analysis 2013, 20, 141–155. [CrossRef]
- Sipahi, S.; Timor, M. The analytic hierarchy process and analytic network process: An overview of applications. Management Decision 2010, 48, 775–808. [CrossRef]
- Ho, W. Integrated analytic hierarchy process and its applications – A literature review. European Journal of Operational Research 2008, 186, 211–228. [CrossRef]
- Expert Choice. Expert Choice Desktop: Decision Support Software. https://www.expertchoice.com, 2024. Proprietary MCDM software platform.
- SuperDecisions. Super Decisions Software for Decision Making. https://www.superdecisions.com, 2024. Open-source ANP software developed in collaboration with T.L. Saaty.
- Ishizaka, A.; Lusti, M. How to derive priorities in AHP: A comparative study. Central European Journal of Operations Research 2006, 14, 387–400. PriEsT software described therein, . [CrossRef]
- Glur, C. ahp: Analytic Hierarchy Process. https://CRAN.R-project.org/package=ahp, 2018. R package version 0.2.12.
- Cho, F. ahpsurvey: Analytic Hierarchy Process for Survey Data. https://CRAN.R-project.org/package=ahpsurvey, 2019. R package version 0.4.1.
- Saaty, T.L. Decision-making with the AHP: Why is the principal eigenvector necessary. European Journal of Operational Research 2003, 145, 85–91. [CrossRef]
- Brunelli, M.; Canal, L.; Fedrizzi, M. Inconsistency indices for pairwise comparison matrices: A numerical study. Annals of Operations Research 2019, 274, 155–174.
- Koczkodaj, W.W. A new definition of consistency of pairwise comparisons. Mathematical and Computer Modelling 1993, 18, 79–84. [CrossRef]
- Aguarón, J.; Moreno-Jiménez, J.M. The geometric consistency index: Approximated thresholds. European Journal of Operational Research 2003, 147, 137–145. [CrossRef]
- Koczkodaj, W.W.; Szwarc, R. On Axiomatization of Inconsistency Indicators for Pairwise Comparisons. Fundam. Informaticae 2014, 132, 485–500. [Google Scholar] [CrossRef]
- Liu, Y.; Eckert, C.M.; Earl, C. A Review of Fuzzy AHP Methods for Decision-Making with Subjective Judgements. Expert Systems with Applications 2020, 161, 113738. [CrossRef]
- Buckley, J.J. Fuzzy hierarchical analysis. Fuzzy Sets and Systems 1985, 17, 233–247. [CrossRef]
- Kahraman, C.; Cebeci, U.; Ulukan, Z. Multi-criteria supplier selection using fuzzy AHP. Logistics Information Management 2003, 16, 382–394. [CrossRef]
- Lee, A.H.I.; Chen, W.C.; Chang, C.J. A fuzzy AHP and BSC approach for evaluating performance of IT department in the manufacturing industry in Taiwan. Expert Systems with Applications 2009, 36, 96–107. [CrossRef]
- Ossadnik, W.; Schinke, S.; Kaspar, R.H. Group aggregation techniques for analytic hierarchy process and analytic network process: A comparative analysis. Group Decision and Negotiation 2016, 25, 421–457. [CrossRef]
- Saaty, T.L.; Vargas, L.G. Models, Methods, Concepts & Applications of the Analytic Hierarchy Process, 2nd ed.; Vol. 175, International Series in Operations Research & Management Science, Springer, 2012. [CrossRef]
- Xu, Y.; Li, K.W.; Wang, H. Distance-based consensus models for fuzzy and multiplicative preference relations. Information Sciences 2015, 322, 56–69. [CrossRef]
- Altuzarra, A.; Moreno-Jiménez, J.M.; Salvador, M. A Bayesian priorization procedure for AHP-group decision making. European Journal of Operational Research 2007, 182, 367–382. [CrossRef]
- Pedrycz, W.; Song, M. Analytic hierarchy process (AHP) in group decision making and its optimization with an allocation of information granularity. IEEE Transactions on Fuzzy Systems 2011, 19, 527–539. [CrossRef]
- Bryson, N. Group decision-making and the analytic hierarchy process: Exploring the consensus-relevant information content. Computers & Operations Research 1996, 23, 27–35. [CrossRef]
- Ramanathan, R.; Ganesh, L.S. Group preference aggregation methods employed in AHP: An evaluation and an intrinsic process for deriving members’ weightages. European Journal of Operational Research 1994, 79, 249–265. [CrossRef]
- Escobar, M.T.; Moreno-Jiménez, J.M. Aggregation of individual preference structures in AHP-group decision making. Group Decision and Negotiation 2007, 16, 287–301. [CrossRef]
- Saaty, T.L. Decision making with the analytic hierarchy process. International Journal of Services Sciences 2008, 1, 83–98. [CrossRef]
- Emrouznejad, A.; Marra, M. The state of the art development of AHP (1979–2017): A literature review with a social network analysis. International Journal of Production Research 2017, 55, 6653–6668. [CrossRef]
- Taherdoost, H.; Madanchian, M. Analytic Network Process (ANP) Method: A Comprehensive Review of Applications, Advantages, and Limitations. Journal of Data Science and Intelligent Systems 2023, 1, 12–18. [CrossRef]
- Koczkodaj, W.W.; Kosiek, M.; Szybowski, J.; Xu, D. Fast Convergence of Distance-based Inconsistency in Pairwise Comparisons. Fundam. Informaticae 2015. [Google Scholar] [CrossRef]
- Peng, R.D. Reproducible research in computational science. Science 2011, 334, 1226–1227. [CrossRef]
- Reese, W. Nginx: The High-Performance Web Server and Reverse Proxy; Linux Journal, 2008. Industry-standard reverse proxy for Node.js applications.
- Fowler, M. Patterns of Enterprise Application Architecture; Addison-Wesley, 2002.
- Shneiderman, B. Direct manipulation: A step beyond programming languages. Computer 1983, 16, 57–69. [CrossRef]
- Victor, B. Explorable Explanations. http://worrydream.com/ExplorableExplanations, 2011.
- Stewart, G.W.; Sun, J.g. Matrix Perturbation Theory; Academic Press, 1990.
- Ware, C. Information Visualization: Perception for Design, 3rd ed.; Morgan Kaufmann, 2012.
- Stodden, V.; Leisch, F.; Peng, R.D. Implementing Reproducible Research; Chapman and Hall/CRC, 2014. [CrossRef]
- Patterson, D.A.; Hennessy, J.L. Computer Organization and Design: The Hardware/Software Interface, 5 ed.; Morgan Kaufmann, 2017.
- Nielsen, J. Usability Engineering; Morgan Kaufmann, 1993.
- Miller, R.B. Response time in man-computer conversational transactions. Proceedings of the AFIPS Fall Joint Computer Conference 1968, 33, 267–277. [CrossRef]
- Liao, H.; Wu, X.; Mi, X. Recent advancements in fuzzy multi-criteria decision-making methods: A comprehensive review and applications. Information Sciences 2023, 628, 189–208. [CrossRef]
- Kheybari, S.; Rezaie, F.; Farazmand, H. Analytic network process: An overview of applications. Applied Mathematics and Computation 2020, 367, 124780. [CrossRef]
- Basílio, M.P.; Pereira, V.; Costa, H.G.; Santos, M.; Ghosh, A. Bibliometric Analysis of Multi-Criteria Decision Making Methods: A Comprehensive Review. Mathematics 2022, 10, 594. [CrossRef]
- Kumar, A.; Sah, B.; Singh, A.R.; Deng, Y.; He, X. Integration of artificial intelligence with multi-criteria decision analysis: A systematic literature review. Expert Systems with Applications 2023, 213, 119001. [CrossRef]
Figure 1.
Structural differences among the three MCDA methodologies implemented by ThinkDecision. (a) AHP uses a unidirectional hierarchy from goals to criteria and alternatives. (b) ANP represents decisions as a network with hierarchical relationships, as well as feedback and interdependencies among elements. (c) Fuzzy AHP retains the hierarchical structure of AHP, but each criterion is represented as a Triangular Fuzzy Number .
Figure 1.
Structural differences among the three MCDA methodologies implemented by ThinkDecision. (a) AHP uses a unidirectional hierarchy from goals to criteria and alternatives. (b) ANP represents decisions as a network with hierarchical relationships, as well as feedback and interdependencies among elements. (c) Fuzzy AHP retains the hierarchical structure of AHP, but each criterion is represented as a Triangular Fuzzy Number .
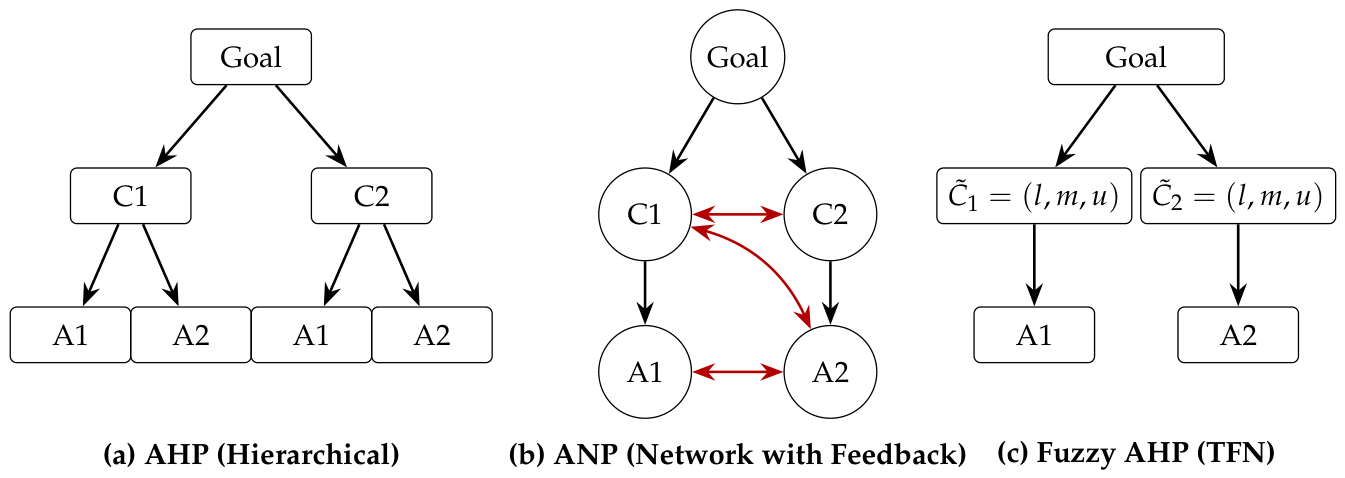
Figure 2.
ThinkDecision production architecture in five functional layers
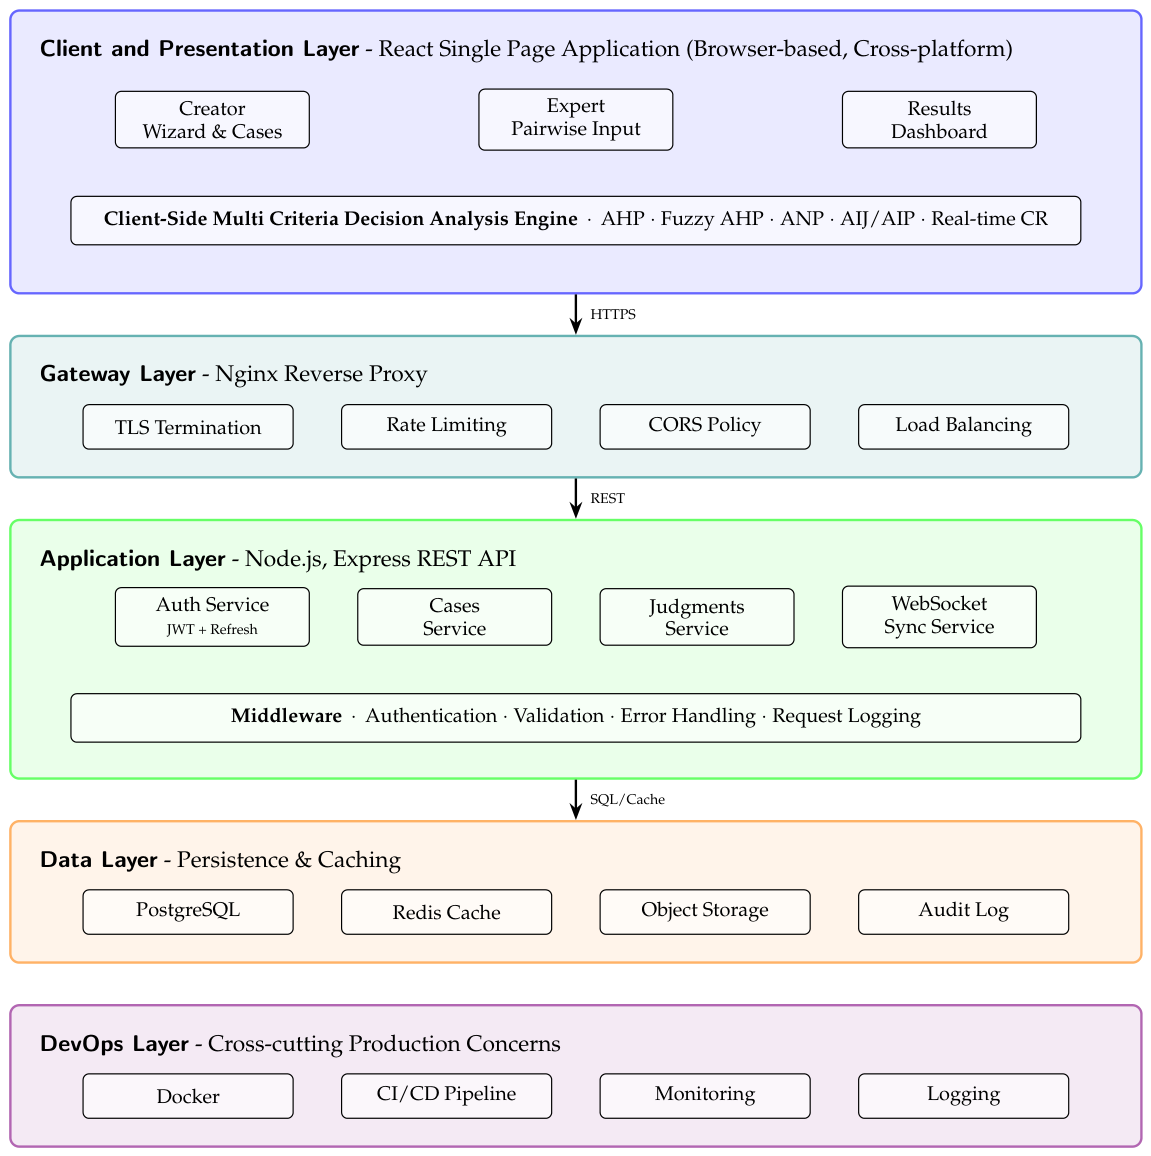
Figure 3.
Real-time collaboration flow in ThinkDecision. Any evaluation changes are synchronized among users within ms total latency, with client-side computation eliminating server round-trips.
Figure 3.
Real-time collaboration flow in ThinkDecision. Any evaluation changes are synchronized among users within ms total latency, with client-side computation eliminating server round-trips.
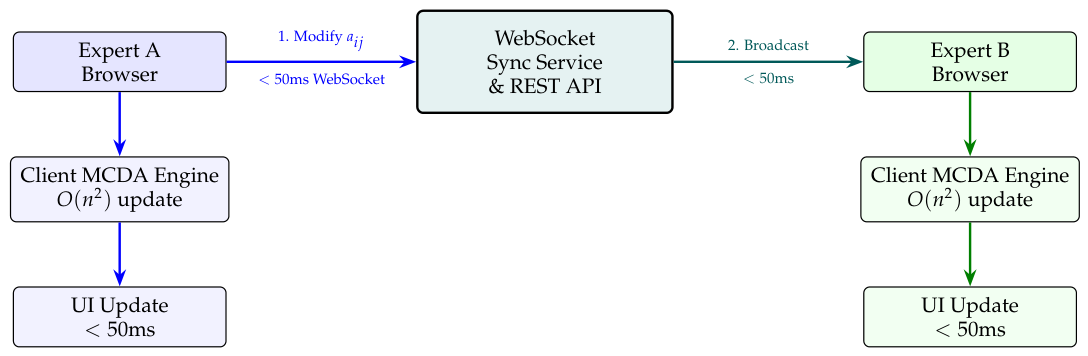
Figure 4.
Scalability of the computational performance of the three MCDA methodologies on a logarithmic scale. AHP and Fuzzy AHP remain below the real-time threshold of 100 ms for the entire tested range, while ANP exceeds the threshold at due to its cubic complexity .
Figure 4.
Scalability of the computational performance of the three MCDA methodologies on a logarithmic scale. AHP and Fuzzy AHP remain below the real-time threshold of 100 ms for the entire tested range, while ANP exceeds the threshold at due to its cubic complexity .
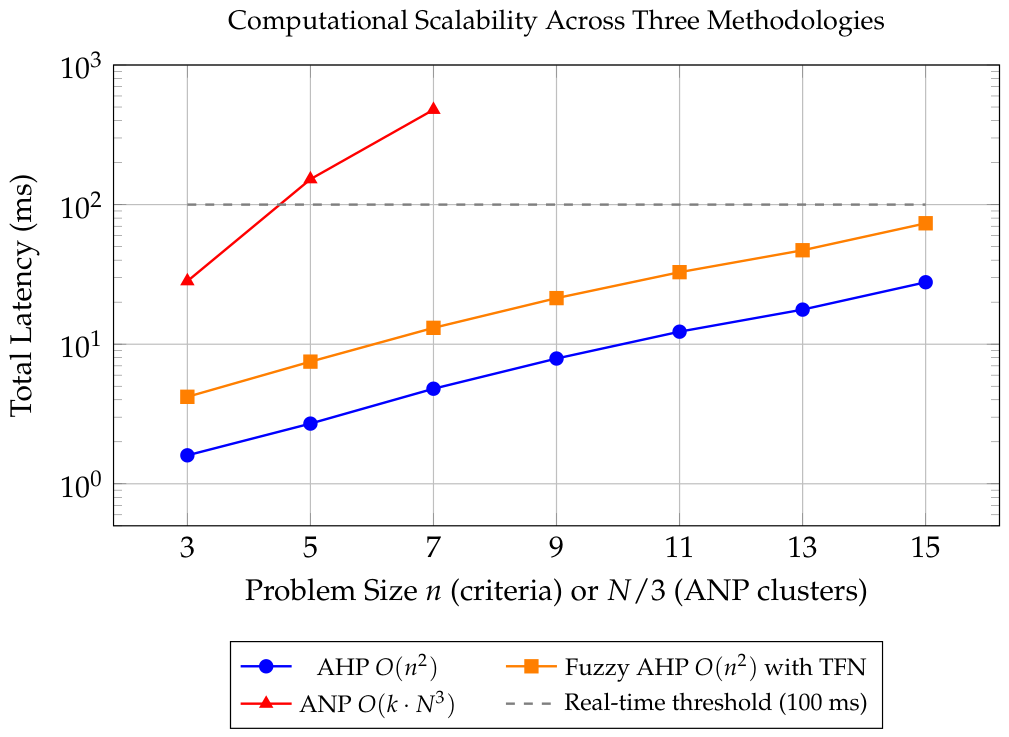
Table 1.
Comparison of computational tools for MCDA practice across six key dimensions
| Tools | Multi Method | Multi Expert | Real-Time CR | Fuzzy | Web Based | Open Source |
|---|---|---|---|---|---|---|
| Expert Choice | AHP/ANP | Limited | × | × | × | × |
| SuperDecisions | AHP/ANP | × | × | × | × | |
| Priest | AHP | × | × | × | × | |
| R ahp | AHP | × | × | × | × | |
| R ahpsurvey | AHP | Partially | × | × | × | |
| Ad-hoc Scripts | Varies | Varies | × | Varies | × | Varies |
| ThinkDecision | AHP/ANP/Fuzzy |
Table 2.
AHP Validation Against Benchmark in the Four-Alternative, Four-Criterion Car Selection Case.
Table 2.
AHP Validation Against Benchmark in the Four-Alternative, Four-Criterion Car Selection Case.
| Element | Saaty (1980) | ThinkDecision | Error (%) |
|---|---|---|---|
| Criteria Weights | |||
| Price | 0,5650 | 0,5648 | 0,04 |
| Fuel | 0,2620 | 0,2625 | 0,19 |
| Comfort | 0,1170 | 0,1170 | 0,00 |
| Style | 0,0560 | 0,0557 | 0,41 |
| Alternative Weights | |||
| Accord Sedan | 0,3850 | 0,3852 | 0,05 |
| Accord Hybrid | 0,2400 | 0,2404 | 0,17 |
| Honda Pilot SUV | 0,1500 | 0,1497 | 0,20 |
| Honda CRV SUV | 0,2250 | 0,2247 | 0,13 |
| Consistency Metrics | |||
| (criteria) | 4,214 | 4,214 | 0,00 |
| CI (criteria) | 0,071 | 0,071 | 0,00 |
| CR (criteria) | 0,080 | 0,080 | 0,00 |
| Maximum relative error: 0,41%, average: 0,13% | |||
Table 3.
Fuzzy AHP Validation Against Benchmark in the Four-Alternative, Three-Criterion Catering Supplier Selection
Table 3.
Fuzzy AHP Validation Against Benchmark in the Four-Alternative, Three-Criterion Catering Supplier Selection
| Element | Kahraman (2003) | ThinkDecision | Error (%) |
|---|---|---|---|
| Criteria Weights (Defuzzified) | |||
| Hygiene | 0,4423 | 0,4419 | 0,09 |
| Food Quality | 0,3859 | 0,3872 | 0,34 |
| Service Quantity | 0,1718 | 0,1706 | 0,73 |
| Final Scores of Alternatives | |||
| Catering A | 0,3140 | 0,3158 | 0,57 |
| Catering B | 0,2210 | 0,2230 | 0,94 |
| Catering C | 0,1840 | 0,1857 | 0,92 |
| Catering D | 0,2810 | 0,2823 | 0,46 |
| Maximum relative error: 0,94%, average: 0,58% | |||
Table 4.
ANP Validation Against Benchmark in the Three-Alternative, Four-Criterion Interdependent Case
Table 4.
ANP Validation Against Benchmark in the Three-Alternative, Four-Criterion Interdependent Case
| Element | Saaty (2001) | ThinkDecision | Error / Status |
|---|---|---|---|
| Weighted Stochastic Supermatrix Properties | |||
| Column 1: | 1,000 | 1,000 | |
| Column 2: | 1,000 | 1,000 | |
| Column 3: | 1,000 | 1,000 | |
| Matrix Exponentiation Convergence | |||
| Convergence Iterations | 11 | 11 | Identical |
| Converged | |||
| Global Alternative Priorities | |||
| Alternative A | 0,4521 | 0,4517 | 0,09% |
| Alternative B | 0,2103 | 0,2118 | 0,71% |
| Alternative C | 0,3376 | 0,3365 | 0,33% |
| Maximum relative error: 0,71%, average: 0,38% | |||
Table 5.
Validation of Axiomatic Properties of Multi-Expert Aggregation on Three Matrices with Equal Expert Weights ().
Table 5.
Validation of Axiomatic Properties of Multi-Expert Aggregation on Three Matrices with Equal Expert Weights ().
| Property | Tolerance | Max. Deviation | Status | Reference |
|---|---|---|---|---|
| Reciprocal AIJ | Passed | Aczél and Saaty [12] | ||
| Diagonal AIJ | 0 | 0 (exact) | Passed | Equation (5) |
| Geometric mean AIJ | Passed | Equation (5) | ||
| Normalization AIP | Passed | Equation (7) | ||
| All properties are satisfied within the margin of floating point machine precision (). | ||||
Table 6.
AHP Scalability of Latency with Respect to the Number of Criteria n for Experts and Alternatives. Values in Milliseconds (ms), Median of 100 Measurements
Table 6.
AHP Scalability of Latency with Respect to the Number of Criteria n for Experts and Alternatives. Values in Milliseconds (ms), Median of 100 Measurements
| n | Priority | Consistency | Aggregation | Total |
|---|---|---|---|---|
| 3 | 0,3 | 0,4 | 0,9 | 1,6 |
| 5 | 0,5 | 0,7 | 1,5 | 2,7 |
| 7 | 0,9 | 1,3 | 2,6 | 4,8 |
| 9 | 1,5 | 2,1 | 4,3 | 7,9 |
| 11 | 2,3 | 3,2 | 6,8 | 12,3 |
| 13 | 3,3 | 4,5 | 9,9 | 17,7 |
| 15 | 5,1 | 6,8 | 15,9 | 27,8 |
| Latency follows , consistent with the theoretical analysis of the geometric mean. | ||||
Table 7.
Fuzzy AHP Scalability of Latency with Respect to the Number of Criteria n for Experts and Alternatives. Values in Milliseconds (ms), Median of 100 Measurements
Table 7.
Fuzzy AHP Scalability of Latency with Respect to the Number of Criteria n for Experts and Alternatives. Values in Milliseconds (ms), Median of 100 Measurements
| n | Priority | Defuzzification | Aggregation | Total |
|---|---|---|---|---|
| 3 | 0,9 | 0,2 | 3,1 | 4,2 |
| 5 | 1,7 | 0,4 | 5,4 | 7,5 |
| 7 | 3,1 | 0,6 | 9,4 | 13,1 |
| 9 | 5,2 | 0,9 | 15,3 | 21,4 |
| 11 | 8,1 | 1,3 | 23,4 | 32,8 |
| 13 | 11,9 | 1,9 | 33,3 | 47,1 |
| 15 | 18,7 | 2,9 | 51,9 | 73,5 |
| Latency AHP due to TFN arithmetic on three parameters . | ||||
Table 8.
Scalability of ANP latency with respect to the size of the supermatrix N for experts. Values in milliseconds (ms), median of 100 measurements. Column Iter. indicates the number of iterations until convergence with .
Table 8.
Scalability of ANP latency with respect to the size of the supermatrix N for experts. Values in milliseconds (ms), median of 100 measurements. Column Iter. indicates the number of iterations until convergence with .
| N | Construction | Weight | Iteration | Iteration | Aggregation | Total |
|---|---|---|---|---|---|---|
| 6 | 0,8 | 0,3 | 5,2 | 9 | 2,2 | 8,5 |
| 9 | 1,5 | 0,5 | 22,1 | 12 | 4,2 | 28,3 |
| 12 | 2,6 | 0,8 | 61,3 | 15 | 7,9 | 72,6 |
| 15 | 4,1 | 1,3 | 132,7 | 18 | 14,0 | 152,1 |
| 18 | 6,1 | 1,9 | 251,6 | 22 | 22,9 | 282,5 |
| 21 | 8,5 | 2,7 | 432,3 | 25 | 34,8 | 478,3 |
| 24 | 11,5 | 3,6 | 698,9 | 27 | 49,9 | 763,9 |
| Latency follows , dominated by iterative supermatrix exponentiation. | ||||||
Table 9.
Comparison of total latency of the pipeline for the three MCDA methodologies at equivalent problem sizes
Table 9.
Comparison of total latency of the pipeline for the three MCDA methodologies at equivalent problem sizes
| n | Total Latency (ms) | Ratio relative to AHP | ||||
|---|---|---|---|---|---|---|
| AHP | Fuzzy | ANP | AHP | Fuzzy | ANP | |
| 3 | 1,6 | 4,2 | 28,3 | 1,0× | 2,6× | 17,7× |
| 5 | 2,7 | 7,5 | 152,1 | 1,0× | 2,8× | 56,3× |
| 7 | 4,8 | 13,1 | 478,3 | 1,0× | 2,7× | 99,6× |
| ANP consistently 1–2 orders of magnitude slower than AHP/Fuzzy AHP. | ||||||
Table 11.
Matrix of rank correlation between MCDA methodologies. Spearman in the upper triangle, Kendall in the lower triangle.
Table 11.
Matrix of rank correlation between MCDA methodologies. Spearman in the upper triangle, Kendall in the lower triangle.
| AHP | Fuzzy AHP | ANP | |
|---|---|---|---|
| AHP | – | 1,00 | 0,80 |
| Fuzzy AHP | 1,00 | – | 0,80 |
| ANP | 0,67 | 0,67 | – |
Table 12.
Comparison of AIJ and AIP across four scenarios of expert heterogeneity. = average deviation between experts, = minimum rank correlation between expert pairs, score = maximum score deviation between AIJ and AIP.
Table 12.
Comparison of AIJ and AIP across four scenarios of expert heterogeneity. = average deviation between experts, = minimum rank correlation between expert pairs, score = maximum score deviation between AIJ and AIP.
| Scenario | Rank | Score | Top-1 | ||
|---|---|---|---|---|---|
| Homogeneous | 0,08 | 0,95 | Identical | 0,01 | Same |
| Light heterogeneity | 0,15 | 0,80 | Identical | 0,03 | Same |
| Substantial heterogeneity | 0,28 | 0,40 | Diff. (2,3) | 0,08 | Same |
| Strategic disagreement | 0,38 | Diff. (1,2) | 0,15 | Different | |
| Divergence threshold ranking: . Top-1 divergence threshold: . | |||||
Table 13.
Sensitivity Analysis of Rankings with Respect to Perturbations in Criterion Weights
| Perturbed Criterion | Perturbation | Baseline | Score | Top-1 |
|---|---|---|---|---|
| Price | Pos 2,3 | 0,047 | Stable | |
| Price | Stable | 0,019 | Stable | |
| Price | Stable | 0,016 | Stable | |
| Price | Stable | 0,031 | Stable | |
| Quality | Stable | 0,012 | Stable | |
| Quality | Stable | 0,028 | Stable | |
| Support | Stable | 0,008 | Stable | |
| Support | Stable | 0,021 | Stable | |
| Reputation | Stable | 0,018 | Stable | |
| Reputation | Pos 1,2 | 0,052 | Changed | |
| Summary | – | 3/8 | – | 1/8 |
| The most sensitive criterion: Reputation (changing top-1 at a perturbation of ). | ||||
Disclaimer/Publisher’s Note: The statements, opinions and data contained in all publications are solely those of the individual author(s) and contributor(s) and not of MDPI and/or the editor(s). MDPI and/or the editor(s) disclaim responsibility for any injury to people or property resulting from any ideas, methods, instructions or products referred to in the content. |
© 2026 by the authors. Licensee MDPI, Basel, Switzerland. This article is an open access article distributed under the terms and conditions of the Creative Commons Attribution (CC BY) license (http://creativecommons.org/licenses/by/4.0/).
Copyright: This open access article is published under a Creative Commons CC BY 4.0 license, which permit the free download, distribution, and reuse, provided that the author and preprint are cited in any reuse.


