

Submitted:
28 June 2026
Posted:
30 June 2026
You are already at the latest version
Abstract
Background/Objectives: Melatonin, gut microbiome integrity, oxidative stress and liquid-biopsy biomarkers may represent linked biological layers across tumor initiation, promotion and progression. We aimed to integrate source biomarker data and prior translational materials into a Cancers-oriented research article, using the adult biomarker workbook as the primary statistical dataset. Methods: We performed an adult-only cross-sectional analysis of a deidentified biomarker workbook. Participants younger than 18 years were excluded. Plasma melatonin and 24-hour urinary aMT6s were combined into a melatonergic-axis score and categorized into tertiles. Inflammatory, oxidative-damage, antioxidant-deficit and biological-aging/injury composite z-scores were computed. Associations were assessed using Spearman correlation, Kruskal-Wallis tests and complete-case linear regression adjusted for age, sex and BMI. Previously reported CTC/cfDNA and melatonin-microbiome materials were used only for mechanistic framing. Results: The primary analysis included 314 adults. Low, intermediate and preserved melatonergic tertiles contained 105, 104 and 105 participants, respectively. Lower melatonergic status was associated with higher inflammatory, oxidative-damage, antioxidant-deficit and biological-aging/injury scores (all Kruskal-Wallis p < 0.001). The melatonergic-axis score correlated strongly and inversely with the integrated oncogenic-stress score (Spearman rho = -0.944, p < 0.001). In complete-case adjusted models (N = 250), each 1-SD higher melatonergic-axis score was associated with a 0.95-SD lower integrated oncogenic-stress score (95% CI, -0.98 to -0.92; p < 0.001). Conclusions: Reduced melatonergic status was associated with a coordinated pro-inflammatory, pro-oxidative and accelerated biological-aging phenotype. Prospective oncology studies should test whether this phenotype predicts microbiome dysbiosis, CTC/cfDNA emergence and cancer progression.
Keywords:
melatonin
; 6-sulfatoxymelatonin
; microbiome
; oxidative stress
; inflammation
; circulating tumor cells
; cell-free DNA
; cancer initiation
; cancer progression
; liquid biopsy
1. Introduction
Cancer development is increasingly understood as a continuum that begins before a clinically visible tumor emerges. The hallmarks of cancer include genome instability, inflammation, metabolic rewiring, immune escape and metastatic dissemination [1,2]. Oxidative stress can connect several of these hallmarks by damaging DNA, proteins and lipids, changing redox signaling and supporting inflammatory microenvironments that favor clonal selection [3,4,5,6,7,8,9].
Melatonin is classically recognized as a circadian hormone, but it also participates in antioxidant defense, mitochondrial regulation and immune modulation [10,11,12]. In parallel, the gut microbiome shapes inflammatory tone, epithelial barrier function and host metabolism; dysbiosis has been implicated in several cancer-related pathways [13,14,15,16,17,18,19]. The previously reported melatonin-microbiome materials describe low melatonin in cancer patients with severe dysbiosis and reduced Lactobacillus acidophilus and Saccharomyces boulardii, suggesting a biologically plausible melatonin-microbiome axis that may influence oxidative stress and secondary metabolites.
During progression, systemic biology becomes increasingly measurable through liquid biopsy. Circulating tumor cells (CTCs), cell-free DNA (cfDNA) and circulating tumor DNA (ctDNA) are downstream markers of tumor shedding, minimal residual disease, treatment response and metastatic risk [20,21,22,23,24,25,26,27]. The previously reported CTC/cfDNA article described an 18-patient non-small cell lung cancer remission series in which two participants with high CTC counts had radiologically detectable metastatic lesions, supporting the clinical relevance of CTC surveillance as a progression-stage biomarker. This prior material is used here as translational context rather than as new primary data.
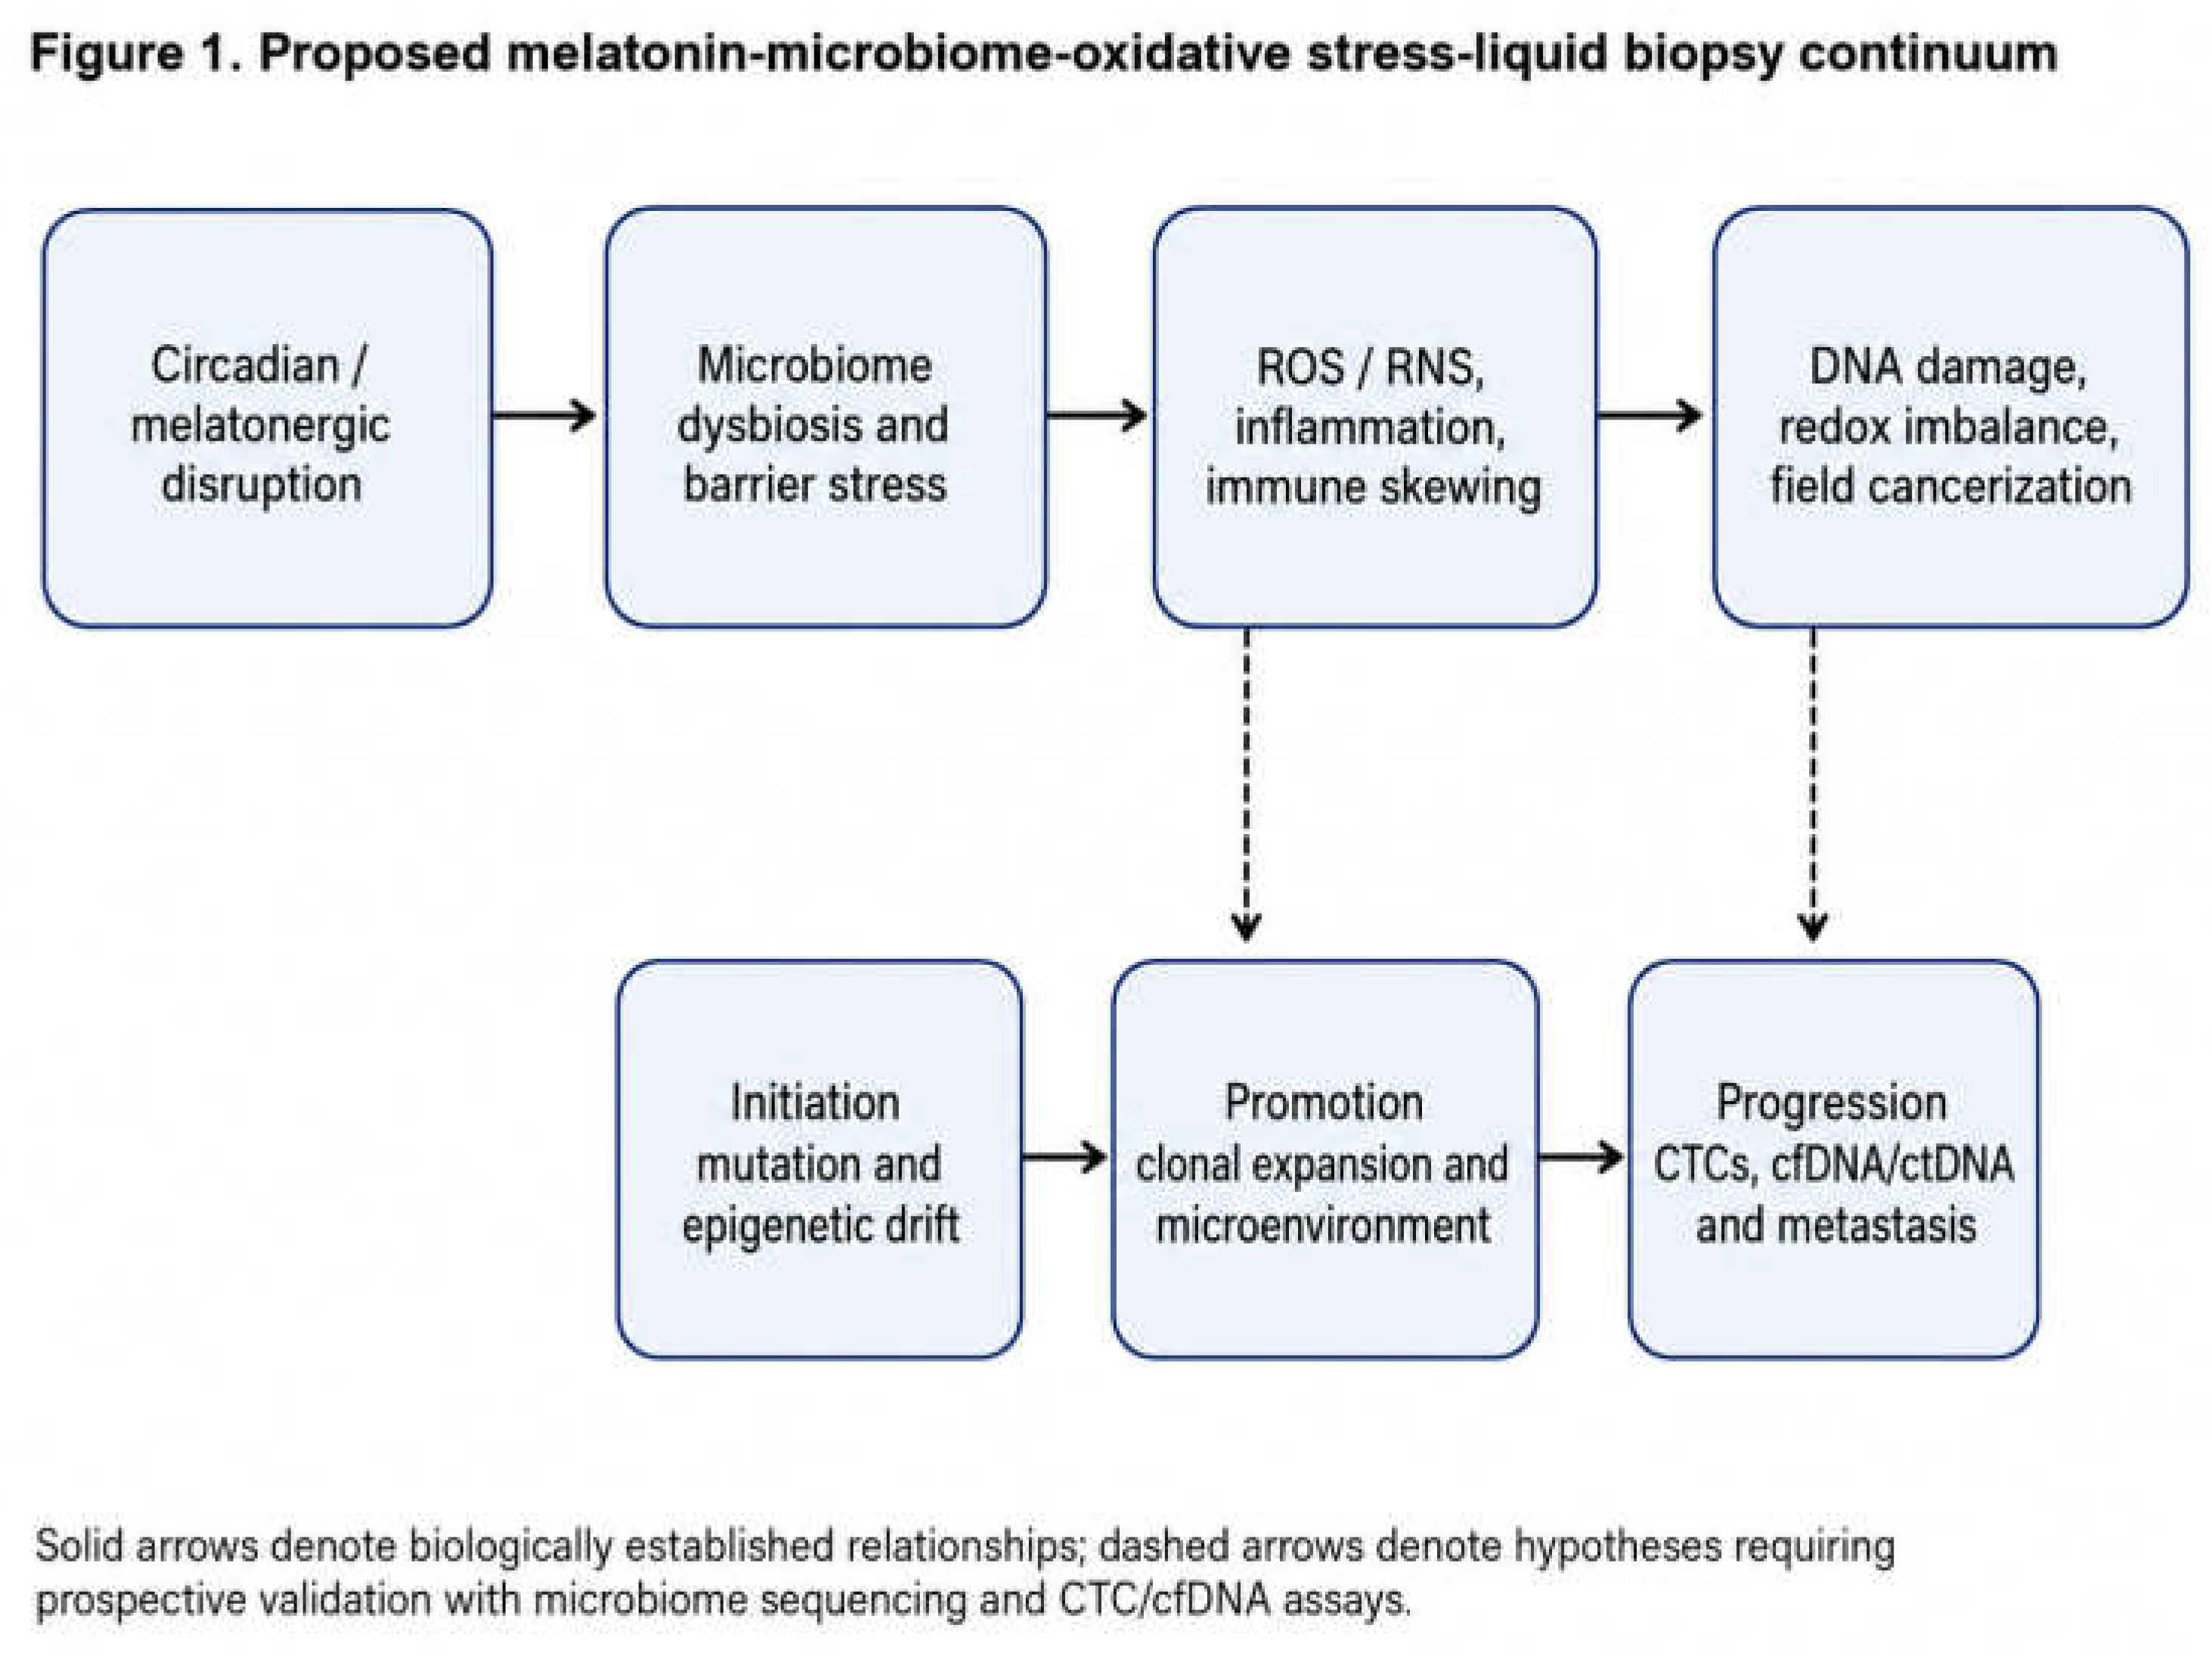
The current analysis uses the source adult biomarker workbook as the primary quantitative dataset. Because the workbook did not include cancer incidence, microbiome sequencing, CTC enumeration or cfDNA results, our goal was not to create a diagnostic assay. Instead, we tested whether reduced melatonergic status was associated with a coordinated inflammatory, oxidative and biological-aging phenotype that could reasonably be positioned upstream of microbiome disruption and downstream liquid-biopsy emergence in future prospective oncology studies.
Figure 1.
Proposed melatonin-microbiome-oxidative stress-liquid biopsy continuum across cancer initiation, promotion and progression. CTCs/cfDNA are positioned as downstream progression markers requiring prospective integration with upstream melatonergic, microbiome and oxidative-stress measurements.
Figure 1.
Proposed melatonin-microbiome-oxidative stress-liquid biopsy continuum across cancer initiation, promotion and progression. CTCs/cfDNA are positioned as downstream progression markers requiring prospective integration with upstream melatonergic, microbiome and oxidative-stress measurements.
2. Materials and Methods
2.1. Study Design and Data Source
This was an exploratory cross-sectional biomarker analysis of the deidentified workbook named 3BT_melatonin_biomarker_added_aging_FULL_CLEANED_REAL(4).xlsx. The workbook contained participant rows, demographic variables, plasma melatonin, 24-hour urinary 6-sulfatoxymelatonin (aMT6s), inflammatory markers, oxidative-stress markers, antioxidant markers and biological-aging/injury markers. To align the manuscript with an adult oncology context and reduce pediatric-consent complexity, six participants younger than 18 years were excluded. The primary analysis set comprised 314 adults.
No direct cancer diagnosis endpoint, microbiome sequencing data, CTC enumeration or cfDNA/ctDNA measurements were present in the adult workbook. Therefore, the workbook was analyzed as a pre-oncology systemic risk-biology dataset. Previously reported CTC/cfDNA and melatonin-microbiome publications were reviewed to frame the cancer continuum and to identify biological links requiring prospective validation.
2.2. Melatonergic Axis Definition
Plasma melatonin and 24-hour urinary aMT6s were treated as complementary markers of melatonergic status. A melatonergic-axis score was calculated as the mean of the rank percentiles of plasma melatonin and urinary aMT6s. Participants were categorized into tertiles: low melatonin/aMT6s, intermediate and preserved. This rank-based approach reduced dependence on assumptions about assay-specific normality and accommodated different measurement scales.
2.3. Biomarker Composites
To reduce multiple testing and to represent biological domains, biomarkers were grouped into four composite z-scores: inflammation, oxidative damage, antioxidant deficit and biological aging/injury. The inflammation composite included GDF-15, suPAR, IL-1β, IL-6, TNF-α, hsCRP and serum amyloid A. The oxidative-damage composite included MDA, 8-OHdG, F2-isoprostanes, AOPP, protein carbonyls, 3-nitrotyrosine, TOS and OSI. The antioxidant-deficit composite inverted the z-scores of TAC/TAS, SOD, GPx, catalase, GSH and GSH/GSSG ratio so that higher values reflected lower antioxidant defense. The biological-aging/injury composite included NT-proBNP, hs-troponin, NfL, GFAP, GlycanAge, GrimAge, DunedinPACE and age acceleration. The integrated oncogenic-stress score was the mean of the four domain composites.
2.4. Statistical Analysis
Continuous variables were summarized as mean ± standard deviation. Group differences across melatonergic tertiles were assessed with Kruskal-Wallis tests. Spearman correlation was used to assess monotonic associations between melatonin-related predictors and biomarker outcomes. Complete-case linear regression models assessed the association of a 1-SD higher melatonergic-axis score with standardized composite outcomes, adjusted for age, sex and BMI. Analyses were performed in Python using pandas, scipy and statsmodels. Because this was an exploratory secondary analysis without a cancer endpoint, p values were interpreted as indicators of association rather than as proof of causality or clinical diagnostic performance.
3. Results
3.1. Adult Cohort Characteristics
The adult analysis included 314 participants. The median age was 50 years (range 18-84). Sex was recorded as female in 192 participants and male in 121 participants; one adult participant had missing sex coding. The low, intermediate and preserved melatonergic tertiles included 105, 104 and 105 participants, respectively. Mean plasma melatonin increased from 4.18 ± 1.99 pg/mL in the low tertile to 22.46 ± 5.20 pg/mL in the preserved tertile; mean urinary aMT6s increased from 6.01 ± 2.29 to 32.97 ± 9.17 µg/24 h (Table 1).
3.2. Inflammatory and Oxidative Phenotypes Across Melatonergic Tertiles
Lower melatonergic status was accompanied by a consistent adverse gradient in inflammatory and oxidative biomarkers. For example, hsCRP was 5.05 ± 1.42 mg/L in the low tertile and 0.97 ± 0.56 mg/L in the preserved tertile; IL-6 was 4.93 ± 1.61 versus 1.18 ± 0.55 pg/mL; MDA was 5.00 ± 0.56 versus 2.54 ± 0.63 µmol/L; 8-OHdG was 10.25 ± 1.47 versus 4.49 ± 1.56 ng/mL; and OSI was 29.34 ± 6.58 versus 7.62 ± 3.75. In contrast, the GSH/GSSG ratio increased from 11.32 ± 2.48 in the low tertile to 60.74 ± 33.06 in the preserved tertile, consistent with stronger antioxidant buffering in preserved melatonergic status (Table 1).
3.3. Composite Biomarker Burden
Domain-level composite scores showed a stepwise pattern across melatonergic tertiles (Figure 2 and Table 2). The low melatonin/aMT6s tertile had the highest inflammation, oxidative-damage, antioxidant-deficit and biological-aging/injury scores, whereas the preserved tertile had the lowest scores. Kruskal-Wallis tests were significant for all four domains and the integrated oncogenic-stress score (all p < 0.001).
3.4. Correlation and Adjusted Regression Models
The melatonergic-axis score correlated strongly and inversely with the integrated oncogenic-stress score (Spearman rho = -0.944, p < 0.001; Figure 3). Similar inverse correlations were observed for inflammation (rho = -0.918), oxidative damage (rho = -0.909), antioxidant deficit (rho = -0.884) and biological aging/injury (rho = -0.956). In complete-case adjusted regression models (N = 250), a 1-SD higher melatonergic-axis score was associated with a 0.95-SD lower integrated oncogenic-stress score (95% CI, -0.98 to -0.92; p < 0.001; Figure 4 and Table 2). Associations were directionally consistent across all domain composites.
3.5. Translational Interface with Microbiome and Liquid-Biopsy Progression Markers
The adult workbook supports an upstream systemic pattern: low melatonin/aMT6s tracked with oxidative, inflammatory and aging/injury signals. The previously reported melatonin-microbiome materials support a second layer in which melatonin deficiency may co-occur with severe dysbiosis and reduced Lactobacillus acidophilus and Saccharomyces boulardii, while the previously reported CTC/cfDNA report supports a downstream layer in which CTCs and cfDNA can identify progression or metastatic recurrence. Together, these materials justify a prospective study in which melatonin/aMT6s, microbiome structure, oxidative-stress markers and CTC/cfDNA are measured longitudinally in cancer-risk and cancer-survivorship populations.
4. Discussion
This research article integrates the source biomarker dataset and prior translational materials into a single cancer-continuum model. In the adult Excel cohort, reduced melatonergic status was associated with a broad pro-inflammatory, pro-oxidative and biological-aging/injury phenotype. These findings are biologically coherent with the known antioxidant, immunomodulatory and mitochondrial roles of melatonin, and with evidence linking oxidative stress and chronic inflammation to cancer initiation and progression [1,2,3,4,5,6,7,8,9,10,11,12].
The findings do not establish that low melatonin causes cancer, that melatonin supplementation prevents cancer, or that the measured composite scores diagnose cancer. The workbook lacks cancer incidence, microbiome sequencing and liquid-biopsy endpoints. Nevertheless, the magnitude and consistency of the associations support the idea that melatonergic deficiency may identify a systemic environment compatible with oxidative DNA damage, impaired redox buffering, inflammatory activation and accelerated biological aging. This environment may increase susceptibility to initiation and promotion events, whereas CTC/cfDNA markers are more relevant to progression, minimal residual disease and metastatic dissemination [20,21,22,23,24,25,26,27].
The melatonin-microbiome axis is a particularly important bridge between early systemic biology and cancer-specific outcomes. Dysbiosis can alter epithelial barrier function, microbial metabolite production and immune tone [13,14,15,16,17,18,19]. The previously reported cancer-patient microbiome work reported severe dysbiosis with reduced Lactobacillus acidophilus and Saccharomyces boulardii in the setting of low melatonin, along with experimental observations that melatonin exposure influenced myrosinase-related activity and anti-proliferative effects. These claims require rigorous validation using standardized sequencing, metabolomics and reproducible cell-based assays, but they provide a plausible rationale for prospective testing.
The CTC/cfDNA axis should be positioned downstream in this model. CTCs and ctDNA do not generally define the earliest biological field of carcinogenesis; instead, they become clinically useful when tumor shedding, minimal residual disease or metastatic risk is present [20,21,22,23,24,25,26,27]. A combined prospective design could test whether melatonergic deficiency and oxidative/microbiome changes predict later CTC/cfDNA emergence in high-risk individuals or cancer survivors.
Strengths and Limitations
Strengths include use of a broad biomarker panel, adult-only pre-specified analysis, composite-domain modeling and explicit separation of primary statistical findings from contextual previously published materials. Limitations are substantial. The analysis is cross-sectional, secondary and hypothesis-generating. The workbook contains no direct cancer outcomes, no microbiome sequencing, no CTC/cfDNA measurements and no prospective follow-up. Some source materials were previously disseminated in low-visibility or non-mainstream venues, so the authors must confirm data provenance, permissions and novelty before journal submission. The adjusted regression models were complete-case analyses and may be affected by missingness. Finally, the high correlation structure may reflect biological coupling, data recovery methods, or both; independent validation is essential.
5. Conclusions
In this adult biomarker analysis, lower plasma melatonin and urinary aMT6s were strongly associated with higher inflammatory, oxidative-damage, antioxidant-deficit and biological-aging/injury burdens. The results support a testable model in which melatonergic deficiency marks an upstream systemic environment that may facilitate cancer initiation and promotion, whereas microbiome dysbiosis and CTC/cfDNA emergence represent intermediate and downstream layers of the cancer continuum. A prospective oncology study should measure melatonin/aMT6s, standardized microbiome profiles, oxidative-damage markers and liquid-biopsy endpoints simultaneously to determine whether this axis predicts cancer risk, recurrence or progression.
Supplementary Materials
The following supporting information can be downloaded at the website of this paper posted on Preprints.org, Supplementary_Analysis_Summary.xlsx, including population summaries, composite-score comparisons, Spearman correlations, adjusted regression models, source notes and a contextual CTC/cfDNA summary. High-resolution PNG versions of all manuscript figures are also supplied.
Author Contributions
Conceptualization, A.T. and R.J.R.; methodology, A.T., L.T., N.O. and P.R.; formal analysis, A.T. and P.R.; investigation, A.T., L.T., N.O. and P.R.; resources, A.T. and L.T.; data curation, A.T., L.T. and P.R.; writing - original draft preparation, A.T.; writing - review and editing, A.T., L.T., R.J.R., M.B., E.U., N.O. and P.R.; visualization, A.T.; supervision, A.T., R.J.R., M.B. and E.U.; project administration, A.T.; funding acquisition, A.T. All authors should review and approve the final submitted version. A.T., Alexandre Tavartkiladze; L.T., Levan Tavartkiladze; R.J.R., Russel J. Reiter; M.B., Michel Burnier; E.U., Engin Ulukaya; N.O., Nana Okrostsvaridze; P.R., Pati Revazishvili.
Funding
This work was supported by the Institute for Personalized Medicine of Georgia (PMI), Tbilisi, Georgia. The authors should confirm the final grant and institutional funding statement before submission.
Institutional Review Board Statement
The adult biomarker reanalysis should be linked to the appropriate ethics approval before submission. Suggested final wording: “The study was conducted in accordance with the Declaration of Helsinki and approved by the Ethics Committee of [institution] (protocol code [code], approval date [date]).” The previously reported NSCLC CTC/cfDNA observation was described as approved by the Local Ethical Committee of the Institute for Personalized Medicine, Tbilisi, Georgia, document reference 29/2019-17b; if those data are mentioned in the submitted manuscript, this documentation should be available to the journal.
Informed Consent Statement
Informed consent was obtained from all subjects involved in the original studies; this statement should be verified against source records before submission. This adult reanalysis excluded participants younger than 18 years from the primary Excel dataset.
Data Availability Statement
The data presented in this study are available on request from the corresponding author due to privacy and ethical restrictions. Aggregate results and analysis summaries are provided in the Supplementary Materials.
Acknowledgments
The authors acknowledge the Institute for Personalized Medicine of Georgia (PMI) and Tbilisi State Medical University for administrative and laboratory support. The authors also acknowledge the editorial invitation from Cancers/MDPI and thank Jennifer He for correspondence regarding the submission route.
Use of Generative AI and Editorial Assistance
During the preparation of this manuscript, OpenAI ChatGPT was used to assist with language organization, formatting, figure preparation and statistical reporting from author-provided materials. The authors should review and edit the output and take full responsibility for the content of the publication before submission.
Conflicts of Interest
The authors declare no conflict of interest. The sponsors had no role in the design, execution, interpretation or writing of the study unless otherwise specified by the authors before submission.
References
- Hanahan, D. Hallmarks of Cancer: New Dimensions. Cancer Discov. 2022, 12, 31–46. [Google Scholar] [CrossRef] [PubMed]
- Hanahan, D.; Weinberg, R.A. Hallmarks of cancer: the next generation. Cell. 2011, 144, 646–674. [Google Scholar] [CrossRef] [PubMed]
- Sies, H.; Jones, D.P. Reactive oxygen species as pleiotropic physiological signalling agents. Nat. Rev. Mol. Cell Biol. 2020, 21, 363–383. [Google Scholar] [CrossRef] [PubMed]
- Reuter, S.; Gupta, S.C.; Chaturvedi, M.M.; Aggarwal, B.B. Oxidative stress, inflammation, and cancer: how are they linked? Free Radic. Biol. Med. 2010, 49, 1603–1616. [Google Scholar] [CrossRef] [PubMed]
- Valavanidis, A.; Vlachogianni, T.; Fiotakis, K. 8-Hydroxy-2'-deoxyguanosine (8-OHdG): a critical biomarker of oxidative stress and carcinogenesis. J. Env. Sci. Health C Env. Carcinog. Ecotoxicol. Rev. 2009, 27, 120–139. [Google Scholar]
- Ayala, A.; Munoz, M.F.; Arguelles, S. Lipid peroxidation: production, metabolism, and signaling mechanisms of malondialdehyde and 4-hydroxy-2-nonenal. Oxid. Med. Cell Longev. 2014, 2014, 360438. [Google Scholar] [CrossRef] [PubMed]
- Sies, H. Hydrogen peroxide as a central redox signaling molecule in physiological oxidative stress: oxidative eustress. Redox Biol. 2017, 11, 613–619. [Google Scholar] [CrossRef] [PubMed]
- Brigelius-Flohe, R.; Maiorino, M. Glutathione peroxidases. Biochim Biophys. Acta 2013, 1830, 3289–3303. [Google Scholar] [CrossRef] [PubMed]
- Weydert, C.J.; Cullen, J.J. Measurement of superoxide dismutase, catalase and glutathione peroxidase in cultured cells and tissue. Nat. Protoc. 2010, 5, 51–66. [Google Scholar] [PubMed]
- Reiter, R.J.; Tan, D.X.; Galano, A. Melatonin: exceeding expectations. Physiology 2014, 29, 325–333. [Google Scholar] [CrossRef] [PubMed]
- Hardeland, R.; Cardinali, D.P.; Srinivasan, V.; Spence, D.W.; Brown, G.M.; Pandi-Perumal, S.R. Melatonin - a pleiotropic, orchestrating regulator molecule. Prog. Neurobiol. 2011, 93, 350–384. [Google Scholar] [PubMed]
- Sanchez-Barcelo, E.J.; Cos, S.; Fernandez, R.; Mediavilla, M.D. Melatonin and mammary cancer: a short review. Endocr. Relat. Cancer 2003, 10, 153–159. [Google Scholar] [CrossRef] [PubMed]
- Lynch, S.V.; Pedersen, O. The human intestinal microbiome in health and disease. N Engl. J. Med. 2016, 375, 2369–2379. [Google Scholar] [CrossRef] [PubMed]
- Garrett, W.S. Cancer and the microbiota. Science 2015, 348, 80–86. [Google Scholar] [CrossRef] [PubMed]
- Schwabe, R.F.; Jobin, C. The microbiome and cancer. Nat. Rev. Cancer 2013, 13, 800–812. [Google Scholar] [CrossRef] [PubMed]
- Dzutsev, A.; Badger, J.H.; Perez-Chanona, E.; Roy, S.; Salcedo, R.; Smith, C.K.; Trinchieri, G. Microbes and cancer. Annu Rev. Immunol. 2017, 35, 199–228. [Google Scholar] [CrossRef] [PubMed]
- Louis, P.; Hold, G.L.; Flint, H.J. The gut microbiota, bacterial metabolites and colorectal cancer. Nat. Rev. Microbiol. 2014, 12, 661–672. [Google Scholar] [CrossRef] [PubMed]
- Arthur, J.C.; Perez-Chanona, E.; Muhlbauer, M.; et al. Intestinal inflammation targets cancer-inducing activity of the microbiota. Science 2012, 338, 120–123. [Google Scholar] [CrossRef] [PubMed]
- Hill, C.; Guarner, F.; Reid, G.; Gibson, G.R.; Merenstein, D.J.; Pot, B.; et al. Expert consensus document: the International Scientific Association for Probiotics and Prebiotics consensus statement. Nat. Rev. Gastroenterol. Hepatol. 2014, 11, 506–514. [Google Scholar] [PubMed]
- Allard, W.J.; Matera, J.; Miller, M.C.; et al. Tumor cells circulate in the peripheral blood of all major carcinomas but not in healthy subjects or patients with nonmalignant diseases. Clin. Cancer Res. 2004, 10, 6897–6904. [Google Scholar] [CrossRef] [PubMed]
- Cristofanilli, M.; Budd, G.T.; Ellis, M.J.; et al. Circulating tumor cells, disease progression, and survival in metastatic breast cancer. N Engl. J. Med. 2004, 351, 781–791. [Google Scholar] [CrossRef] [PubMed]
- Pantel, K.; Alix-Panabieres, C. Circulating tumour cells in cancer patients: challenges and perspectives. Trends Mol. Med. 2010, 16, 398–406. [Google Scholar] [CrossRef] [PubMed]
- Alix-Panabieres, C.; Pantel, K. Challenges in circulating tumour cell research. Nat. Rev. Cancer 2014, 14, 623–631. [Google Scholar] [CrossRef] [PubMed]
- Diaz, L.A., Jr.; Bardelli, A. Liquid biopsies: genotyping circulating tumor DNA. J. Clin. Oncol. 2014, 32, 579–586. [Google Scholar] [CrossRef] [PubMed]
- Wan, J.C.M.; Massie, C.; Garcia-Corbacho, J.; et al. Liquid biopsies come of age: towards implementation of circulating tumour DNA. Nat. Rev. Cancer 2017, 17, 223–238. [Google Scholar] [CrossRef] [PubMed]
- Abbosh, C.; Birkbak, N.J.; Wilson, G.A.; et al. Phylogenetic ctDNA analysis depicts early-stage lung cancer evolution. Nature 2017, 545, 446–451. [Google Scholar] [PubMed]
- Eibl, R.H.; Schneemann, M. Cell-free DNA as a biomarker in cancer. Extracell. Vesicles Circ. Nucleic Acids 2022, 3, 178–198. [Google Scholar] [CrossRef]
- Franceschi, C.; Garagnani, P.; Parini, P.; Giuliani, C.; Santoro, A. Inflammaging: a new immune-metabolic viewpoint for age-related diseases. Nat. Rev. Endocrinol. 2018, 14, 576–590. [Google Scholar] [CrossRef] [PubMed]
- Fulop, T.; Dupuis, G.; Witkowski, J.M.; Larbi, A. The role of immunosenescence in the development of age-related diseases. Rev. Invest Clin. 2016, 68, 84–91. [Google Scholar] [CrossRef] [PubMed]
- Younossi, Z.M.; Koenig, A.B.; Abdelatif, D.; Fazel, Y.; Henry, L.; Wymer, M. Global epidemiology of non-alcoholic fatty liver disease - meta-analytic assessment of prevalence, incidence, and outcomes. Hepatology 2016, 64, 73–84. [Google Scholar] [PubMed]
- Chen, J.; Vitetta, L.; Henson, J.D.; Hall, S. The role of melatonin in the regulation of liver function. J. Pineal Res. 2018, 65, e12514. [Google Scholar]
- Tavartkiladze, A.; Simonia, G.; Revazishvili, P.; Tavartkiladze, L.; Tavartkiladze, G. Role of melatonin-microbiome axis in the initiation of carcinogenesis. Int. J. Sci. Res. 2023, 12, 472–475. [Google Scholar] [CrossRef]
- Tavartkiladze, A.; Turmanidze, R.; Simonia, G.; Gogoladze, M.; Revazishvili, P.; Dundua, G.; Andronikashvili, I. Circulating tumor cells and cfDNA: key predictive biomarkers in non-small cell lung cancer progression and treatment. Int. J. Sci. Res. 2023, 12, 1078–1081. [Google Scholar]
- Egiazarov, D.; Tavartkiladze, A.; Simonia, G.; Okrostsvaridze, N.; Tavartkiladze, L.; et al. Melatonin, oxidative stress and the role of gut microbiota in the therapeutic strategy for non-alcoholic fatty liver disease and in the cancer risk assessment. Eur. J. Med. Res. Clin. Trials 2024, 6, 103. [Google Scholar] [CrossRef]
- Tavartkiladze, A.; Simonia, G.; Revazishvili, P.; Okrostvaridze, N.; Khutsishvili, R.; Tavartkiladze, L. Early biomarkers of malignant tumor initiation and progression: a comprehensive review. JJ Oncol. Clin. Res. 2024, 5, 103. [Google Scholar] [CrossRef]
Figure 2.
Composite biomarker scores by melatonergic tertile. Higher composite z-scores indicate higher inflammatory, oxidative-damage, antioxidant-deficit or biological-aging/injury burden. Bars show mean ± SEM.
Figure 2.
Composite biomarker scores by melatonergic tertile. Higher composite z-scores indicate higher inflammatory, oxidative-damage, antioxidant-deficit or biological-aging/injury burden. Bars show mean ± SEM.
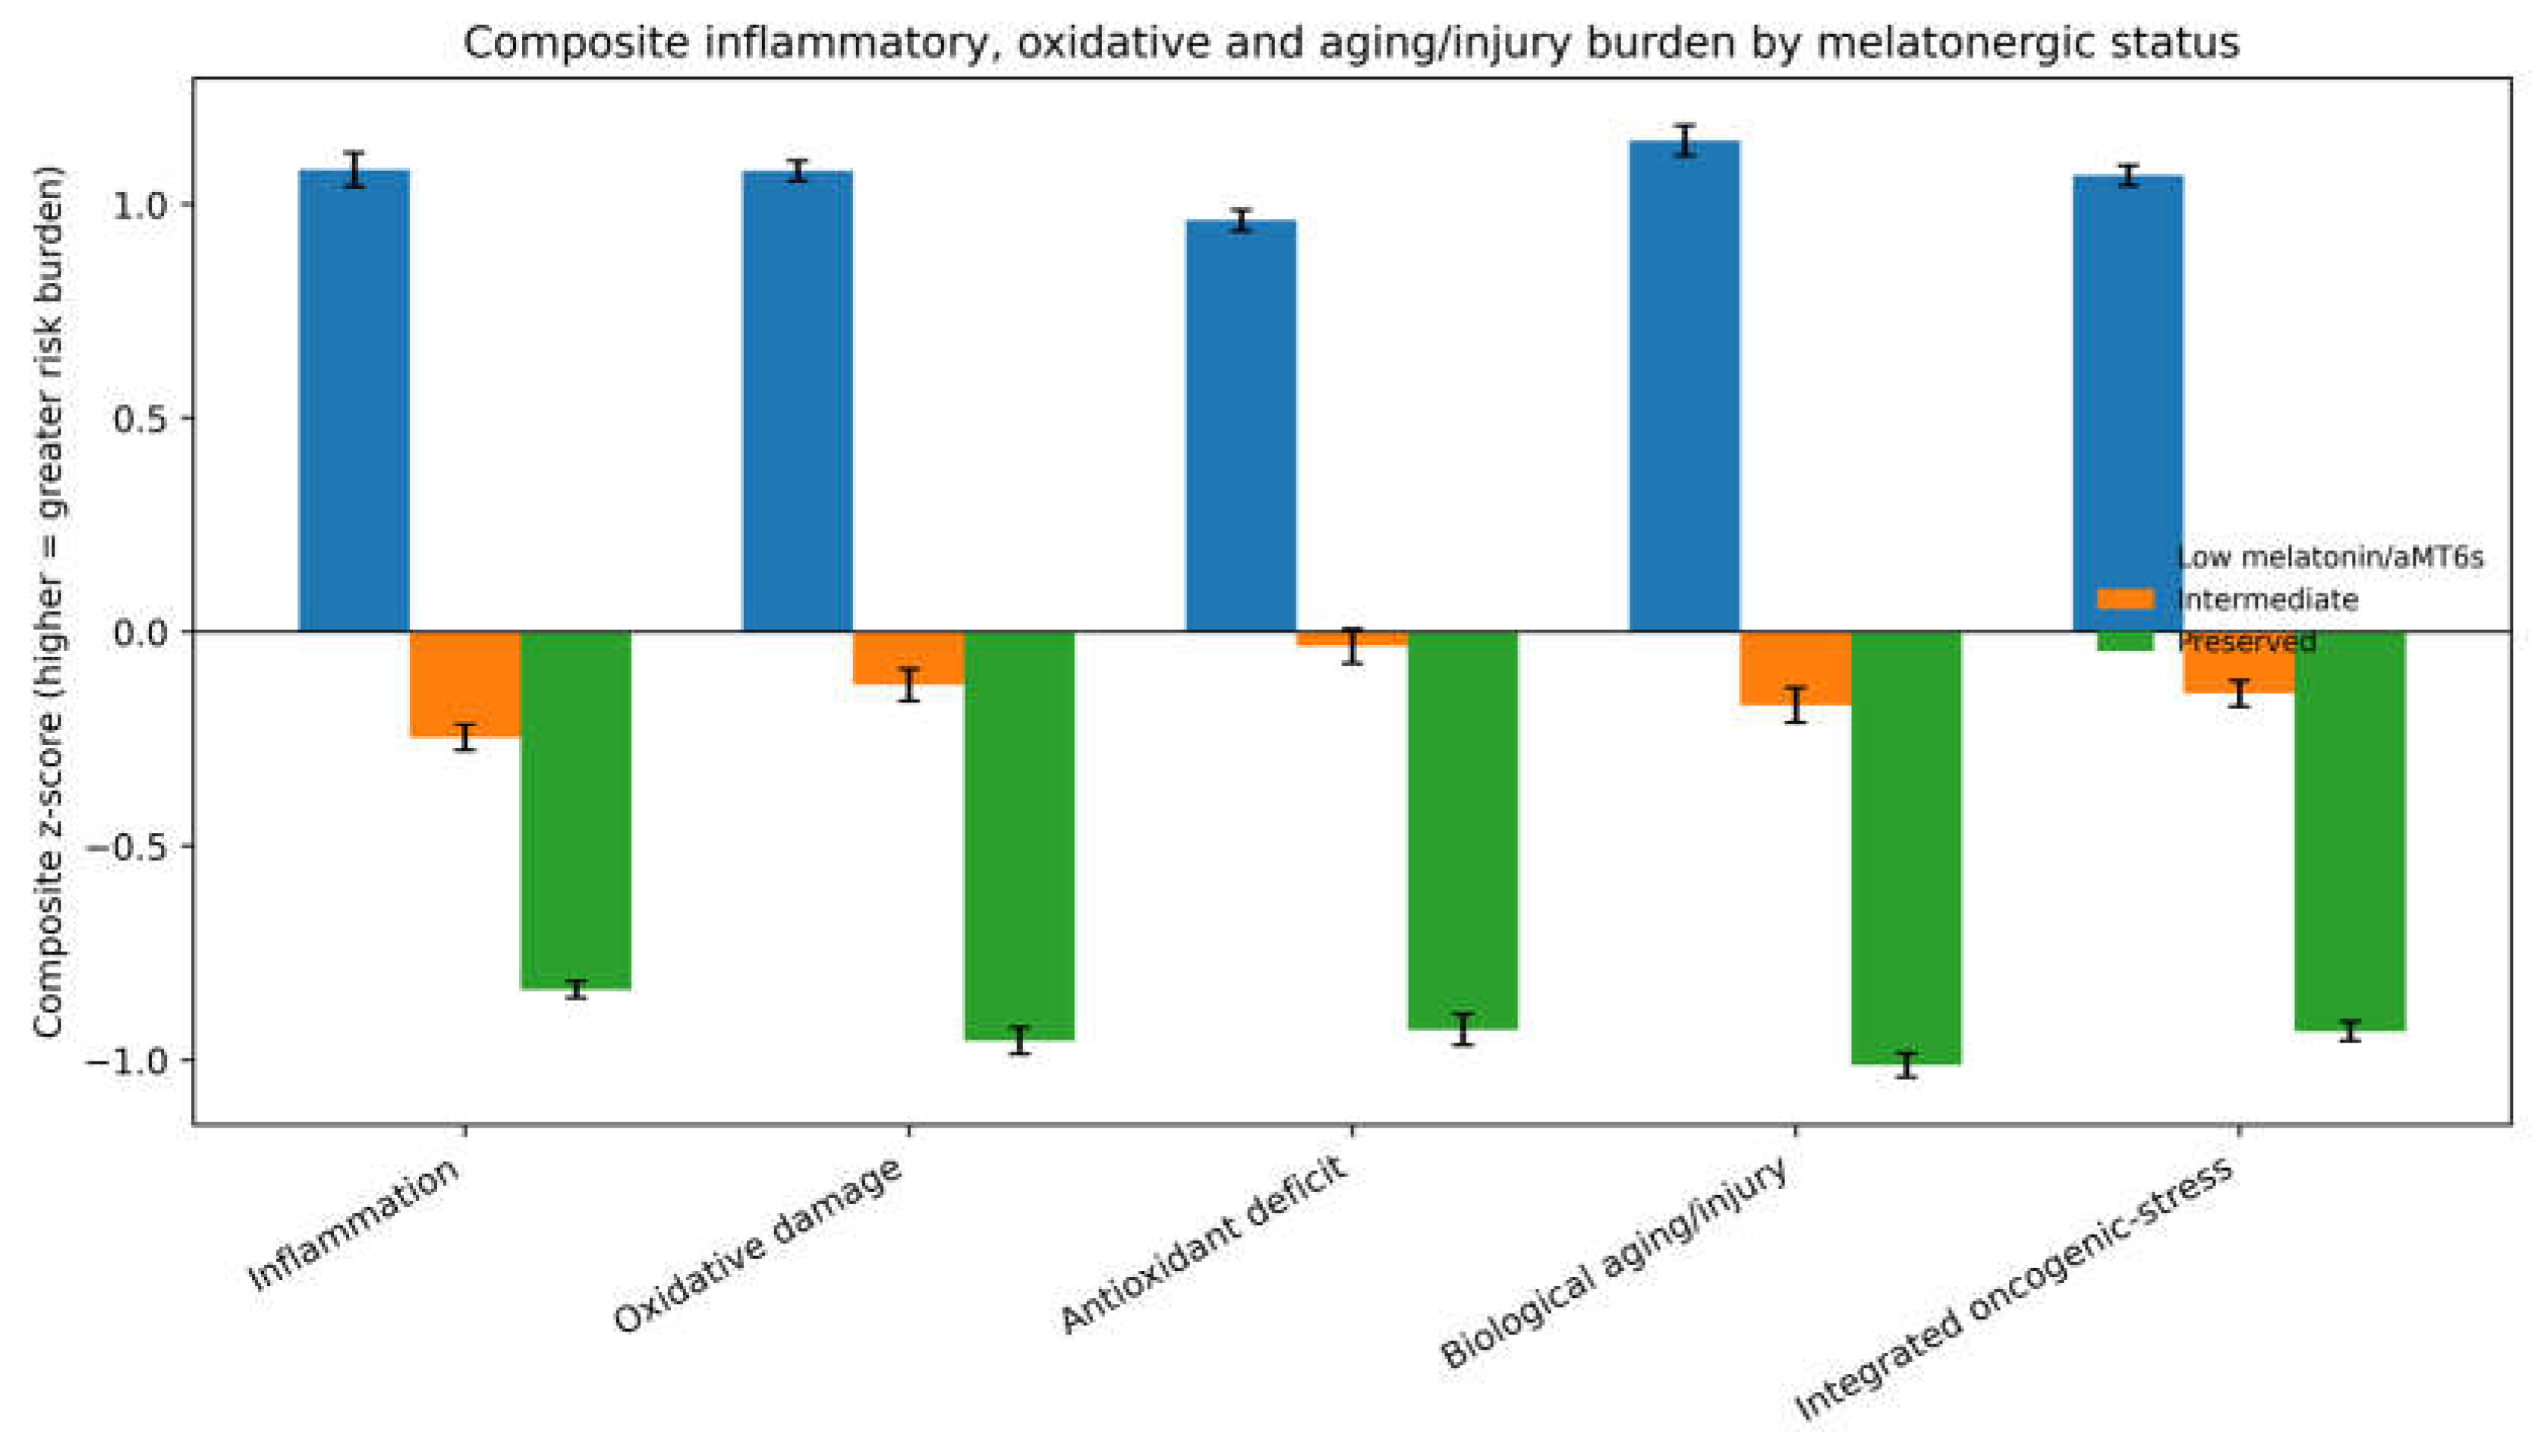
Figure 3.
Spearman correlations between melatonergic variables and selected biomarkers. Negative values indicate that lower melatonin/aMT6s is associated with higher biomarker burden; GSH/GSSG is protective and therefore correlates positively with preserved melatonergic status.
Figure 3.
Spearman correlations between melatonergic variables and selected biomarkers. Negative values indicate that lower melatonin/aMT6s is associated with higher biomarker burden; GSH/GSSG is protective and therefore correlates positively with preserved melatonergic status.
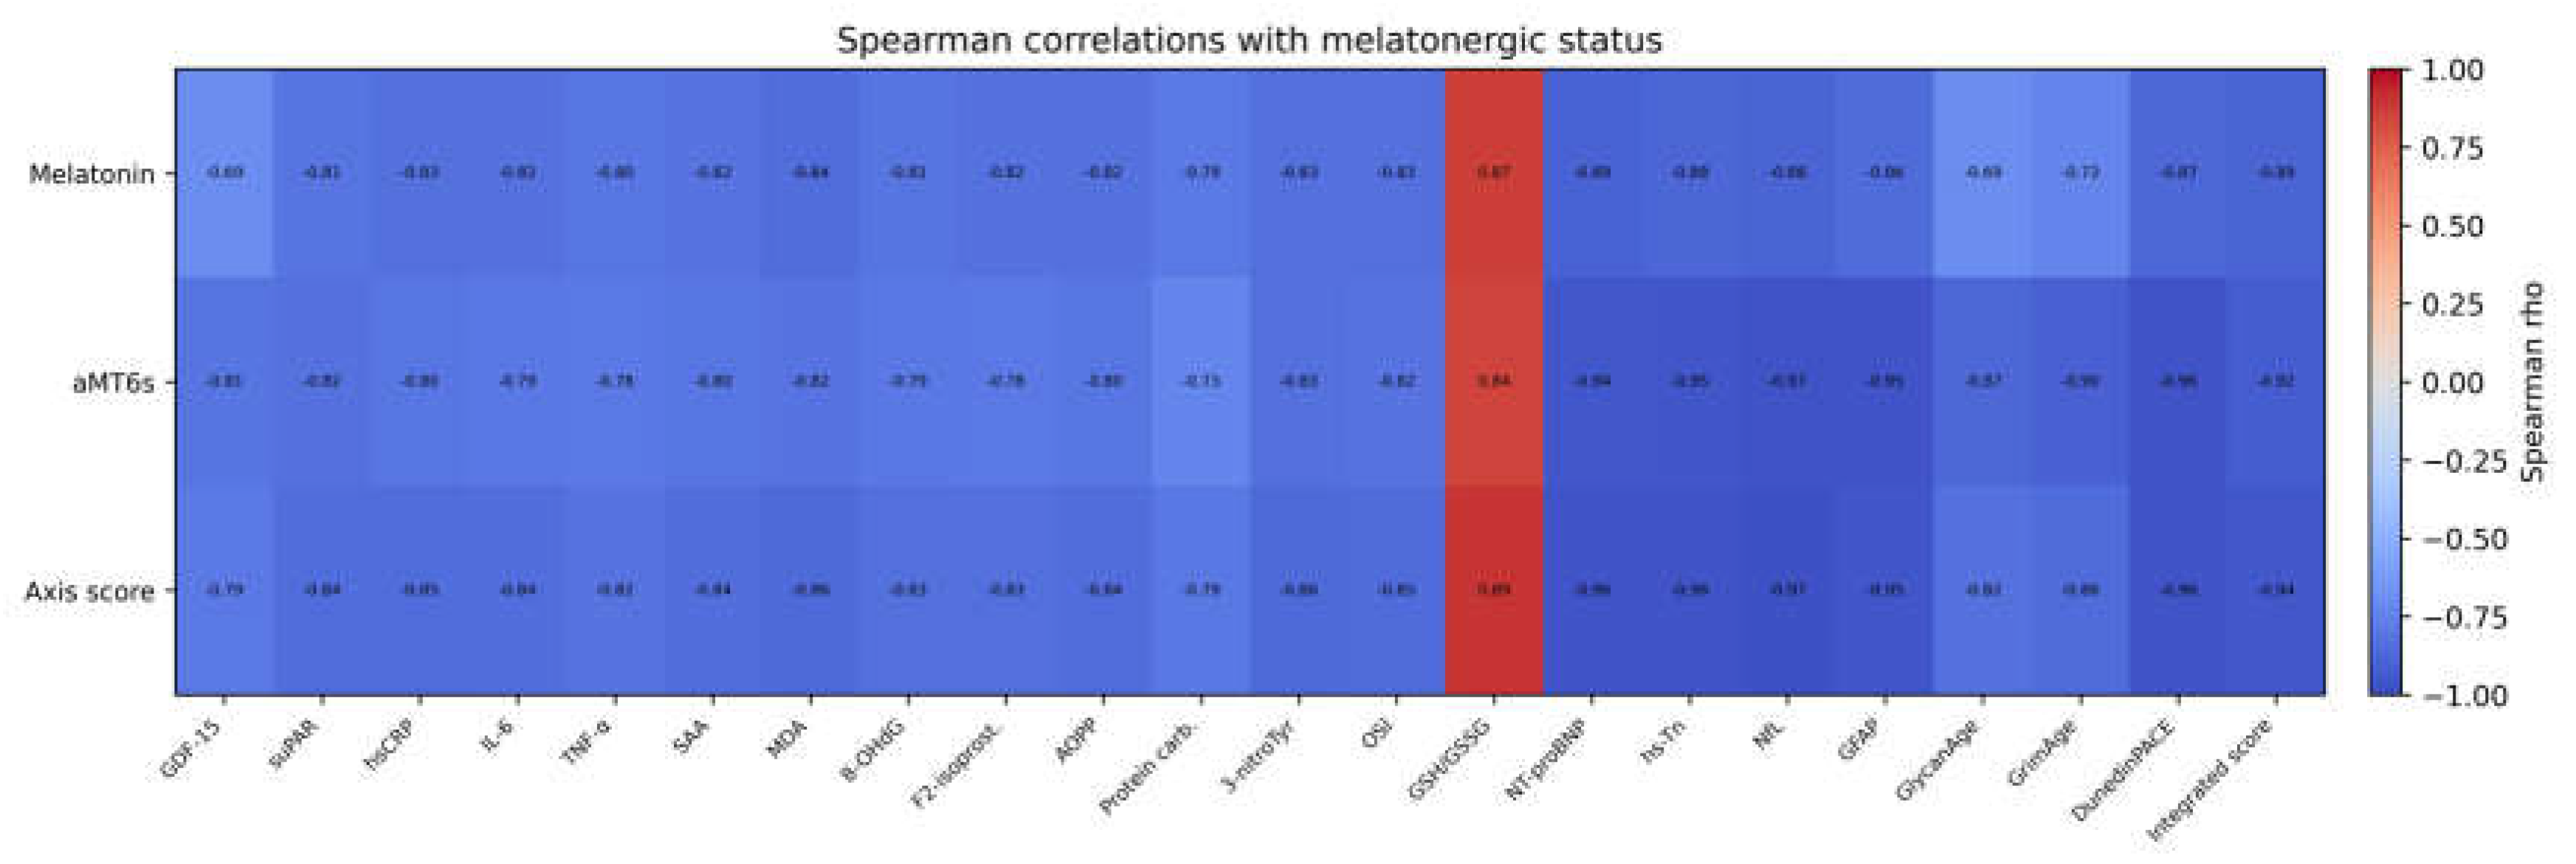
Figure 4.
Complete-case adjusted linear regression coefficients. Coefficients represent standardized change in each composite per 1-SD higher melatonergic-axis score, adjusted for age, sex and BMI.
Figure 4.
Complete-case adjusted linear regression coefficients. Coefficients represent standardized change in each composite per 1-SD higher melatonergic-axis score, adjusted for age, sex and BMI.
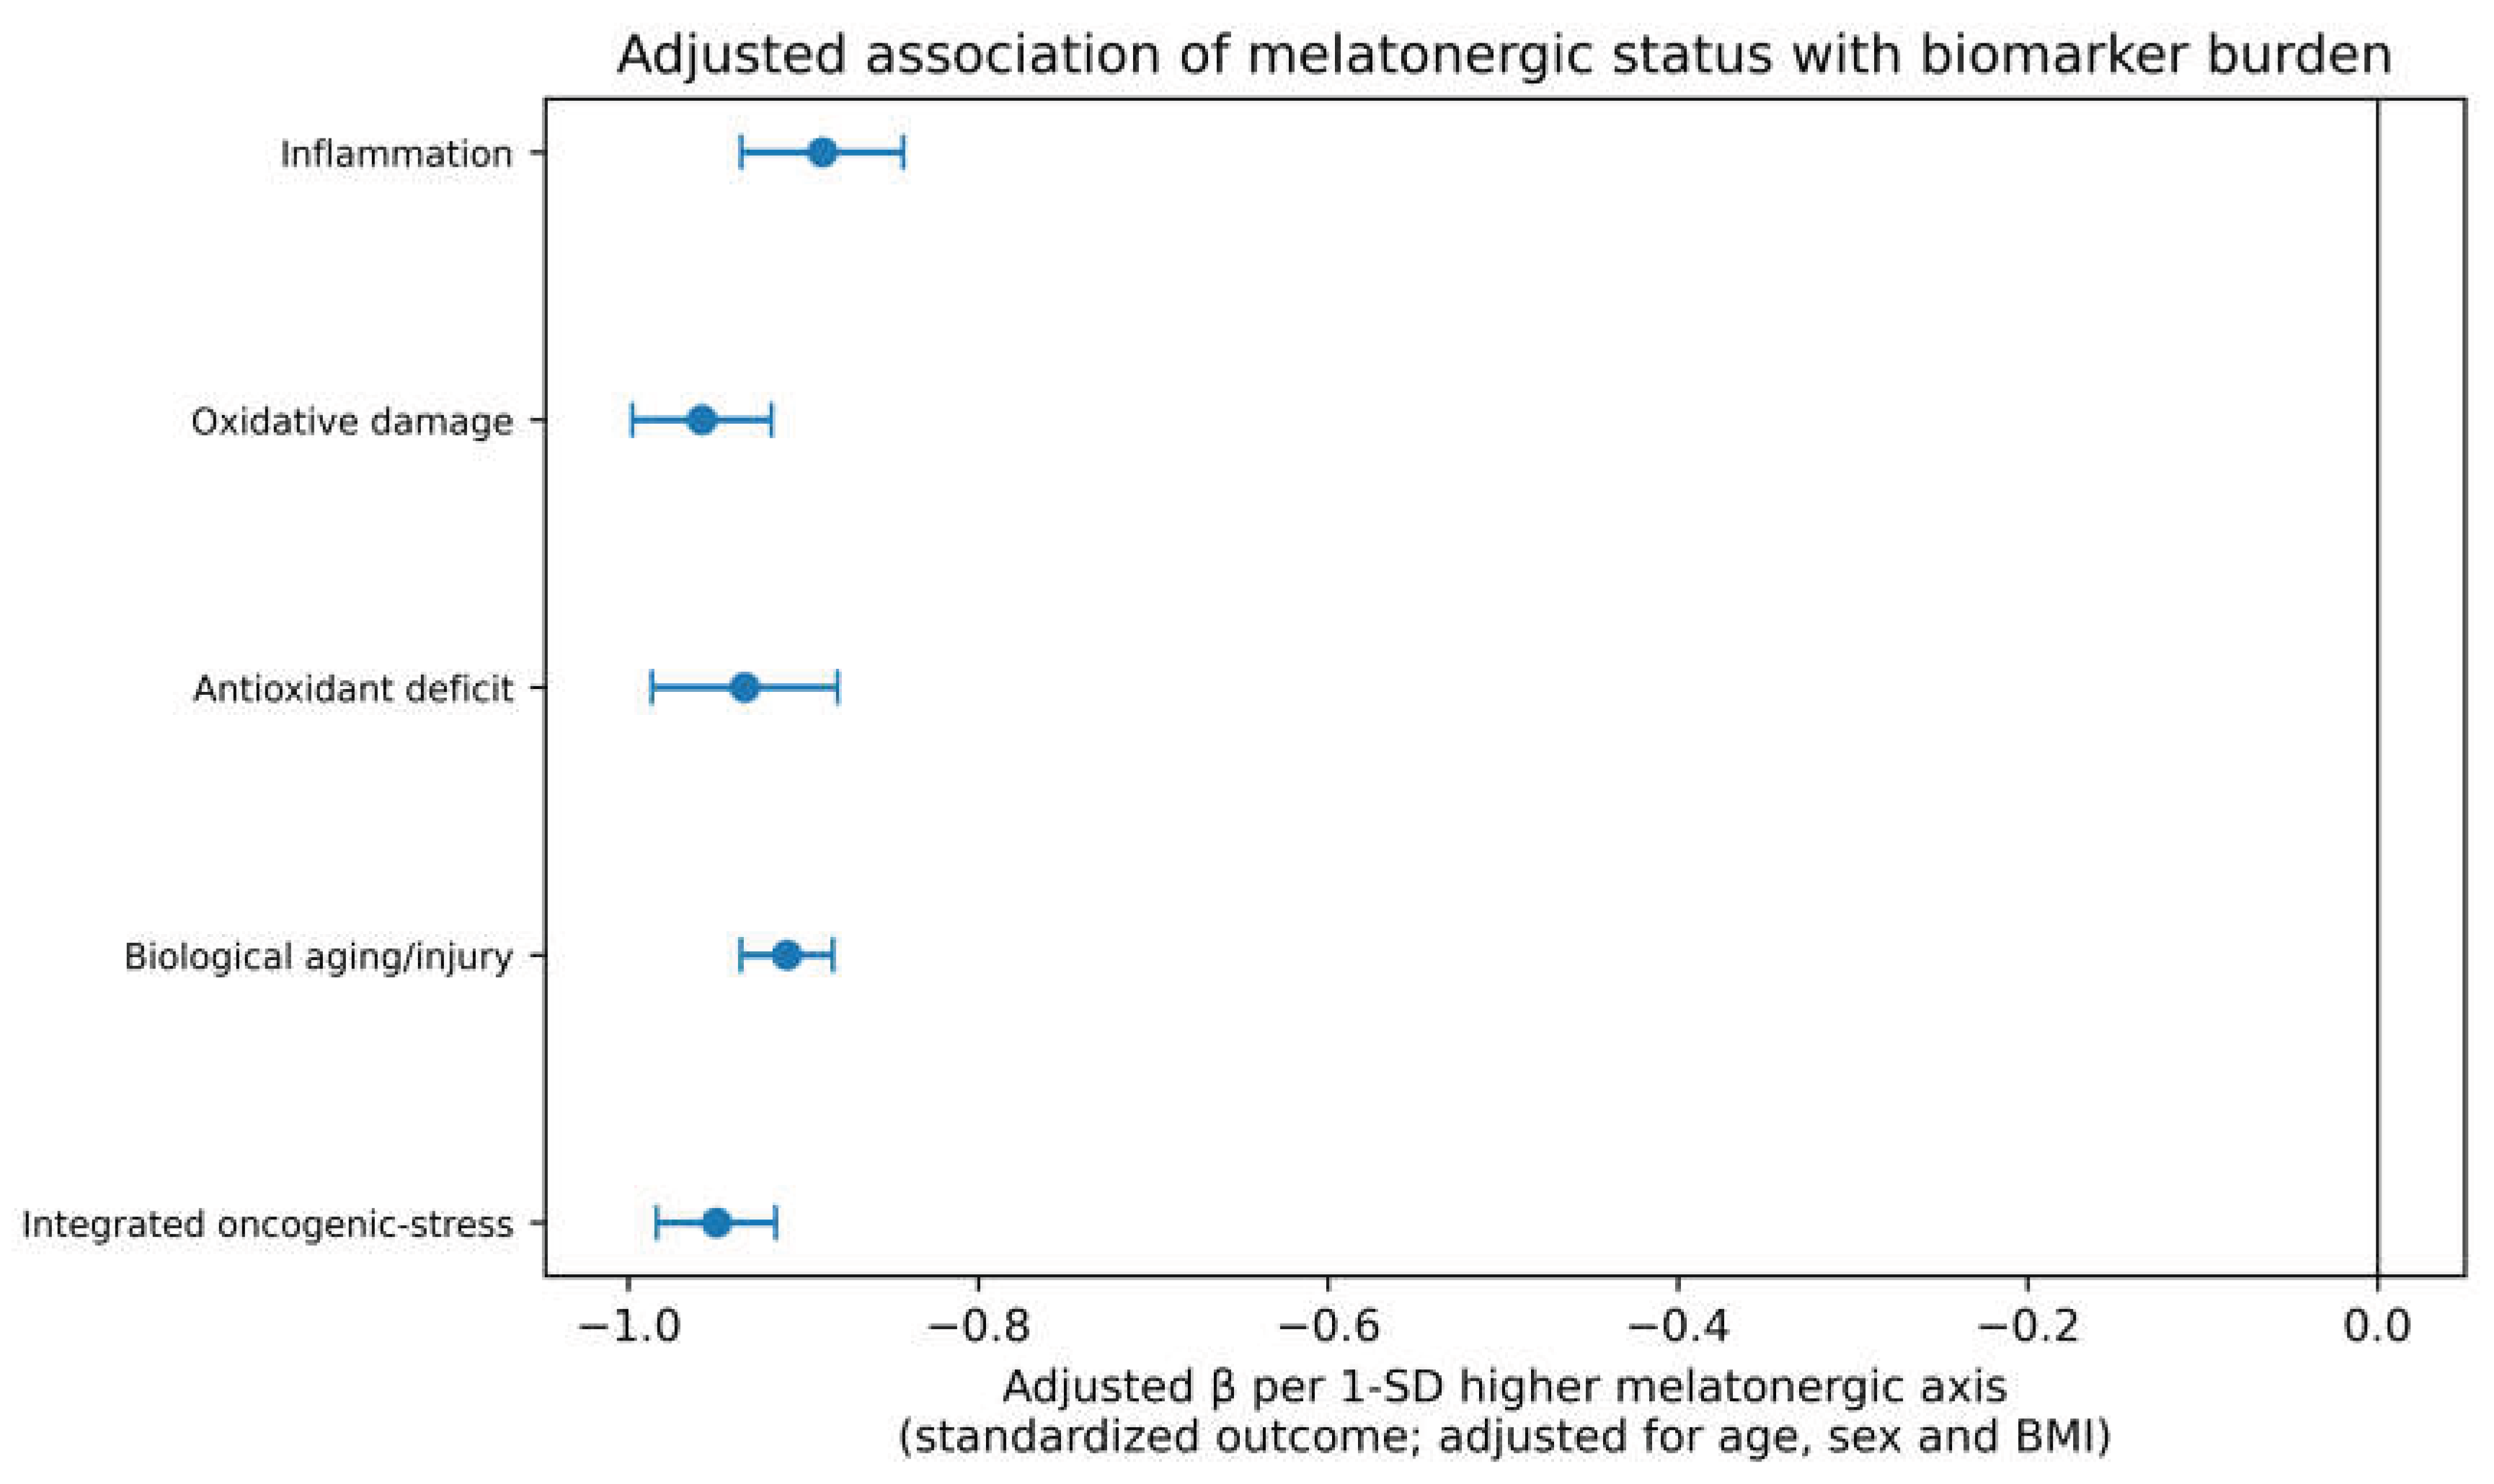

Table 1.
Adult cohort characteristics overall and by melatonin/aMT6s tertile (mean ± SD).
| Variable | Overall | Low melatonin/aMT6s | Intermediate | Preserved |
|---|---|---|---|---|
| Age, years | 48.99 ± 14.07 | 52.38 ± 14.01 | 51.67 ± 13.65 | 42.93 ± 12.62 |
| BMI, kg/m² | 27.13 ± 4.03 | 27.41 ± 4.69 | 27.28 ± 3.56 | 26.68 ± 3.70 |
| Plasma melatonin, pg/mL | 12.90 ± 8.40 | 4.18 ± 1.99 | 12.06 ± 3.45 | 22.46 ± 5.20 |
| Urinary aMT6s, µg/24 h | 19.10 ± 12.85 | 6.01 ± 2.29 | 18.32 ± 6.33 | 32.97 ± 9.17 |
| GDF-15, pg/mL | 1192.28 ± 660.33 | 1739.77 ± 798.01 | 1099.58 ± 346.85 | 736.62 ± 188.39 |
| suPAR, ng/mL | 3.30 ± 1.37 | 4.88 ± 0.88 | 2.87 ± 0.68 | 2.13 ± 0.55 |
| hsCRP, mg/L | 2.73 ± 2.00 | 5.05 ± 1.42 | 2.17 ± 0.95 | 0.97 ± 0.56 |
| IL-6, pg/mL | 2.77 ± 1.93 | 4.93 ± 1.61 | 2.19 ± 0.82 | 1.18 ± 0.55 |
| TNF-α, pg/mL | 6.52 ± 2.35 | 9.17 ± 1.73 | 5.84 ± 1.20 | 4.54 ± 0.89 |
| SAA, mg/L | 7.28 ± 4.66 | 12.48 ± 3.57 | 6.20 ± 2.26 | 3.15 ± 1.40 |
| MDA, µmol/L | 3.71 ± 1.18 | 5.00 ± 0.56 | 3.59 ± 0.65 | 2.54 ± 0.63 |
| 8-OHdG, ng/mL | 7.25 ± 2.84 | 10.25 ± 1.47 | 7.02 ± 1.68 | 4.49 ± 1.56 |
| OSI, TOS/TAC | 17.27 ± 10.54 | 29.34 ± 6.58 | 14.83 ± 5.48 | 7.62 ± 3.75 |
| GSH/GSSG ratio | 32.46 ± 29.21 | 11.32 ± 2.48 | 25.23 ± 12.65 | 60.74 ± 33.06 |
| NT-proBNP, pg/mL | 344.74 ± 200.86 | 592.15 ± 58.91 | 300.25 ± 92.22 | 135.36 ± 40.41 |
| hs-troponin, ng/L | 9.96 ± 4.52 | 15.40 ± 1.35 | 9.21 ± 2.14 | 5.13 ± 1.14 |
| NfL, pg/mL | 23.92 ± 12.05 | 38.70 ± 3.33 | 21.57 ± 5.33 | 11.09 ± 2.53 |
| GFAP, pg/mL | 166.88 ± 55.14 | 232.24 ± 20.66 | 157.01 ± 25.73 | 109.64 ± 19.14 |
| DunedinPACE, units/year | 1.07 ± 0.19 | 1.31 ± 0.07 | 1.03 ± 0.08 | 0.87 ± 0.05 |
Table 2.
Adjusted association of melatonergic-axis score with composite biomarker burden.
| Outcome composite | N complete-case | β per 1-SD higher melatonergic axis | 95% CI lower | 95% CI upper | p value | R² |
|---|---|---|---|---|---|---|
| Inflammation | 250 | -0.89 | -0.94 | -0.84 | <0.001 | 0.86 |
| Oxidative damage | 250 | -0.96 | -1.00 | -0.92 | <0.001 | 0.89 |
| Antioxidant deficit | 250 | -0.93 | -0.99 | -0.88 | <0.001 | 0.84 |
| Biological aging/injury | 250 | -0.91 | -0.94 | -0.88 | <0.001 | 0.95 |
| Integrated oncogenic-stress | 250 | -0.95 | -0.98 | -0.92 | <0.001 | 0.93 |
Disclaimer/Publisher’s Note: The statements, opinions and data contained in all publications are solely those of the individual author(s) and contributor(s) and not of MDPI and/or the editor(s). MDPI and/or the editor(s) disclaim responsibility for any injury to people or property resulting from any ideas, methods, instructions or products referred to in the content. |
© 2026 by the authors. Licensee MDPI, Basel, Switzerland. This article is an open access article distributed under the terms and conditions of the Creative Commons Attribution (CC BY) license (http://creativecommons.org/licenses/by/4.0/).
Copyright: This open access article is published under a Creative Commons CC BY 4.0 license, which permit the free download, distribution, and reuse, provided that the author and preprint are cited in any reuse.


