

Submitted:
26 June 2026
Posted:
29 June 2026
You are already at the latest version
Abstract
Capillary-driven diagnostic platforms, including lateral flow assays (LFAs) and lab-on-disc systems, are widely used for point-of-care testing due to their low cost, simplicity, and rapid operation. However, detection sensitivity is frequently limited by weak endpoint signals that are difficult to distinguish from background noise, particularly at analyte concentrations near the limit of detection (LoD). Conventional image-based analysis methods typically rely on a single endpoint image, thereby discarding valuable temporal information generated during assay development.In this work, we propose a kinetic image-analysis framework that utilizes time-series image acquisition to quantify reaction dynamics and improve low-concentration analyte detection. Instead of relying solely on endpoint intensity, the framework extracts multiple kinetic features, including signal accumulation rate, maximum slope, area under the signal curve, time-to-threshold, signal-to-noise ratio, and model-derived reaction parameters. A cloud-based analysis platform processes sequential assay images, performs automated background correction, tracks signal evolution over time, and estimates analyte concentration using both endpoint and kinetic metrics.The proposed approach is applicable to line-based, dot-based, and area-based capillary diagnostic assays and can be integrated with smartphone imaging systems. The framework provides a pathway toward improved sensitivity, earlier detection, and more robust quantification in next-generation point-of-care diagnostics.
Keywords:
lateral flow assay
; capillary diagnostics
; kinetic analysis
; image processing
; limit of detection
; lab-on-disc
; reaction kinetics
; point-of-care testing
1. Introduction
Point-of-care (POC) diagnostic technologies have become an essential component of modern healthcare by enabling rapid testing outside centralized laboratory environments1–4. The ability to perform diagnostic analyses at the site of patient care has significantly improved accessibility, reduced turnaround times, and facilitated timely clinical decision-making4,5. Such technologies have proven particularly valuable in resource-limited settings, emergency medicine, infectious disease surveillance, environmental monitoring, food safety testing, and personalized healthcare applications4,6. The COVID-19 pandemic further demonstrated the importance of rapid and decentralized diagnostic platforms, accelerating both technological innovation and widespread adoption of point-of-care testing systems4,7.
Among the various point-of-care diagnostic formats available today, capillary-driven assays such as lateral flow immunoassays (LFAs), paper-based microfluidic devices, and centrifugal lab-on-disc platforms have attracted considerable attention due to their simplicity, low manufacturing costs, portability, and minimal instrumentation requirements4,8. These systems leverage passive fluid transport mechanisms, including capillary action and centrifugal forces, to manipulate samples and reagents without the need for external pumps or complex fluidic control systems9,10. As a result, they offer an attractive combination of affordability, scalability, and ease of use, making them suitable for deployment in both developed and developing healthcare environments4,11.
Despite these advantages, many capillary-based diagnostic systems continue to face significant challenges related to analytical sensitivity and quantitative accuracy12,13. In particular, the detection of low analyte concentrations remains difficult because assay signals often approach the level of background noise generated by nonspecific binding4,14, optical artifacts, manufacturing variability, illumination inconsistencies, and detector limitations. Near the limit of detection (LoD), distinguishing true positive signals from background fluctuations becomes increasingly challenging, leading to reduced sensitivity and increased uncertainty in diagnostic decision-making.15–18
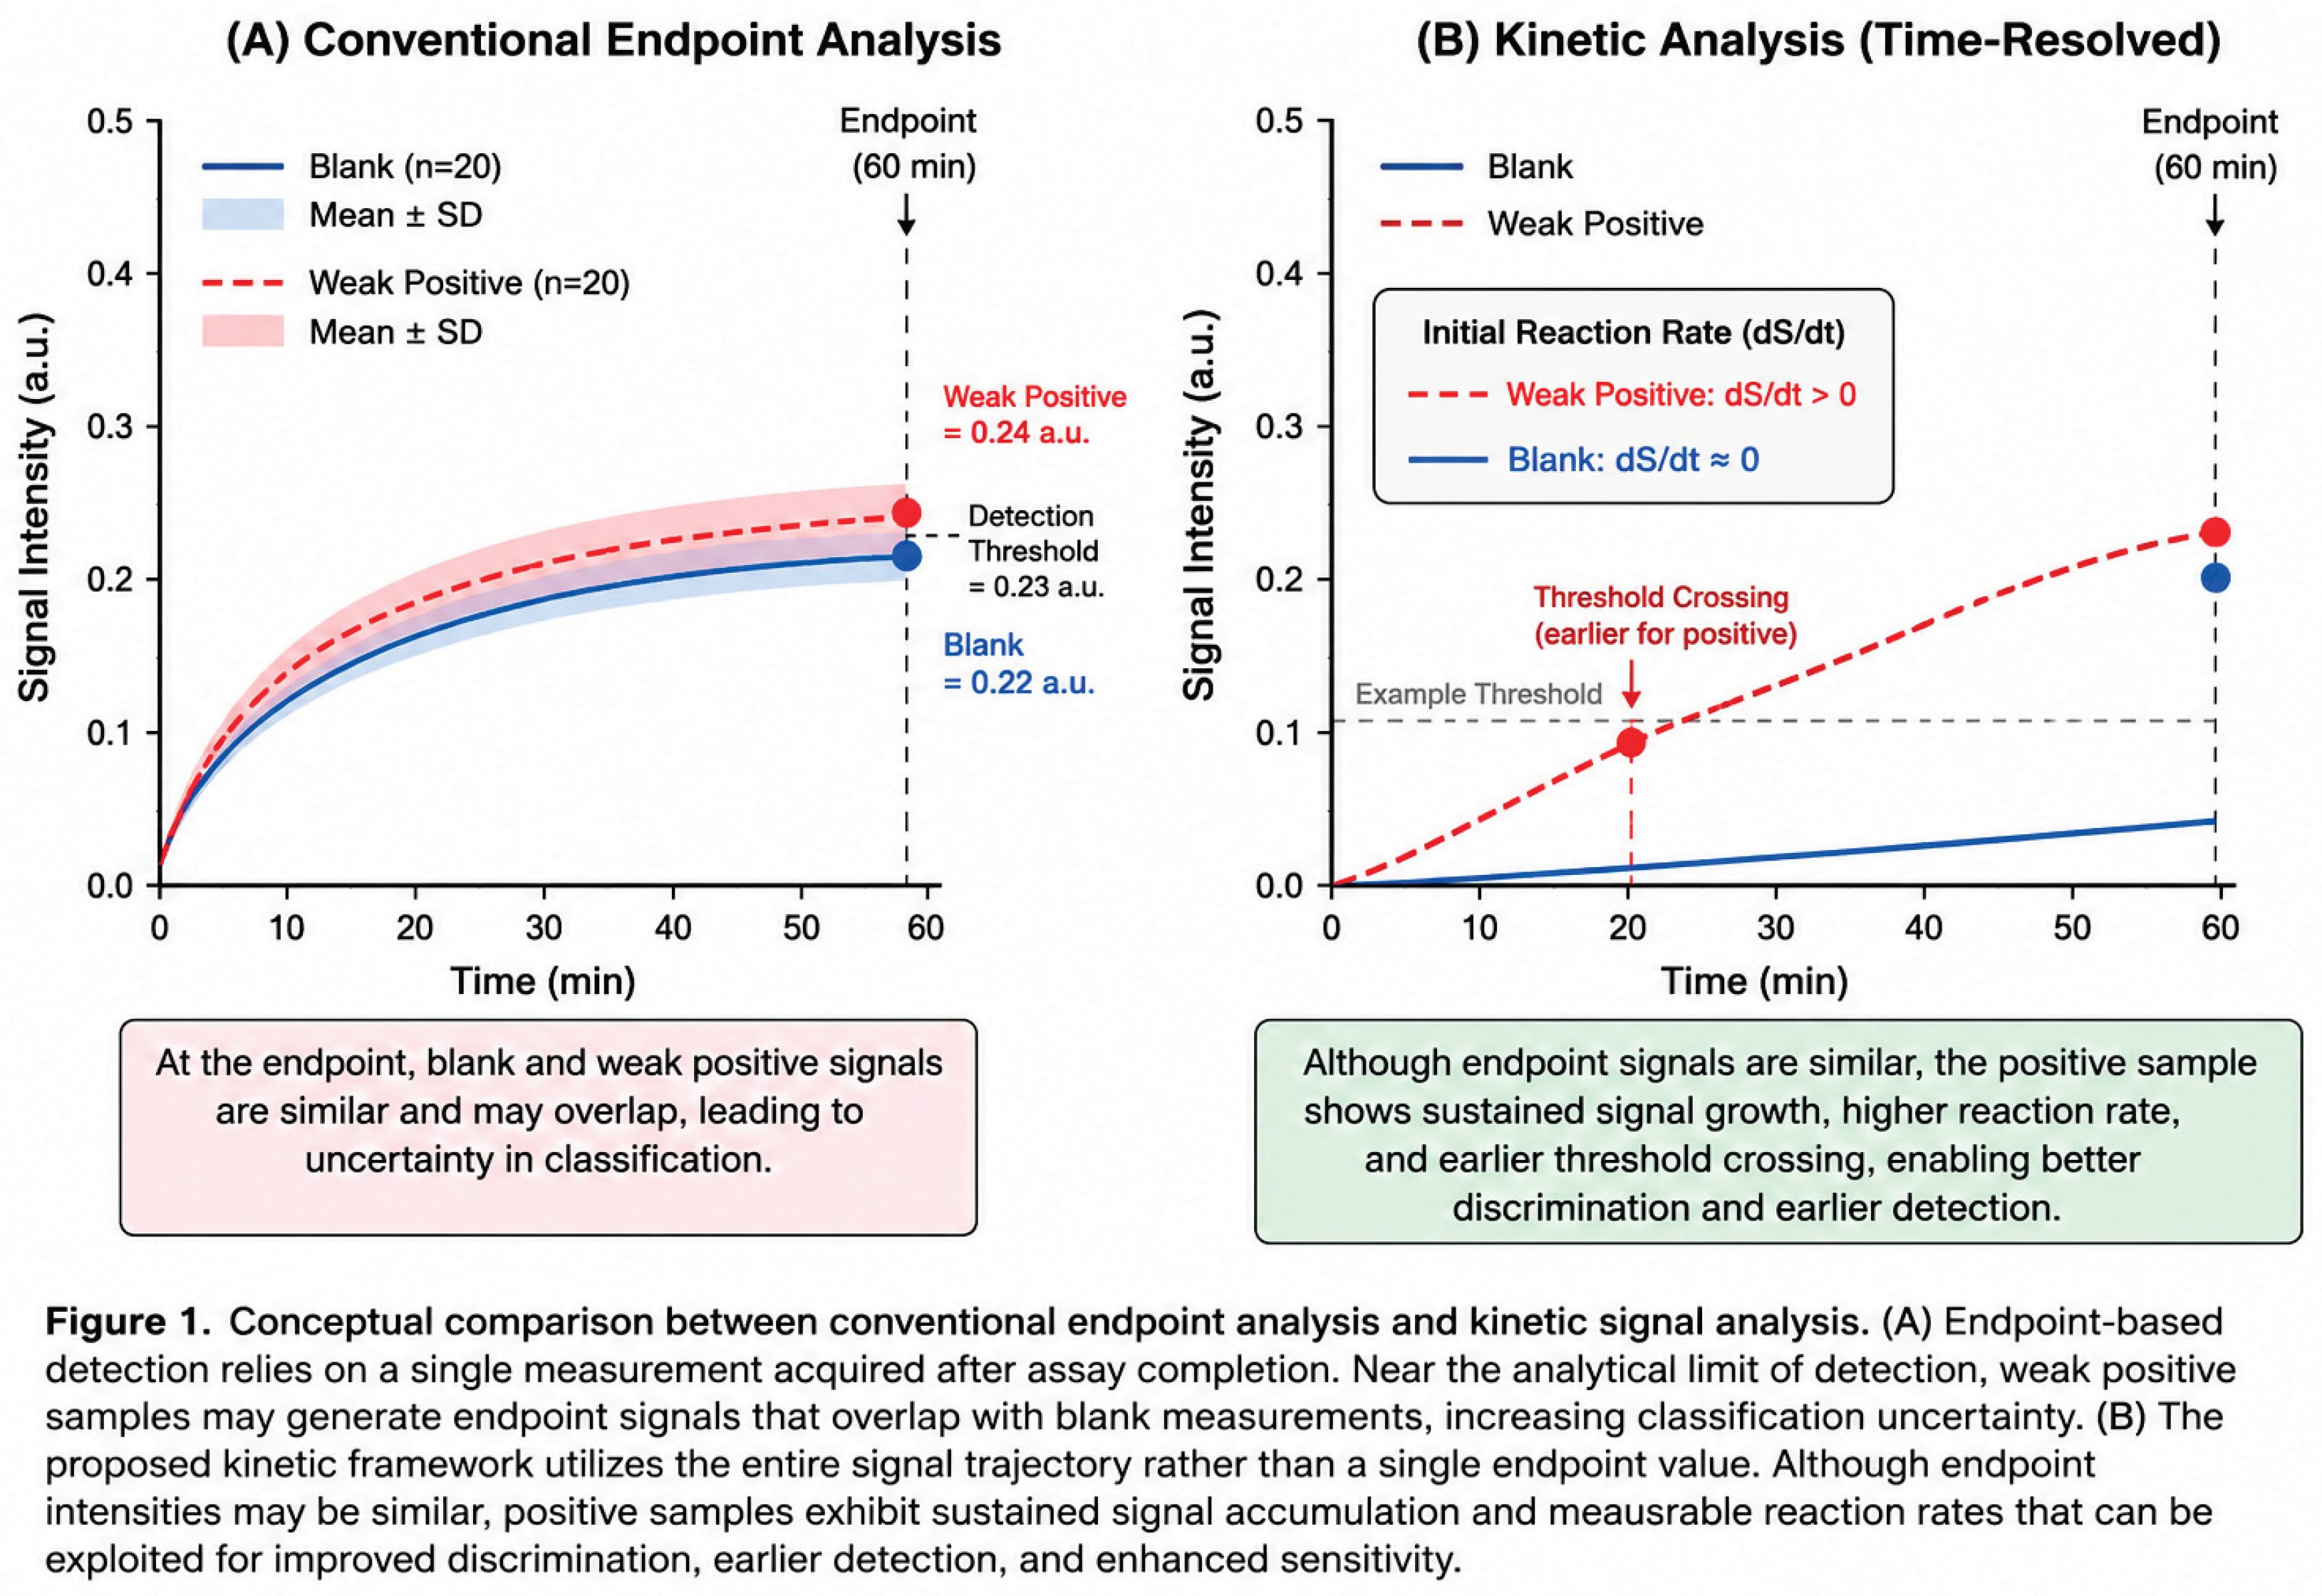
Historically, diagnostic interpretation in lateral flow and related capillary assays has relied on endpoint measurements19. In a typical workflow, the assay is allowed to develop for a predetermined duration, after which a single image or optical measurement is acquired and analyzed20. The final signal intensity is then compared against a predefined threshold to determine the presence or absence of the target analyte. While this approach is straightforward and compatible with low-cost instrumentation, it inherently discards a substantial amount of information generated throughout the assay development process21. Specifically, conventional endpoint analysis ignores the temporal evolution of signal formation, treating the assay as a static measurement rather than a dynamic physicochemical process22.
From a transport phenomena perspective, signal generation within capillary diagnostic assays is governed by a complex interplay between mass transport and reaction kinetics23. The movement of analyte molecules toward capture regions occurs through a combination of convection, diffusion, and dispersion processes, while signal formation depends on specific molecular interactions such as antigen-antibody binding, nucleic acid hybridization, or enzymatic amplification reactions. Consequently, the observed signal is not merely a function of analyte concentration but also reflects the time-dependent dynamics of transport and binding events occurring throughout assay operation24–26.
Previous studies in microfluidics and diagnostic systems have demonstrated that transport limitations frequently influence assay performance, particularly at low analyte concentrations where diffusion times become significant relative to reaction times27–29. The balance between transport and reaction processes is often characterized through dimensionless parameters such as the Peclet number and Damköhler number30,31, which provide insight into the relative importance of convective transport, diffusion, and reaction kinetics32,33. These principles have been extensively utilized in the design and optimization of lab-on-disc platforms, biosensors, and lateral flow assays. However, despite the fundamentally dynamic nature of these systems, most diagnostic readout methodologies continue to rely exclusively on endpoint signal measurements34.
Recent advances in smartphone imaging, cloud computing, machine learning, and computer vision provide an opportunity to fundamentally reconsider how diagnostic signals are interpreted. Modern smartphone cameras are capable of capturing high-resolution images and videos at negligible cost, enabling continuous monitoring of assay development over time35–37. Rather than acquiring a single endpoint image, a sequence of images can be collected throughout the assay process, generating a time-resolved record of signal evolution. This temporal dataset contains valuable information regarding signal accumulation rates, reaction dynamics, background fluctuations, and transport behavior that may not be apparent in the final endpoint measurement38,39.
The use of kinetic information has long been recognized as a powerful analytical strategy in fields such as enzyme kinetics, chemical sensing, fluorescence spectroscopy, and surface plasmon resonance40–42. In these applications, dynamic measurements often provide superior sensitivity and improved parameter estimation compared with static endpoint measurements. Analogously, kinetic analysis of capillary diagnostic assays may reveal subtle signal growth patterns that remain undetectable using traditional endpoint approaches. For example, weak positive samples may exhibit characteristic signal accumulation trajectories even when their final signal intensity remains close to the background level. Similarly, reaction rates, signal acceleration profiles, and threshold crossing times may provide more sensitive indicators of analyte presence than absolute endpoint intensity alone43,44.
Several recent studies have explored the application of artificial intelligence, image processing, and machine learning techniques to improve diagnostic interpretation. However, most existing approaches focus primarily on enhancing endpoint image classification rather than exploiting the underlying temporal dynamics of assay development. Consequently, the potential benefits of time-resolved signal analysis remain largely underutilized within the field of capillary diagnostics15,45–47.
We hypothesize that incorporating kinetic information into diagnostic interpretation can significantly improve detection performance near the limit of detection. Specifically, reaction-rate-based metrics may provide earlier and more reliable identification of weak positive samples by leveraging information contained within the signal growth trajectory. By analyzing both endpoint and kinetic features simultaneously, it may be possible to achieve improved sensitivity, enhanced quantification accuracy, and greater robustness against environmental and imaging variability.
To address this opportunity, we present a generalized kinetic image-analysis framework for capillary diagnostic assays. The proposed approach utilizes sequential image acquisition to monitor signal formation over time and extracts a comprehensive set of temporal features, including signal accumulation rate, maximum growth rate, area under the signal curve, signal-to-noise ratio evolution, threshold crossing behavior, and model-derived kinetic parameters. These features are integrated within a cloud-based image-analysis platform capable of processing time-series assay data acquired using standard imaging devices, including smartphones.
Unlike assay-specific image analysis methods, the proposed framework is designed to be broadly applicable across multiple capillary diagnostic formats, including lateral flow assays, dot-based assays, paper microfluidic devices, and centrifugal lab-on-disc systems. By combining principles from transport phenomena, reaction kinetics, computer vision, and cloud computing, the framework establishes a foundation for next-generation intelligent diagnostic systems capable of extracting substantially more information from existing assay formats without requiring significant modifications to assay chemistry or hardware.
The objective of this study is therefore to develop and evaluate a time-resolved image-analysis methodology for improving diagnostic sensitivity and quantification in capillary-driven assays. Through the integration of kinetic signal extraction and cloud-based computational analysis, this work seeks to establish a new paradigm for diagnostic interpretation that moves beyond traditional endpoint measurements and fully exploits the dynamic information inherently generated during assay operation.
2. Theoretical Background
2.1. Signal Generation in Capillary Diagnostic Assays
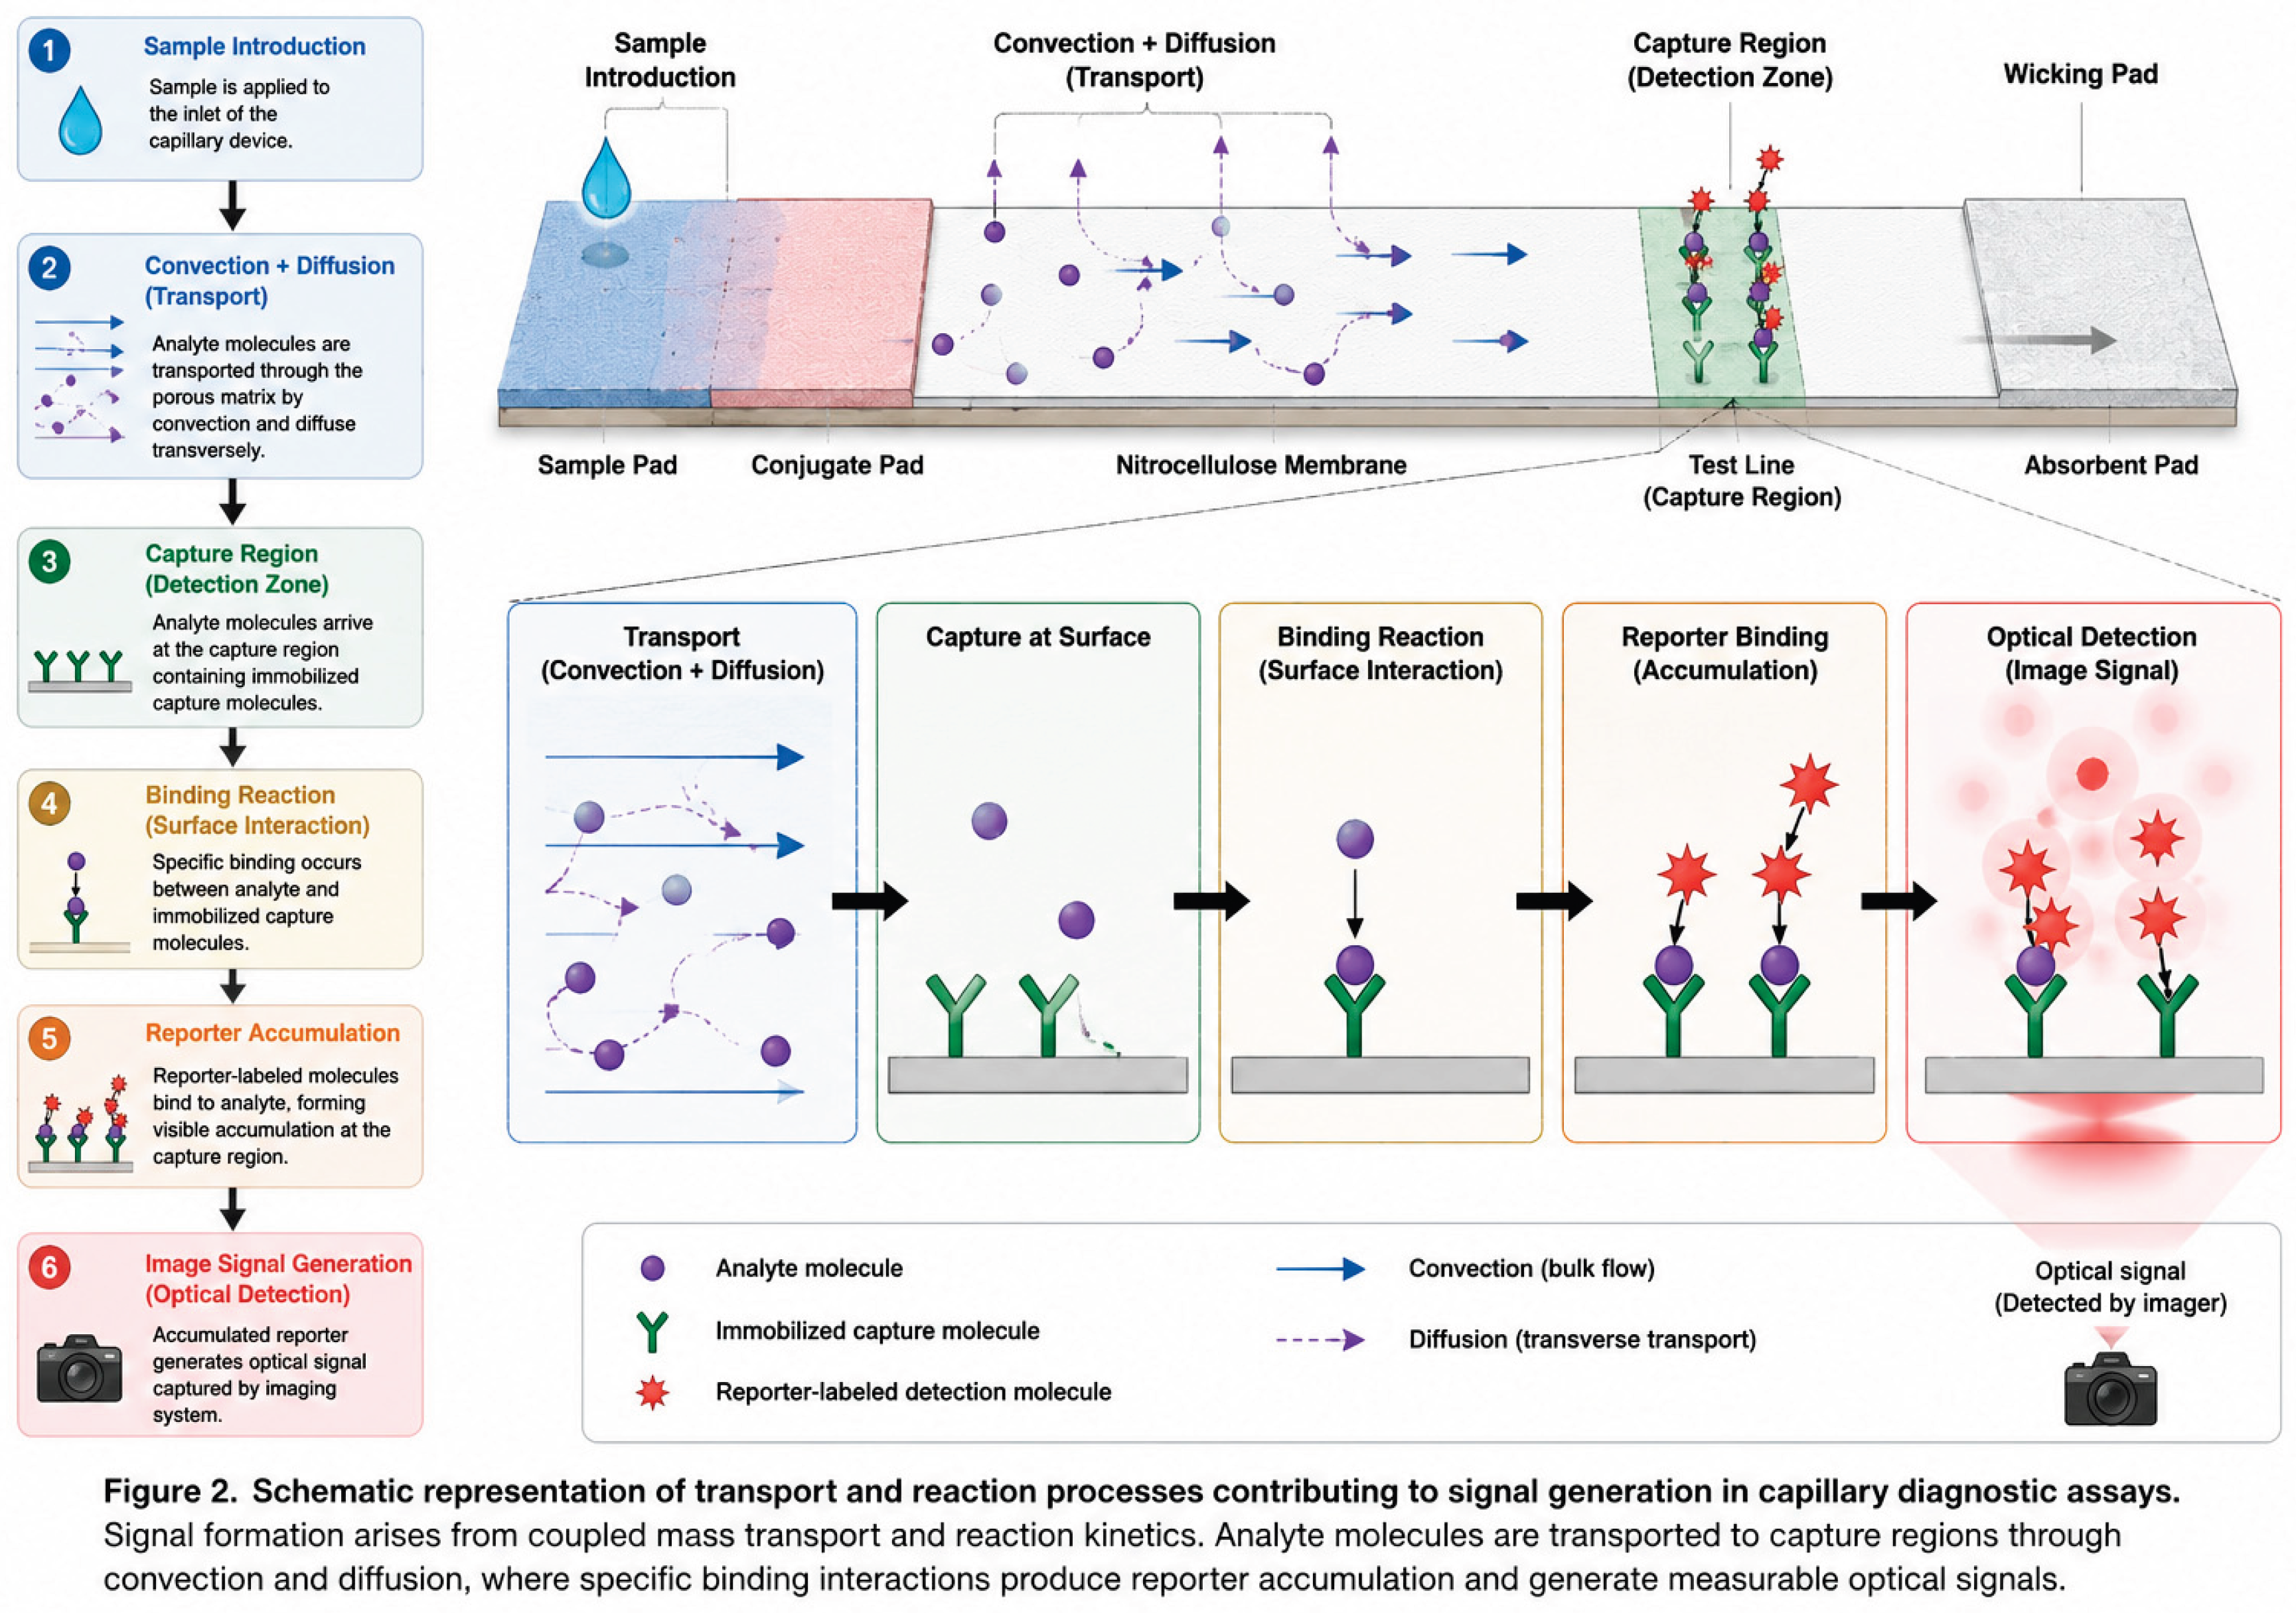
Signal formation in capillary-driven diagnostic systems is the result of a sequence of coupled physical and biochemical processes. Following sample introduction, target analytes are transported toward a capture region through a combination of convection, diffusion, and dispersion. Upon reaching the capture surface, analytes participate in specific molecular interactions, such as antigen-antibody binding, nucleic acid hybridization, or receptor-ligand recognition. The accumulation of reporter molecules at the capture zone subsequently generates an observable optical signal.
Consequently, the measured signal is not solely determined by analyte concentration but instead reflects the integrated effects of transport phenomena, reaction kinetics, assay geometry, surface chemistry, and imaging conditions.
The observed signal may therefore be represented as
-(1)
where
- is analyte concentration,
- is molecular diffusivity,
- is characteristic transport velocity,
- is the association rate constant,
- is the dissociation rate constant,
- represents available capture sites,
- is time.
This relationship highlights that signal formation is inherently dynamic and governed by both transport and reaction processes.
2.2. Transport-Limited and Reaction-Limited Signal Development
The performance of capillary diagnostic systems is frequently influenced by the relative rates of analyte transport and surface binding reactions. Depending on operating conditions, signal formation may occur in either transport-limited or reaction-limited regimes.
In a transport-limited system, analyte molecules are consumed rapidly upon reaching the capture surface. Consequently, overall signal growth is constrained by the rate at which analytes can be delivered to the reaction zone.
Conversely, in a reaction-limited system, analytes are delivered to the capture region faster than they can bind, causing reaction kinetics to dominate overall assay behavior.
The balance between these processes is often characterized through the Damköhler number:
-(2)
For , reaction kinetics dominate, and for transport limitations dominate.
Previous studies have demonstrated that assay sensitivity, signal accumulation, and overall detection performance are strongly influenced by the operating Damköhler regime. Importantly, near the limit of detection, transport limitations frequently become increasingly significant because fewer analyte molecules are available to generate measurable signal.
2.3. Optical Signal Formation
The optical signal observed in a diagnostic assay is generated through the accumulation of reporter species such as gold nanoparticles, latex beads, fluorescent labels, enzymes, or chemiluminescent products.
For image-based measurements, the detected signal intensity can be expressed as
-(3)
where
- represents true assay signal,
- represents optical background contributions,
- represents detector and environmental noise.
After background correction,
-(4)
yielding the corrected assay signal.
For line-based and dot-based assays, the measured signal may be quantified through average pixel intensity, integrated intensity, optical density, fluorescence intensity, photon counts, or signal-to-background ratios.
2.4. Kinetic Model of Signal Accumulation
The accumulation of signal within many diagnostic assays can be approximated using a first-order growth model:
-(5)
where
- is the maximum attainable signal,
- is the apparent kinetic rate constant,
- is the baseline background signal.
The corresponding signal growth rate is
-(6)
At early times,
-(7)
and therefore
-(8)
indicating that the initial signal accumulation rate is directly related to both reaction kinetics and analyte concentration.
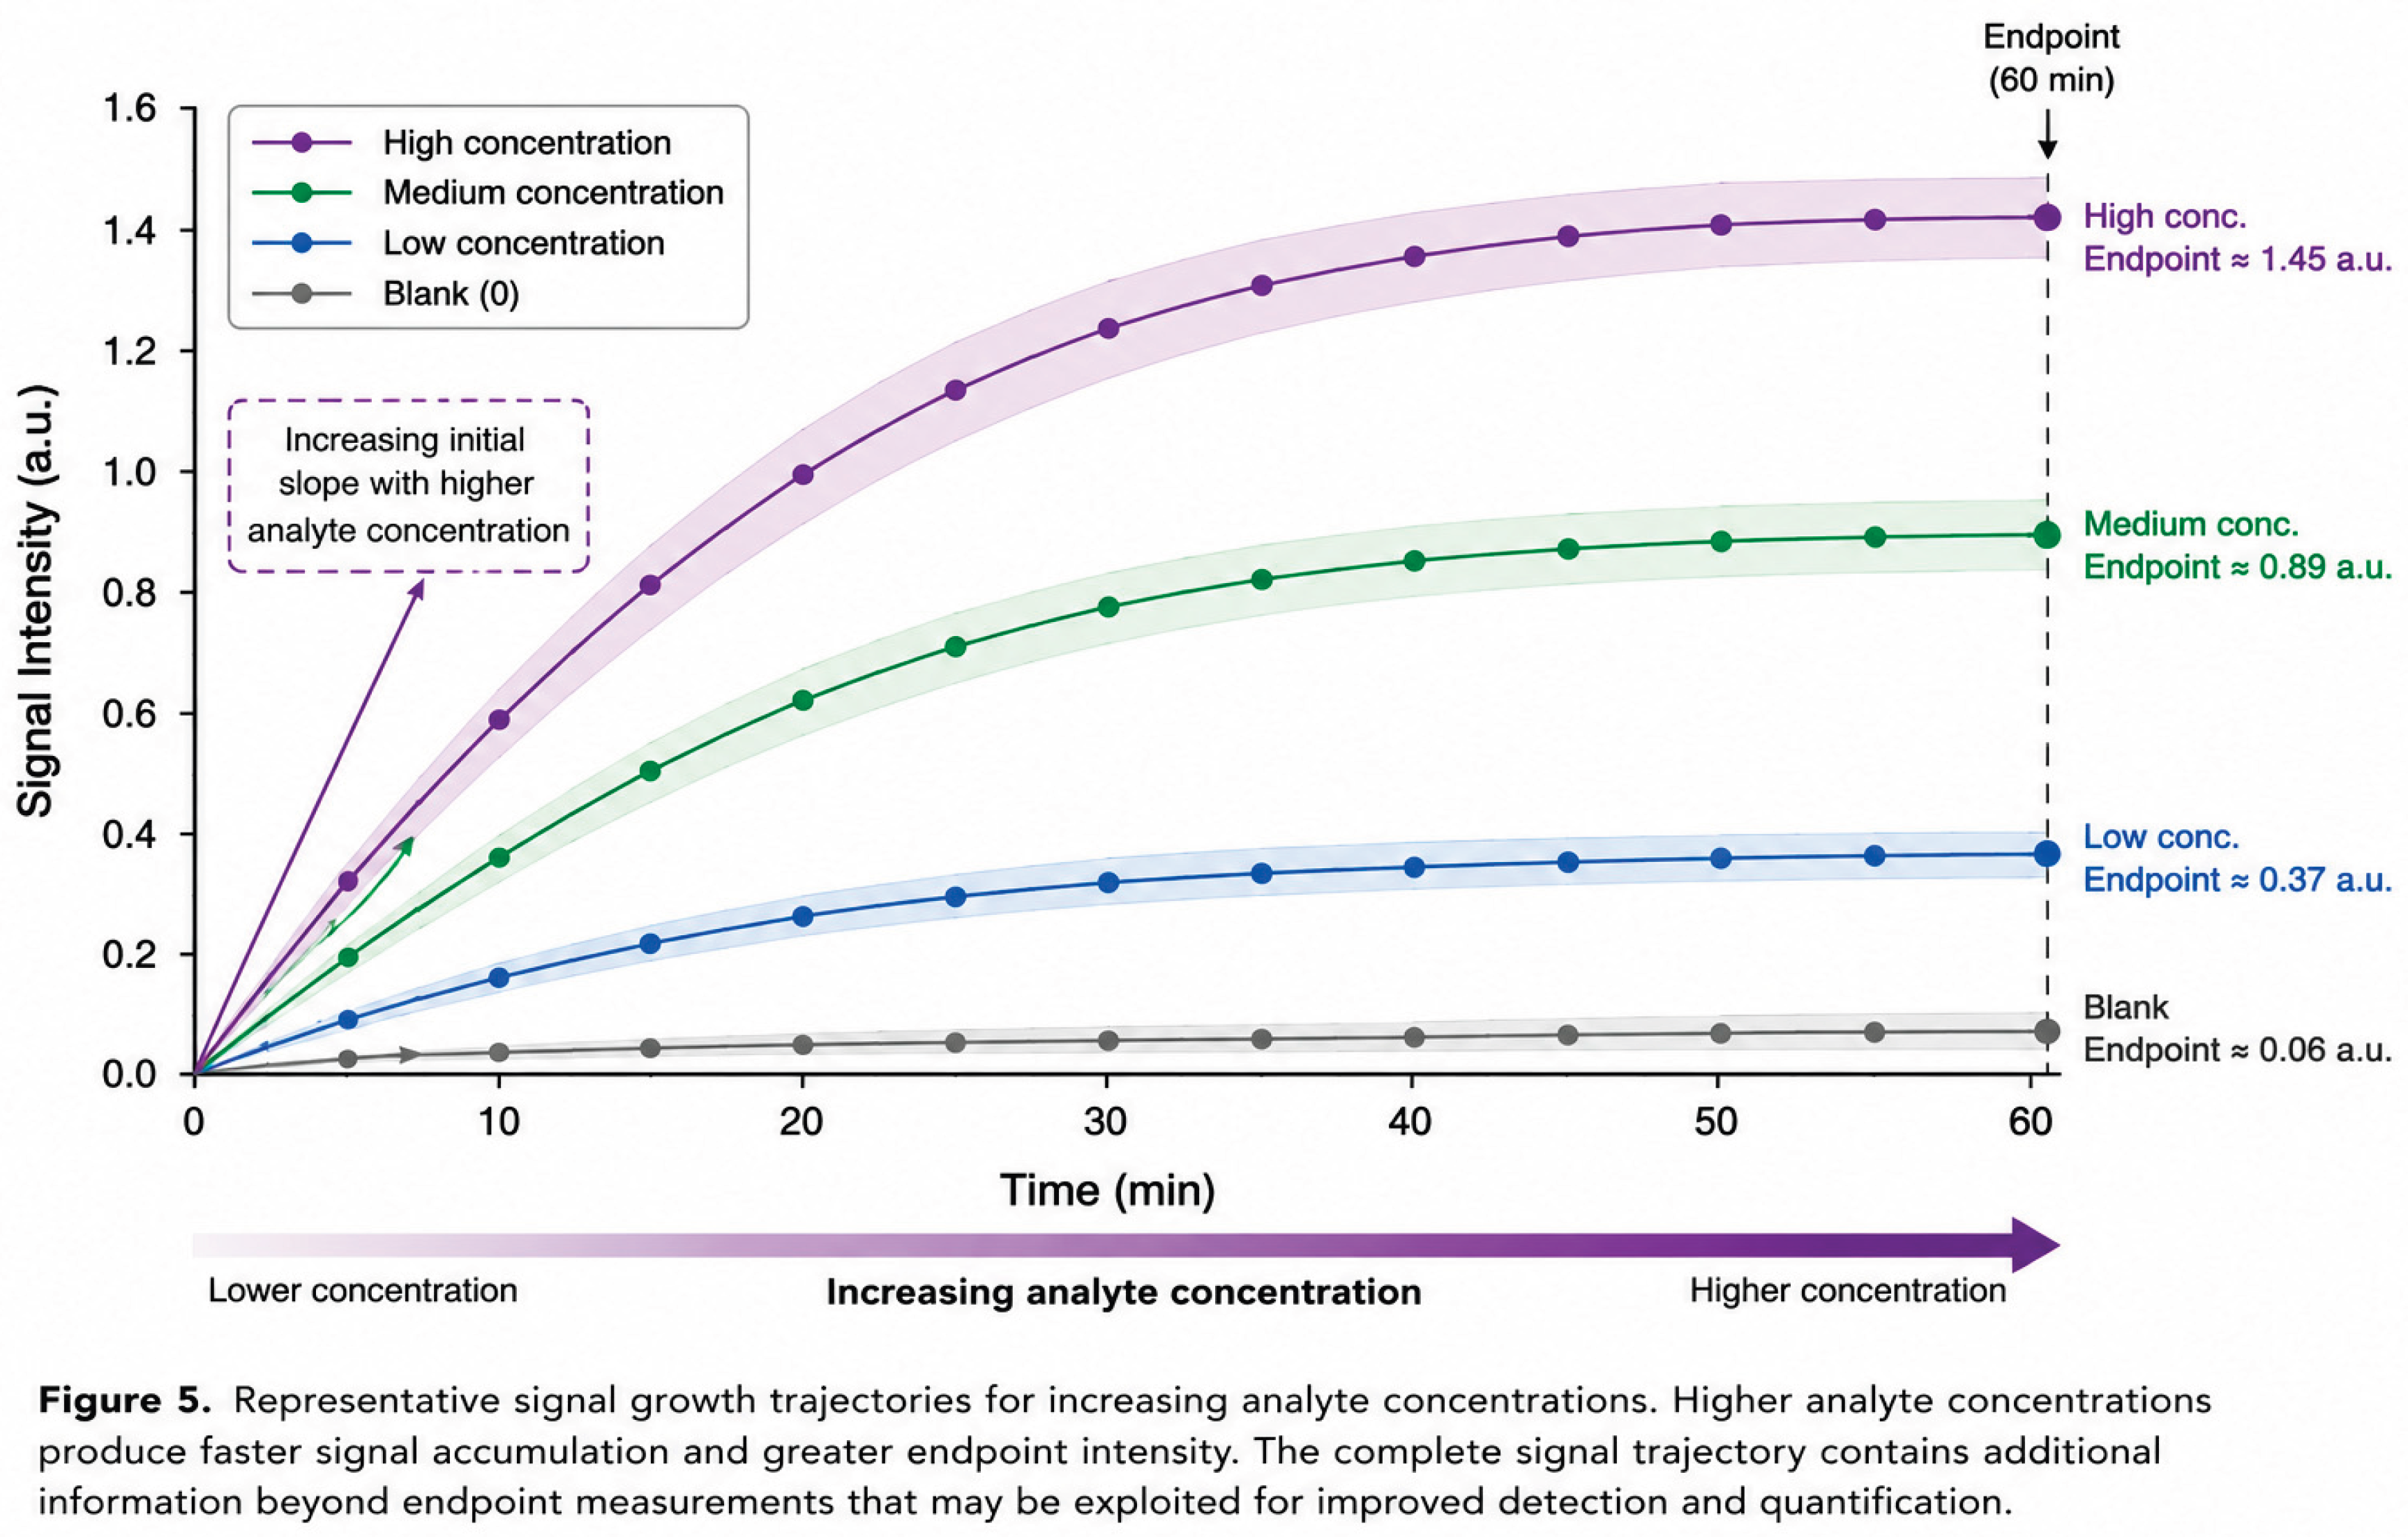
Unlike endpoint intensity, which becomes increasingly insensitive as signal approaches saturation, the initial growth rate retains information regarding the underlying binding dynamics.
2.5. Endpoint Versus Kinetic Detection
Traditional diagnostic interpretation relies on a single endpoint measurement acquired after assay completion.
A positive result is typically determined through:
-(9)
where (T) is a predefined detection threshold.
While simple to implement, endpoint analysis ignores the trajectory through which the signal evolved.
Two assays may produce similar endpoint intensities while exhibiting substantially different kinetic behaviors. Likewise, weak positive samples may exhibit characteristic signal growth patterns even when their final signal remains near the detection threshold.
This observation motivates the use of time-resolved analysis, in which the complete signal trajectory S(t) is utilized rather than a single endpoint value.
2.6. Kinetic Features for Low-Concentration Detection
Several kinetic metrics may provide greater sensitivity than endpoint intensity alone.
Initial Signal Growth Rate
-(10)
captures early reaction dynamics before saturation effects become significant.
Maximum Signal Growth Rate
-(11)
quantifies the fastest period of signal accumulation.
Area Under the Curve
-(12)
captures cumulative assay response.
Time-to-Threshold represents the time required for signal to exceed a predefined threshold level.
Signal-to-Noise Ratio
-(13)
provides a normalized measure of signal quality throughout assay development.
Collectively, these features exploit information contained within the entire reaction trajectory rather than relying solely on endpoint measurements.
2.7. Kinetic Limit of Detection
The conventional limit of detection is commonly defined as
-(14)
where
- is the mean blank signal,
- is the standard deviation of blank measurements.
Within the proposed framework, analogous kinetic detection thresholds may be defined using reaction-rate metrics:
-(15)
Or
-(16)
These formulations provide a mechanism for evaluating whether time-resolved measurements can achieve lower effective detection limits than conventional endpoint analysis.
The central hypothesis of this work is that kinetic descriptors extracted from image sequences contain diagnostically relevant information that becomes particularly valuable near the limit of detection, where endpoint signal differences are often obscured by background noise and measurement variability.
3. Kinetic Image Analysis Framework
3.1. Overview of the Computational Framework
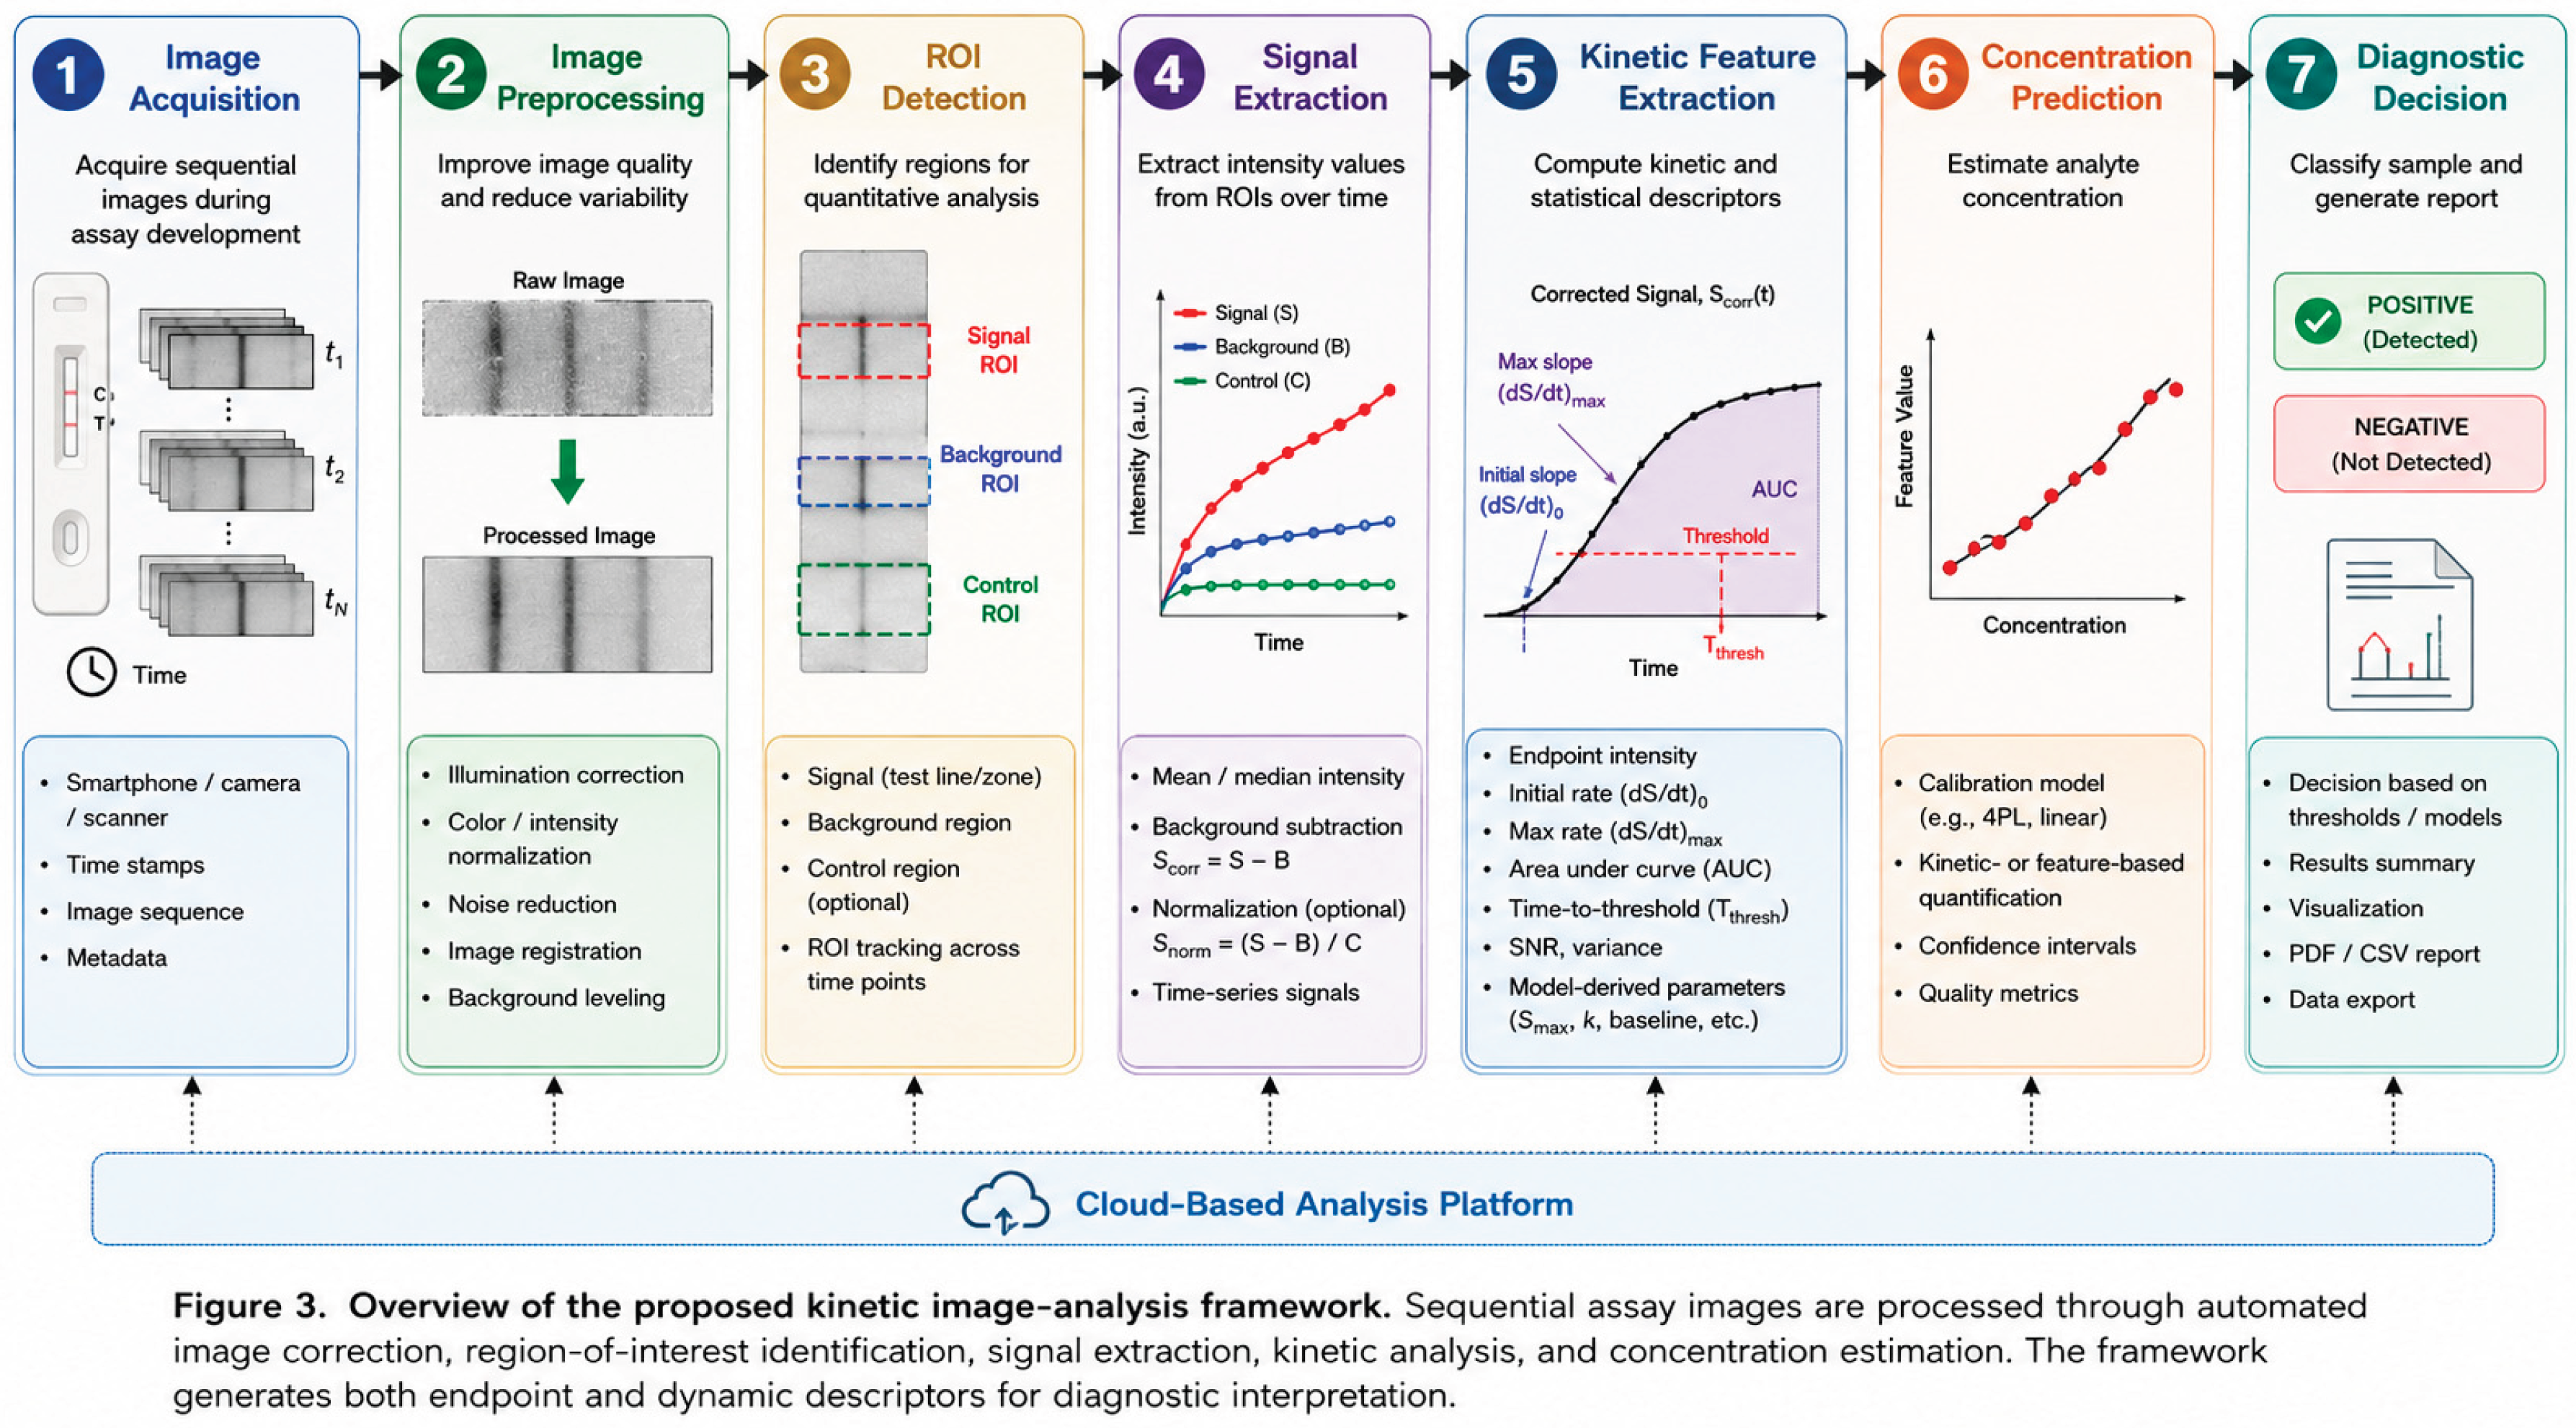
The proposed kinetic image-analysis framework transforms a sequence of assay images into quantitative kinetic descriptors that can be used for analyte detection, concentration estimation, and limit-of-detection analysis. Unlike conventional endpoint-based approaches that rely on a single image acquired after assay completion, the proposed methodology utilizes the complete temporal evolution of signal formation.
The framework consists of six primary stages:
- Time-series image acquisition
- Image preprocessing and normalization
- Region-of-interest (ROI) identification
- Signal extraction and background correction
- Kinetic feature extraction
- Detection and concentration prediction
A schematic representation of the workflow is shown in Figure X.
Image Sequence → Preprocessing → ROI Identification → Signal Extraction → Kinetic Analysis → Detection Decision
The framework is designed to operate on both laboratory-generated image datasets and smartphone-acquired images, enabling deployment across research, clinical, and point-of-care environments.
3.2. Image Acquisition
Images are acquired at predefined intervals throughout assay development using a smartphone camera, digital microscope, laboratory imaging system, or dedicated optical reader. The acquisition interval may vary depending on assay kinetics and can range from sub-second sampling for rapid reactions to several minutes for slower assay formats.
Each image is associated with a timestamp corresponding to elapsed assay development time.
For a dataset containing N images: I = , , , …,
the corresponding acquisition times are, T = , , , …, , where < < < …<
The resulting dataset represents a time-resolved record of assay development and forms the basis for subsequent kinetic analysis.
The framework supports multiple assay geometries including:
- Lateral flow assay test lines
- Dot-based immunoassays
- Circular detection zones
- Fluorescent microfluidic assays
- Lab-on-disc reaction chambers
- Colorimetric capillary sensors
3.3. Image Preprocessing
Prior to signal extraction, images undergo preprocessing to minimize variability introduced by illumination, camera settings, optical artifacts, and environmental conditions.
Typical preprocessing steps include:
Illumination Correction
Spatial variations in lighting are corrected using background normalization methods.
Color Space Conversion
Depending on the assay chemistry, images may be analyzed using:
- RGB channels
- Grayscale intensity
- HSV color space
- LAB color space
For colorimetric assays, channel selection can significantly influence sensitivity and may be optimized experimentally.
Image Registration
Small positional shifts occurring during image acquisition are corrected through image alignment algorithms to ensure consistent ROI tracking throughout the time series.
Noise Reduction
Gaussian filtering, median filtering, or adaptive denoising methods may be applied to reduce high-frequency imaging noise while preserving signal integrity.
Following preprocessing, all images are transformed into a standardized format suitable for quantitative analysis.
3.4. Region of Interest Identification
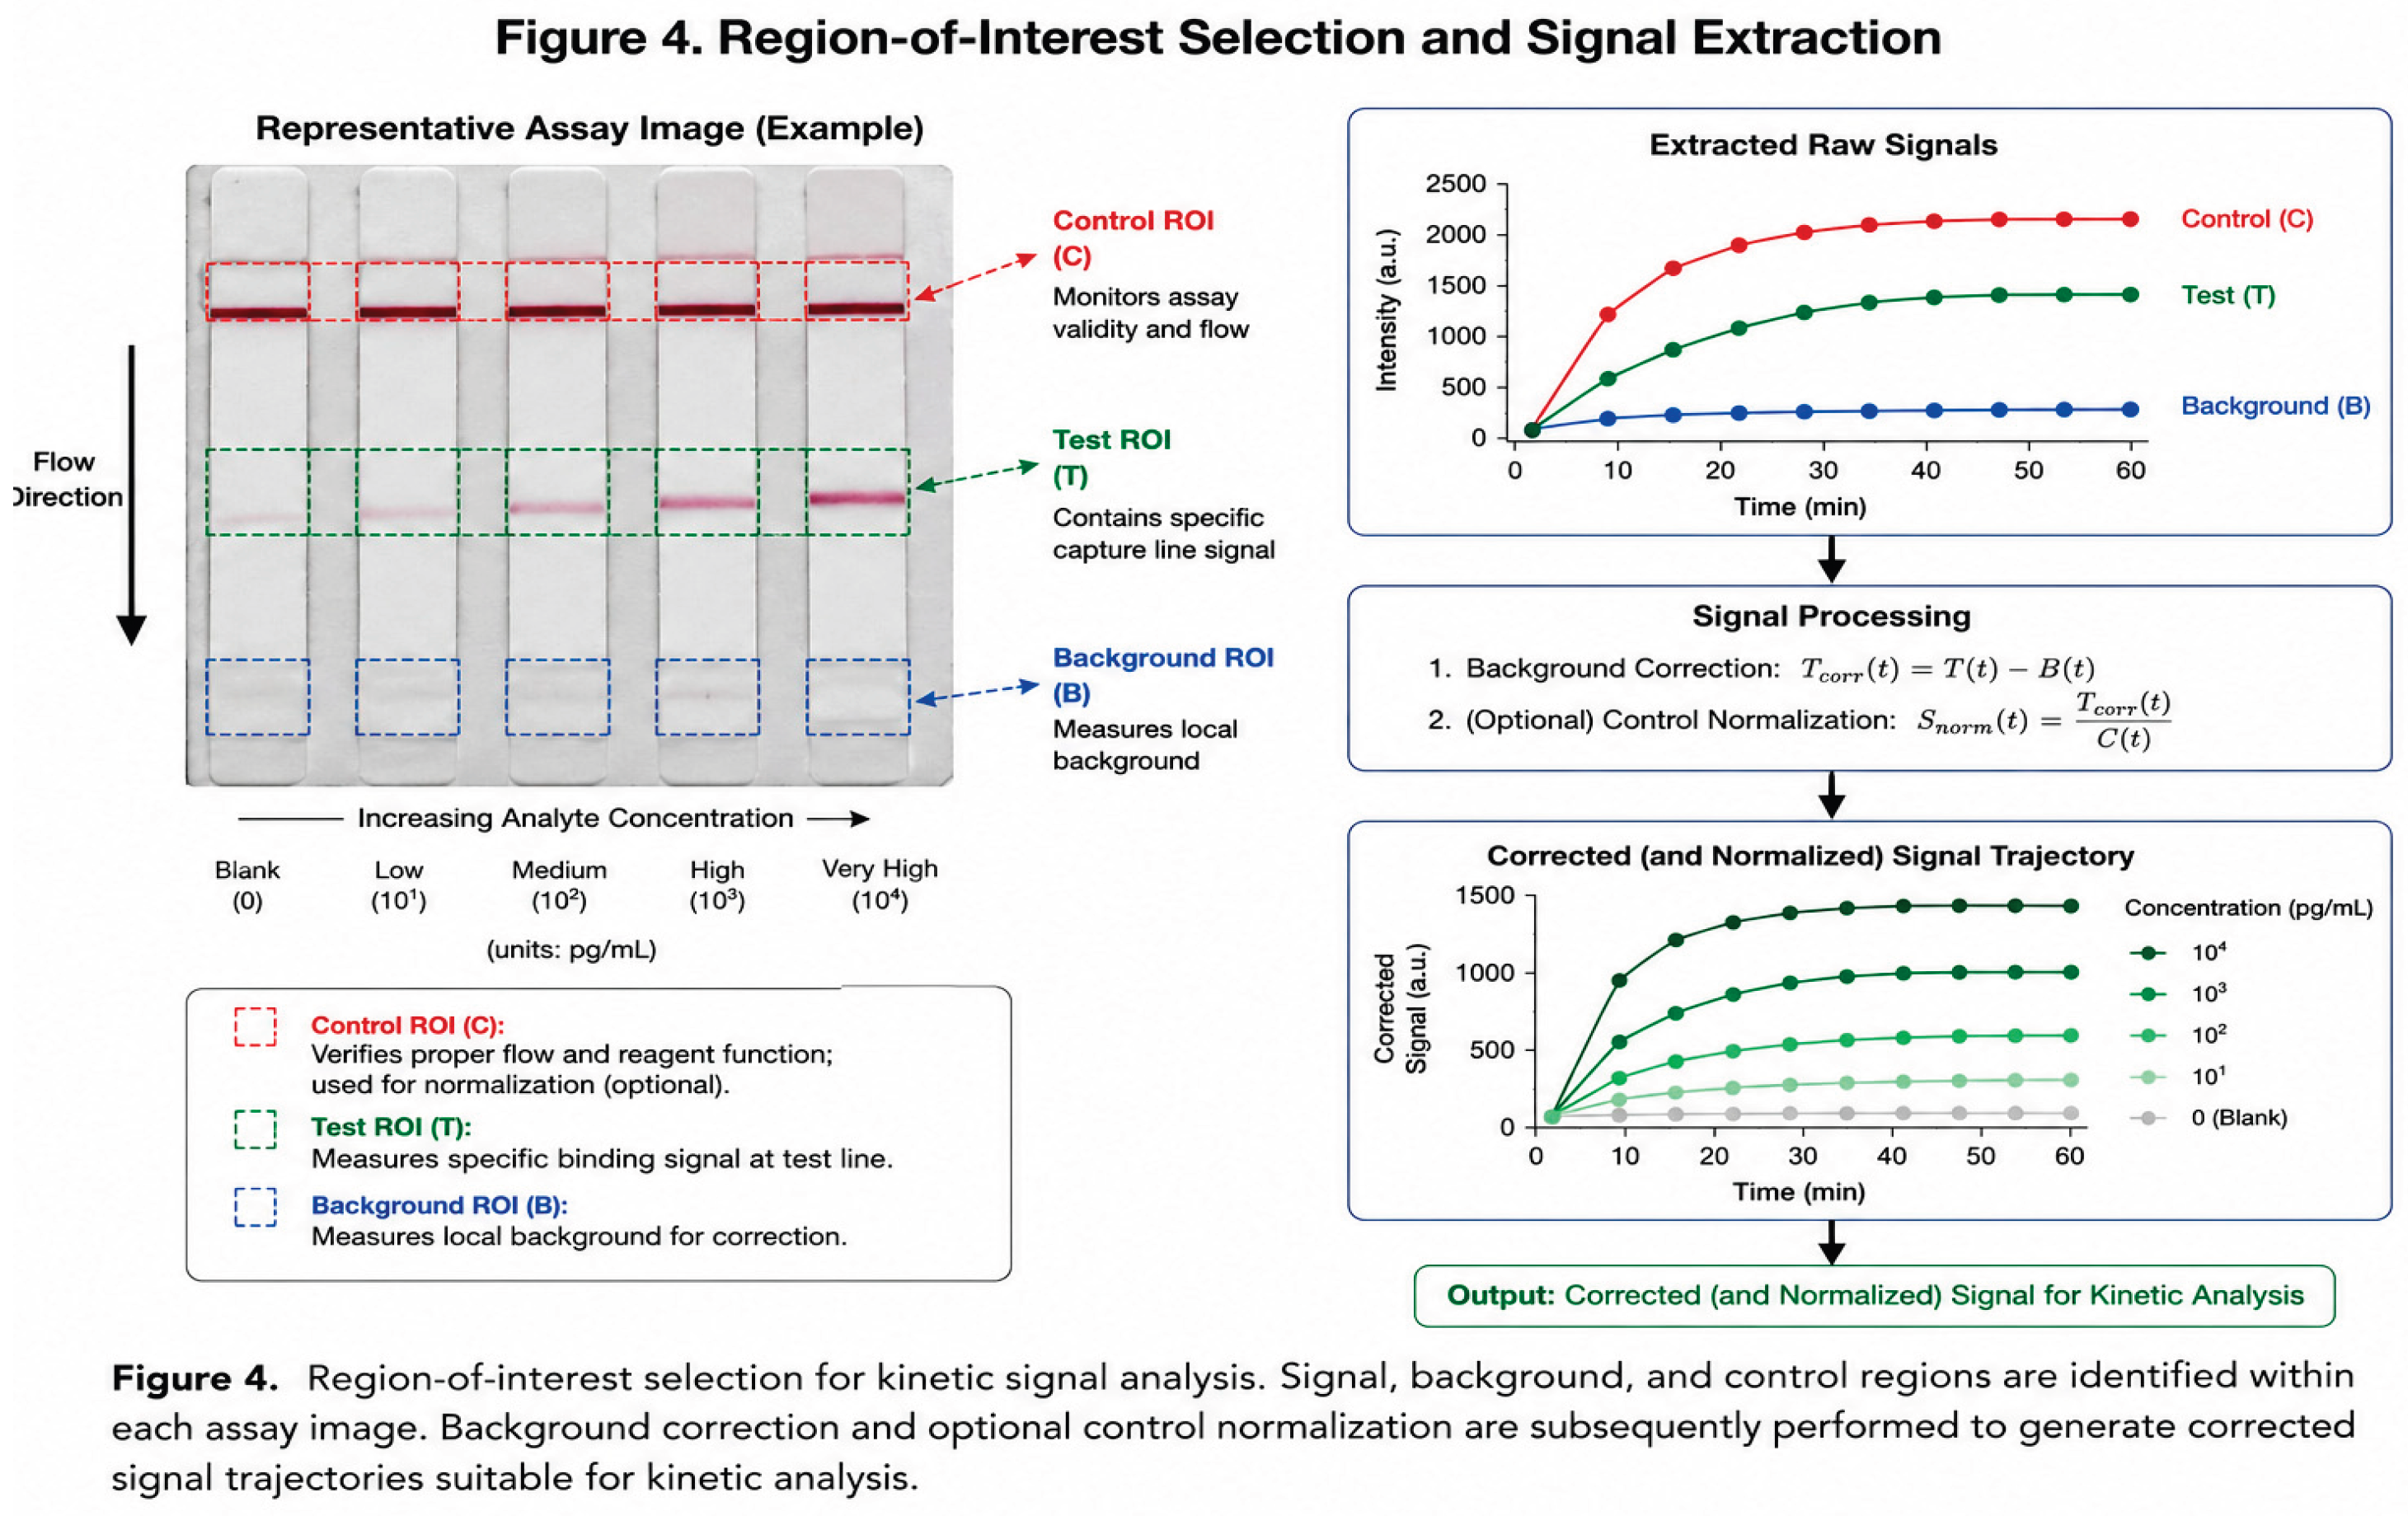
Quantitative analysis requires identification of regions containing assay signal and corresponding background measurements.
Three primary regions are defined:
Signal Region
The signal ROI encompasses the assay feature of interest, such as:
- Test line
- Detection dot
- Reaction chamber
- Fluorescent zone
Background Region
The background ROI is selected adjacent to the signal region and is used to estimate local background intensity.
Control Region
When available, a control ROI is defined to provide internal normalization and compensate for assay-to-assay variability.
ROI selection may be performed manually by the user or automatically through computer vision algorithms.
Once selected, ROI coordinates are propagated across all images in the time series.
For a signal ROI containing M pixels, the average signal intensity is
-(17)
where represents pixel intensity.
Similarly,
And
are calculated for their respective regions.
3.5. Signal Extraction and Background Correction
Raw image intensity measurements contain contributions from assay signal, optical background, and imaging noise.
The corrected signal is calculated as
-(18)
which removes local background contributions and improves robustness to illumination variation.
When a control region is available, normalized signal intensity may be calculated as
-(19)
Normalization reduces variability arising from camera exposure, reagent loading differences, and assay manufacturing tolerances.
The resulting signal trajectory forms the basis for kinetic analysis.
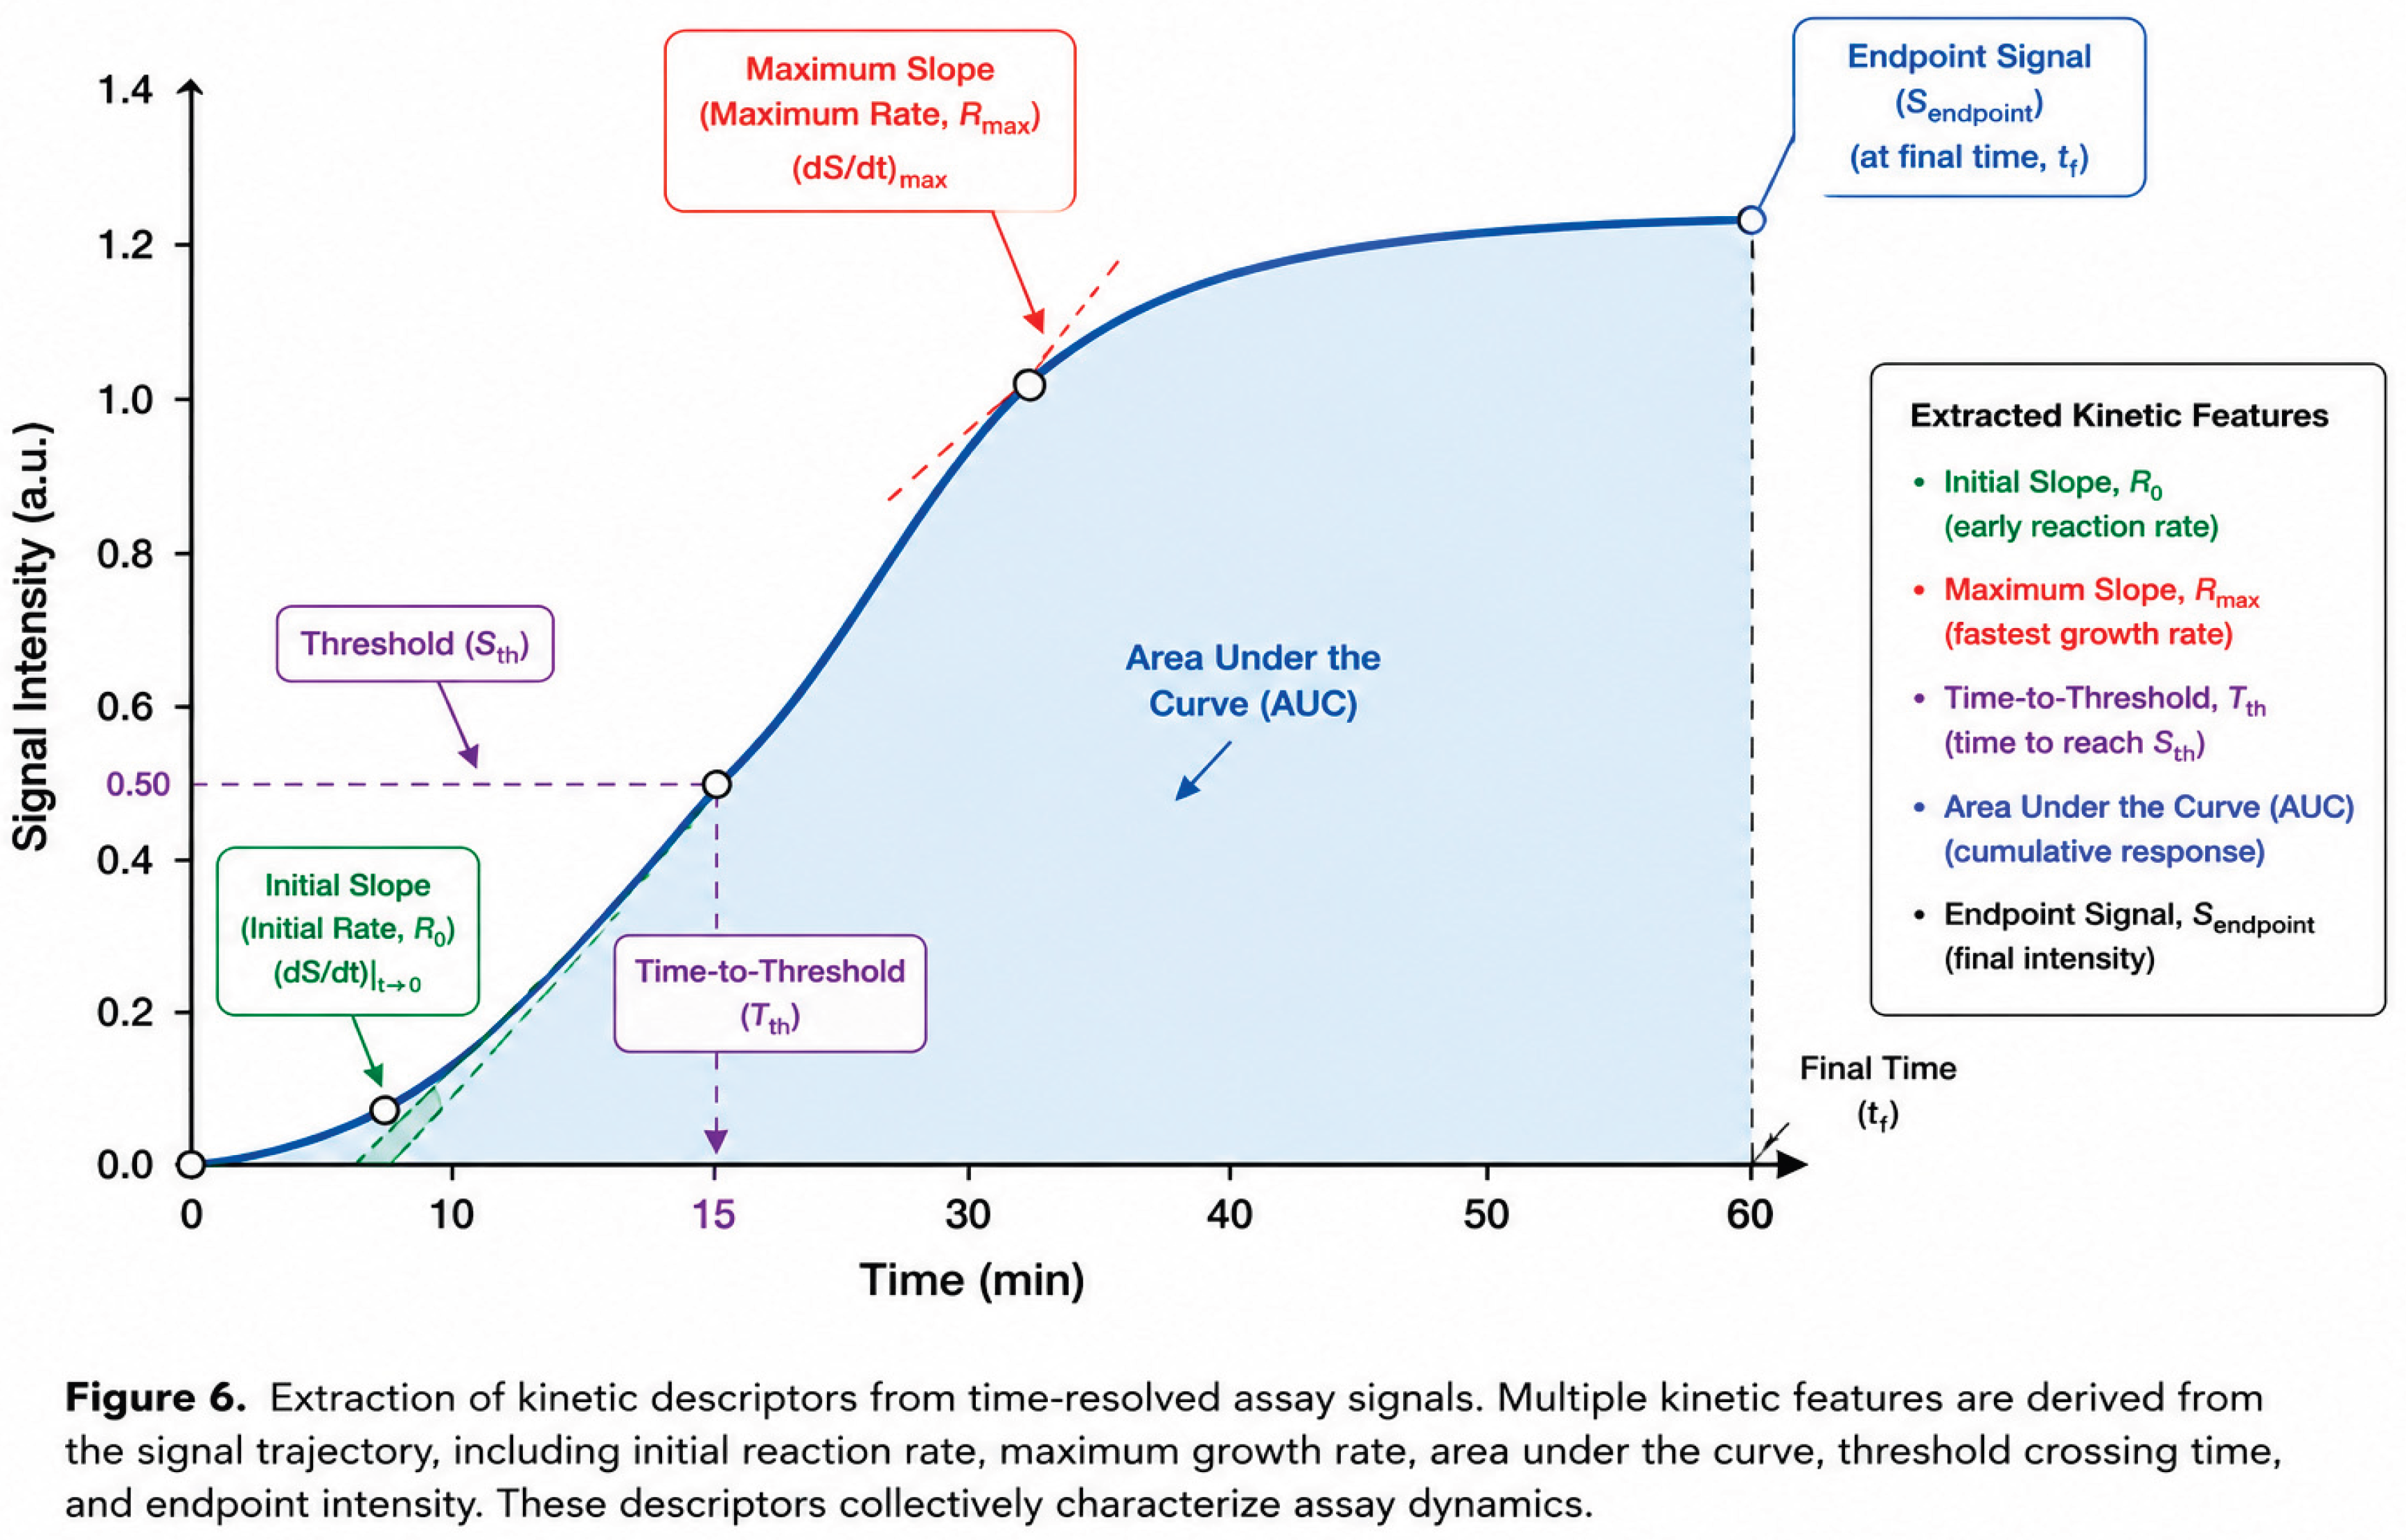
3.6. Temporal Feature Extraction
A distinguishing feature of the proposed framework is the extraction of quantitative descriptors from the complete signal trajectory rather than a single endpoint measurement.
Endpoint Intensity
The endpoint signal is defined as
and represents the conventional metric used in most diagnostic systems.
Initial Reaction Rate
Early-stage signal growth is quantified using linear regression over the first portion of the signal trajectory.
-(20)
The initial reaction rate provides information regarding analyte concentration before saturation effects occur.
Maximum Signal Growth Rate
The maximum observed derivative is calculated as
-(21)
This metric captures the period of fastest signal accumulation.
Area Under the Curve
The cumulative assay response is quantified through
-(22)
which incorporates information from the entire measurement period.
Time-to-Threshold
The threshold crossing time is defined as where S( =
Higher analyte concentrations typically result in shorter threshold crossing times.
Signal-to-Noise Ratio
The instantaneous signal-to-noise ratio is
-(23)
where represents background intensity variability.
The maximum and endpoint SNR values are also recorded.
Dynamic Signal Metrics
Additional descriptors include:
- Signal acceleration
- Signal curvature
- Signal variance
- Growth half-time
- Time to peak derivative
These features may provide additional discriminatory power for weak positive samples.
3.7. Model-Derived Kinetic Parameters
To characterize underlying reaction dynamics, nonlinear regression is performed using a first-order growth model:
-(24)
where:
- is the asymptotic maximum signal,
- k is the apparent kinetic constant,
- B is baseline signal intensity.
Model fitting yields:
Maximum Signal representing the theoretical saturation signal.
Kinetic Rate Constant k which characterizes the speed of signal development.
Baseline Signal B representing residual background intensity.
Initial Fitted Rate
-(25)
which estimates the theoretical reaction rate at the onset of signal development.
Goodness-of-Fit
Model quality is evaluated using:
- Coefficient of determination ((R^2))
- Root mean square error (RMSE)
- Akaike information criterion (AIC)
These metrics assess the suitability of the kinetic model for a given assay dataset.
3.8. Feature Integration for Detection and Quantification
The extracted endpoint, kinetic, and model-derived parameters are combined into a multidimensional feature set:
This feature vector may be used for:
- Binary classification (positive/negative)
- Borderline result identification
- Concentration estimation
- Limit-of-detection analysis
- Machine-learning model development
By incorporating temporal information into the detection process, the framework captures signal characteristics that are inaccessible to traditional endpoint-only analysis and provides a foundation for enhanced sensitivity in capillary diagnostic systems.
4. Cloud-Based Analysis Platform
4.1. Platform Overview
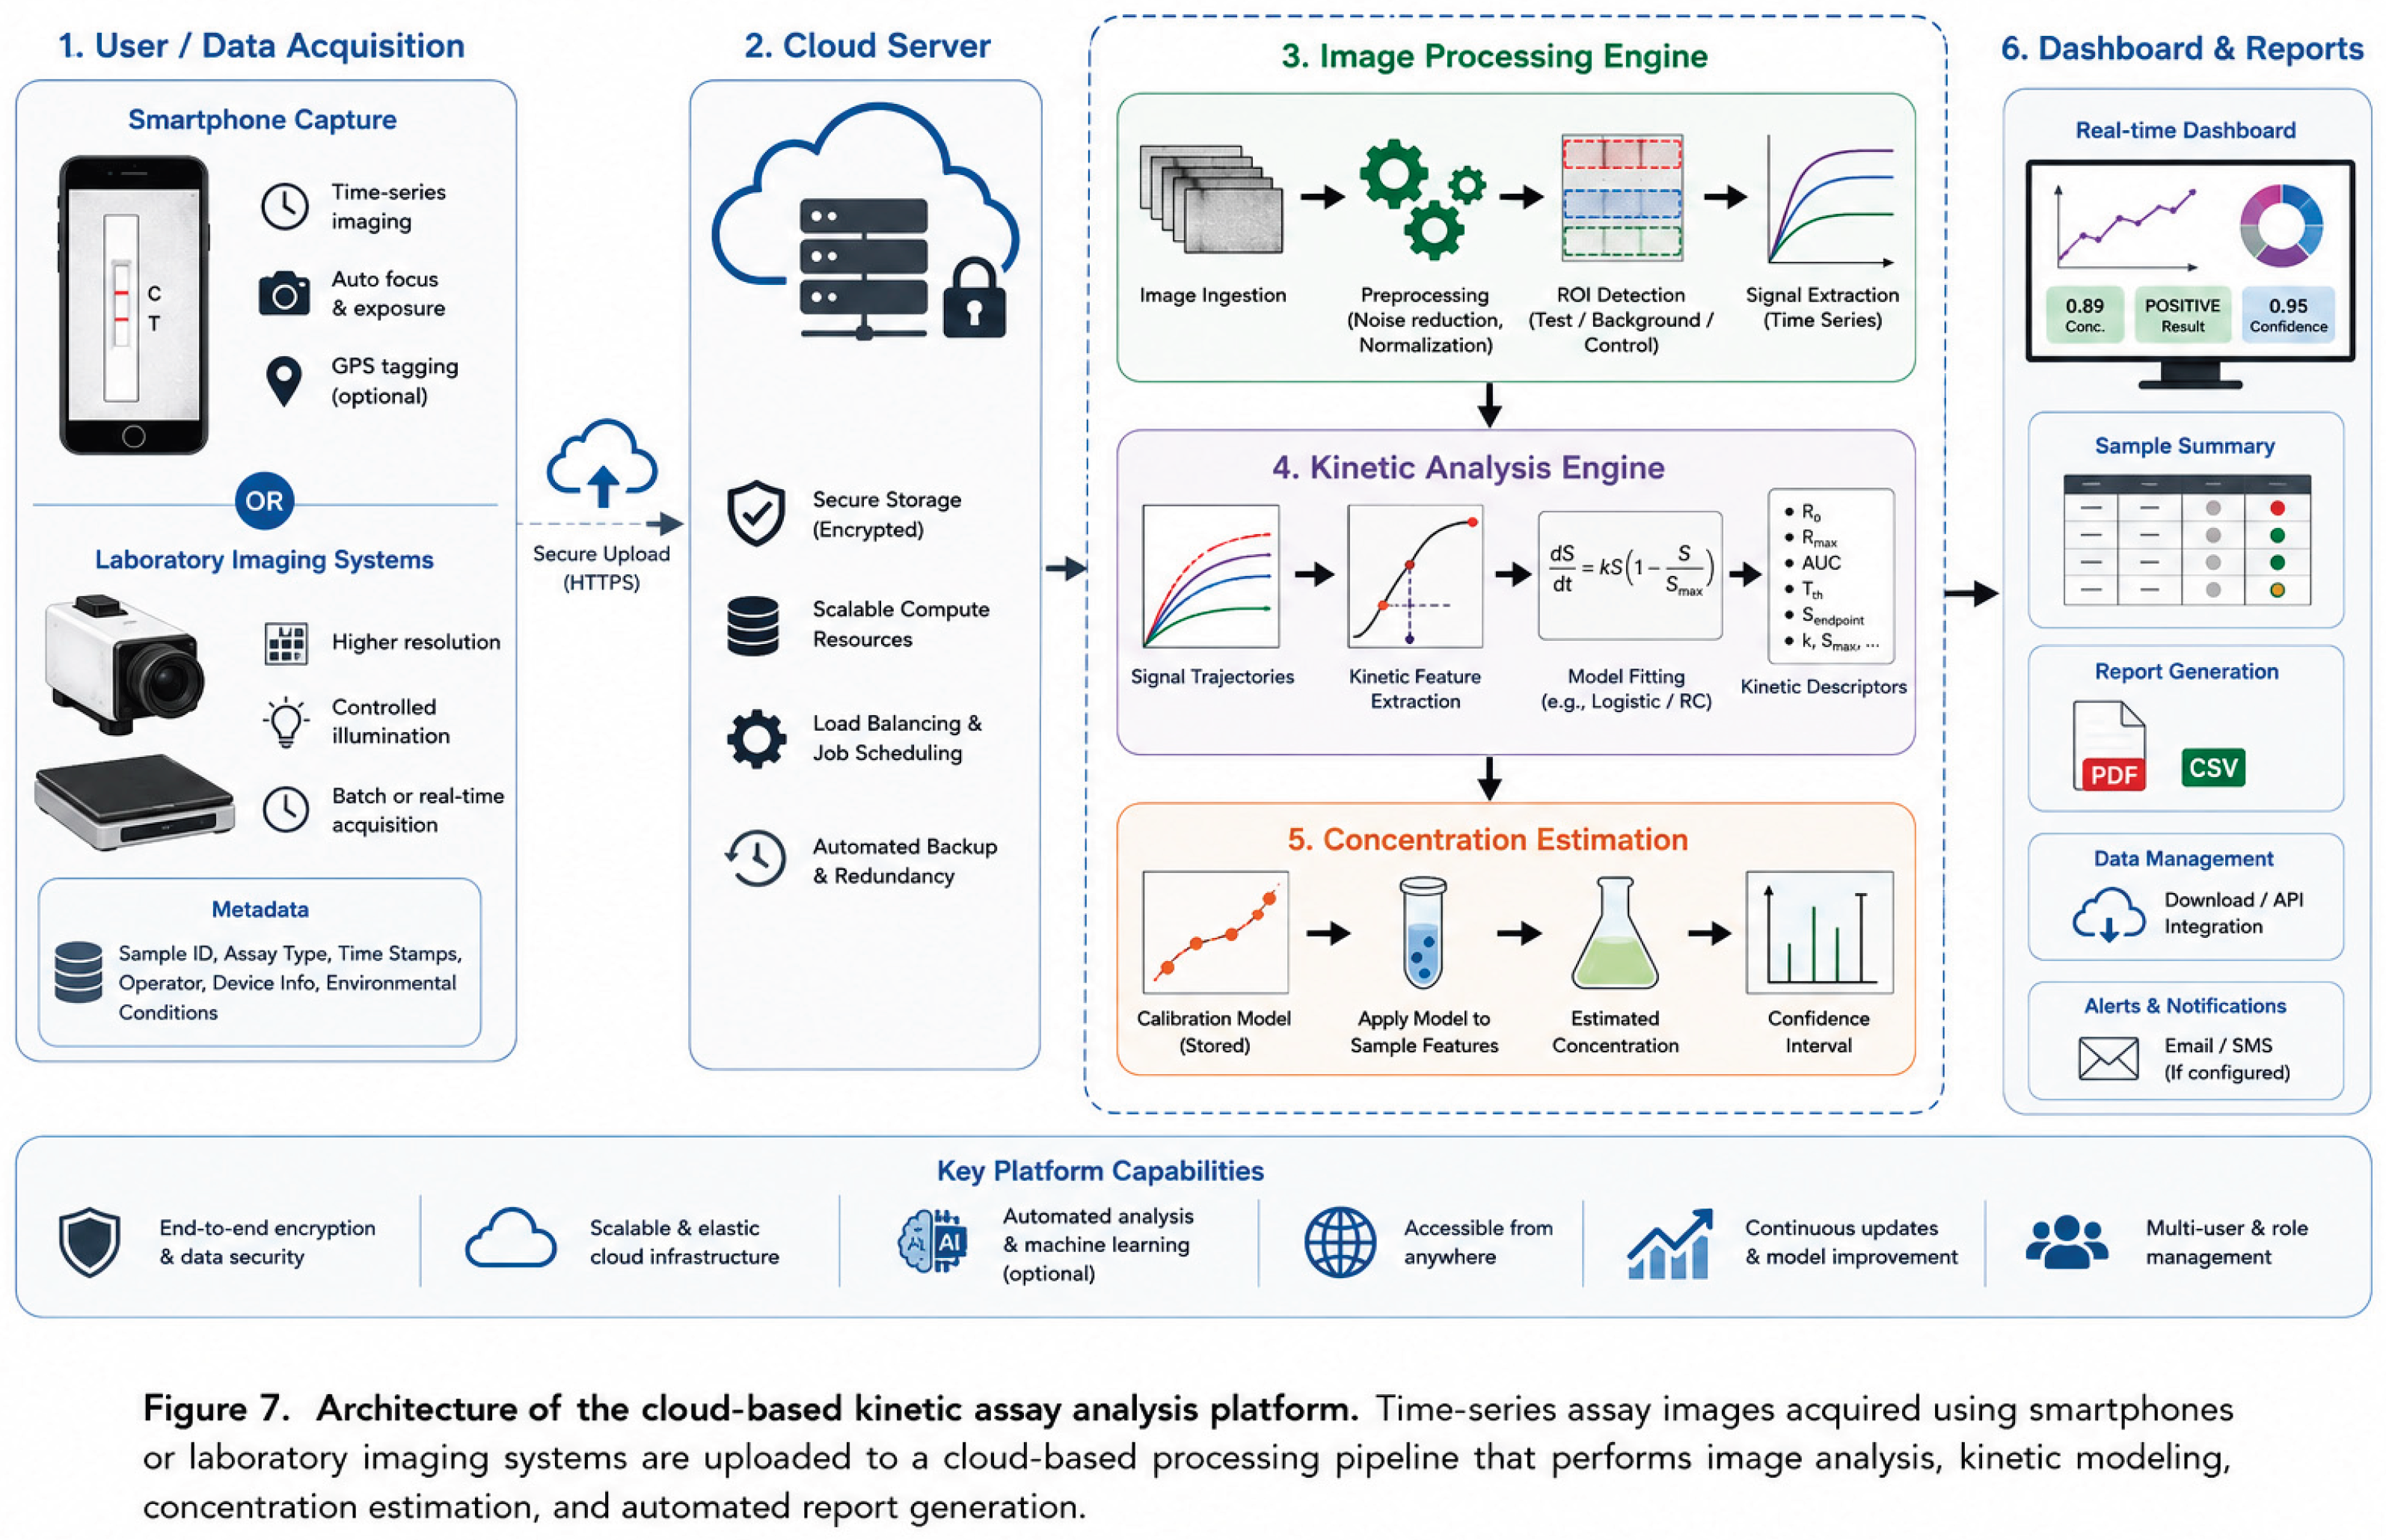
To facilitate the practical implementation of kinetic assay analysis, a cloud-based software platform was developed for automated processing, visualization, and interpretation of time-resolved diagnostic image datasets. The platform serves as the computational backbone of the proposed framework, enabling users to transform raw image sequences into quantitative kinetic metrics, concentration estimates, and diagnostic decisions without requiring specialized image-processing expertise.
The software architecture was designed to support both research and point-of-care applications. By leveraging cloud computing resources, computationally intensive image analysis and curve fitting operations can be performed remotely while maintaining compatibility with low-cost imaging devices such as smartphones and portable optical readers.
Unlike traditional diagnostic software that focuses solely on endpoint image interpretation, the proposed platform is specifically designed to process temporal image datasets and extract dynamic information associated with assay development. This enables the utilization of reaction kinetics and signal growth characteristics as additional sources of diagnostic information.
The platform architecture consists of four primary layers:
- Data acquisition layer
- Image processing layer
- Kinetic analysis layer
- Reporting and visualization layer
A schematic overview of the software workflow is shown in Figure X.
4.2. Data Acquisition and Upload Interface
The platform accepts image sequences acquired from a variety of imaging systems, including:
- Smartphone cameras
- Digital microscopes
- Flatbed scanners
- Laboratory imaging instruments
- Custom diagnostic readers
Users may upload:
- Individual image files
- Batch image collections
- Time-lapse image sequences
- Video recordings converted into image frames
Supported image formats include:
- JPG
- PNG
- TIFF
- BMP
Each uploaded image is associated with a corresponding timestamp or elapsed assay development time. Timestamp information may be automatically extracted from image metadata or manually entered by the user.
The platform automatically sorts uploaded images according to acquisition time and generates a chronological assay timeline for subsequent analysis.
To ensure compatibility with future diagnostic workflows, the system was designed to accommodate both retrospective analysis of completed assays and real-time monitoring of ongoing experiments.
4.3. Automated Image Processing Pipeline
Following image upload, all images are processed through a standardized computational workflow.
Image Standardization
Uploaded images are converted into a common internal format to ensure consistency across imaging devices.
Processing includes:
- Resolution normalization
- Orientation correction
- Color-space conversion
- Metadata extraction
Background Correction
Spatial illumination variations are compensated through adaptive background normalization techniques.
Background correction reduces variability caused by:
- Uneven lighting
- Camera exposure fluctuations
- Optical reflections
- Device-to-device differences
Noise Reduction
Image noise is reduced through digital filtering techniques, including:
- Median filtering
- Gaussian filtering
- Adaptive smoothing
The objective is to improve signal fidelity while preserving diagnostically relevant features.
Image Registration
When required, image alignment algorithms compensate for small shifts in assay position occurring during image acquisition.
Registration ensures that the same physical assay region is analyzed consistently throughout the entire time series.
4.4. Region of Interest Management
Accurate quantification of assay development requires identification and tracking of regions of interest (ROIs).
The platform supports both:
Manual ROI Selection
Users may interactively define:
- Signal ROI
- Background ROI
- Control ROI
through a graphical user interface.
Automated ROI Detection
Computer vision algorithms may automatically identify assay features based on:
- Edge detection
- Intensity segmentation
- Shape recognition
- Template matching
Once identified, ROI coordinates are propagated across all images within the time series.
For assays exhibiting slight positional drift, dynamic ROI tracking algorithms maintain alignment throughout the analysis period.
The ROI management framework enables consistent signal extraction while minimizing user intervention.
4.5. Time-Series Signal Generation
Following ROI identification, the platform extracts intensity information from each image.
For every acquisition time point, the software calculates:
- Mean intensity
- Median intensity
- Integrated intensity
- Optical density
- Signal variance
- Pixel distribution statistics
Background correction is then performed according to:
When a control region is available, normalized signal trajectories are generated:
The resulting signal trajectory forms the primary dataset for kinetic analysis.
The software automatically generates:
- Signal-versus-time curves
- Background-versus-time curves
- Signal-to-noise ratio plots
- Growth-rate plots
allowing users to visualize assay development dynamics in real time.
4.6. Automated Kinetic Parameter Extraction
The platform automatically extracts the kinetic features described in Section 3.
These include:
Endpoint Metrics
- Final signal intensity
- Endpoint signal-to-noise ratio
- Endpoint signal-to-background ratio
Rate-Based Metrics
- Initial reaction rate
- Maximum reaction rate
- Growth acceleration
- Signal curvature
Temporal Metrics
- Time-to-threshold
- Growth half-time
- Time to maximum slope
Integrated Metrics
- Area under the signal curve
- Cumulative signal accumulation
Model-Derived Metrics
Nonlinear fitting algorithms estimate:
- Maximum signal ((S_{max}))
- Apparent kinetic constant ((k))
- Baseline intensity
- Initial fitted reaction rate
Goodness-of-fit parameters including (R^2), RMSE, and residual statistics are also reported.
These metrics collectively provide a multidimensional characterization of assay behavior.
4.7. Concentration Prediction and Calibration
To enable quantitative diagnostics, the platform incorporates calibration functionality based on known analyte standards.
Users may upload datasets generated from samples with known concentrations.
The software constructs calibration relationships using:
- Endpoint intensity
- Initial reaction rate
- Area under the curve
- Time-to-threshold
- Fitted kinetic parameters
Regression models are then generated to estimate unknown analyte concentrations.
Supported calibration approaches include:
- Linear regression
- Polynomial regression
- Logistic regression
- Nonlinear curve fitting
The platform reports both concentration estimates and associated confidence intervals.
This capability enables direct comparison between conventional endpoint quantification and kinetic quantification approaches.
4.8. Limit of Detection Analysis
A primary objective of the platform is the evaluation of diagnostic sensitivity.
The software automatically computes:
Endpoint-Based Detection Limits
AUC-Based Detection Limits
Comparisons between these metrics enable quantitative assessment of whether kinetic analysis provides sensitivity improvements over traditional endpoint measurements.
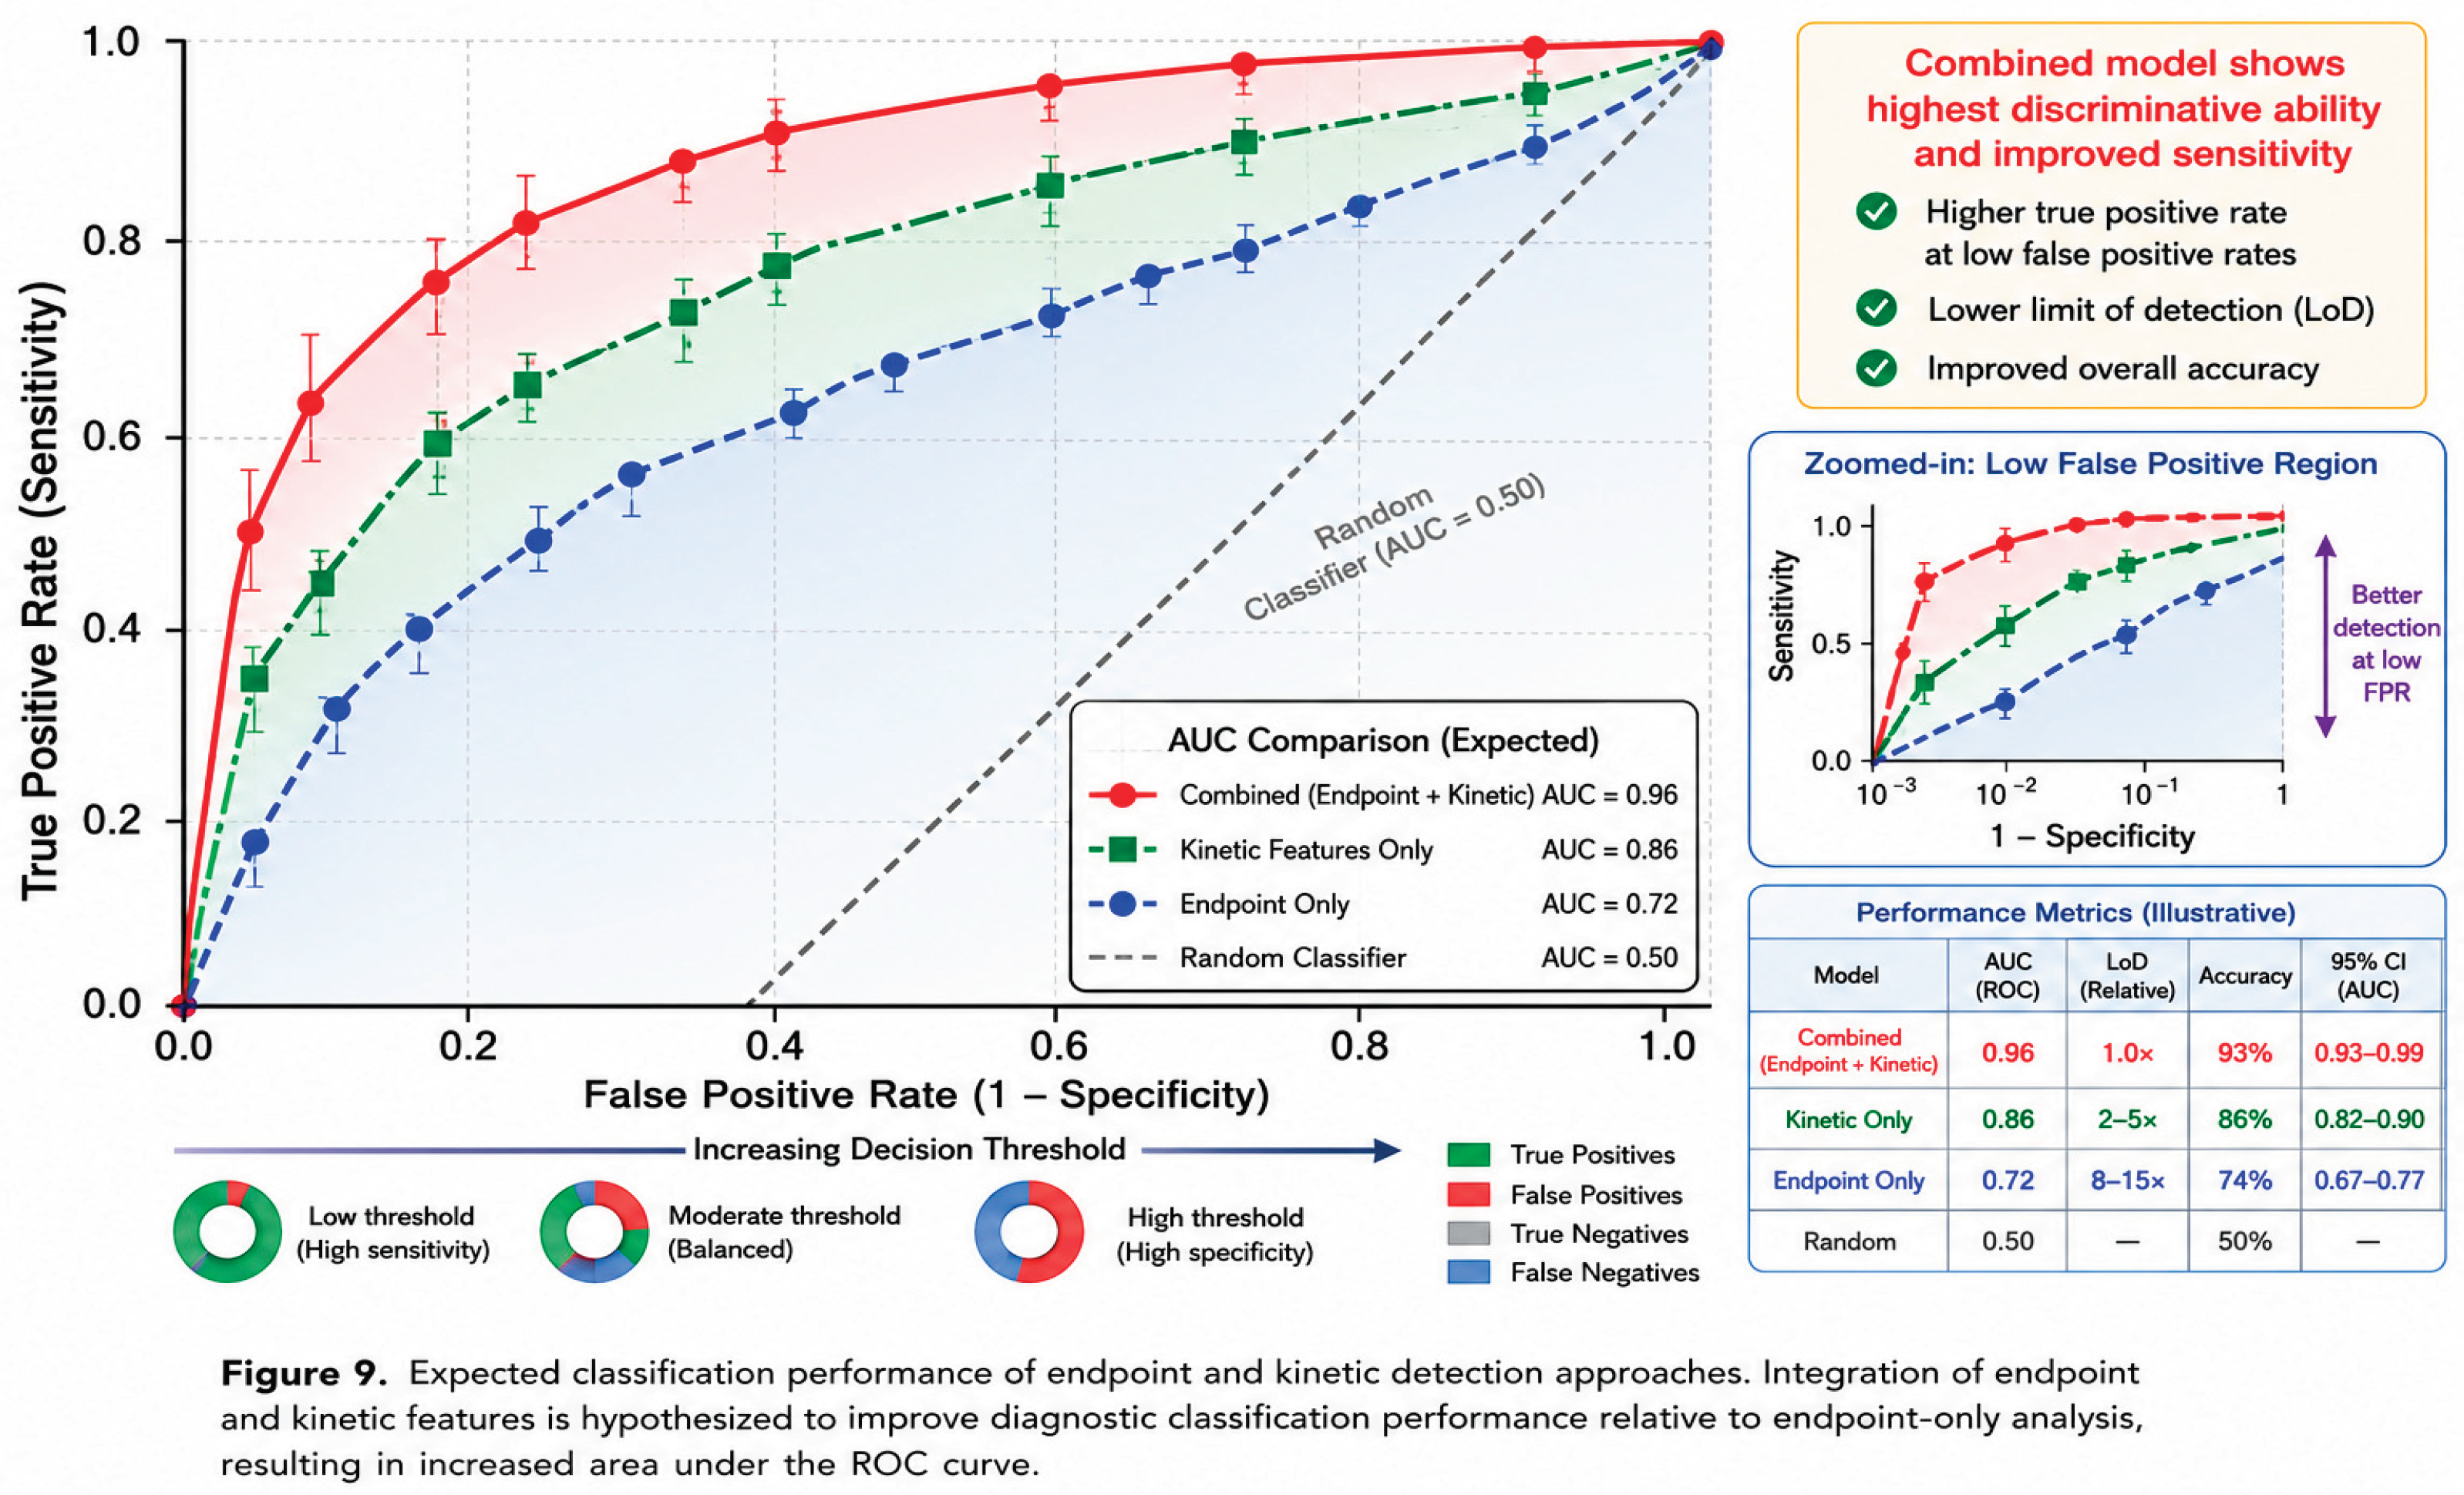
The platform additionally supports receiver operating characteristic (ROC) analysis for evaluation of classification performance.
4.9. Data Visualization and Reporting
To facilitate interpretation and dissemination of results, the platform provides interactive visualization tools.
Generated outputs include:
- Signal growth curves
- Kinetic parameter summaries
- Calibration curves
- Concentration estimates
- Detection limit analyses
- Statistical comparisons
Users may export results as:
- CSV files
- Excel spreadsheets
- PDF reports
- Publication-quality figures
Each report contains assay metadata, ROI information, extracted kinetic parameters, calibration results, and detection decisions.
4.10. Smartphone and Point-of-Care Integration
A major advantage of the proposed platform is its compatibility with smartphone-based diagnostic systems.
Modern smartphones possess sufficient imaging capability to capture high-resolution assay images at multiple time points throughout assay development. The cloud-based architecture allows computationally intensive processing tasks to be performed remotely, eliminating the need for advanced onboard processing hardware.
Consequently, the platform can function as a software layer that augments existing capillary diagnostic assays without requiring modifications to assay chemistry, manufacturing processes, or imaging hardware.
This approach provides a scalable pathway toward intelligent point-of-care diagnostic systems capable of leveraging kinetic information to improve sensitivity, quantification accuracy, and overall diagnostic performance.
5. Proposed Kinetic Limit of Detection Framework
5.1. Limitations of Conventional Endpoint Detection
The analytical sensitivity of diagnostic assays is commonly characterized through the limit of detection (LoD), which represents the lowest analyte concentration that can be reliably distinguished from a blank sample. In image-based capillary diagnostic systems, LoD determination is typically based on a single endpoint measurement acquired after assay completion.
For a set of blank measurements, the conventional endpoint detection threshold is defined as:
where:
- is the mean blank signal,
- is the standard deviation of blank measurements.
A sample is classified as positive when:
This approach assumes that the final signal intensity contains sufficient information to discriminate positive samples from negative controls.
However, several factors limit the effectiveness of endpoint-based detection, particularly near the analytical detection limit.
First, endpoint measurements represent only a single observation collected after the completion of a dynamic biochemical process. Information regarding how the signal evolved over time is discarded.
Second, background noise, illumination variability, camera artifacts, assay manufacturing tolerances, and nonspecific binding can significantly influence endpoint intensity measurements.
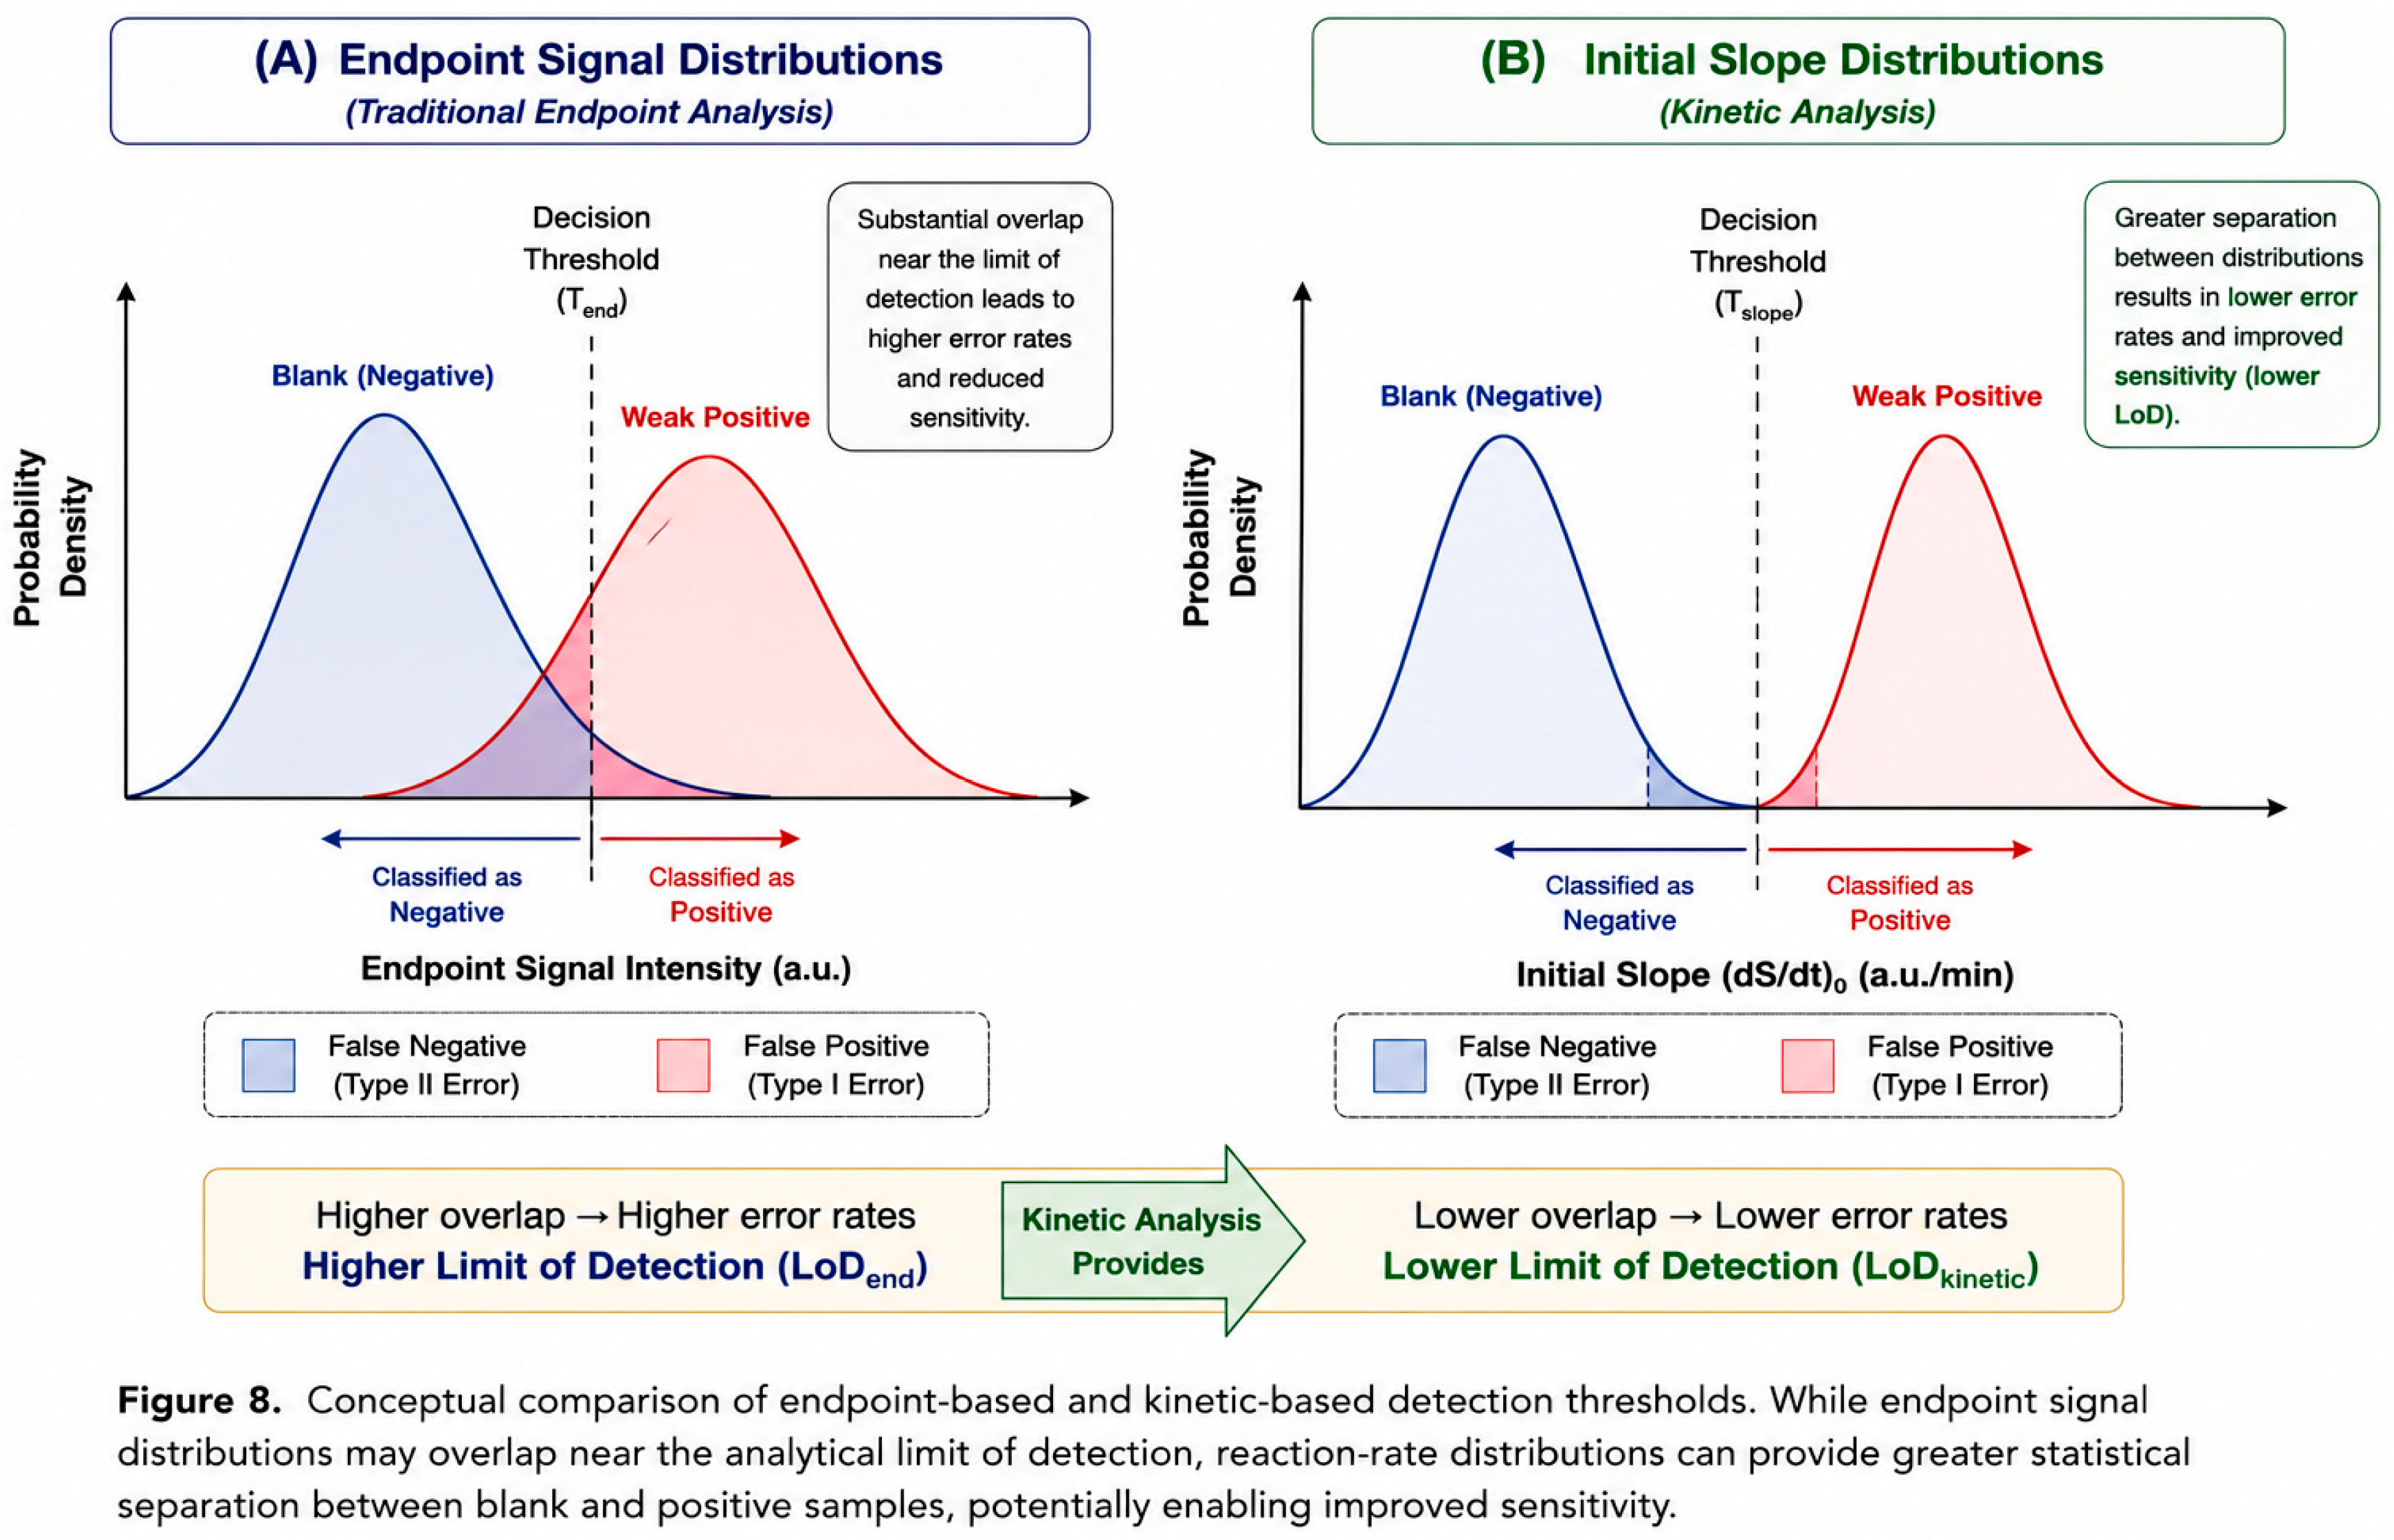
Third, low-concentration samples frequently generate endpoint signals that overlap with blank distributions, reducing statistical separation between positive and negative populations.
Consequently, diagnostic performance near the LoD is often constrained by variability in endpoint measurements rather than the absence of detectable biochemical activity.
5.2. Dynamic Interpretation of Signal Formation
In contrast to endpoint-based analysis, the proposed framework interprets assay development as a dynamic process.
For a positive sample, signal accumulation typically follows a characteristic growth trajectory: S(t) where signal increases as analytes are transported toward the capture region and participate in binding reactions.
Even when the final signal intensity remains close to the blank threshold, the temporal evolution of the signal may reveal statistically significant differences between positive and negative samples.
Blank samples generally exhibit:
- Minimal signal growth
- Small random fluctuations
- Near-zero average reaction rates
Positive samples exhibit:
- Sustained signal accumulation
- Positive growth rates
- Characteristic kinetic signatures
The central hypothesis of this work is that reaction dynamics may provide more sensitive indicators of analyte presence than endpoint measurements alone.
5.3. Rate-Based Detection Threshold
To exploit temporal information, the proposed framework introduces a kinetic detection threshold based on signal growth rate.
The instantaneous reaction rate is defined as:
-(27)
For practical implementation, the initial reaction rate is estimated using linear regression over early measurement points:
-(28)
The corresponding kinetic detection threshold is defined as:
A sample is classified as kinetically positive when:
Unlike endpoint analysis, this approach evaluates whether signal accumulation is occurring at a statistically significant rate.
Because reaction rates are measured before signal saturation occurs, they may provide earlier evidence of analyte presence.
5.4. Area-Under-the-Curve Detection
The complete signal trajectory contains additional information beyond instantaneous reaction rates.
The cumulative assay response may be quantified through the area under the signal curve:
where (t_f) represents the final measurement time.
For blank samples: is calculated and used to establish a kinetic threshold:
The AUC metric incorporates information from the entire assay development period and may be less susceptible to isolated measurement noise than endpoint intensity.
5.5. Time-to-Threshold Detection
An alternative kinetic descriptor is the time required for a signal to exceed a predefined threshold value.
The threshold crossing time is defined as: such that
For sufficiently strong positive samples, threshold crossing occurs earlier than for weak positive samples.
As analyte concentration increases:
Conversely, low analyte concentrations generally produce larger threshold crossing times.
Time-to-threshold therefore represents an additional kinetic feature that may be used for concentration estimation and positive sample identification.
5.6. Model-Based Detection
The proposed framework further incorporates model-derived parameters obtained through nonlinear curve fitting.
Signal accumulation is approximated using:
-(24)
where:
- is maximum signal,
- k is the apparent kinetic constant,
- B is baseline intensity.
Model fitting yields estimates of:, k which can be incorporated into detection criteria.
Because these parameters are extracted from the entire signal trajectory, they may provide improved robustness compared with single-point measurements.
5.7. Composite Kinetic Detection Score
While individual kinetic features provide valuable information, greater discrimination may be achieved by combining multiple descriptors into a unified detection metric.
A generalized kinetic detection score may be expressed as:
where:
- (w_i) are weighting coefficients,
- (S_{endpoint}) is endpoint intensity,
- (R_0) is initial reaction rate,
- (AUC) is area under the curve,
- (SNR) is signal-to-noise ratio,
- (k) is the fitted kinetic constant.
The weighting coefficients may be determined experimentally or optimized using machine-learning algorithms.
Samples may then be classified according to:
where (T_{KDS}) represents a statistically derived classification threshold.
This approach integrates both static and dynamic information into a single decision framework.
5.8. Expected Advantages of Kinetic Detection
The proposed kinetic detection framework offers several theoretical advantages over conventional endpoint analysis.
First, temporal measurements provide multiple observations rather than a single endpoint value, increasing the amount of information available for classification.
Second, reaction-rate metrics may reveal weak positive samples before endpoint signal accumulation becomes visually apparent.
Third, kinetic descriptors may be less susceptible to illumination artifacts and systematic intensity offsets because they rely on changes in signal over time rather than absolute intensity values.
Fourth, the use of multiple kinetic features allows detection decisions to be based on complementary information sources, potentially improving classification robustness.
Finally, kinetic detection may enable earlier diagnostic decisions by identifying positive samples before assay completion, reducing total assay turnaround time.
5.9. Hypothesis for Improved Detection Sensitivity
The central hypothesis of this work is that kinetic descriptors extracted from time-resolved image sequences contain diagnostically relevant information that is not captured by conventional endpoint measurements.
Specifically, it is hypothesized that:
for a broad class of capillary diagnostic assays.
If validated experimentally, this result would demonstrate that time-resolved image analysis can improve analytical sensitivity without requiring modifications to assay chemistry, assay architecture, or imaging hardware.
Instead, enhanced performance would be achieved through improved utilization of information already generated during the assay development process, thereby establishing a new framework for next-generation intelligent diagnostic systems.
6. Expected Performance Benefits
6.1. Overview
The proposed kinetic image-analysis framework is designed to improve the analytical performance of capillary diagnostic assays by exploiting information contained within the temporal evolution of signal formation. Unlike conventional endpoint analysis, which relies on a single measurement acquired after assay completion, the proposed methodology utilizes the entire signal trajectory to extract transport- and reaction-related information that may otherwise remain inaccessible.
Because the framework operates at the software and data-analysis level, many of the anticipated benefits can be achieved without modifications to existing assay chemistries, manufacturing processes, or imaging hardware. Consequently, the approach has the potential to enhance the performance of a broad range of diagnostic platforms while maintaining compatibility with current workflows.
The following sections describe the primary performance advantages expected from the proposed methodology.
6.2. Improved Sensitivity near the Limit of Detection
One of the most significant limitations of conventional capillary diagnostic systems is reduced sensitivity near the analytical limit of detection. At low analyte concentrations, endpoint signal intensity often approaches the magnitude of background noise, making it difficult to reliably distinguish weak positive samples from blank measurements.
In traditional endpoint analysis, a weak positive sample may generate only a small increase in final signal intensity relative to the blank population. Consequently, statistical overlap between positive and negative samples can result in increased false-negative rates and reduced confidence in diagnostic interpretation.
The proposed framework addresses this limitation by utilizing kinetic descriptors extracted throughout assay development. Even when endpoint signals are similar, positive samples may exhibit characteristic temporal behaviors such as:
- Sustained signal accumulation
- Increased reaction rates
- Earlier threshold crossing
- Distinct growth curve shapes
These dynamic features provide additional discriminatory information that may improve classification performance near the detection limit.
Because the framework evaluates signal evolution rather than solely endpoint magnitude, it is expected to increase statistical separation between positive and negative populations, thereby improving analytical sensitivity.
The central hypothesis of this work is that:
indicating that kinetic analysis may enable detection of lower analyte concentrations than conventional endpoint measurements.
6.3. Earlier Positive Sample Identification
Traditional capillary assays generally require completion of the entire assay protocol before a diagnostic decision can be made. In many cases, the full assay development period is necessary to allow sufficient signal accumulation for visual interpretation.
However, signal formation often begins long before the endpoint measurement is acquired.
By continuously monitoring assay development, the proposed framework enables evaluation of signal growth dynamics in real time.
For positive samples, reaction-rate metrics may exceed blank thresholds before endpoint intensity becomes detectable. Consequently, diagnostic decisions may potentially be made earlier than with conventional endpoint analysis.
This capability offers several advantages:
- Reduced assay turnaround time
- Faster clinical decision-making
- Improved workflow efficiency
- Enhanced user experience
In applications involving infectious disease screening, emergency medicine, environmental monitoring, and food safety testing, even modest reductions in assay time may provide meaningful practical benefits.
6.4. Improved Signal-to-Noise Discrimination
Image-based diagnostic measurements are inherently affected by multiple noise sources, including:
- Camera sensor noise
- Illumination variability
- Optical reflections
- Sample heterogeneity
- Manufacturing variability
- Environmental fluctuations
Endpoint measurements are particularly vulnerable to these effects because classification decisions rely on a single intensity value.
In contrast, kinetic analysis evaluates signal behavior across multiple time points.
Random measurement noise tends to fluctuate independently across images, whereas true signal accumulation follows a coherent temporal trend.
By analyzing the complete signal trajectory, the framework effectively increases the amount of information available for classification and may improve signal-to-noise discrimination.
The averaging effect associated with multiple measurements is expected to reduce the influence of random noise and improve overall diagnostic robustness.
6.5. Reduced Susceptibility to Illumination Variability
Variability in lighting conditions represents a major challenge for smartphone-based diagnostic systems.
Differences in:
- Ambient lighting
- Camera exposure settings
- Viewing angles
- Optical reflections
can substantially influence absolute intensity measurements.
Because conventional endpoint analysis relies heavily on absolute signal intensity, these factors can introduce significant measurement uncertainty.
The proposed framework mitigates this issue through several mechanisms:
- Background normalization
- Control-region normalization
- Time-series trend analysis
- Rate-based feature extraction
Importantly, reaction-rate measurements depend primarily on relative changes in signal over time rather than absolute intensity values.
As a result, kinetic descriptors may remain relatively stable even when illumination conditions vary between experiments.
This characteristic is particularly advantageous for decentralized testing environments where imaging conditions cannot be tightly controlled.
6.6. Improved Quantification Accuracy
Many diagnostic applications require quantitative estimation of analyte concentration rather than simple positive/negative classification.
Conventional concentration estimation is often based on endpoint calibration curves relating signal intensity to analyte concentration.
However, endpoint signals may become increasingly nonlinear at high concentrations due to saturation effects, while measurement noise can dominate at low concentrations.
The proposed framework provides multiple independent concentration-sensitive features, including:
- Endpoint intensity
- Initial reaction rate
- Maximum reaction rate
- Area under the curve
- Time-to-threshold
- Fitted kinetic constant
- Maximum signal intensity
Each feature contains distinct information regarding assay behavior.
Combining these features may improve concentration estimation by reducing reliance on any single measurement.
Furthermore, kinetic parameters may exhibit stronger correlation with analyte concentration in certain operating regimes, particularly near the analytical detection limit.
This multi-parameter approach is expected to improve quantification accuracy across a broader dynamic range.
6.7. Compatibility with Existing Diagnostic Platforms
A major advantage of the proposed methodology is that it operates primarily at the software and data-analysis level.
Many existing approaches for improving assay sensitivity require:
- New assay chemistries
- Additional reagents
- Complex instrumentation
- Modified manufacturing processes
In contrast, the proposed framework utilizes information already generated during normal assay operation.
Consequently, implementation may require only:
- Sequential image acquisition
- Cloud-based analysis software
- Computational processing
The methodology is therefore compatible with a wide range of diagnostic platforms, including:
- Lateral flow assays
- Paper-based microfluidics
- Dot immunoassays
- Fluorescent biosensors
- Lab-on-disc systems
- Colorimetric capillary assays
This broad applicability significantly lowers barriers to adoption.
6.8. Smartphone-Enabled Diagnostics
Recent advances in smartphone imaging technology have transformed mobile devices into powerful analytical tools.
Modern smartphones provide:
- High-resolution cameras
- Advanced image-processing capabilities
- Wireless connectivity
- Cloud integration
- User-friendly interfaces
These capabilities make smartphones attractive platforms for decentralized diagnostics.
The proposed cloud-based framework leverages smartphone imaging for data acquisition while offloading computationally intensive tasks to remote servers.
This architecture offers several advantages:
- Low hardware costs
- Remote accessibility
- Scalability
- Continuous software updates
- Minimal user training requirements
As smartphone adoption continues to increase globally, the framework may enable advanced kinetic diagnostics to become accessible in resource-limited environments.
6.9. Integration with Machine Learning
Although the framework can operate using conventional statistical methods, additional performance improvements may be achieved through machine-learning approaches.
The multidimensional feature space generated by the platform includes:
Machine-learning models may identify complex nonlinear relationships among these variables that are difficult to capture using traditional threshold-based approaches.
Potential algorithms include:
- Random forests
- Support vector machines
- Gradient boosting methods
- Artificial neural networks
- Deep learning architectures
These approaches may improve:
- Classification accuracy
- Concentration estimation
- False-positive reduction
- False-negative reduction
Particularly for complex assays, machine learning may further enhance the value of kinetic information.
6.10. Broader Implications
Beyond improvements in diagnostic sensitivity, the proposed framework introduces a broader conceptual shift in how capillary diagnostic assays are interpreted.
Traditional diagnostic systems treat assays as static measurements and utilize only the final state of the reaction process.
The proposed methodology instead treats diagnostic assays as dynamic systems whose temporal behavior contains valuable information regarding analyte presence and concentration.
By combining principles from transport phenomena, reaction kinetics, image analysis, cloud computing, and machine learning, the framework establishes a foundation for a new generation of intelligent diagnostic systems.
If experimentally validated, this approach could enable more sensitive, quantitative, and robust diagnostics without requiring fundamental changes to existing assay architectures, thereby accelerating the deployment of advanced analytical capabilities across a wide range of healthcare and biosensing applications.
7. Future Experimental Validation
7.1. Experimental Objectives
The framework presented in this study establishes a theoretical and computational foundation for kinetic image analysis of capillary diagnostic assays. While the proposed methodology is supported by established principles of mass transport, reaction kinetics, and signal processing, experimental validation is required to quantify performance improvements relative to conventional endpoint-based approaches.
The primary objective of future studies will be to determine whether kinetic descriptors extracted from time-resolved image sequences provide statistically significant improvements in analytical sensitivity, quantitative accuracy, and diagnostic classification performance.
Specifically, future investigations will test the hypothesis that:
across multiple classes of capillary diagnostic platforms.
7.2. Validation Platforms
To demonstrate generalizability, the proposed framework will be evaluated using several representative diagnostic technologies.
Lateral Flow Immunoassays
Lateral flow immunoassays represent one of the most widely adopted point-of-care diagnostic technologies and provide an ideal validation platform.
Image sequences will be acquired during assay development to evaluate:
- Test-line growth kinetics
- Signal accumulation rates
- Threshold crossing behavior
- Concentration-dependent kinetic responses
Particular emphasis will be placed on analyte concentrations near the conventional detection limit.
Dot-Based Diagnostic Assays
Dot immunoassays provide a simplified geometry for investigating signal growth dynamics.
Because signal development occurs within a localized detection zone, these assays provide an opportunity to evaluate the framework under conditions with reduced transport complexity.
Lab-on-Disc Platforms
Centrifugal microfluidic systems introduce additional transport phenomena associated with rotationally driven flow and controlled reagent manipulation.
Evaluation on lab-on-disc systems will determine whether kinetic image analysis remains beneficial in microfluidic environments exhibiting more complex transport behavior.
Fluorescent Detection Systems
Fluorescent assays frequently exhibit superior sensitivity compared with colorimetric systems and may provide additional opportunities for exploiting reaction-rate information.
Validation studies will investigate:
- Fluorescence accumulation kinetics
- Signal growth models
- Dynamic concentration estimation
Colorimetric Detection Systems
Because colorimetric assays dominate many commercial point-of-care applications, validation on colorimetric platforms is essential for demonstrating practical utility.
These experiments will also evaluate robustness against lighting variability and smartphone imaging conditions.
7.3. Experimental Design
Future studies will include samples spanning a broad concentration range, including:
- Blank controls
- Low-positive samples near the LoD
- Intermediate concentrations
- High-concentration samples
For each concentration level, replicate measurements will be performed to characterize variability and establish statistical confidence intervals.
Time-series image acquisition will be performed throughout assay development, generating datasets suitable for both endpoint and kinetic analyses.
The same experimental datasets will be analyzed using:
- Conventional endpoint analysis
- Kinetic image analysis
- Combined endpoint-kinetic approaches
This direct comparison will enable quantitative assessment of the value added by time-resolved information.
7.4. Performance Metrics
Several performance metrics will be used to evaluate framework effectiveness.
Limit of Detection
The primary endpoint of the study will be determination of the analytical limit of detection.
Comparisons will be made between:
to quantify sensitivity improvements attributable to kinetic analysis.
Diagnostic Sensitivity
Diagnostic sensitivity will be calculated as:
where:
- TP = true positives
- FN = false negatives
Improved sensitivity near the detection limit would support the proposed framework.
Diagnostic Specificity
Specificity will be evaluated as:
where:
- TN = true negatives
- FP = false positives
Maintenance of high specificity is essential to ensure that sensitivity gains do not occur at the expense of increased false-positive rates.
Receiver Operating Characteristic Analysis
Receiver operating characteristic (ROC) curves will be generated to evaluate classification performance across multiple decision thresholds.
Area under the ROC curve (AUC-ROC) will provide a threshold-independent measure of classifier effectiveness.
Concentration Prediction Accuracy
For quantitative assays, concentration estimation accuracy will be evaluated through:
- Mean absolute error (MAE)
- Root mean square error (RMSE)
- Coefficient of determination ((R^2))
Comparisons between endpoint-based and kinetic-based calibration approaches will be performed.
Time-to-Detection
An additional metric unique to the proposed framework is time-to-detection.
This analysis will quantify the earliest point at which positive samples can be reliably distinguished from blanks using kinetic information.
7.5. Machine Learning Evaluation
Future studies will investigate whether combining multiple kinetic descriptors improves classification performance.
Potential feature sets include:
- Endpoint intensity
- Initial reaction rate
- Maximum reaction rate
- Area under the curve
- Signal-to-noise ratio
- Time-to-threshold
- Fitted kinetic constants
Machine-learning algorithms including random forests, gradient boosting, support vector machines, and neural networks may be evaluated.
Performance will be compared against conventional threshold-based methods.
7.6. Expected Outcomes
Based on the theoretical framework presented herein, several outcomes are anticipated.
First, reaction-rate-based metrics are expected to provide earlier indication of analyte presence than endpoint measurements.
Second, incorporation of kinetic descriptors is expected to improve discrimination between weak positive samples and blank controls.
Third, combined endpoint and kinetic models are anticipated to outperform either approach individually.
Finally, successful validation would demonstrate that enhanced diagnostic sensitivity can be achieved through improved utilization of existing assay information rather than modifications to assay chemistry or hardware.
The resulting framework could provide a scalable pathway toward next-generation intelligent diagnostic systems capable of extracting substantially greater analytical value from existing capillary assay platforms.
8. Conclusions
This work presents a generalized kinetic image-analysis framework for capillary diagnostic assays that leverages time-resolved image information to extract transport- and reaction-related features that are inaccessible through conventional endpoint measurements. By treating signal generation as a dynamic process rather than a static endpoint observation, the proposed methodology introduces a new paradigm for diagnostic interpretation based on reaction kinetics, signal accumulation behavior, and temporal pattern recognition.
The framework integrates principles from mass transport, reaction kinetics, image processing, cloud computing, and quantitative diagnostics into a unified analytical platform capable of processing sequential assay images acquired using standard laboratory imaging systems or smartphone cameras. Through extraction of kinetic descriptors such as reaction rates, area-under-the-curve measurements, threshold crossing times, signal-to-noise evolution, and model-derived kinetic parameters, the methodology seeks to utilize information that is routinely generated but currently discarded in most diagnostic workflows.
A theoretical limit-of-detection framework was introduced in which kinetic metrics are used alongside traditional endpoint measurements to identify weak positive samples and improve diagnostic sensitivity. The proposed approach is particularly relevant near the analytical detection limit, where endpoint intensity measurements frequently overlap with background noise and assay variability. By exploiting temporal signal evolution, the framework has the potential to improve classification confidence, enhance quantitative accuracy, and enable earlier diagnostic decisions.
Importantly, the proposed methodology is largely software-driven and therefore compatible with existing capillary diagnostic technologies, including lateral flow immunoassays, dot-based assays, paper microfluidic systems, fluorescent biosensors, and centrifugal lab-on-disc platforms. As a result, implementation may be achieved without significant modifications to assay chemistry, device architecture, or manufacturing processes.
Future experimental validation will determine the extent to which kinetic image analysis improves analytical performance relative to conventional endpoint approaches. If successful, the framework could establish a foundation for intelligent diagnostic systems that integrate cloud computing, smartphone imaging, and machine learning to achieve improved sensitivity and broader accessibility. Such capabilities may contribute to the development of next-generation point-of-care diagnostics capable of delivering more accurate, quantitative, and timely information across a wide range of healthcare, environmental, and biosensing applications.
Acknowledgments
From the support of MicroCD Labs and Dr. Snehan Peshin we could get the theoretical basis of this paper.
Contribution
This paper was coined and written by Shailja Pandit.
References
- Hansen, S.; Abd El Wahed, A. Point-Of-Care or Point-Of-Need Diagnostic Tests: Time to Change Outbreak Investigation and Pathogen Detection. Trop. Med. Infect. Dis. 2020, 5(4), 151. [Google Scholar] [CrossRef] [PubMed]
- Kim, H.; Chung, D.-R.; Kang, M. A New Point-of-Care Test for the Diagnosis of Infectious Diseases Based on Multiplex Lateral Flow Immunoassays. Analyst 2019, 144(8), 2460–2466. [Google Scholar] [CrossRef] [PubMed]
- Jiang, N.; Ahmed, R.; Damayantharan, M.; Ünal, B.; Butt, H.; Yetisen, A. K. Lateral and Vertical Flow Assays for Point-of-Care Diagnostics. Adv. Healthc. Mater. 2019, 8(14), 1900244. [Google Scholar] [CrossRef]
- Kardjadj, M. Operational Validity in Decentralized Molecular Point-of-Care Diagnostics: A Human Factors Engineering Perspective. Diagnostics 2026, 16(12), 1924. [Google Scholar] [CrossRef] [PubMed]
- Kulinsky, L.; Noroozi, Z.; Madou, M. Present Technology and Future Trends in Point-of-Care Microfluidic Diagnostics. In Microfluidic Diagnostics: Methods and Protocols; Methods in Molecular Biology; Jenkins, G., Mansfield, C. D., Eds.; Humana Press: Totowa, NJ, 2013; pp. 3–23. [Google Scholar] [CrossRef] [PubMed]
- Clinical research in resource-limited settings - CIOMS. Available online: https://cioms.ch/publications/product/clinical-research-in-low-resource-settings/ (accessed on 2026-06-22).
- dvgulik. Access Bio CareStart COVID-19 Rapid Antigen Test. Inspire Diagnostics. Available online: https://inspirediagnostics.com/access-bio-carestart-covid-19-rapid-antigen-test/ (accessed on 2021-05-06).
- Choi, D. H.; Lee, S. K.; Oh, Y. K.; Bae, B. W.; Lee, S. D.; Kim, S.; Shin, Y.-B.; Kim, M.-G. A Dual Gold Nanoparticle Conjugate-Based Lateral Flow Assay (LFA) Method for the Analysis of Troponin I. Biosens. Bioelectron. 2010, 25(8), 1999–2002. [Google Scholar] [CrossRef] [PubMed]
- Anfossi, L.; Di Nardo, F.; Cavalera, S.; Giovannoli, C.; Baggiani, C. Multiplex Lateral Flow Immunoassay: An Overview of Strategies towards High-Throughput Point-of-Need Testing. Biosensors 2019, 9(1), 2. [Google Scholar] [CrossRef] [PubMed]
- Beloglazova, N. V.; Sobolev, A. M.; Tessier, M. D.; Hens, Z.; Goryacheva, I. Yu.; De Saeger, S. Fluorescently Labelled Multiplex Lateral Flow Immunoassay Based on Cadmium-Free Quantum Dots. Methods 2017, 116, 141–148. [Google Scholar] [CrossRef] [PubMed]
- Peshin, S. Scalable Fabrication of MEMS Resonators with Intentionally-Induced Geometric Nonlinearity. M.S., Michigan State University, United States -- Michigan. Available online: https://www.proquest.com/docview/1709243541/abstract/113FC8B3F58743E7PQ/1 (accessed on 2021-08-08).
- Anoop, R.; Sen, A. K. Capillary Flow Enhancement in Rectangular Polymer Microchannels with a Deformable Wall. Phys. Rev. E 2015, 92(1), 013024. [Google Scholar] [CrossRef] [PubMed]
- Chen, J. M.; Huang, P.-C.; Lin, M.-G. Analysis and Experiment of Capillary Valves for Microfluidics on a Rotating Disk. Microfluid. Nanofluidics 2008, 4(5), 427–437. [Google Scholar] [CrossRef]
- T. Hwu, A.; Madadelahi, M.; Nakajima, R.; Shamloo, E.; Perebikovsky, A.; Kido, H.; Jain, A.; Jasinskas, A.; Prange, S.; Felgner, P.; Madou, M. Centrifugal Disc Liquid Reciprocation Flow Considerations for Antibody Binding to COVID Antigen Array during Microfluidic Integration. Lab. Chip 2022, 22(14), 2695–2706. [Google Scholar] [CrossRef] [PubMed]
- Bishop, J. D.; Hsieh, H. V.; Gasperino, D. J.; Weigl, B. H. Sensitivity Enhancement in Lateral Flow Assays: A Systems Perspective. Lab. Chip 2019, 19(15), 2486–2499. [Google Scholar] [CrossRef] [PubMed]
- Kainz, D. M.; Breiner, B. J.; Klebes, A.; Borst, N.; Zengerle, R.; von Stetten, F.; Hutzenlaub, T.; Paust, N.; Früh, S. M. Centrifugal Microfluidic Lateral Flow Assay Enables High Sensitivity Interleukin-6 Detection and Ultrafast Readout of Elevated Analyte Levels. Anal. Chem. 2025, 97(16), 8984–8991. [Google Scholar] [CrossRef] [PubMed]
- Parolo, C.; Medina-Sánchez, M.; la Escosura-Muñiz, A. de; Merkoçi, A. Simple Paper Architecture Modifications Lead to Enhanced Sensitivity in Nanoparticle Based Lateral Flow Immunoassays. Lab. Chip 2013, 13(3), 386–390. [Google Scholar] [CrossRef] [PubMed]
- Xia, G.; Wang, J.; Liu, Z.; Bai, L.; Ma, L. Effect of Sample Volume on the Sensitivity of Lateral Flow Assays through Computational Modeling. Anal. Biochem. 2021, 619, 114130. [Google Scholar] [CrossRef] [PubMed]
- Liu, Y.; Zhan, L.; Qin, Z.; Sackrison, J.; Bischof, J. C. Ultrasensitive and Highly Specific Lateral Flow Assays for Point-of-Care Diagnosis. ACS Nano 2021, 15(3), 3593–3611. [Google Scholar] [CrossRef] [PubMed]
- Liu, C.; Zhao, T.; Zhou, J.; Hu, X.; Pan, D.; Li, J.; Li, W.; Dai, Z. Optical Lateral Flow Immune Assay Technology for Body Fluid Sensing. Chin. Chem. Lett. 2026, 37(1), 110967. [Google Scholar] [CrossRef]
- Real-time, smartphone-based processing of lateral flow assays for early failure detection and rapid testing workflows - Sensors & Diagnostics (RSC Publishing) DOI:10.1039/D2SD00197G. Available online: https://pubs.rsc.org/en/content/articlehtml/2022/sd/d2sd00197g (accessed on 2026-06-22).
- Reyed, R. M. One Health Cyber-Biotechnology for Nano-Plastic Intelligence Systems and Logic Integration: From Exposure to System-Level Interpretation. In One Health Approaches to Nanoplastics Contamination: Biotechnological and AI Solutions; IGI Global Scientific Publishing, 2027; pp. 1–120. [Google Scholar] [CrossRef]
- Peshin, S.; Gavin, A.; Rie, N.; Jain, A.; Felgner, P.; Madou, M. J.; Kulinsky, L. Interplay of the Mass Transport and Reaction Kinetics for Lateral Flow Immunoassay Integrated on Lab-on-Disc. Sensors 2025, 25(20), 6271. [Google Scholar] [CrossRef] [PubMed]
- Zhang, Y.; Hu, F.; Zhou, R.; Yang, T.; Cai, P.; Picchetti, P.; Huang, X.; Li, Z.; Zhai, X.; Zhang, R.; Zhang, J.; Shi, J.; Guo, Z.; Gao, S.; Zou, X. Enhancing Selectivity in Affinity Biosensors through Biorecognition-Driven Suppression of Nonspecific Binding. ACS Sens. 2026, 11(2), 853–884. [Google Scholar] [CrossRef] [PubMed]
- Gubala, V.; Harris, L. F.; Ricco, A. J.; Tan, M. X.; Williams, D. E. Point of Care Diagnostics: Status and Future. Anal. Chem. 2012, 84(2), 487–515. [Google Scholar] [CrossRef] [PubMed]
- Selvaganapathy, P. R.; Carlen, E. T.; Mastrangelo, C. H. Recent Progress in Microfluidic Devices for Nucleic Acid and Antibody Assays. Proc. IEEE 2003, 91(6), 954–975. [Google Scholar] [CrossRef]
- Parsa, H.; Chin, C. D.; Mongkolwisetwara, P.; Lee, B. W.; Wang, J. J.; Sia, S. K. Effect of Volume- and Time-Based Constraints on Capture of Analytes in Microfluidic Heterogeneous Immunoassays. Lab. Chip 2008, 8(12), 2062–2070. [Google Scholar] [CrossRef] [PubMed]
- Zimmermann, M.; Delamarche, E.; Wolf, M.; Hunziker, P. Modeling and Optimization of High-Sensitivity, Low-Volume Microfluidic-Based Surface Immunoassays. Biomed. Microdevices 2005, 7(2), 99–110. [Google Scholar] [CrossRef] [PubMed]
- Barbosa, A. I.; Castanheira, A. P.; Reis, N. M. Sensitive Optical Detection of Clinically Relevant Biomarkers in Affordable Microfluidic Devices: Overcoming Substrate Diffusion Limitations. Sens. Actuators B Chem. 2018, 258, 313–320. [Google Scholar] [CrossRef]
- From Bodenstein to Péclet – Dimensionless Numbers for Axial Dispersion in Chemical Reactors - Bremer - 2024 - Chemie Ingenieur Technik- Wiley Online Library. Wiley Online Library. Available online: https://onlinelibrary.wiley.com/doi/full/10.1002/cite.202400102 (accessed on 2026-06-22).
- Battersby, S.; Teixeira, P. W.; Beltramini, J.; Duke, M. C.; Rudolph, V.; Diniz da Costa, J. C. An Analysis of the Peclet and Damkohler Numbers for Dehydrogenation Reactions Using Molecular Sieve Silica (MSS) Membrane Reactors. Catal. Today 2006, 116(1), 12–17. [Google Scholar] [CrossRef]
- Mauri, R. Dispersion, Convection, and Reaction in Porous Media. Phys. Fluids Fluid Dyn. 1991, 3(5), 743–756. [Google Scholar] [CrossRef]
- Frank-Kamenetskii, D. A. Diffusion and Heat Exchange in Chemical Kinetics; Princeton University Press, 2015. [Google Scholar]
- Doi, K.; Kise, R.; Shimizume, K.; Yanagawa, M.; Inoue, A. A Luminescent Calcium Biosensor Enabling Endpoint Measurement of GPCR-Mediated Calcium Signaling. Commun. Biol. 2026, 9(1), 695. [Google Scholar] [CrossRef] [PubMed]
- Shakor, M. Y.; Khaleel, M. I. Recent Advances in Big Medical Image Data Analysis Through Deep Learning and Cloud Computing. Electronics 2024, 13(24), 4860. [Google Scholar] [CrossRef]
- Xu, Y.; Khan, T. M.; Song, Y.; Meijering, E. Edge Deep Learning in Computer Vision and Medical Diagnostics: A Comprehensive Survey. Artif. Intell. Rev. 2025, 58(3), 93. [Google Scholar] [CrossRef]
- Smartphones as a platform for molecular analysis: concepts, methods, devices and future potential - Lab on a Chip (RSC Publishing) DOI:10.1039/D4LC00966E. Available online: https://pubs.rsc.org/en/content/articlehtml/2025/lc/d4lc00966e (accessed on 2026-06-22).
- Fushimi, R.; Gleaves, J. Recent Advances in Dynamic Chemical Characterization Using Temporal Analysis of Products. Curr. Opin. Chem. Eng. 2018, 21, 10–21. [Google Scholar] [CrossRef]
- Tracking motion trajectories of individual nanoparticles using time-resolved current traces - Chemical Science (RSC Publishing) DOI:10.1039/C6SC04582K. Available online: https://pubs.rsc.org/en/content/articlehtml/2016/sc/c6sc04582k (accessed on 2026-06-22).
- De Crescenzo, G.; Boucher, C.; Durocher, Y.; Jolicoeur, M. Kinetic Characterization by Surface Plasmon Resonance-Based Biosensors: Principle and Emerging Trends. Cell. Mol. Bioeng. 2008, 1(4), 204–215. [Google Scholar] [CrossRef]
- Fang, S.; Lee, H. J.; Wark, A. W.; Kim, H. M.; Corn, R. M. Determination of Ribonuclease H Surface Enzyme Kinetics by Surface Plasmon Resonance Imaging and Surface Plasmon Fluorescence Spectroscopy. Anal. Chem. 2005, 77(20), 6528–6534. [Google Scholar] [CrossRef] [PubMed]
- Phillips, K. S.; Cheng, Q. Recent Advances in Surface Plasmon Resonance Based Techniques for Bioanalysis. Anal. Bioanal. Chem. 2007, 387(5), 1831–1840. [Google Scholar] [CrossRef] [PubMed]
- Aguet, F.; Antonescu, C. N.; Mettlen, M.; Schmid, S. L.; Danuser, G. Advances in Analysis of Low Signal-to-Noise Images Link Dynamin and AP2 to the Functions of an Endocytic Checkpoint. Dev. Cell 2013, 26(3), 279–291. [Google Scholar] [CrossRef] [PubMed]
- Nie, S.; Chiu, D. T.; Zare, R. N. Probing Individual Molecules with Confocal Fluorescence Microscopy. Science 1994, 266(5187), 1018–1021. [Google Scholar] [CrossRef] [PubMed]
- Spegazzini, N.; Barman, I.; Dingari, N. C.; Pandey, R.; Soares, J. S.; Ozaki, Y.; Dasari, R. R. Spectroscopic Approach for Dynamic Bioanalyte Tracking with Minimal Concentration Information. Sci. Rep. 2014, 4(1), 7013. [Google Scholar] [CrossRef] [PubMed]
- Peshin, S.; Golden, J.; Gan, B.; Mast, C.; Kulinsky, L. Controlling the Advancement of the Liquid Front of the Nitrocellulose Membrane Assay under the Influence of the Centrifugal Force on the Lab-on-a-Disc Platform. Sens. Actuators B Chem. 2023, 386, 133735. [Google Scholar] [CrossRef]
- Materials for Fluorescence Resonance Energy Transfer Analysis: Beyond Traditional Donor–Acceptor Combinations - Sapsford - 2006 - Angewandte Chemie International Edition. Wiley Online Library. Available online: https://onlinelibrary.wiley.com/doi/abs/10.1002/anie.200503873 (accessed on 2026-06-22).
Disclaimer/Publisher’s Note: The statements, opinions and data contained in all publications are solely those of the individual author(s) and contributor(s) and not of MDPI and/or the editor(s). MDPI and/or the editor(s) disclaim responsibility for any injury to people or property resulting from any ideas, methods, instructions or products referred to in the content. |
© 2026 by the authors. Licensee MDPI, Basel, Switzerland. This article is an open access article distributed under the terms and conditions of the Creative Commons Attribution (CC BY) license (http://creativecommons.org/licenses/by/4.0/).
Copyright: This open access article is published under a Creative Commons CC BY 4.0 license, which permit the free download, distribution, and reuse, provided that the author and preprint are cited in any reuse.


