

Submitted:
27 June 2026
Posted:
29 June 2026
You are already at the latest version
Abstract
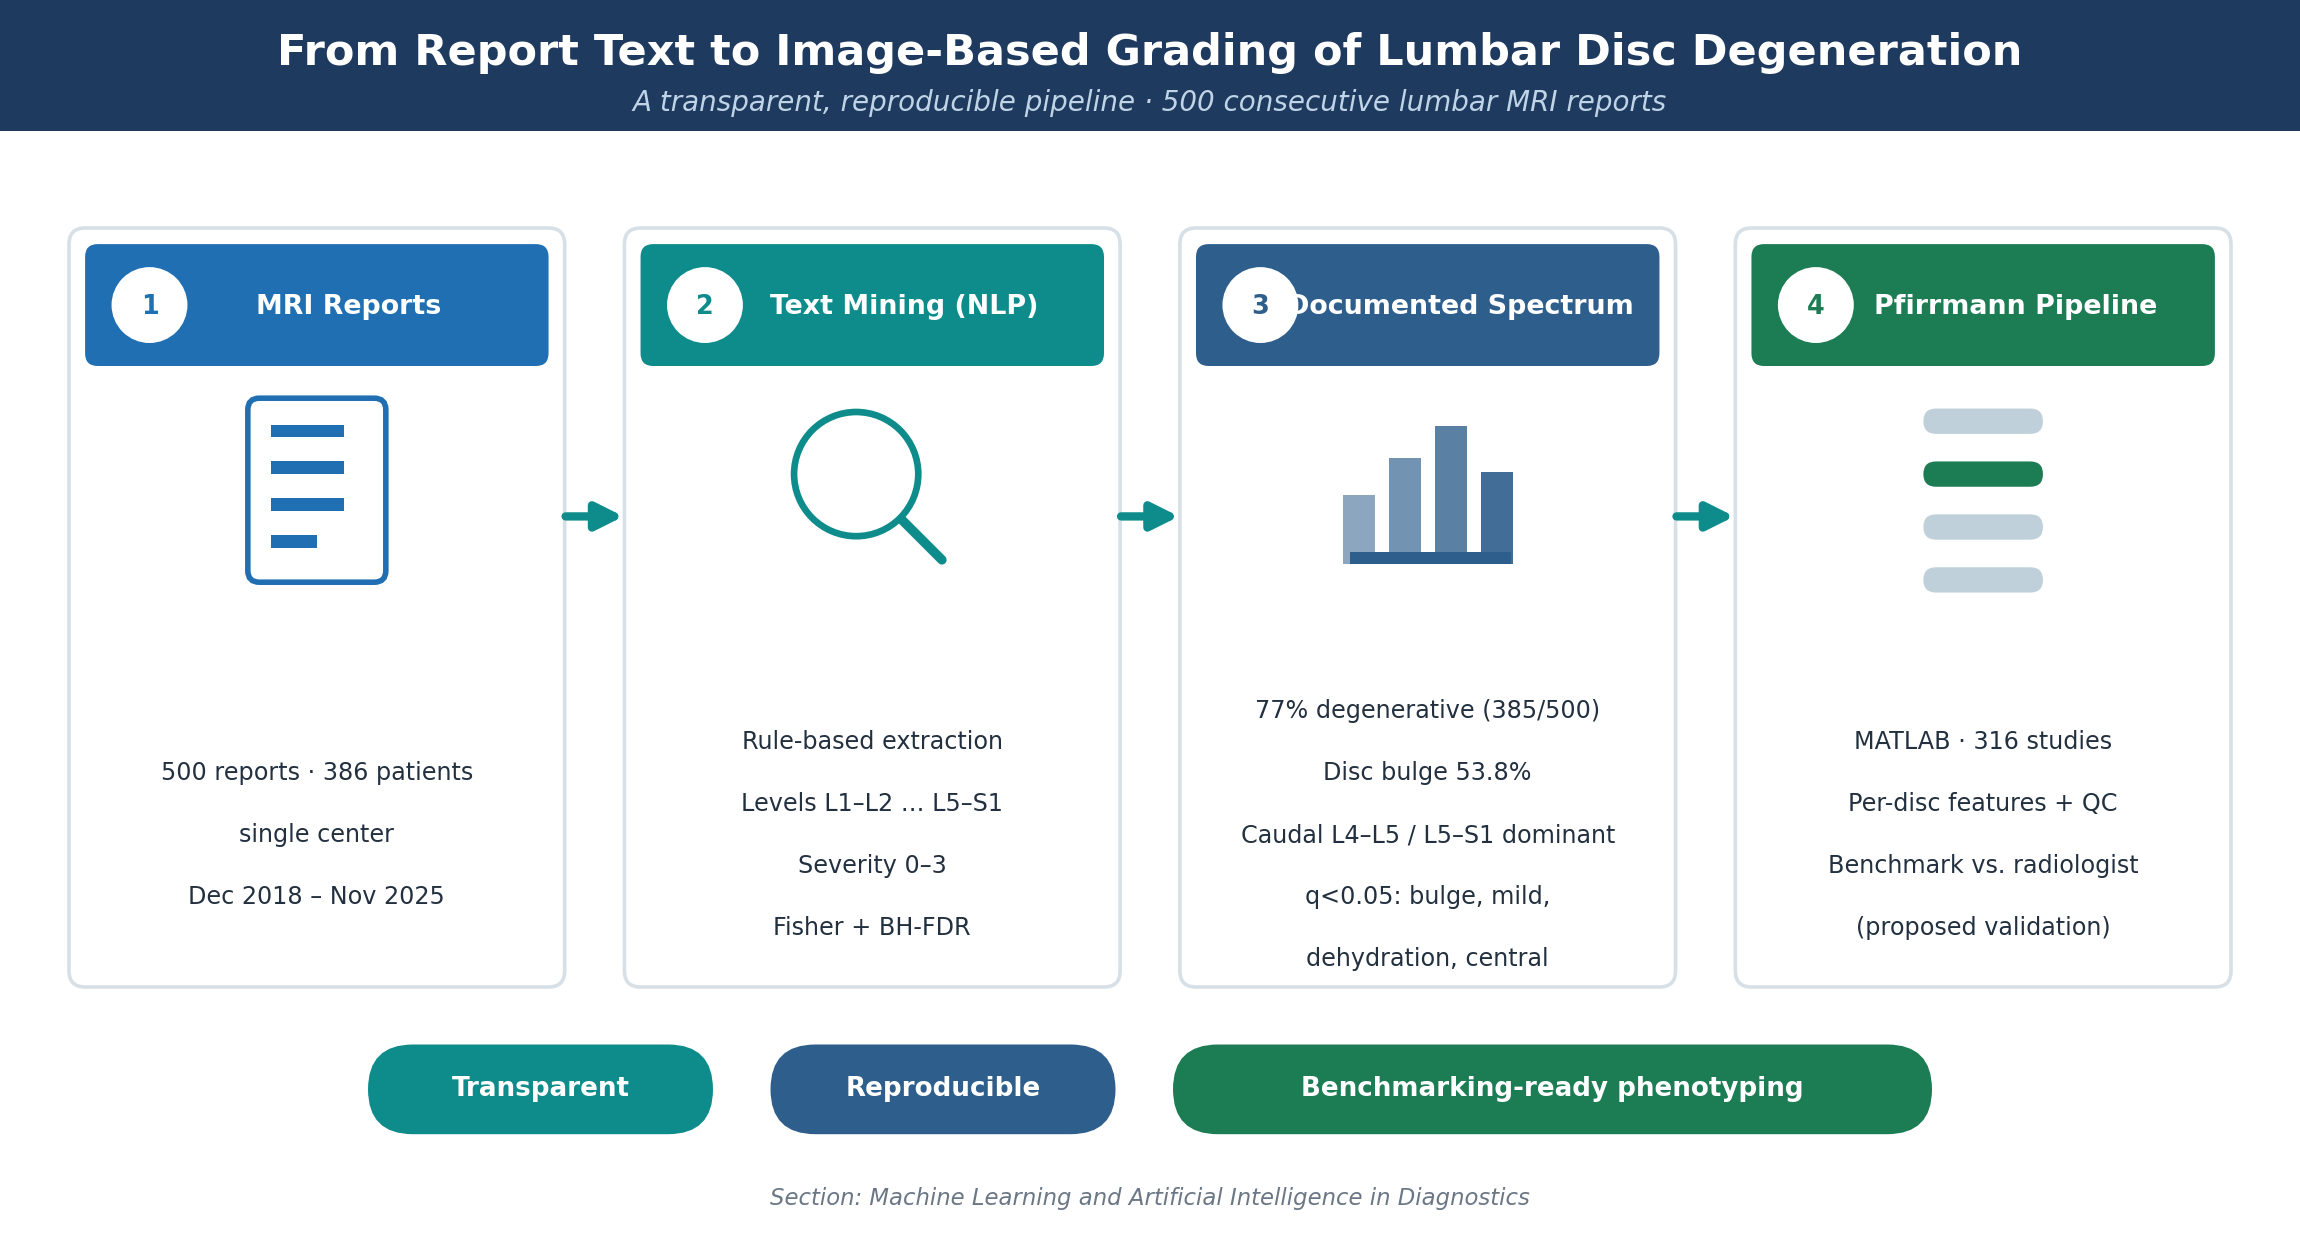
Purpose: To characterize the documented spectrum of degenerative lumbar spine disease across 500 consecutive magnetic resonance imaging (MRI) radiology reports using a transparent, reproducible text-extraction pipeline, to quantify which descriptors distinguish reports retained for degenerative analysis from those excluded, and to develop a reproducible image-based assessment pipeline that derives per-disc imaging features for benchmarking against radiologist Pfirrmann grading. Methods: We analyzed 500 lumbar MRI reports (386 unique patients; December 2018 to November 2025). Reports were screened against degenerative-disease eligibility criteria. From each report we extracted morphological and severity keywords, explicit segmental level mentions (L1–L2 to L5–S1), Modic-change mentions, and an ordinal degeneration severity (0–3) derived by a published rule set. Field completeness was quantified. Differences in keyword prevalence between included and excluded reports were tested with the Fisher exact test, with Benjamini–Hochberg control of the false discovery rate (FDR). A complementary MATLAB image-processing pipeline was executed across 316 studies to derive per-disc imaging features (predicted Pfirrmann grade, normalized disc height, T2 signal index, severity and quality control) for benchmarking against radiologist Pfirrmann grading. Results: 385 of 500 reports (77.0%) met inclusion criteria; exclusions were predominantly trauma/fracture (58/115) and prior surgery (38/115). Narrative fields were complete, but the structured morphological-keyword field was missing in 49.4% of records. Disc bulge was the dominant descriptor (53.8%), followed by mild (27.5%), stenosis (18.7%) and severe (16.4%). The lower segments L4–L5 (27.0%) and L5–S1 (28.4%) dominated level mentions. After FDR correction, bulge, mild, dehydration and central were significantly enriched among included reports (all q < 0.05). Derived severity was broadly balanced (report-level: 28.0% none, 30.2% mild, 19.8% moderate, 22.0% severe). Conclusions: Free-text lumbar MRI reports encode a recognizable but heterogeneous degenerative vocabulary that is sufficient for cohort construction yet inconsistent for quantitative grading. The text-derived severity is reasonable but should be regarded as a noisy proxy; we therefore developed and executed a reproducible image-based assessment pipeline, deriving per-disc features and quality control across 316 studies; benchmarking these outputs against an adjudicated Pfirrmann gold standard is the immediate next step toward clinically defensible, image-based phenotyping.
Keywords:
lumbar spine
; intervertebral disc degeneration
; radiology reports
; natural language processing
; Pfirrmann grading
; imaging biomarkers
; radiomics
; reproducibility
; Modic changes
1. Introduction
Low back pain is the single largest contributor to years lived with disability worldwide, affecting an estimated 619 million people in 2020 and projected to exceed 800 million prevalent cases by 2050 [1]. Even after three decades of declining age-standardized rates, the absolute burden continues to rise with population growth and aging [1,2]. Magnetic resonance imaging (MRI) is the reference modality for evaluating the degenerative lumbar spine, because it depicts disc hydration, height, herniation, endplate (Modic) change and canal or foraminal compromise without ionizing radiation. Yet degenerative findings are highly prevalent in asymptomatic individuals as well, and their association with symptoms is graded rather than categorical [3,4]. This weak and level-dependent imaging–symptom coupling is precisely why standardized, reproducible phenotyping of the lumbar spine remains an unmet need.
The Pfirrmann classification is the most widely used grading system for disc degeneration on T2-weighted images, and independent studies confirm substantial-to-excellent inter- and intra-observer agreement when it is applied with a defined algorithm [5,6]. Refinements such as the modified eight-grade Pfirrmann scheme and recent morphometric systems improve discrimination, particularly in the elderly or severely degenerated disc, but they remain qualitative and reader-dependent [7,8]. Consequently, two complementary lines of work have emerged. The first applies natural language processing (NLP) to the radiology report itself, converting unstructured narrative into structured, mineable variables for epidemiology, quality assurance and cohort building [15,16,17]. The second applies deep learning directly to the images, automating vertebral segmentation, disc localization and Pfirrmann or stenosis grading at scale [9,10,11,12,13,14].
Both lines have characteristic failure modes that bear directly on the present study. Report-based NLP inherits the variability of human dictation: the same disc may be called a “bulge,” a “protrusion” or “desiccated,” severity adjectives are applied inconsistently, and not every level is enumerated in every report [15,16]. External validation of report-based models routinely shows a performance drop, underscoring that report language is an imperfect reference standard [17]. Image-based models, conversely, are sensitive to acquisition protocol, scanner and reconstruction, which is the same reproducibility problem documented extensively in the radiomics literature and addressed through standardization and harmonization [21,22,23,24,25]. A defensible phenotyping workflow must therefore make its extraction rules explicit, quantify its own data completeness, and validate text-derived labels against an image-based reference under transparent reporting standards [26,27].
Structured-reporting data mining has been shown to yield valid epidemiological description in other domains, such as urolithiasis, when the underlying fields are consistently populated [20]. Whether free-text lumbar MRI reports, as they exist in routine archives, carry sufficient and sufficiently consistent degenerative signal to support both descriptive epidemiology and downstream image validation has not been systematically described for a consecutive single-center cohort.
We therefore pursued three aims. First, to describe the documented spectrum of degenerative lumbar disease across 500 consecutive MRI reports using a transparent, rule-based extraction pipeline, reporting cohort accounting, field completeness, keyword prevalence, segmental involvement and a derived ordinal severity at both report and patient level. Second, to test inferentially which descriptors distinguish reports retained for degenerative analysis from those excluded, using the Fisher exact test with false-discovery-rate control. Third, to specify in full and reproducibly an image-based validation framework, including a sequence diagram of the analysis code, so that the text-derived labels can be benchmarked against radiologist Pfirrmann grading in subsequent work. We frame the imaging pipeline explicitly as a proposed and not-yet-executed validation step, with expected performance ranges drawn from the external-validation literature rather than from our own images.
2. Materials and Methods
2.1. Study Design and Data Source
This was a single-center, retrospective, descriptive study of consecutive lumbar spine MRI radiology reports. The source dataset comprised 500 extracted report rows corresponding to 386 unique patients, with report dates spanning 24 December 2018 to 25 November 2025. The unit of analysis was the report (one row = one report); patient-level summaries were produced by aggregation where indicated. Reporting follows the STROBE framework for observational studies; the prospective elements of the proposed imaging sub-study are aligned to the Checklist for Artificial Intelligence in Medical Imaging (CLAIM) and to general guidance on the design and reporting of model-versus-clinician comparisons [26,27].
2.2. Eligibility Criteria
Reports were eligible (“included”) when the primary documented process was degenerative lumbar disease. Reports were excluded when the dominant finding was trauma or fracture, when the study was post-operative (prior instrumentation or laminectomy), when there was active or prior infection, or when the study was normal or described a non-degenerative, non-lumbar or otherwise out-of-scope pathology. Exclusion reasons were captured verbatim and then mapped to four mutually exclusive primary categories by a deterministic priority rule (trauma/fracture > prior surgery > infection > non-degenerative/normal/other).
2.3. Data Extraction and Variables
From each report we extracted: patient identifier and report date (join keys); age and sex where recorded; a free-text morphological keyword field (benchmark); the source context/level narrative; the primary clinical-findings narrative; documented Modic-change status; and inclusion/exclusion status. Two families of derived variables were generated by deterministic text rules. (i) Segmental involvement: for each level L1–L2, L2–L3, L3–L4, L4–L5 and L5–S1, a Boolean indicating explicit mention, plus a per-report count of enumerated levels. (ii) Morphological/severity keyword flags (for example bulge, protrusion, herniation, extrusion, dehydration, stenosis, spondylolisthesis, foraminal, central, facet, Modic and the severity adjectives mild/moderate/severe).
2.4. Derived Ordinal Severity (Transparent Rule Set)
To enable a balanced, reproducible severity description, text from the morphological-keyword, level-context and primary-findings fields was combined and mapped to an ordinal scale by the following published rule set:
- Grade 0 (none/normal): normal height and signal, no degenerative descriptor.
- Grade 1 (mild): disc bulge or diffuse bulge.
- Grade 2 (moderate): protrusion, annular tear/fissure, disc dehydration/desiccation, or loss/reduction of disc height.
- Grade 3 (severe): extrusion, sequestration, severe/marked degeneration, canal stenosis, or nerve-root compression.
Where several descriptors co-occurred in one report, the highest applicable grade was assigned (worst-level convention). The mapping is intentionally simple and auditable; as detailed in Section 2.6, it is treated as a candidate label requiring image-based validation rather than as a clinical ground truth [5,8].
2.5. Statistical Analysis
Descriptive statistics are reported as counts and percentages for categorical variables and as mean (standard deviation, SD), median and interquartile range (IQR) for continuous variables. Field completeness is expressed as the percentage of missing values per variable. To identify descriptors that differ between included and excluded reports, each keyword was cross tabulated by inclusion status and tested with the two-sided Fisher exact test [28]. Because fifteen keywords were tested simultaneously, p-values were adjusted by the Benjamini–Hochberg procedure controlling the false discovery rate (FDR) [29]. For an ordered list of p-values p(1) ≤ … ≤ p(m), the largest rank k for which p(k) ≤ (k/m)·α defines the rejection threshold; q-values are the corresponding adjusted p-values and significance was declared at q < 0.05. For each keyword we additionally report the risk difference (inclusion rate minus exclusion rate) and the odds ratio (OR) with its 95% confidence interval; the four FDR-significant descriptors have intervals that exclude 1.
For the proposed image-based validation (Section 2.6), the pre-specified primary agreement metric is the quadratic-weighted Cohen κ [30] between image-derived and radiologist Pfirrmann grades, defined as κ = 1 - (Σ wij Oij)/(Σ wij Eij), with quadratic weights wij = (i - j)2/(G - 1)2 for a G-category scale, O the observed and E the expected (chance) agreement matrices. Secondary metrics are the confusion matrix, within-one-grade accuracy, macro-F1, receiver-operating-characteristic and precision–recall area under the curve (AUC) for clinically actionable thresholds (moderate-or-worse, severe), and Spearman ρ between continuous imaging features and the report-derived severity, each with 95% confidence intervals obtained by bootstrap. All analyses were performed in Python (descriptive and inferential statistics) and MATLAB (image feature extraction).
2.6. Image-Based Validation Pipeline and Pending Agreement Analysis
To move from text-derived labels toward image-based phenotyping, we developed a two-stage MATLAB pipeline that is directly joinable to the report dataset on patient identifier and report date. The first script, run_lumbar_validation_export.m, reads DICOM studies grouped by StudyInstanceUID, automatically selects the mid-sagittal slice using a symmetry criterion, and presents that slice to an operator who clicks the disc centers L1–L2 through L5–S1 (a fast human-in-the-loop step that makes labeling robust). It then extracts per-level features disc height in pixels, a raw T2 signal index, and a quality-control flag normalizes heights and signals within each study and emits a heuristic per-disc severity proxy (0–3). The second script, export_study_level_summary.m, aggregates the disc-level export to one row per study (maximum and mean severity, an any-moderate-or-worse flag, minimum/maximum/mean of the normalized height and signal, a continuous degeneration-burden score, and a study-level QC pass flag). The study-level table is then joined to the report-derived labels and the agreement metrics of Section 2.5 are computed, with results stratified by QC status to reflect deployable performance. Figure 11 provides the sequence diagram of this workflow.
This pipeline was executed across 316 studies to produce the per-disc imaging features and quality-control overlays reported in Section 3.8. The formal agreement analysis against an adjudicated per-level Pfirrmann reference standard has not yet been performed; accordingly, the anticipated performance ranges (Section 4 and Table 5) are taken from external-validation studies of comparable open models rather than from our own data, in order to avoid presenting expected values as observed ones [11,12,17].
2.7. Ethics and Data Governance
All direct patient identifiers (names) present in the source extract were removed prior to analysis; only a non-identifying study key (patient code and report date) was retained for the planned image–text join. The study used existing radiology reports and did not alter clinical care. Institutional review board/ethics approval reference and the data-availability statement are documented in the Declarations section in accordance with the target journal’s policy.
3. Results
3.1. Cohort Accounting and Completeness
Of 500 extracted reports, 385 (77.0%) met the degenerative-disease inclusion criteria and 115 (23.0%) were excluded (Figure 1, Table 1). The 500 reports represented 386 unique patients; 295 unique patients contributed at least one included report. Most patients contributed a single report (313/386), with 48, 9 and 16 patients contributing two, three and four reports respectively. Exclusions were dominated by trauma or fracture (58/115, 50.4%) and prior spinal surgery (38/115, 33.0%), followed by non-degenerative/normal studies (11/115, 9.6%) and infection (8/115, 7.0%) (Figure 2).
Narrative and status fields were complete: source context/level, primary clinical findings, Modic-change status and inclusion/exclusion status each had 0% missingness. By contrast, the structured morphological-keyword (benchmark) field was missing in 49.4% of records, and a numeric age was unavailable in 16.4% (many age/sex fields contained only “M” or “F”) (Table 2, Figure 3). The dataset is thus strong on narrative content but weak on a consistently populated structured morphology label the central motivation for downstream standardization and image-based quantification.
Reports were unevenly distributed across the study window, concentrated in 2020 (n = 162), 2025 (n = 155), 2024 (n = 93) and 2023 (n = 67) (Figure 4). This temporal heterogeneity is relevant because scanner upgrades, protocol revisions and reporting-style drift across years can confound any later modeling, and motivates the QC-stratified validation described in Section 2.6.
3.2. Demographics
Among reports with a parseable age (n = 418), mean age was 46.7 years (SD 14.5; median 48; IQR 37–56; range up to 93). The report-level sex distribution was 51.8% female and 48.2% male; at patient level it was 52.3% female and 47.7% male, consistent with the recognized female preponderance of symptomatic lumbar degeneration [1]. The age distribution peaked in the fifth and sixth decades (Figure 5a).
3.3. Prevalence of Text-Derived Descriptors
Within included reports, disc bulge was by far the most frequent descriptor (53.8%), followed by the severity adjective mild (27.5%), stenosis (18.7%), severe (16.4%), dehydration (14.8%), protrusion (13.2%) and central (13.2%) (Table 3, Figure 6). Lower-prevalence terms included moderate (10.4%), herniation (6.2%), spondylolisthesis (4.7%), facet (4.4%), foraminal (1.3%), extrusion (1.0%), and Modic and height-loss (0.5% each). The vocabulary therefore mixes morphology, severity and location terms, confirming that report text contains recognizable degenerative terminology but in a heterogeneous, non-quantitative form.
3.4. Descriptors Distinguishing Included from Excluded Reports
Fisher exact testing with Benjamini–Hochberg FDR control identified four descriptors significantly enriched among included relative to excluded reports (Table 3, Figure 7): bulge (53.8% vs 14.8%; risk difference 39.0 percentage points; OR 6.7; q < 0.001), mild (27.5% vs 7.0%; OR 5.08; q < 0.001), dehydration (14.8% vs 1.7%; OR 9.82; q < 0.001) and central (13.2% vs 1.7%; OR 8.63; q < 0.001). Several descriptors showed nominal but non-significant enrichment after correction, including spondylolisthesis (q = 0.054), moderate (q = 0.058), protrusion (q = 0.097) and stenosis (q = 0.126). The severity adjective severe did not differ between groups (16.4% vs 14.8%; q = 0.83), consistent with severe language appearing in both degenerative and non-degenerative (e.g., traumatic) reports. Inclusion status is therefore not random with respect to report language, which has implications for selection bias in any text-defined cohort.
3.5. Segmental Involvement
Level mentions were strongly concentrated at the two caudal segments: L5–S1 (28.4% of reports) and L4–L5 (27.0%), followed by L3–L4 (7.0%), L2–L3 (1.8%) and L1–L2 (0.6%); the patient-level pattern was essentially identical (Figure 8). This caudal predominance is concordant with the established topography of lumbar degeneration and Modic change [3,4]. Within included reports the mean number of explicitly enumerated levels was 2.84 (SD 1.39; median 3; IQR 2–4; maximum 7), indicating that multilevel disease is commonly described but that the comprehensiveness of level enumeration varies between reports (Figure 9). At report level, 46.2% enumerated no specific level token, 43.2% one, 10.2% two and 0.4% three, reflecting heterogeneous reporting granularity rather than absence of disease.
3.6. Derived Severity Distribution
The rule-based ordinal severity was reasonably balanced. At report level (n = 500) the distribution was grade 0 28.0% (n = 140), grade 1 30.2% (n = 151), grade 2 19.8% (n = 99) and grade 3 22.0% (n = 110). At patient level (maximum severity per patient, n = 386) it was 26.2% none, 29.3% mild, 19.9% moderate and 24.6% severe (Figure 10). Mean patient age increased with maximum severity in a clinically plausible, non-monotonic pattern grade 0, 47.5 years; grade 1, 42.6; grade 2, 43.1; grade 3, 52.1 years consistent with the highest-grade (severe) phenotype being associated with older age (Figure 5b). The balance of the derived scale makes it suitable as a candidate label for the image-based validation described below, while its reliance on report wording is the reason validation is required.
3.7. Modic-Change Documentation
Modic changes were explicitly mentioned in 9.0% of reports (45/500) and in 9.6% of patients (37/386). This documented prevalence is consistent with population-based estimates of MRI Modic change and reinforces that endplate signal change, although clinically relevant, is inconsistently transcribed in routine reports and is a natural target for image-based detection [4].
3.8. Image-Based Pipeline Output and Quality Control Across the Cohort
The image-based pipeline described in Section 2.6 was executed across 316 studies. For each study it produced a per-disc record detection confidence, normalized disc height, T2 signal index, predicted Pfirrmann grade, ordinal severity (0–3), bulge magnitude and a Modic ratio rendered as a per-study quality-control (QC) overlay. A representative de-identified overlay is shown in Figure 12: a header summarizing inclusion status, report–imaging match and QC; a per-level biomarker table; a schematic L1–S1 column; and the mid-sagittal T2 with anchored disc markers. The deployable validation set comprises studies that both pass per-level disc-detection QC and are matched to a contemporaneous report within the time window; studies with a per-level QC failure or without a matched report are gated out, so that any reported performance reflects deployable rather than best-case behavior.
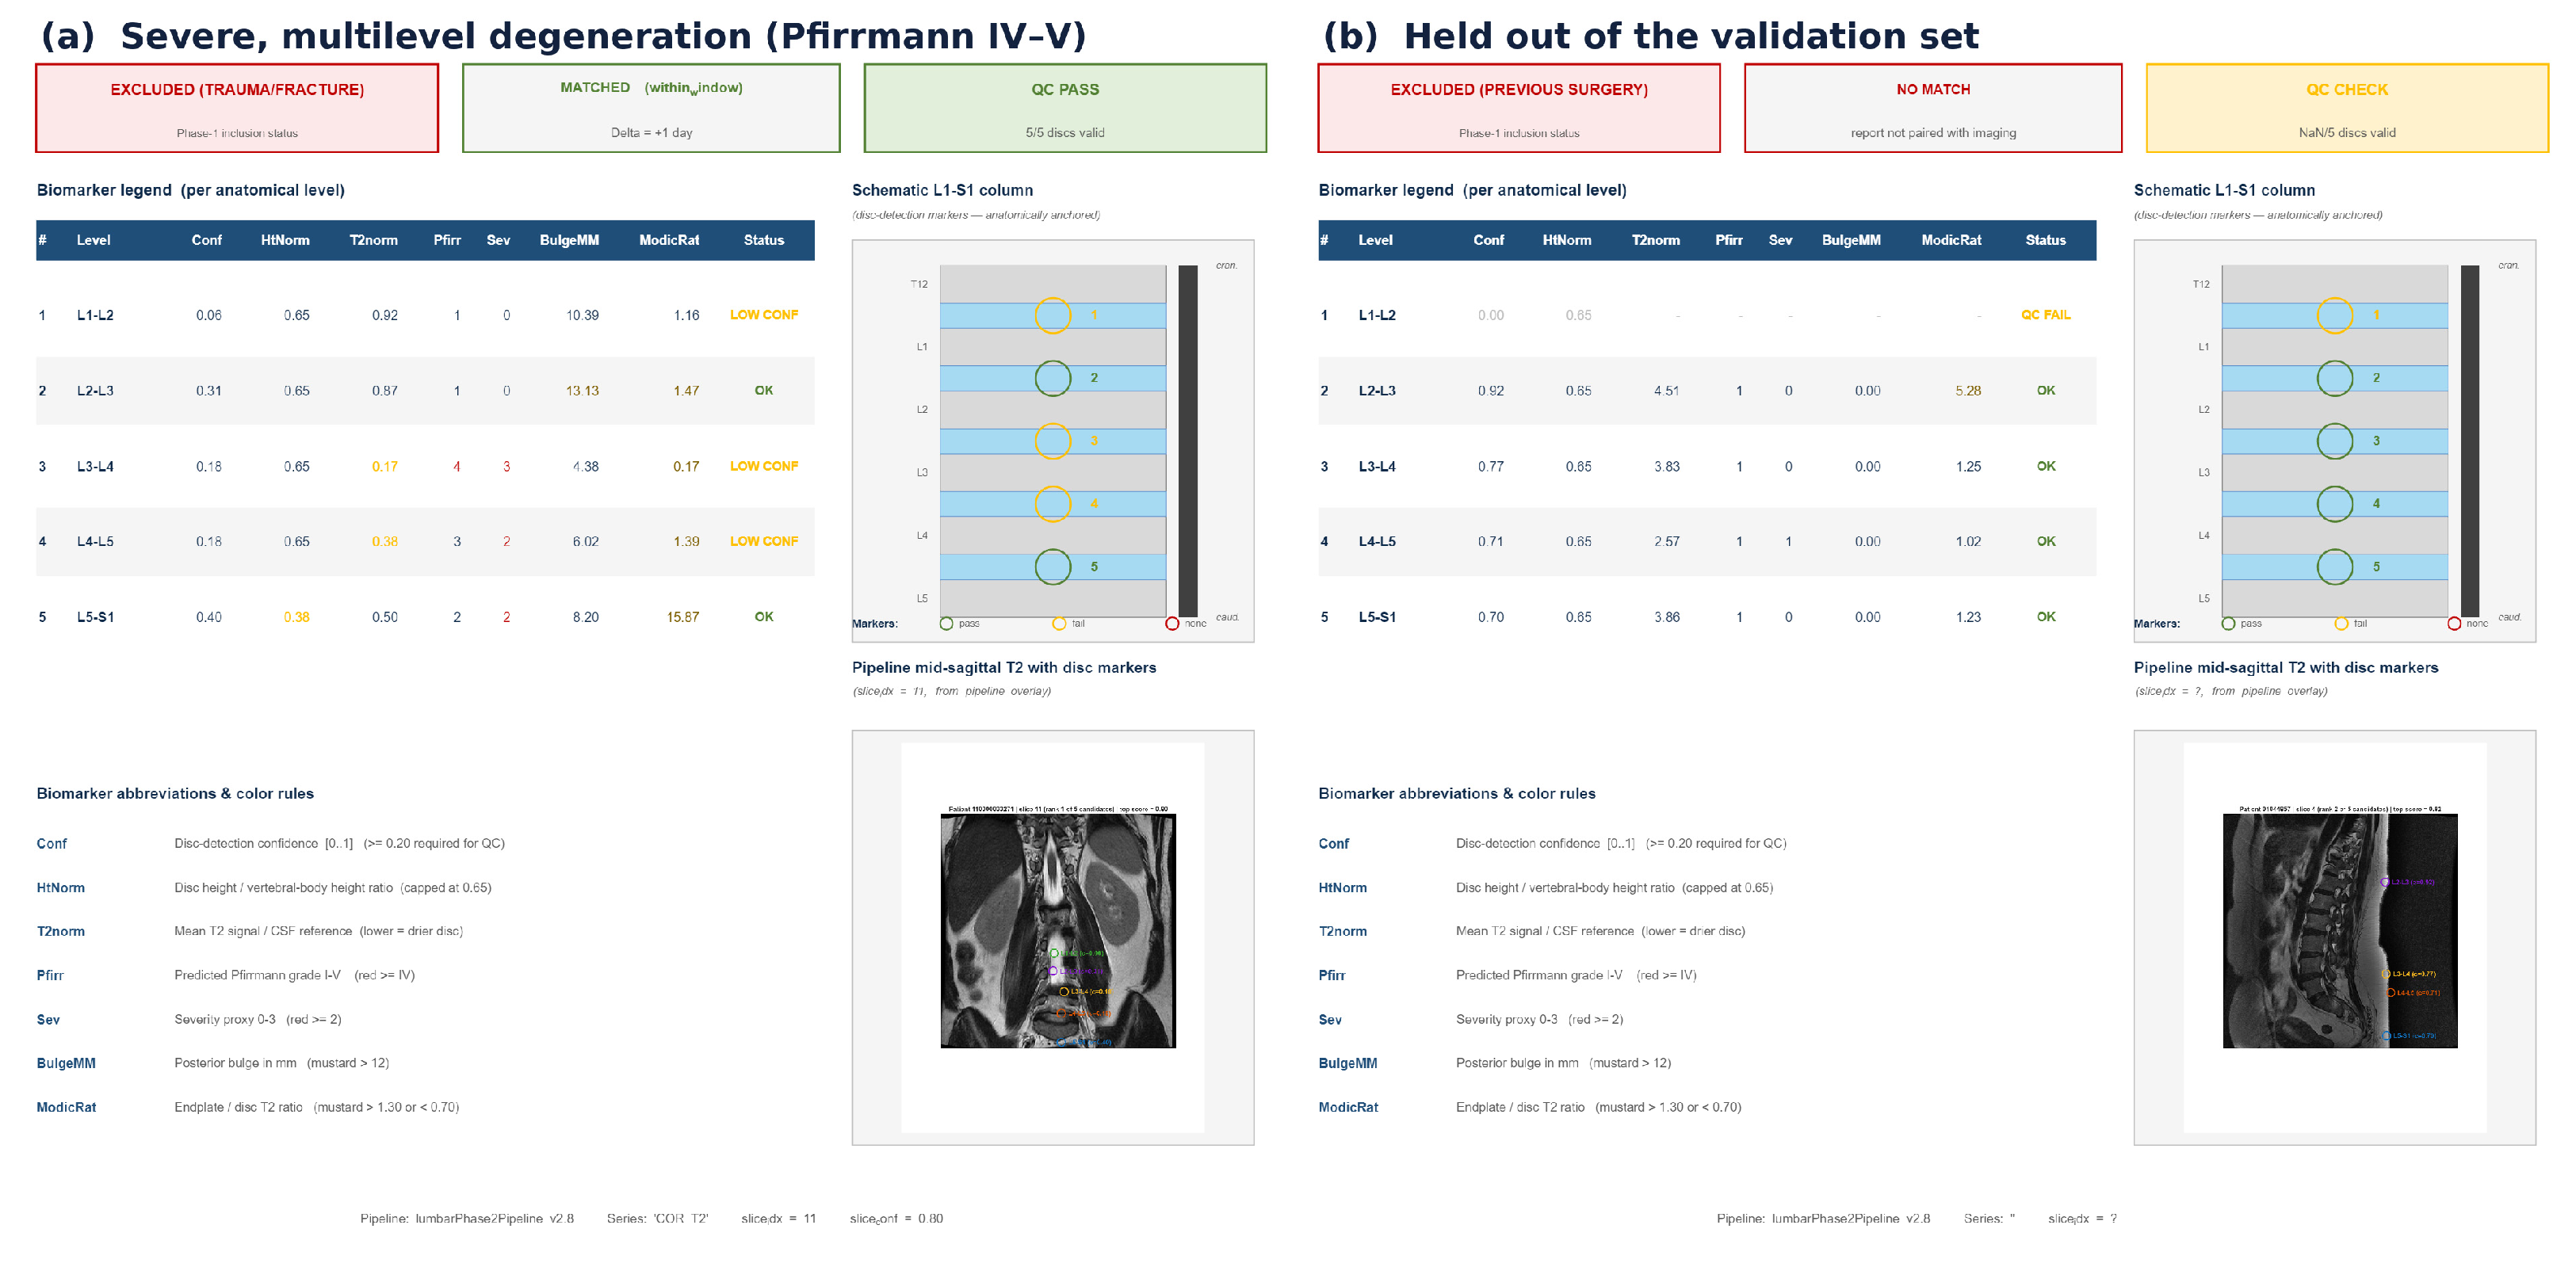
Across the cohort the overlays span the full degenerative range and make the gating that defines the validation set auditable (Figure 13). The pipeline assigns high predicted Pfirrmann grades and severities to studies with marked, multilevel degeneration (Figure 13a), confirming that it grades advanced disease rather than only normal discs; conversely, a study that fails a per-level QC check or cannot be paired with a contemporaneous report is held out of the deployable validation set (Figure 13b). Presenting QC- and match-stratified outputs in this way, rather than a single pooled figure, follows the QC-stratified reporting principle adopted throughout (Section 2.6) and keeps the exclusion logic transparent.
These per-disc outputs are the direct input to the agreement analysis pre-specified in Section 2.5. The remaining step is to compute that agreement against an adjudicated, per-level Pfirrmann reference standard; because that gold set is not yet available, no agreement statistic is reported here. Pre-specified expectations, taken from external-validation studies of comparable open models rather than from our own data, are summarized in Table 5 [11,12,17].

Table 4.
Derived degeneration severity (0–3) at report and patient level.
| Severity grade | Report n | Report % | Patient % |
|---|---|---|---|
| 0 – none/normal | 140 | 28.0 | 26.2 |
| 1 – mild | 151 | 30.2 | 29.3 |
| 2 – moderate | 99 | 19.8 | 19.9 |
| 3 – severe | 110 | 22.0 | 24.6 |
Report-level n = 500; patient-level n = 386 (maximum severity per patient).
Table 5.
Pre-specified expectations for the pending image-based validation (external-validation literature; not measured in this study).
Table 5.
Pre-specified expectations for the pending image-based validation (external-validation literature; not measured in this study).
| Scenario | Expected agreement |
|---|---|
| Image-based grade vs radiologist Pfirrmann | weighted κ ≈ 0.65–0.85 |
| Modic detection (T1/T2 available) | AUC ≈ 0.85–0.95 |
| Image-derived vs text-derived severity (noisy proxy) | weighted κ ≈ 0.35–0.60 |
| Moderate-or-worse threshold | AUC ≈ 0.70–0.85 |
4. Discussion
In a consecutive single-center series of 500 lumbar MRI reports, free-text radiology narratives encoded a recognizable degenerative vocabulary dominated by disc bulge and caudal (L4–L5, L5–S1) involvement that was sufficient to construct a degenerative cohort (385/500) and to derive a balanced ordinal severity, yet was simultaneously heterogeneous, incompletely structured (morphological-keyword field missing in 49.4%) and variable in the comprehensiveness of level enumeration. These two observations signal sufficient for cohorting but insufficient for grading define the central message and the rationale for image-based validation.
The descriptive findings align with the wider literature. The dominance of bulge and the caudal concentration of degeneration reproduce well-established topographic patterns, and the documented Modic prevalence (9–10%) is of the same order as population-based MRI estimates [3,4]. The female preponderance and the rise in mean age for the severe phenotype are likewise concordant with epidemiological data on lumbar degeneration and its disability burden [1,2]. That bulge, mild, dehydration and central were the descriptors most enriched in included versus excluded reports is methodologically important: it demonstrates quantitatively that a text-defined degenerative cohort is a selected sample with respect to language, a selection effect that must be acknowledged whenever report text is used as a filter or label [16,17].
Viewed through a radiomics and imaging-AI lens, the limiting factor is reproducibility rather than availability of signal. The same concerns that the Image Biomarker Standardization Initiative and the reproducibility literature raise for quantitative features sensitivity to acquisition, segmentation and processing apply, in a linguistic form, to report-derived labels: inconsistent vocabulary is the textual analogue of unharmonized feature extraction [21,22]. Two methodological perspectives are therefore essential and are sometimes omitted in report-mining studies. First, harmonization: multi-scanner, multi-protocol and multi-year data such as ours (Figure 4) require explicit harmonization of any downstream imaging features, for which ComBat and its variants are the most validated approach [23,24,25]. Second, segmentation and reference-standard variability: because Pfirrmann grading is itself reader-dependent, the validation reference should be a consensus, adjudicated, per-level grade rather than a single read [5,6,8]. Our proposed pipeline addresses both by exporting QC flags for stratified analysis and by specifying per-level consensus labeling.
The proposed validation framework is deliberately conservative. Rather than report image-derived agreement we did not measure, we anchor expectations to external-validation evidence: open models such as SpineNet achieve weighted κ on the order of 0.65–0.85 against radiologist Pfirrmann grading and balanced accuracy near 78% for disc degeneration and 86% for Modic detection, with agreement falling when the reference is a noisy report-derived label rather than image-based grading [11,12]. Independent comparisons report fair-to-substantial, not perfect, concordance and emphasize ongoing refinement [12]. Realistic targets when validating image-derived outputs against our text-derived severity are therefore moderate: weighted κ roughly 0.35–0.60 and AUC roughly 0.70–0.85 for the moderate-or-worse threshold, improving under QC filtering. Stating these as expectations explicitly distinguished from observed results is consistent with reporting standards that caution against overclaiming model performance [26,27].
The strengths of this work are the transparent and auditable extraction rules, the dual report- and patient-level accounting, the inferential treatment of keyword enrichment with FDR control rather than uncorrected testing, and the full, reproducible specification of the validation code (Figure 11). These choices respond directly to documented weaknesses in imaging-AI and report-mining studies, namely under-reported data handling and absent external validation [17,27].
Figure 11.
Sequence diagram of the image-based validation pipeline (run_lumbar_validation_export.m and export_study_level_summary.m), showing DICOM retrieval, automatic mid-sagittal selection, human-in-the-loop disc labeling, per-level feature extraction and within-study normalization, study-level aggregation, the join with report-derived labels, and computation of QC-stratified agreement metrics.
Figure 11.
Sequence diagram of the image-based validation pipeline (run_lumbar_validation_export.m and export_study_level_summary.m), showing DICOM retrieval, automatic mid-sagittal selection, human-in-the-loop disc labeling, per-level feature extraction and within-study normalization, study-level aggregation, the join with report-derived labels, and computation of QC-stratified agreement metrics.
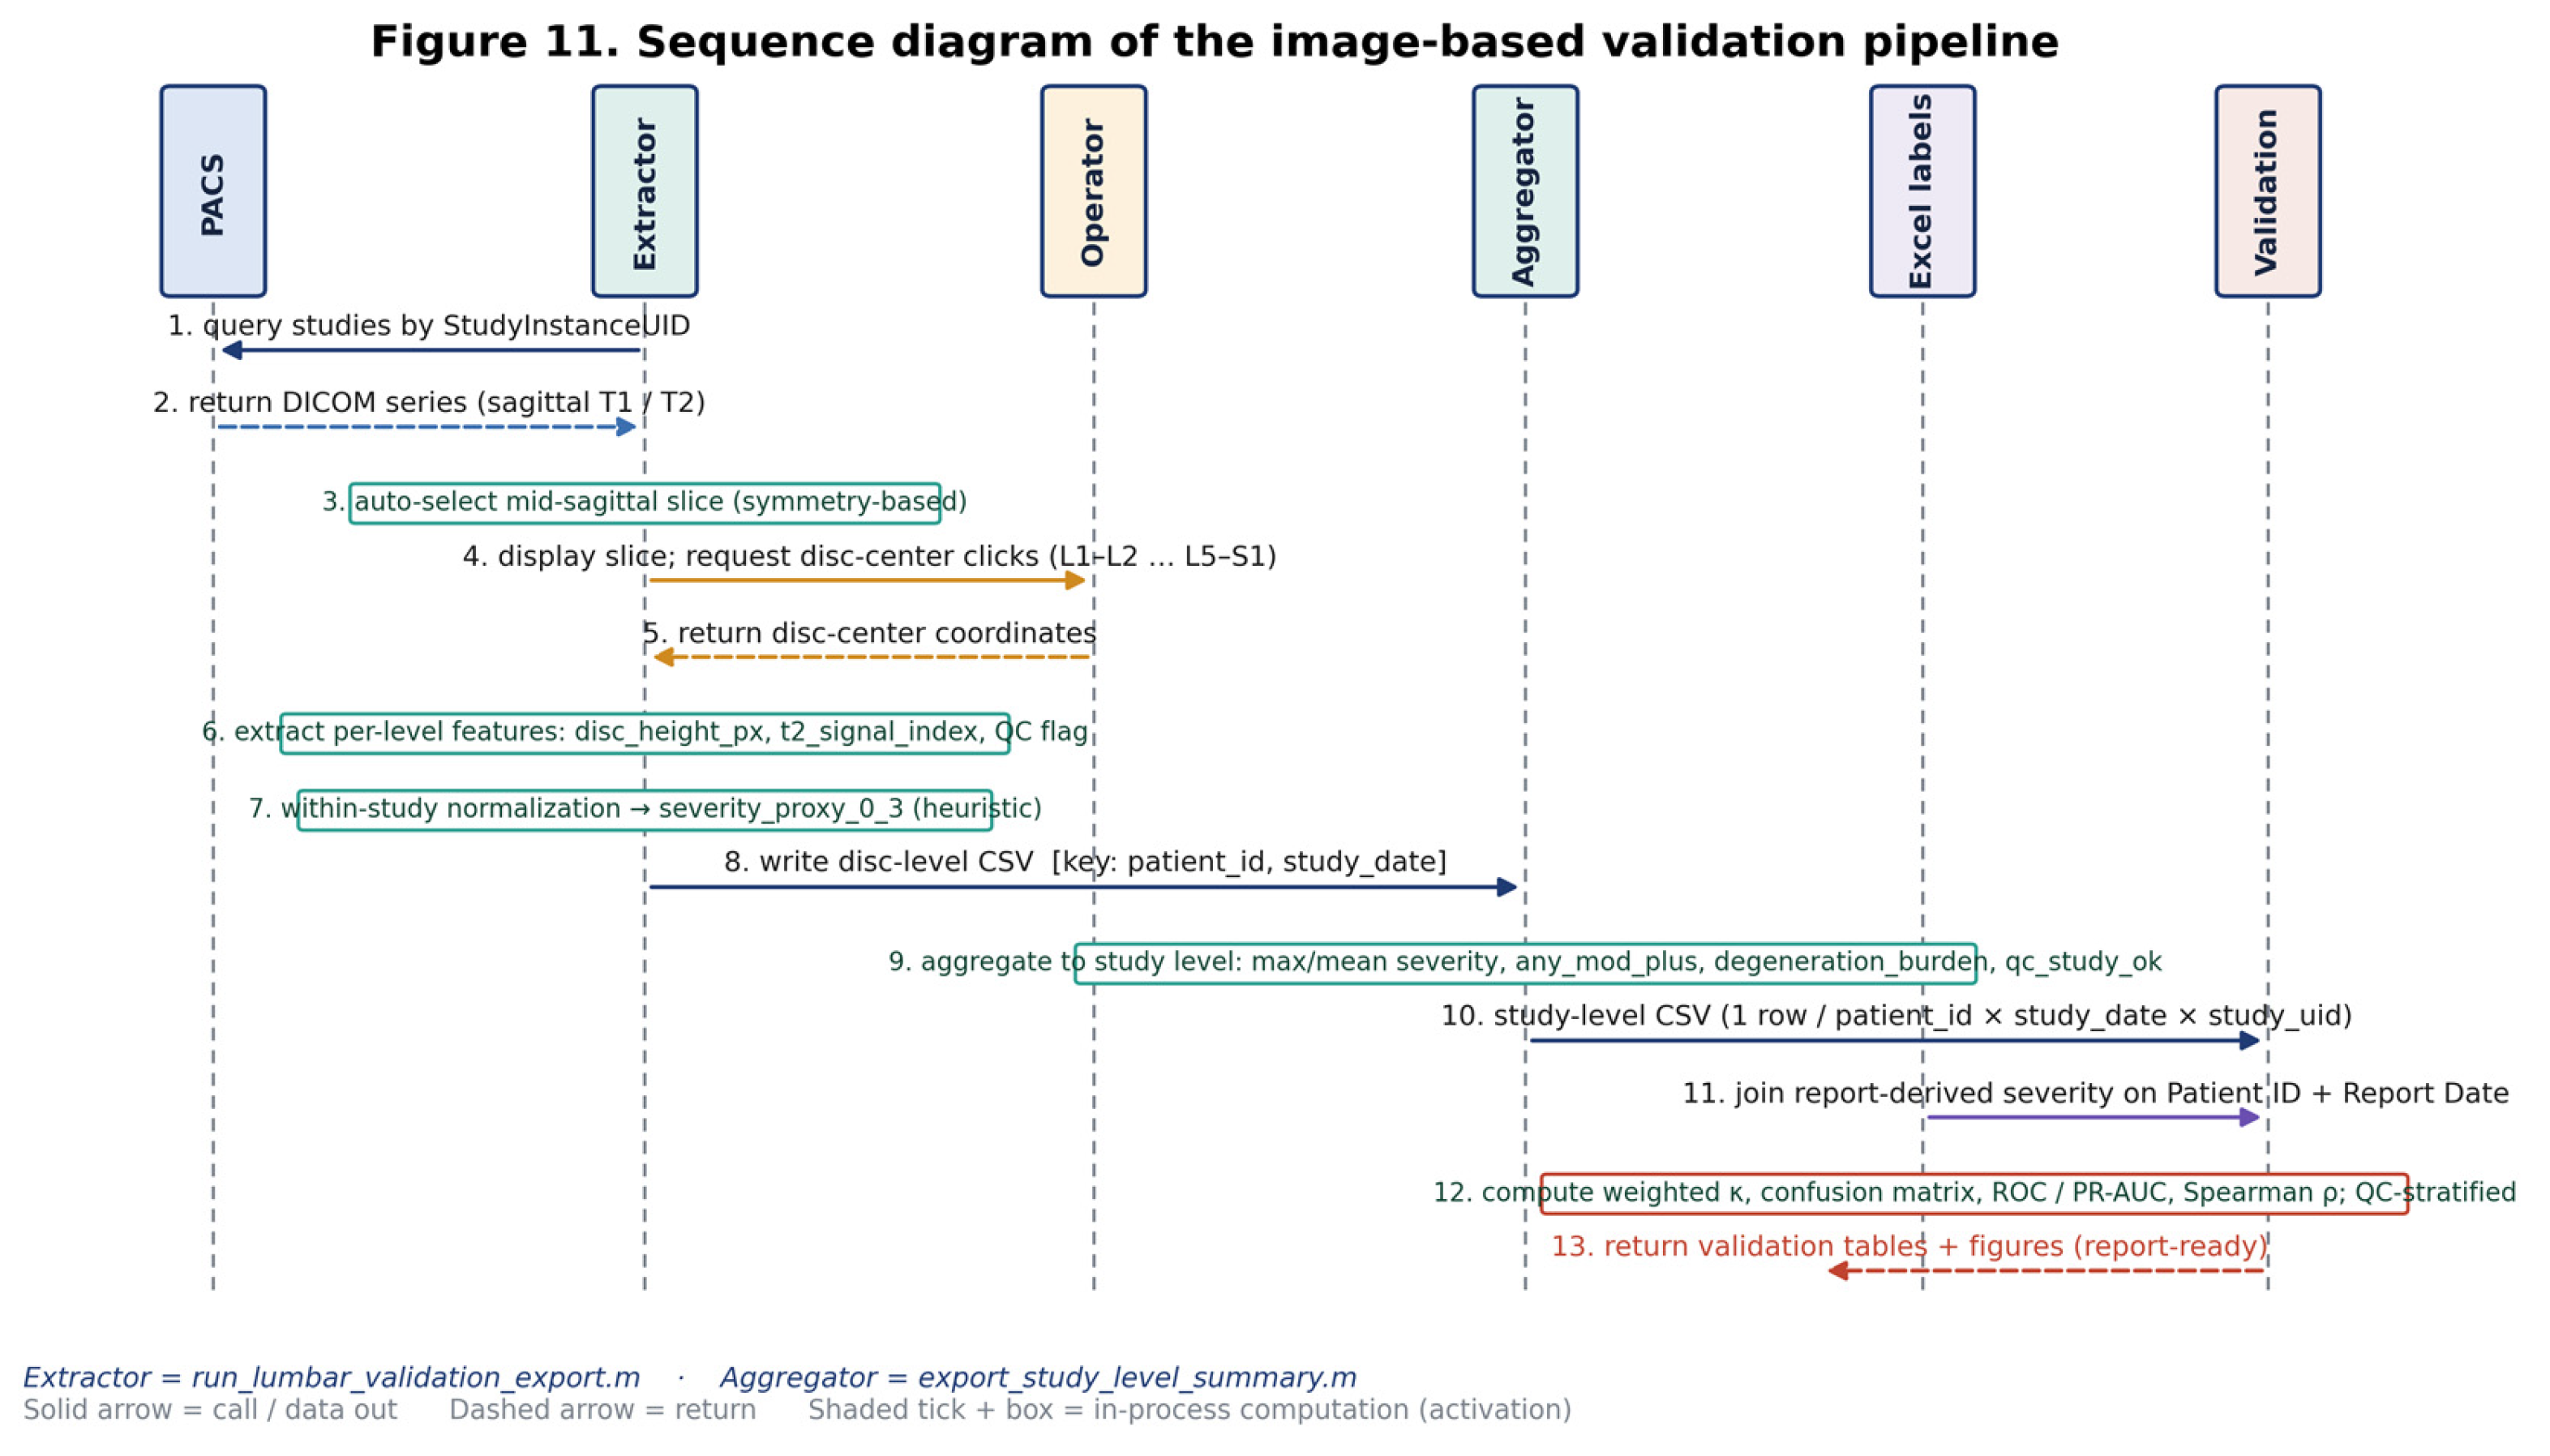
Figure 12.
Representative de-identified per-study quality-control overlay from the executed image-based pipeline: the inclusion/imaging–report match/QC header, the per-level biomarker table (detection confidence, normalized disc height, T2 signal index, predicted Pfirrmann grade, severity, bulge and Modic ratio), a schematic L1–S1 column, and the mid-sagittal T2 with anchored disc markers. Patient identifier and study date were removed for presentation.
Figure 12.
Representative de-identified per-study quality-control overlay from the executed image-based pipeline: the inclusion/imaging–report match/QC header, the per-level biomarker table (detection confidence, normalized disc height, T2 signal index, predicted Pfirrmann grade, severity, bulge and Modic ratio), a schematic L1–S1 column, and the mid-sagittal T2 with anchored disc markers. Patient identifier and study date were removed for presentation.
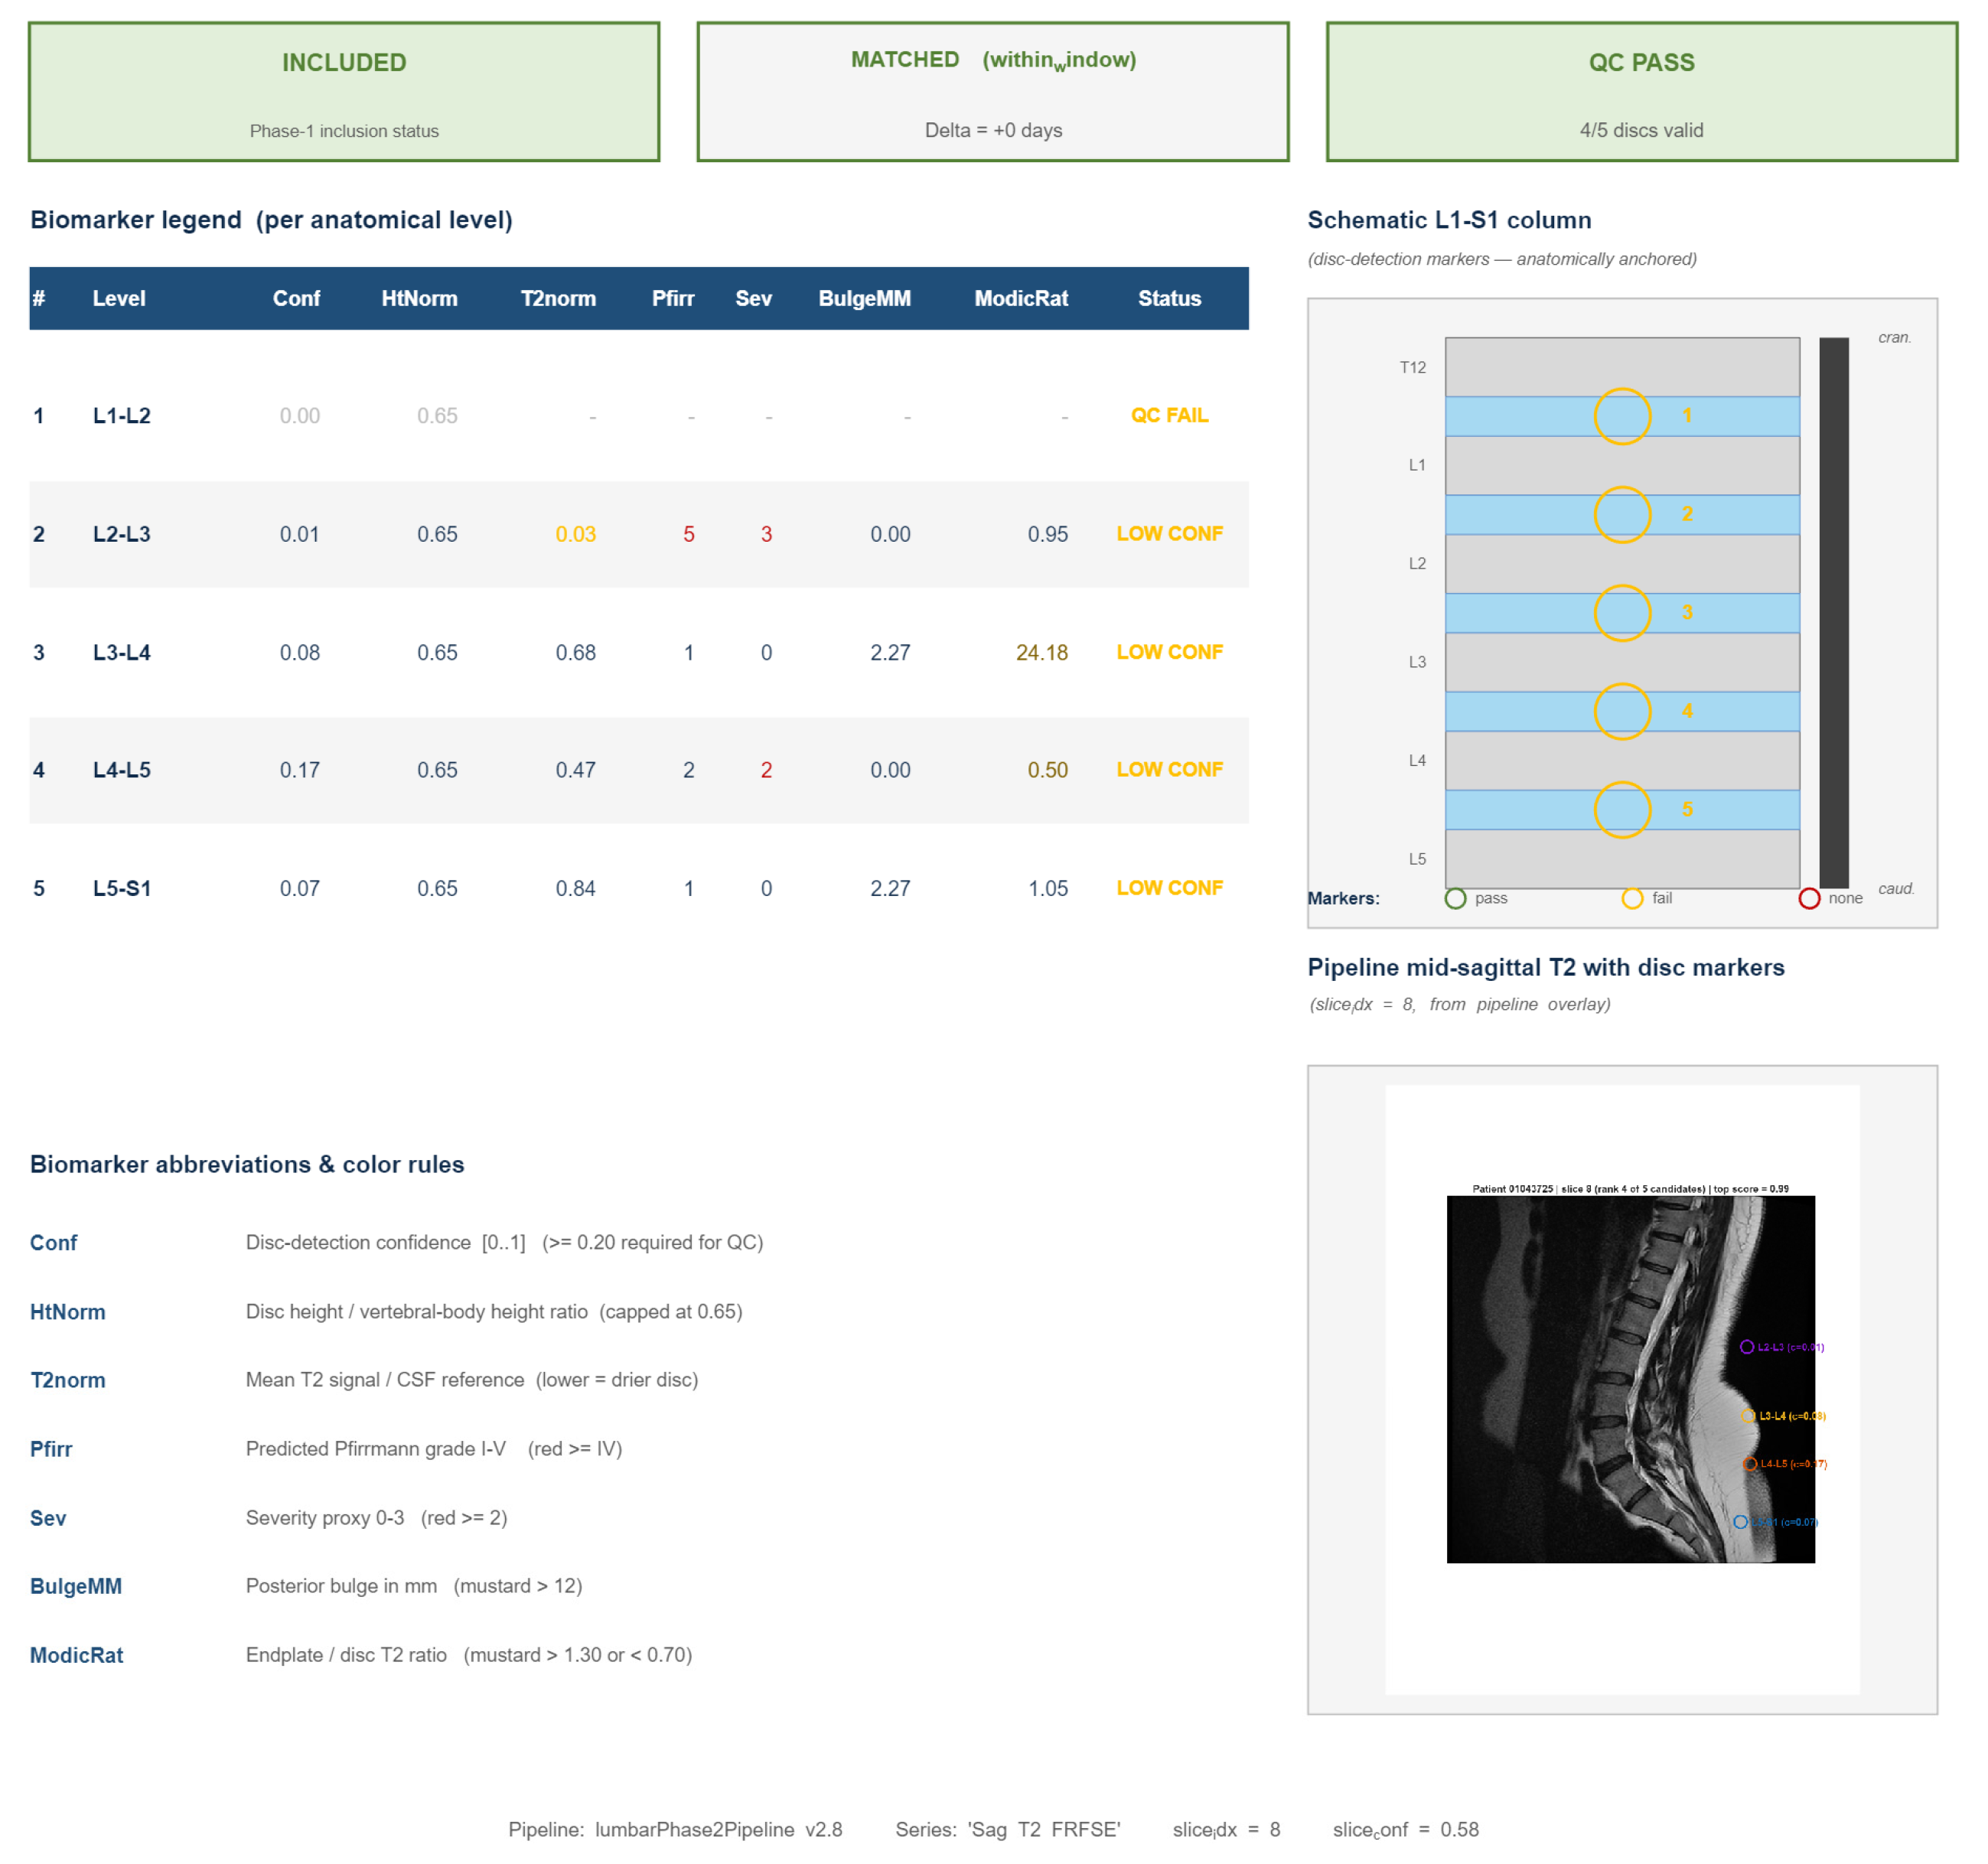
Figure 13.
Quality control across the cohort (de-identified examples). (a) A study with severe, multilevel degeneration (predicted Pfirrmann IV–V, severity 2–3), showing that the pipeline grades advanced disease; (b) a study held out of the deployable validation set because it fails a per-level QC check and lacks a matched report. Each of the 316 rendered studies was summarized by such an overlay.
Figure 13.
Quality control across the cohort (de-identified examples). (a) A study with severe, multilevel degeneration (predicted Pfirrmann IV–V, severity 2–3), showing that the pipeline grades advanced disease; (b) a study held out of the deployable validation set because it fails a per-level QC check and lacks a matched report. Each of the 316 rendered studies was summarized by such an overlay.
5. Limitations
Several limitations follow from the data and design and should temper interpretation. First, the analysis is report-based: the labels reflect what radiologists chose to dictate, not a direct image assessment, so absent terms denote non-mention rather than confirmed absence, and the derived severity is a noisy proxy that has not yet been validated against images. Second, the source is a single center with uneven temporal coverage (Figure 4), limiting generalizability and introducing possible protocol- and reporting-drift effects. Third, the structured morphological-keyword field was missing in 49.4% of records and numeric age in 16.4%, so prevalence estimates for some descriptors are conservative and age analyses are restricted to reports with parseable ages. Fourth, keyword detection is lexical and may be affected by negation, synonymy and abbreviation; we did not deploy a transformer-based negation-aware extractor, which prior work shows can change measured prevalence [15,16]. Fifth, although the imaging pipeline was executed for per-disc feature extraction and quality control across 316 studies, the formal agreement analysis against an adjudicated per-level Pfirrmann gold standard has not yet been performed; the quoted performance ranges are therefore external expectations, not measured results. Sixth, no clinical outcomes (pain, function, surgery) were linked, so the clinical meaning of the derived phenotypes is not established. Finally, the heuristic 0–3 mapping, although transparent, collapses morphology and severity into a single ordinal axis and will not capture every clinically relevant distinction [7,8].
6. Recommendations and Future Directions
- Execute the specified MATLAB pipeline and validate against that reference. Report the pre-specified quadratic-weighted Cohen κ with bootstrap 95% confidence intervals, the confusion matrix, within-one-grade accuracy, ROC/PR-AUC for moderate-or-worse and severe thresholds, and Spearman ρ for continuous features, all stratified by QC status to reflect deployable performance [11,12].
- Harmonize before pooling. Given multi-year, potentially multi-scanner acquisition, apply ComBat or a validated variant to any imaging features prior to statistical comparison, and report feature stability [21,22,23,24,25].
- Upgrade the text extractor. Replace lexical matching with a negation- and context-aware transformer/LLM extractor and quantify the change in measured prevalence and inter-method agreement against the lexical baseline [15,16,17,19].
- Report to standard and link outcomes. Complete a CLAIM checklist for imaging sub-study, register the analysis, and link image-derived phenotypes to clinical outcomes to establish clinical validity [26,27].
7. Conclusions
Across 500 consecutive lumbar MRI reports, free-text narratives carried a recognizable but heterogeneous degenerative vocabulary dominated by disc bulge and caudal segmental involvement that supported reproducible cohort construction and a balanced, rule-based severity description, while remaining inconsistent in structure and granularity. Text-derived labels are therefore adequate for descriptive epidemiology and cohort building but should be treated as a noisy proxy for grading. The transparent extraction rules, FDR-controlled inferential analysis, and fully specified image-based validation framework presented here constitute a reproducible foundation for the necessary next step: benchmarking these labels against an adjudicated, harmonized, image-based reference standard toward clinically defensible lumbar-spine phenotyping.
Supplementary Materials
The following supporting information can be downloaded at the website of this paper posted on Preprints.org. The figure-data workbook (Figure_Data.xlsx), containing the full 15-keyword association table and the underlying counts for all figures, is available as Supplementary Material.
Author Contributions
A.I. Haidar: conceptualization, methodology, investigation, data curation, and writing—original draft. M. Emam: conceptualization, methodology, formal analysis, software, supervision, project administration, and writing—review and editing. A.A. Aljubran: investigation, validation, and data curation. K.M. Alkhudhair: investigation, resources, and data curation. M.M. Alassiri: investigation and resources. B.S. Almutairi: investigation and resources. S.A. Asulaiman: investigation and data curation. F.I. Altamimi: investigation and data curation. M.M. Alkahtani: investigation and validation (neuroimaging/clinical correlation). I.A. Alyami: investigation and resources. K.M. Mobaraki: investigation and data curation. All authors have read and agreed to the published version of the manuscript.
Funding
This research received no external funding.
Institutional Review Board Statement
The study was conducted in accordance with the Declaration of Helsinki (2013 revision) and approved by the Institutional Review Board of King Saud Medical City, Riyadh, Saudi Arabia (protocol code H1RI-15-May25-01; date of approval 20 May 2025). All records were fully de-identified before analysis, and no direct patient identifiers were accessed, transmitted, or stored at any stage.
Informed Consent Statement
Patient consent was waived by the Institutional Review Board because the study used existing, routinely acquired, fully de-identified radiology reports and imaging studies, and individual patients could not be identified at any stage of the analysis.
Data Availability Statement
The de-identified derived data supporting the findings of this study (extracted keyword counts, severity and segmental-level distributions, and statistical outputs) are contained within the article and its Supplementary Material. The underlying de-identified per-report and per-study datasets, together with the analysis code (the text-extraction rule set and the image-processing pipeline for per-disc feature extraction and quality control), are available from the corresponding author (M. Emam; m.emam@qu.edu.sa) on reasonable request, subject to institutional data-governance approval and a data-use agreement. The raw radiology reports and source MRI studies cannot be shared publicly because they constitute protected medical records.
Acknowledgments
The Researchers would like to thank the Deanship of Graduate Studies and Scientific Research at Qassim University (www.qu.edu.sa) for financial support (QU-APC-2026). The authors also thank the staff of the MRI and PACS/electronic-archiving departments at the participating centers for their assistance. Computational tools were used for statistical figures, the sequence diagram, and language and formatting support; all content, numerical values, and citations were checked and verified by the authors, who take full responsibility for the integrity and accuracy of the work.
Conflicts of Interest
The authors declare no conflicts of interest.
References
- Ferreira, M.L.; de Luca, K.; Haile, L.M.; et al. Global, regional, and national burden of low back pain, 1990–2020, its attributable risk factors, and projections to 2050: a systematic analysis of the Global Burden of Disease Study 2021. Lancet Rheumatol. 2023, 5, e316–e329. [Google Scholar] [CrossRef] [PubMed]
- Hoy, D.; March, L.; Brooks, P.; Blyth, F.; Woolf, A.; Bain, C.; Williams, G.; Smith, E.; Vos, T.; Barendregt, J.; et al. The global burden of low back pain: estimates from the Global Burden of Disease 2010 study. Ann. Rheum. Dis. 2014, 73, 968–974. [Google Scholar] [CrossRef] [PubMed]
- Brinjikji, W.; Diehn, F.E.; Jarvik, J.G.; Carr, C.M.; Kallmes, D.F.; Murad, M.H.; Luetmer, P.H. MRI findings of disc degeneration are more prevalent in adults with low back pain than in asymptomatic controls: a systematic review and meta-analysis. AJNR Am. J. Neuroradiol. 2015, 36, 2394–2399. [Google Scholar] [CrossRef] [PubMed]
- Mok, F.P.S.; Samartzis, D.; Karppinen, J.; Fong, D.Y.T.; Luk, K.D.K.; Cheung, K.M.C. Modic changes of the lumbar spine: prevalence, risk factors, and association with disc degeneration and low back pain in a large-scale population-based cohort. Spine J. 2016, 16, 32–41. [Google Scholar] [CrossRef] [PubMed]
- Pfirrmann, C.W.A.; Metzdorf, A.; Zanetti, M.; Hodler, J.; Boos, N. Magnetic resonance classification of lumbar intervertebral disc degeneration. Spine 2001, 26, 1873–1878. [Google Scholar] [CrossRef] [PubMed]
- Urrutia, J.; Besa, P.; Campos, M.; Cikutovic, P.; Cabezon, M.; Molina, M.; Cruz, J.P. The Pfirrmann classification of lumbar intervertebral disc degeneration: an independent inter- and intra-observer agreement assessment. Eur. Spine J. 2016, 25, 2728–2733. [Google Scholar] [CrossRef] [PubMed]
- Griffith, J.F.; Wang, Y.X.J.; Antonio, G.E.; Choi, K.C.; Yu, A.; Ahuja, A.T.; Leung, P.C. Modified Pfirrmann grading system for lumbar intervertebral disc degeneration. Spine 2007, 32, E708–E712. [Google Scholar] [CrossRef] [PubMed]
- Soydan, Z.; Bayramoglu, E.; Urut, D.U.; Iplikcioglu, A.C.; Sen, C. Tracing the disc: the novel qualitative morphometric MRI based disc degeneration classification system. JOR Spine 2024, 7, e1321. [Google Scholar] [CrossRef] [PubMed]
- Jamaludin, A.; Kadir, T.; Zisserman, A.; McCall, I.; Williams, F.M.K.; Lang, H.; Buchanan, E.; Urban, J.P.G.; Fairbank, J.C.T. ISSLS PRIZE in Clinical Science 2023: comparison of degenerative MRI features of the intervertebral disc between those with and without chronic low back pain. An exploratory study of two large female populations using automated annotation. Eur. Spine J. 2023, 32, 1504–1516. [Google Scholar] [CrossRef] [PubMed]
- Hallinan, J.T.P.D.; Zhu, L.; Yang, K.; Makmur, A.; Algazwi, D.A.R.; Thian, Y.L.; Lau, S.; Choo, Y.S.; Eide, S.E.; Yap, Q.V.; et al. Deep learning model for automated detection and classification of central canal, lateral recess, and neural foraminal stenosis at lumbar spine MRI. Radiology 2021, 300, 130–138. [Google Scholar] [CrossRef] [PubMed]
- McSweeney, T.P.; Tiulpin, A.; Saarakkala, S.; Niinimäki, J.; Windsor, R.; Jamaludin, A.; Kadir, T.; Karppinen, J.; Määttä, J. External validation of SpineNet, an open-source deep learning model for grading lumbar disk degeneration MRI features, using the Northern Finland Birth Cohort 1966. Spine 2023, 48, 484–491. [Google Scholar] [CrossRef] [PubMed]
- Murto, N.; Lund, T.; Kautiainen, H.; Luoma, K.; Kerttula, L. Comparison of lumbar disc degeneration grading between deep learning model SpineNet and radiologist: a longitudinal study with a 14-year follow-up. Eur. Spine J. 2025, 34, 3767–3773. [Google Scholar] [CrossRef] [PubMed]
- Nikpasand, M.; Middendorf, J.M.; Ella, V.A.; Jones, K.E.; Ladd, B.; Takahashi, T.; Barocas, V.H.; Ellingson, A.M. Automated magnetic resonance imaging–based grading of the lumbar intervertebral disc and facet joints. JOR Spine 2024, 7, e1353. [Google Scholar] [CrossRef] [PubMed]
- Won, D.; Lee, H.J.; Lee, S.J.; Park, S.H. Lumbar spinal stenosis grading in multiple level magnetic resonance imaging using deep convolutional neural networks. Glob. Spine J. 2025, 15, 2309–2317. [Google Scholar] [CrossRef] [PubMed]
- Sorin, V.; Barash, Y.; Konen, E.; Klang, E. Deep learning for natural language processing in radiology—fundamentals and a systematic review. J. Am. Coll. Radiol. 2020, 17, 639–648. [Google Scholar] [CrossRef] [PubMed]
- Dada, A.; Ufer, T.L.; Kim, M.; Hasin, M.; Spieker, N.; Forsting, M.; Nensa, F.; Egger, J.; Kleesiek, J. Information extraction from weakly structured radiological reports with natural language queries. Eur. Radiol. 2024, 34, 330–337. [Google Scholar] [CrossRef] [PubMed]
- Reichenpfader, D.; Müller, H.; Denecke, K. A scoping review of large language model based approaches for information extraction from radiology reports. npj Digit. Med. 2024, 7, 222. [Google Scholar] [CrossRef] [PubMed]
- Kehl, K.L.; Elmarakeby, H.; Nishino, M.; Van Allen, E.M.; Lepisto, E.M.; Hassett, M.J.; Johnson, B.E.; Schrag, D. Assessment of deep natural language processing in ascertaining oncologic outcomes from radiology reports. JAMA Oncol. 2019, 5, 1421–1429. [Google Scholar] [CrossRef] [PubMed]
- Le Guellec, B.; Lefèvre, A.; Geay, C.; Shorten, L.; Bruge, C.; Hacein-Bey, L.; Amouyel, P.; Pruvo, J.P.; Kuchcinski, G.; Hamroun, A. Performance of an open-source large language model in extracting information from free-text radiology reports. Radiol. Artif. Intell. 2024, 6, e230364. [Google Scholar] [CrossRef] [PubMed]
- Jorg, T.; Halfmann, M.C.; Rölz, N.; Mager, R.; Pinto Dos Santos, D.; Düber, C.; Mildenberger, P.; Müller, L. Structured reporting in radiology enables epidemiological analysis through data mining: urolithiasis as a use case. Abdom. Radiol. 2023, 48, 3520–3529. [Google Scholar] [CrossRef] [PubMed]
- Zwanenburg, A.; Vallières, M.; Abdalah, M.A.; Aerts, H.J.W.L.; Andrearczyk, V.; Apte, A.; Ashrafinia, S.; Bakas, S.; Beukinga, R.J.; Boellaard, R.; et al. The Image Biomarker Standardization Initiative: standardized quantitative radiomics for high-throughput image-based phenotyping. Radiology 2020, 295, 328–338. [Google Scholar] [CrossRef] [PubMed]
- Traverso, A.; Wee, L.; Dekker, A.; Gillies, R. Repeatability and reproducibility of radiomic features: a systematic review. Int. J. Radiat. Oncol. Biol. Phys. 2018, 102, 1143–1158. [Google Scholar] [CrossRef] [PubMed]
- Orlhac, F.; Lecler, A.; Savatovski, J.; Goya-Outi, J.; Nioche, C.; Charbonneau, F.; Ayache, N.; Frouin, F.; Duron, L.; Buvat, I. How can we combat multicenter variability in MR radiomics? Validation of a correction procedure. Eur. Radiol. 2021, 31, 2272–2280. [Google Scholar] [CrossRef] [PubMed]
- Orlhac, F.; Eertink, J.J.; Cottereau, A.S.; Zijlstra, J.M.; Thieblemont, C.; Meignan, M.; Boellaard, R.; Buvat, I. A guide to ComBat harmonization of imaging biomarkers in multicenter studies. J. Nucl. Med. 2022, 63, 172–179. [Google Scholar] [CrossRef] [PubMed]
- Mali, S.A.; Ibrahim, A.; Woodruff, H.C.; Andrearczyk, V.; Müller, H.; Primakov, S.; Salahuddin, Z.; Chatterjee, A.; Lambin, P. Making radiomics more reproducible across scanner and imaging protocol variations: a review of harmonization methods. J. Pers. Med. 2021, 11, 842. [Google Scholar] [CrossRef] [PubMed]
- Mongan, J.; Moy, L.; Kahn, C.E., Jr. Checklist for Artificial Intelligence in Medical Imaging (CLAIM): a guide for authors and reviewers. Radiol. Artif. Intell. 2020, 2, e200029. [Google Scholar] [CrossRef] [PubMed]
- Nagendran, M.; Chen, Y.; Lovejoy, C.A.; Gordon, A.C.; Komorowski, M.; Harvey, H.; Topol, E.J.; Ioannidis, J.P.A.; Collins, G.S.; Maruthappu, M. Artificial intelligence versus clinicians: systematic review of design, reporting standards, and claims of deep learning studies. BMJ 2020, 368, m689. [Google Scholar] [CrossRef] [PubMed]
- Kim, H.Y. Statistical notes for clinical researchers: chi-squared test and Fisher’s exact test. Restor. Dent. Endod. 2017, 42, 152–155. [Google Scholar] [CrossRef] [PubMed]
- Benjamini, Y.; Hochberg, Y. Controlling the false discovery rate: a practical and powerful approach to multiple testing. J. R. Stat. Soc. Ser. B Methodol. 1995, 57, 289–300. [Google Scholar] [CrossRef]
- Cohen, J. Weighted kappa: nominal scale agreement provision for scaled disagreement or partial credit. Psychol. Bull. 1968, 70, 213–220. [Google Scholar] [CrossRef] [PubMed]
Figure 1.
Cohort accounting and analytic workflow, from 500 extracted reports to the included degenerative cohort and the descriptive, inferential and image-based assessment stages.
Figure 1.
Cohort accounting and analytic workflow, from 500 extracted reports to the included degenerative cohort and the descriptive, inferential and image-based assessment stages.
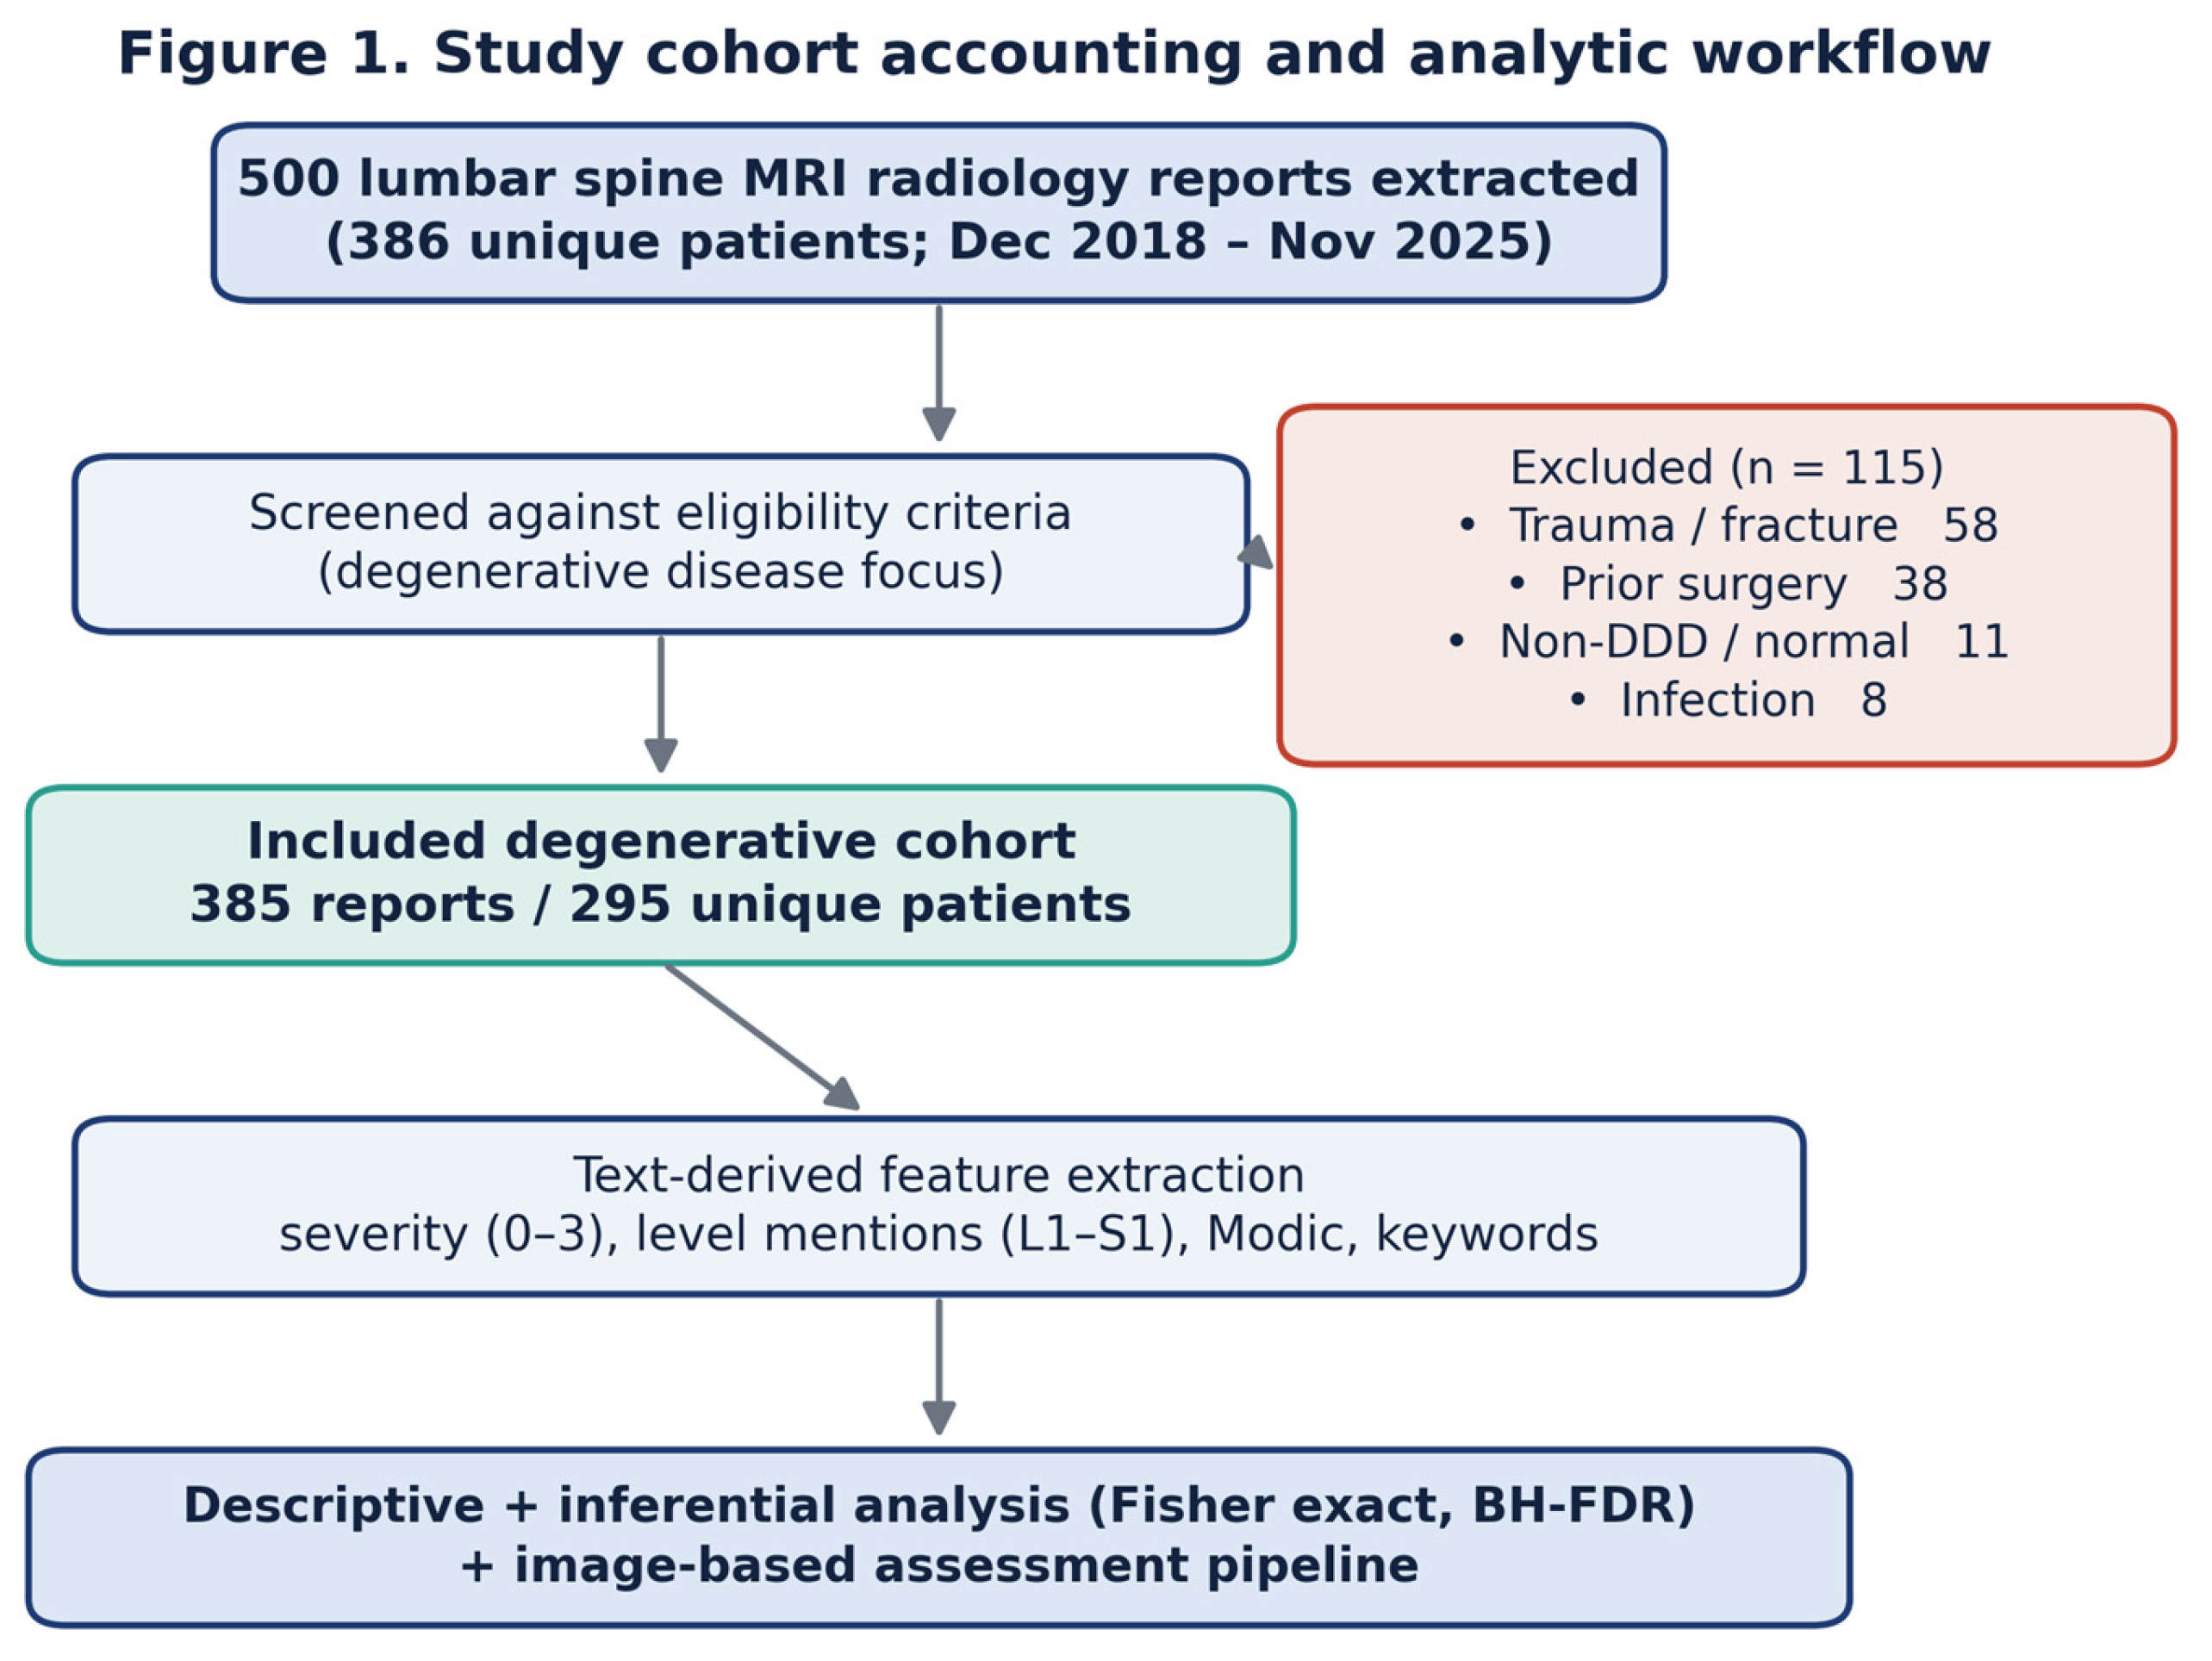
Figure 2.
Primary reasons for report exclusion (n = 115), mapped to four mutually exclusive categories by a deterministic priority rule.
Figure 2.
Primary reasons for report exclusion (n = 115), mapped to four mutually exclusive categories by a deterministic priority rule.
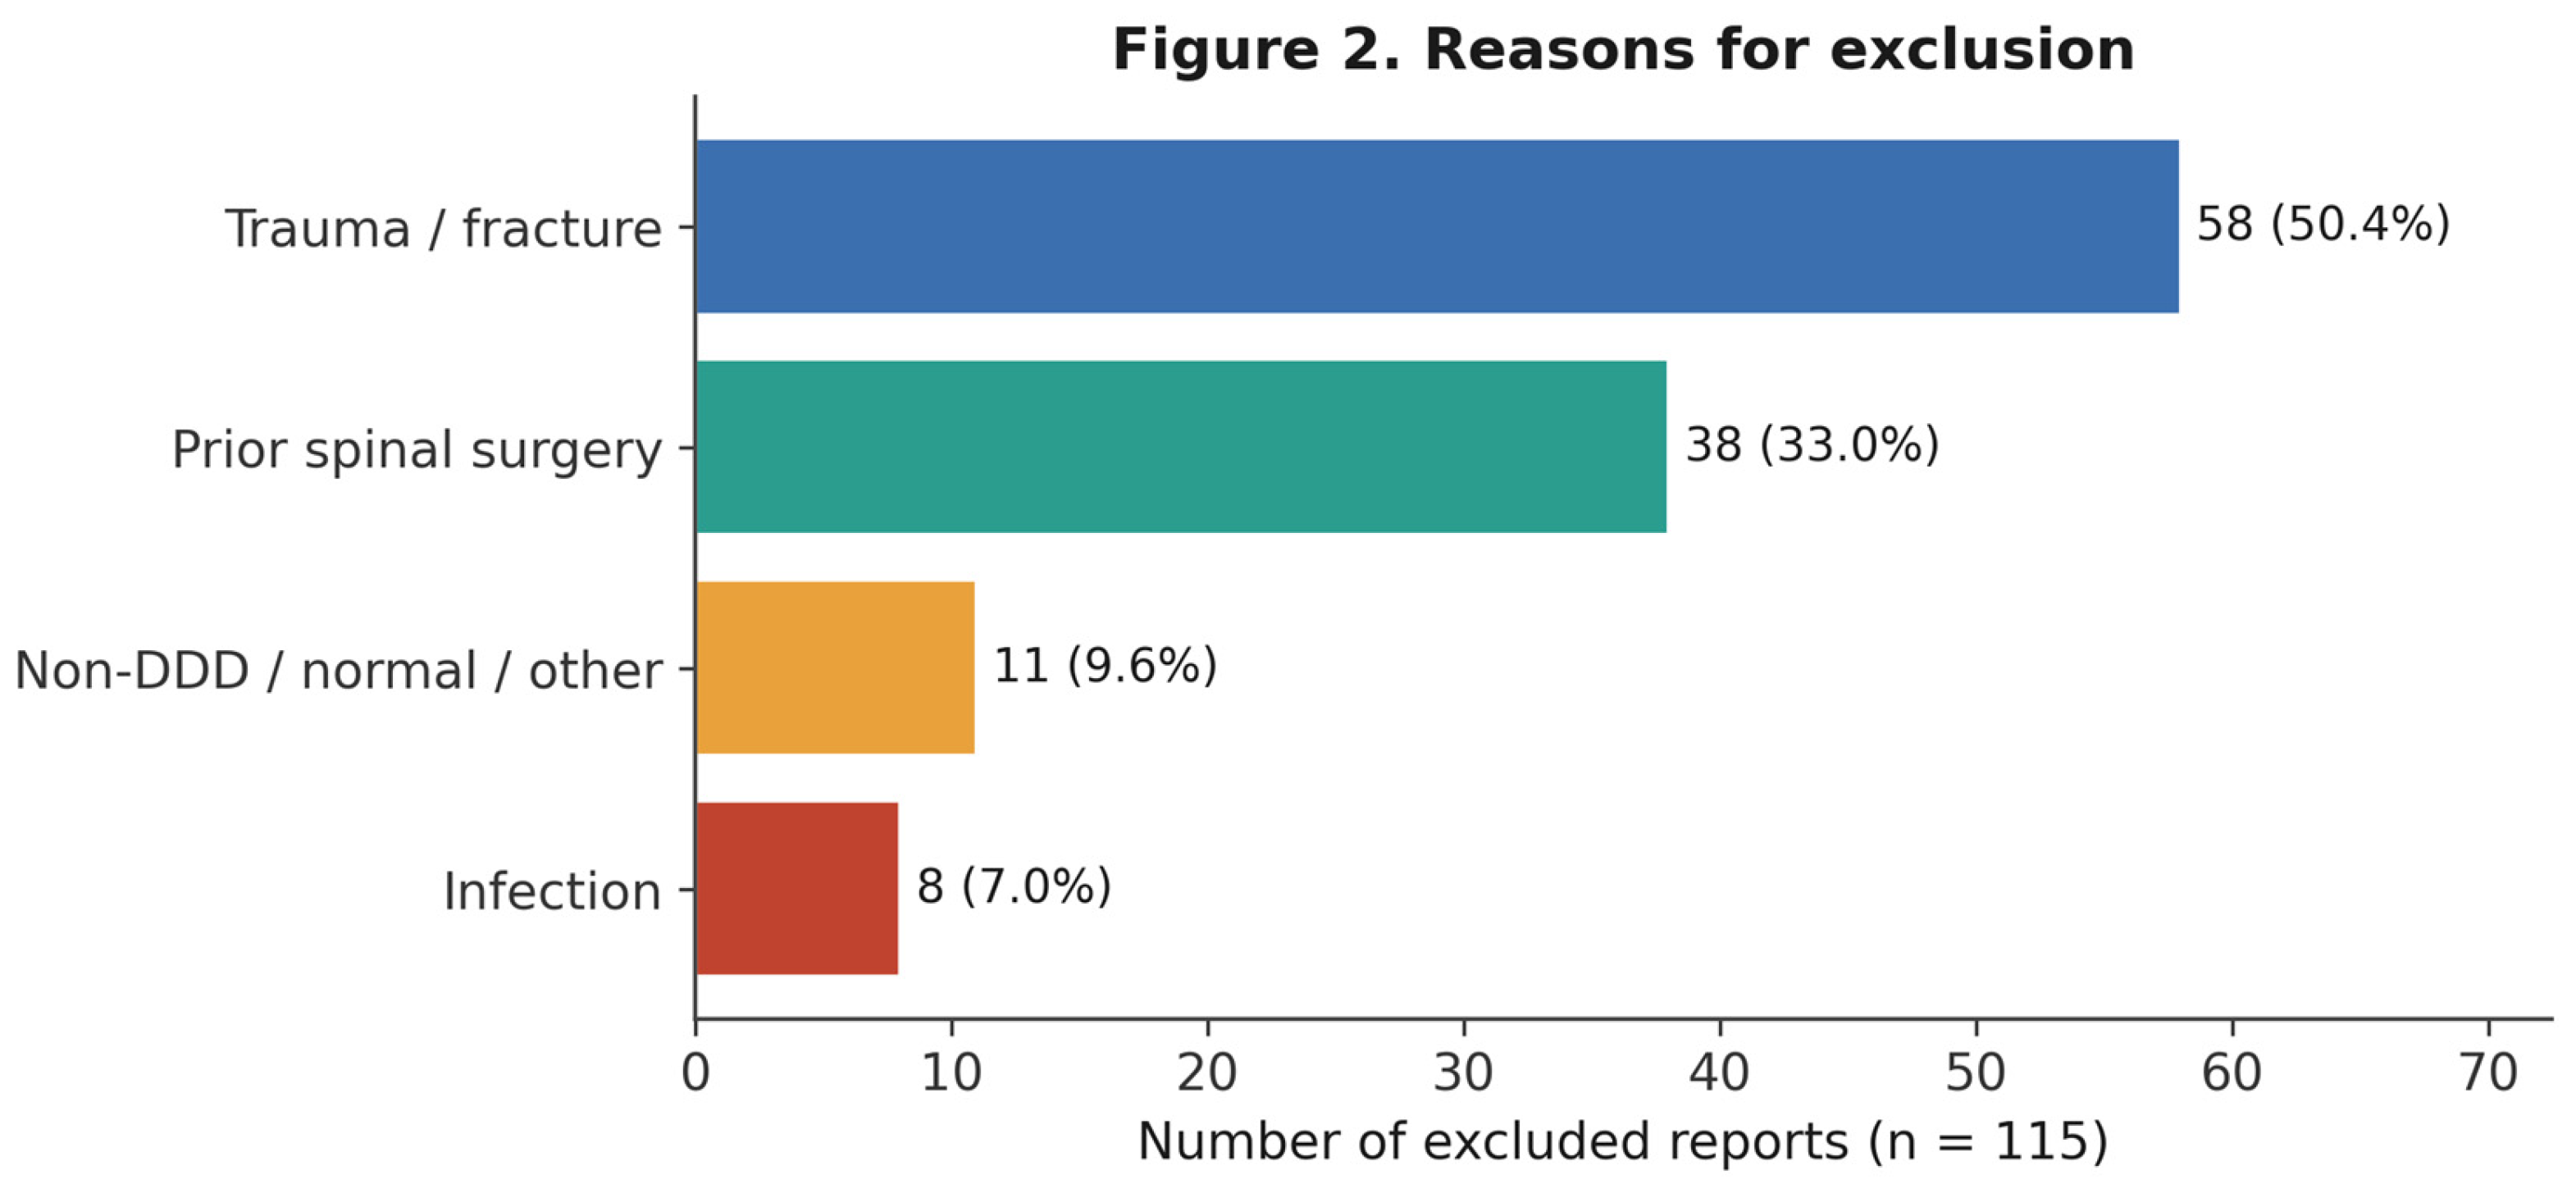
Figure 3.
Field completeness across extracted variables. The structured morphological-keyword field is missing in 49.4% of records, whereas narrative and status fields are complete.
Figure 3.
Field completeness across extracted variables. The structured morphological-keyword field is missing in 49.4% of records, whereas narrative and status fields are complete.
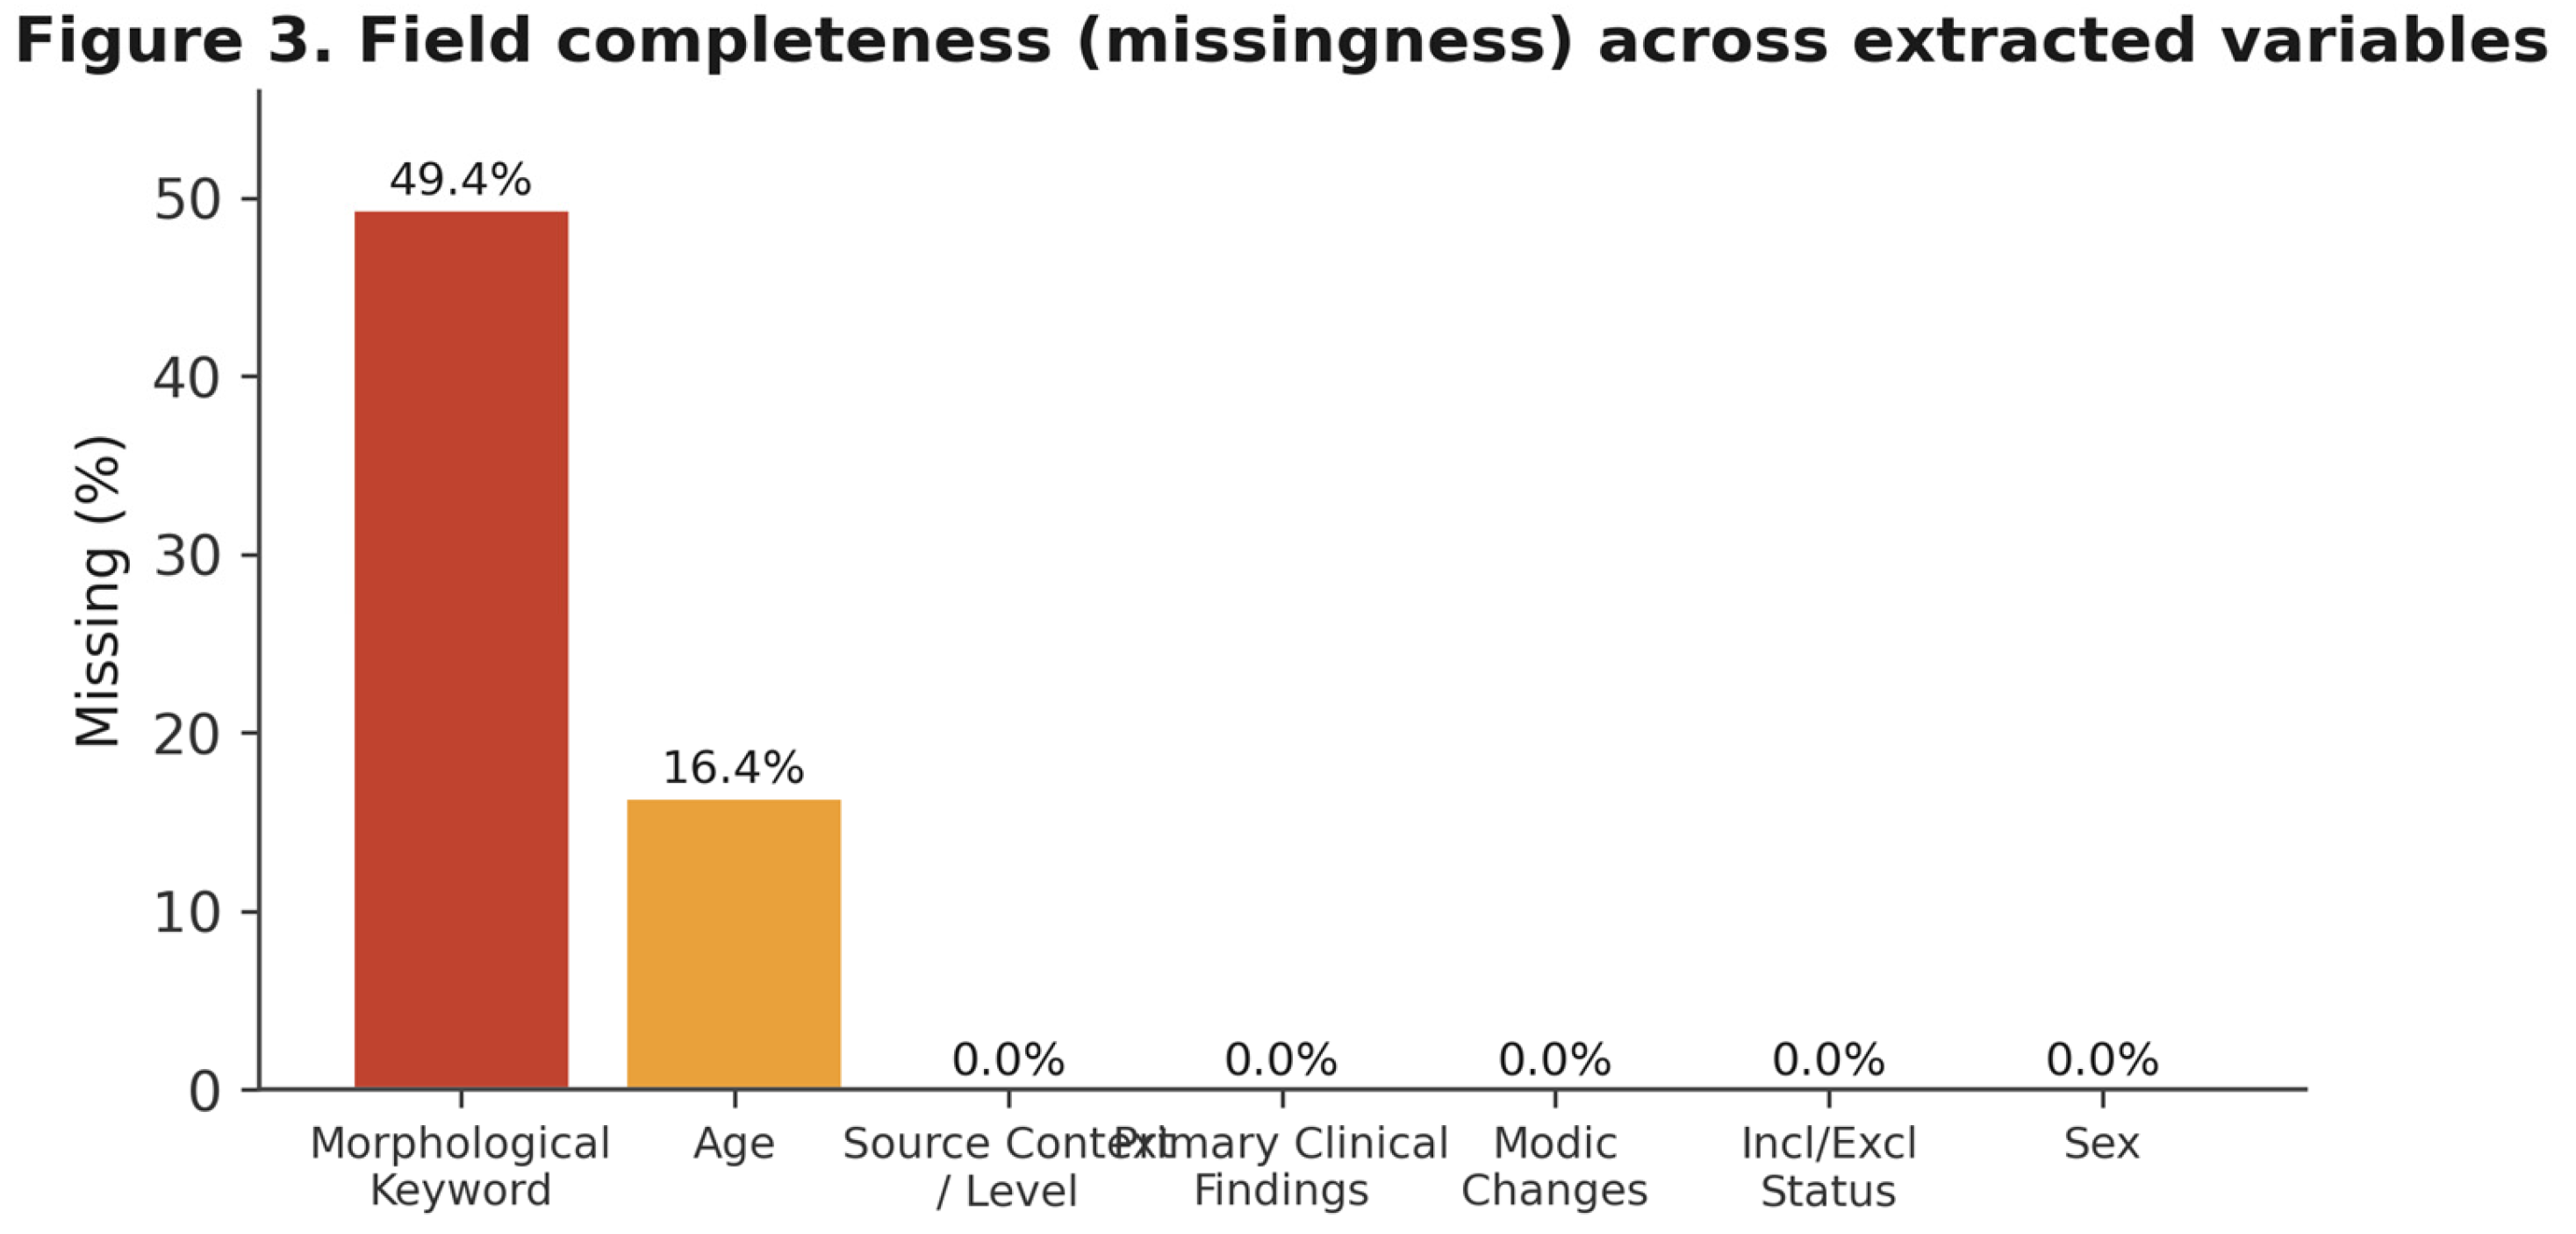
Figure 4.
Temporal distribution of reports by calendar year (2018–2025), indicating uneven coverage that should be considered as a potential source of protocol- and reporting-drift confounding.
Figure 4.
Temporal distribution of reports by calendar year (2018–2025), indicating uneven coverage that should be considered as a potential source of protocol- and reporting-drift confounding.
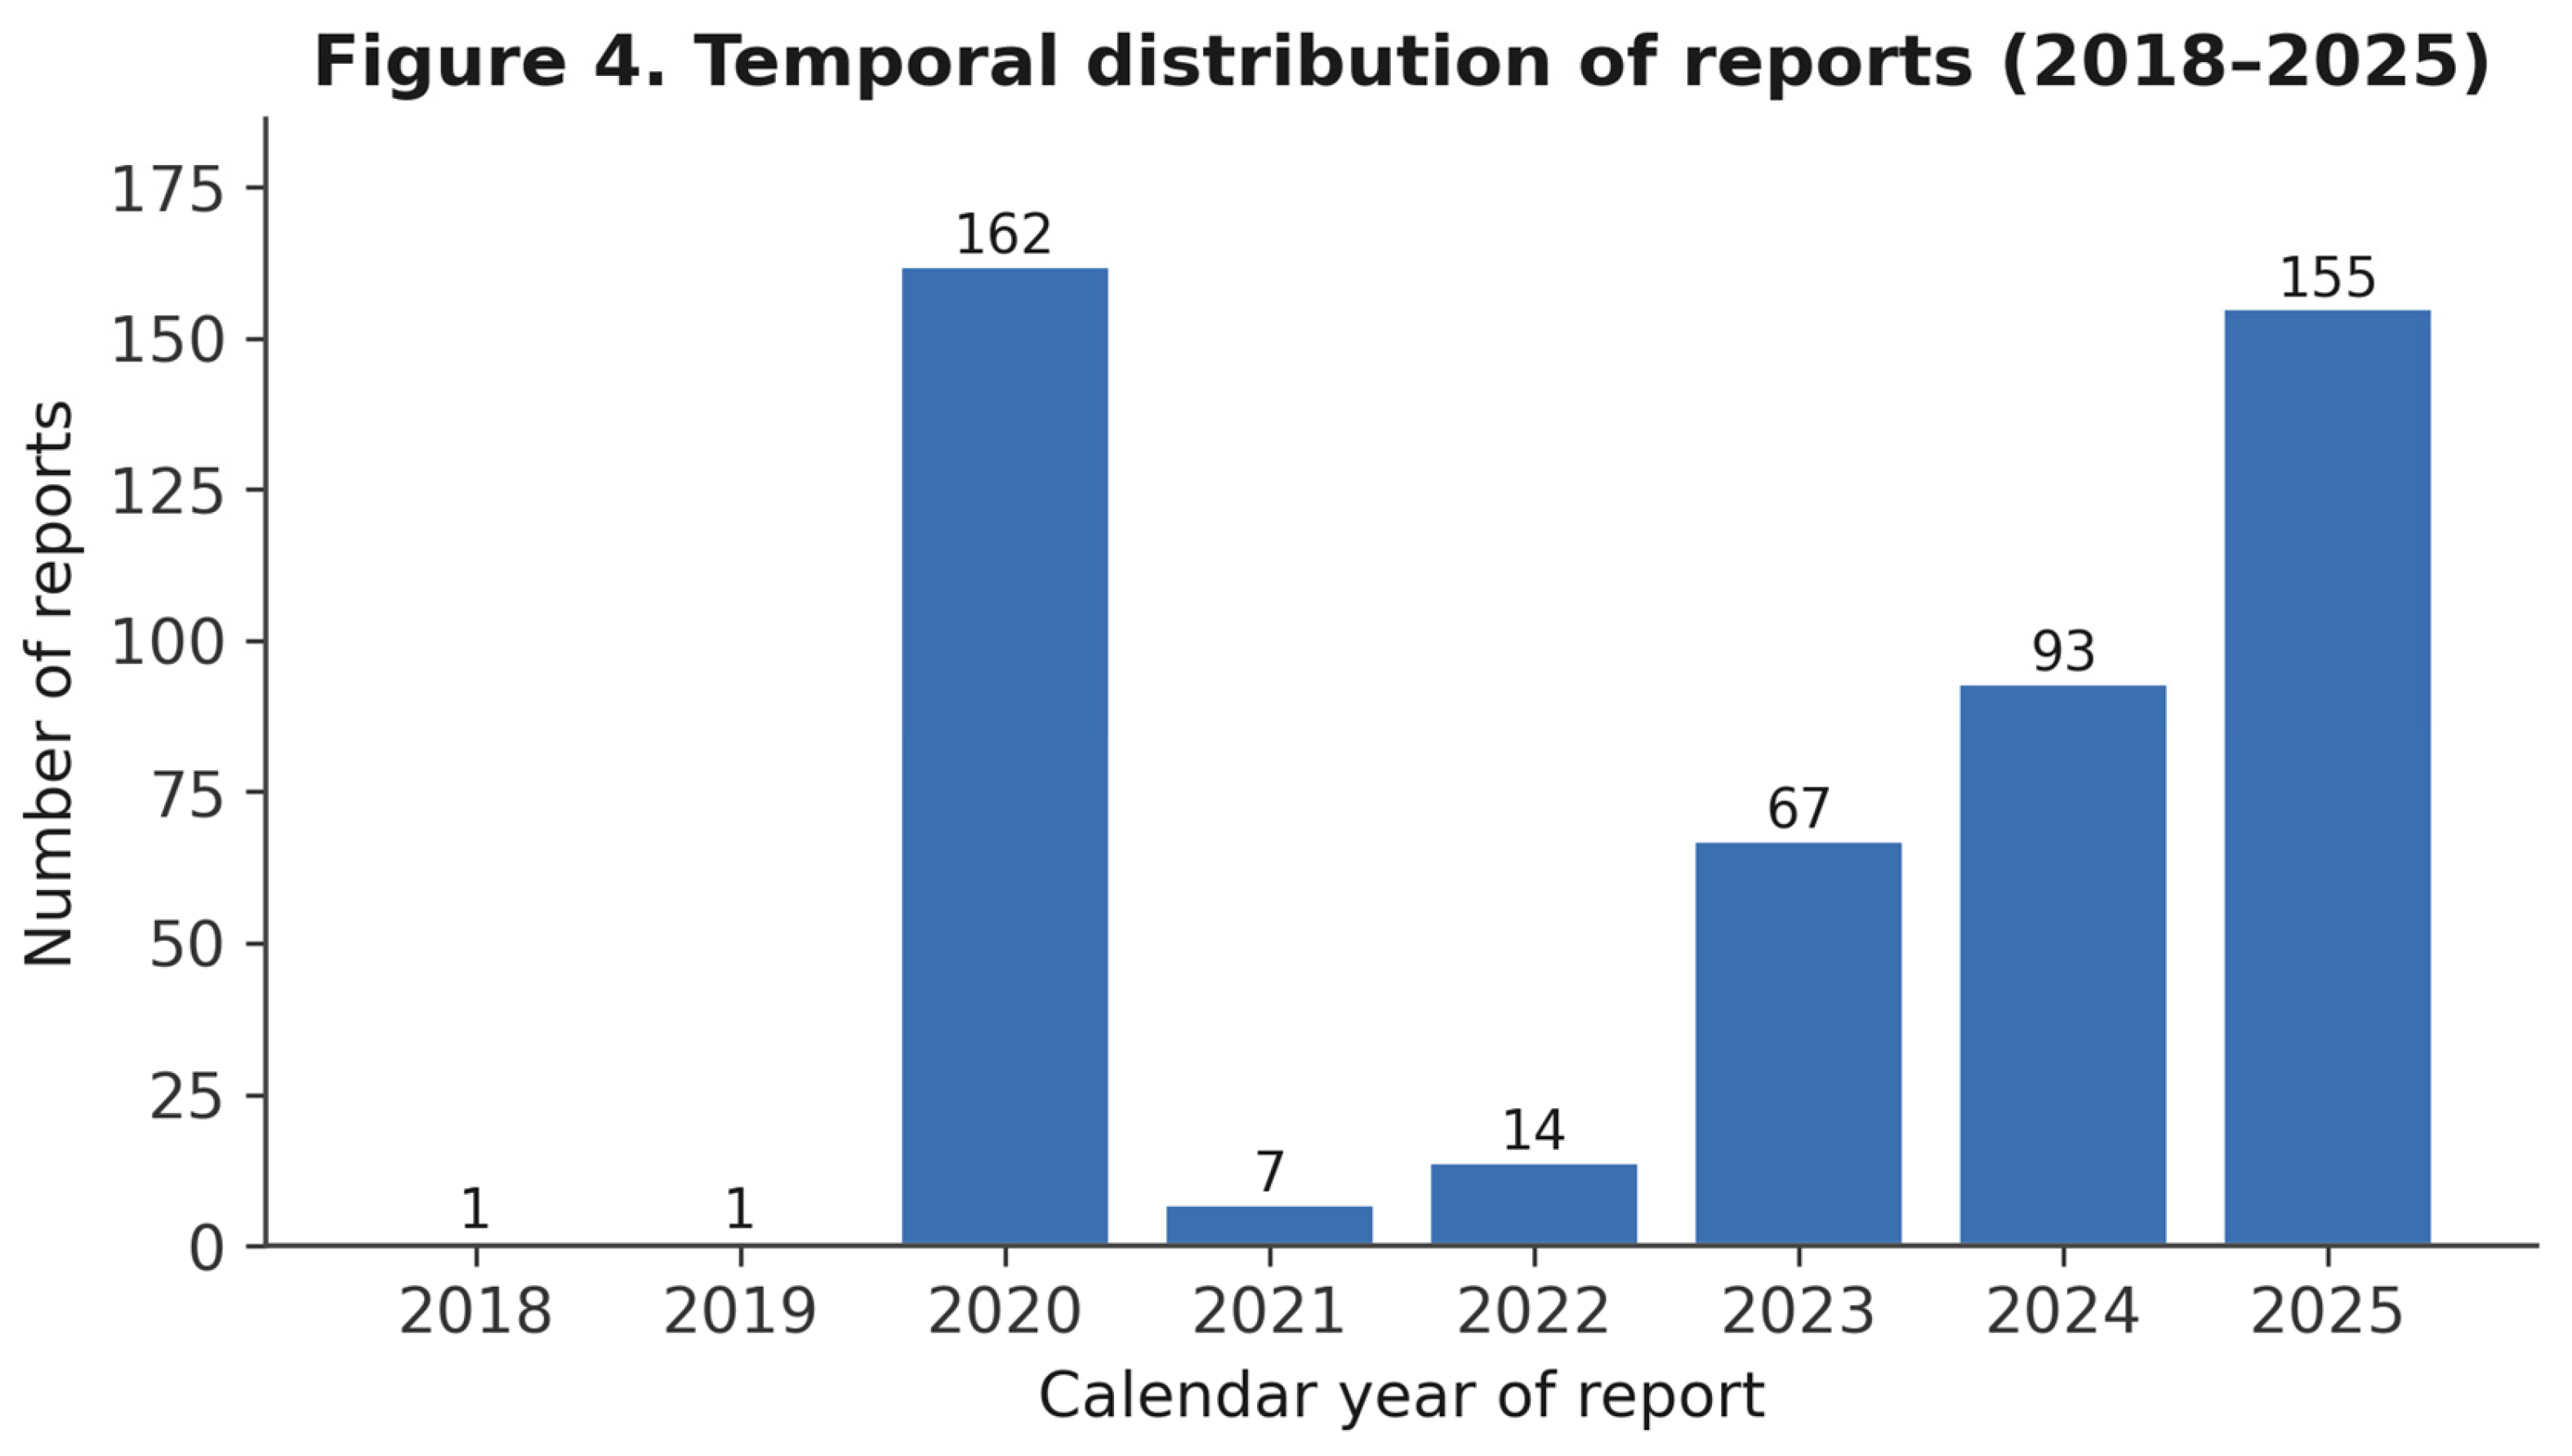
Figure 5.
(a) Patient age distribution; (b) mean patient age by maximum derived severity grade, showing higher mean age in the severe phenotype.
Figure 5.
(a) Patient age distribution; (b) mean patient age by maximum derived severity grade, showing higher mean age in the severe phenotype.
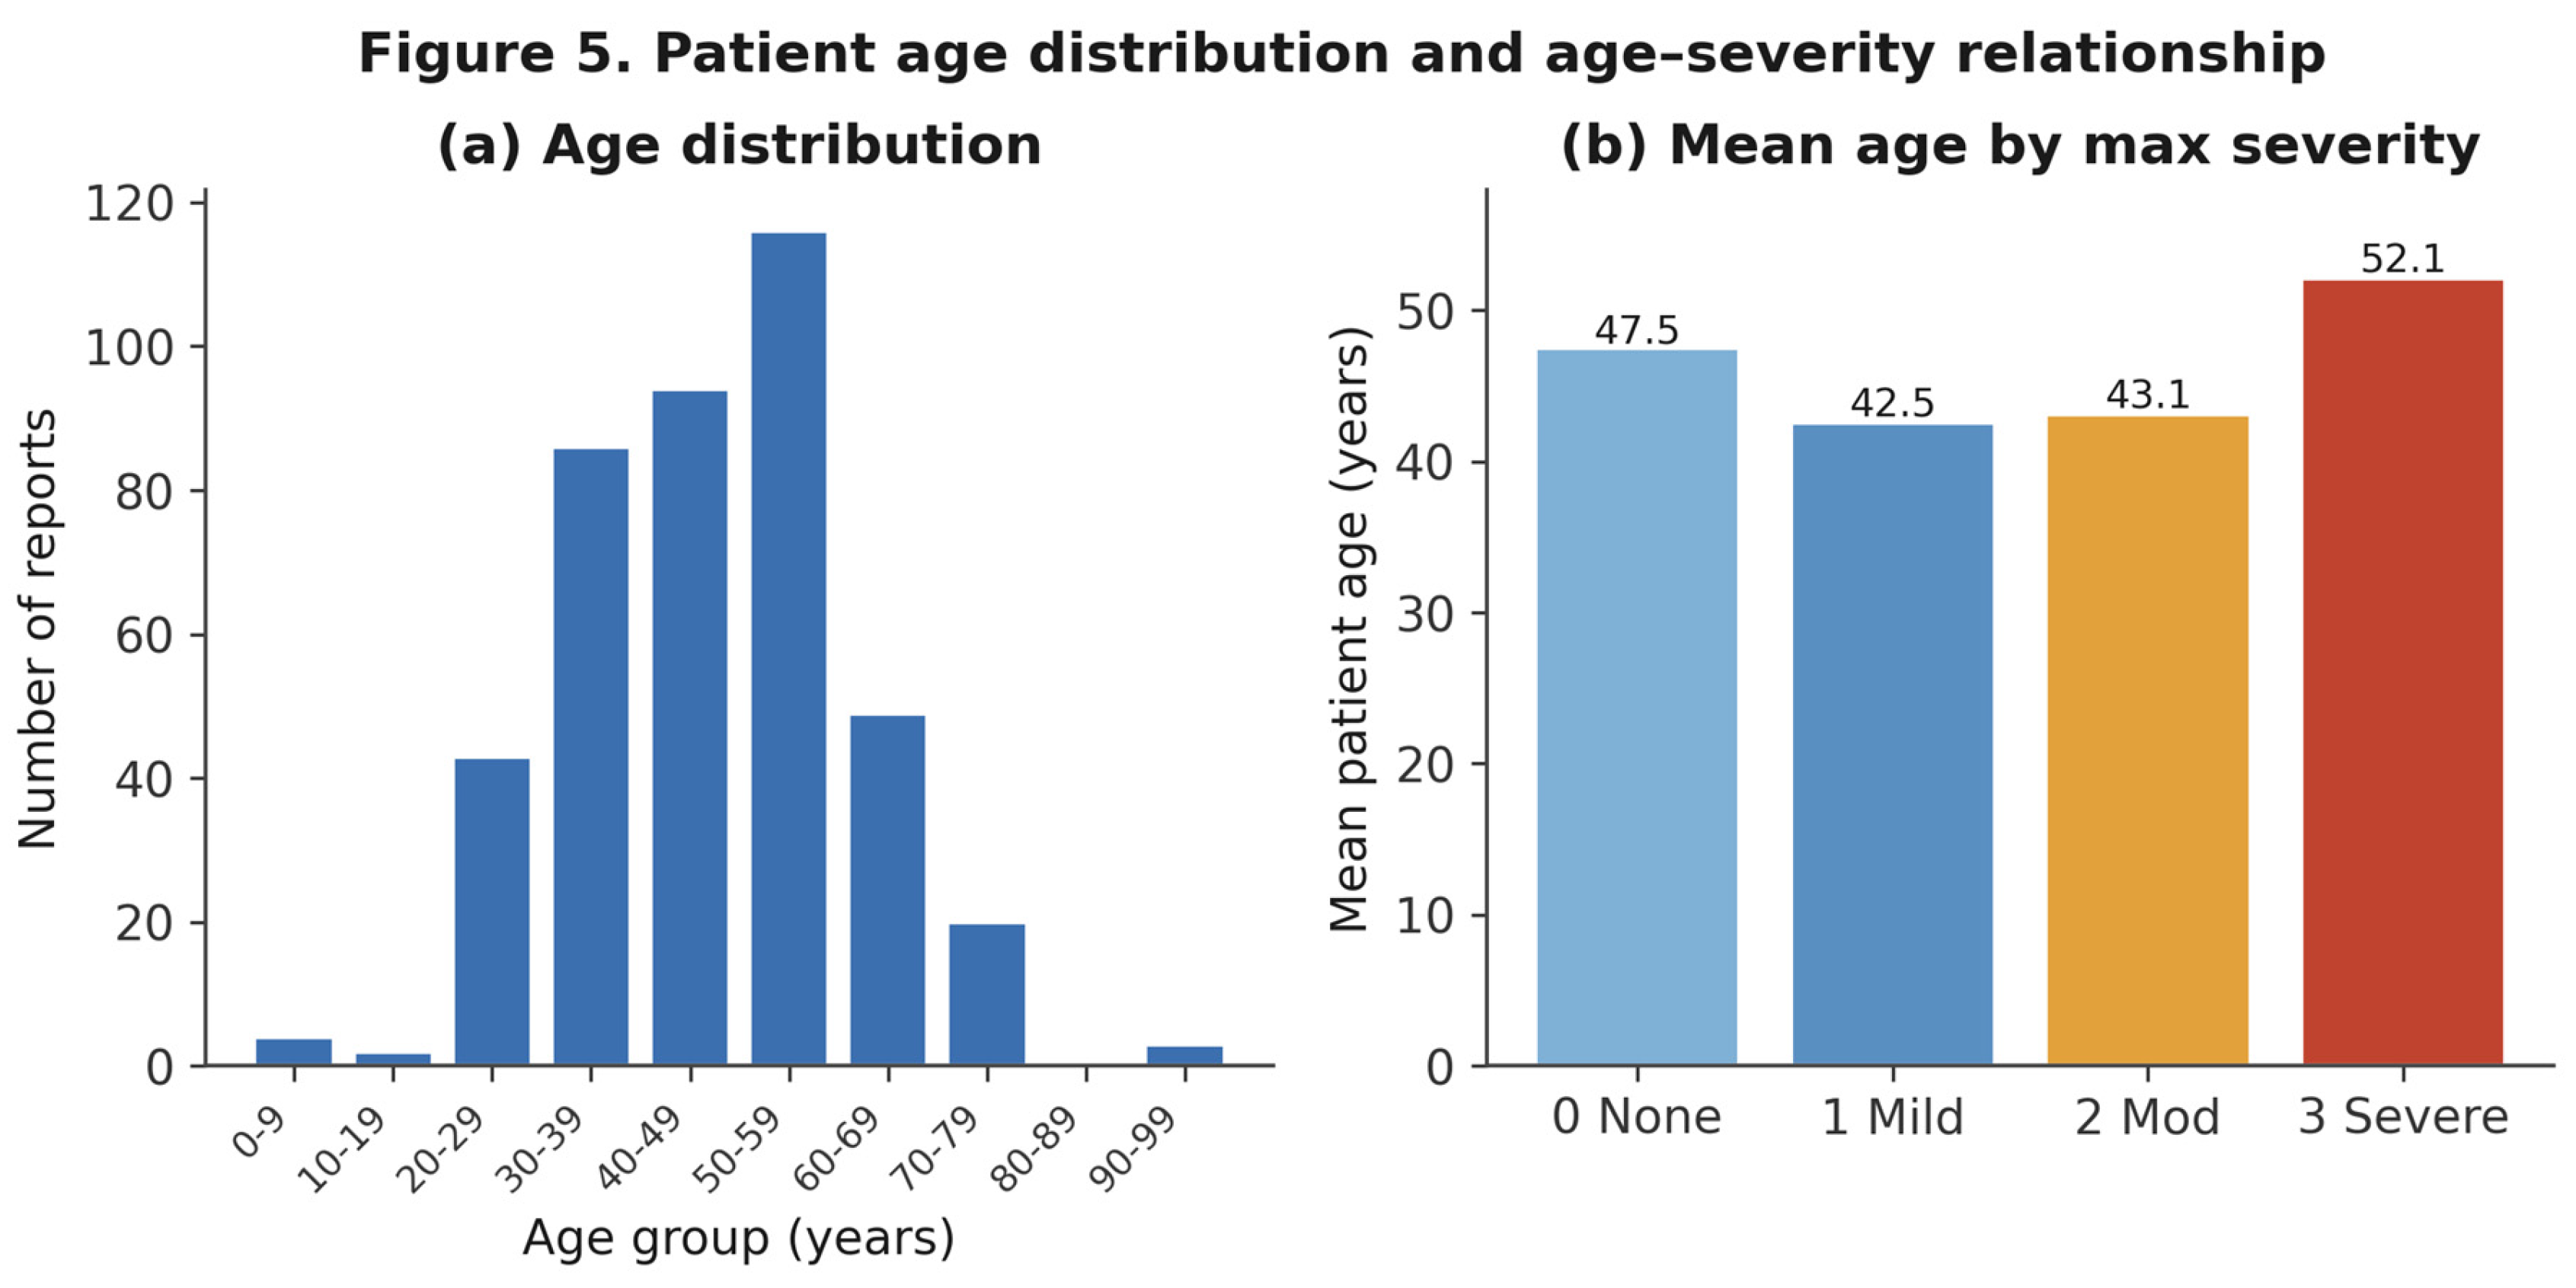
Figure 6.
Prevalence of text-derived morphological and severity descriptors among included reports (n = 385). Color encodes prevalence tier (≥20%, 10–20%, <10%).
Figure 6.
Prevalence of text-derived morphological and severity descriptors among included reports (n = 385). Color encodes prevalence tier (≥20%, 10–20%, <10%).
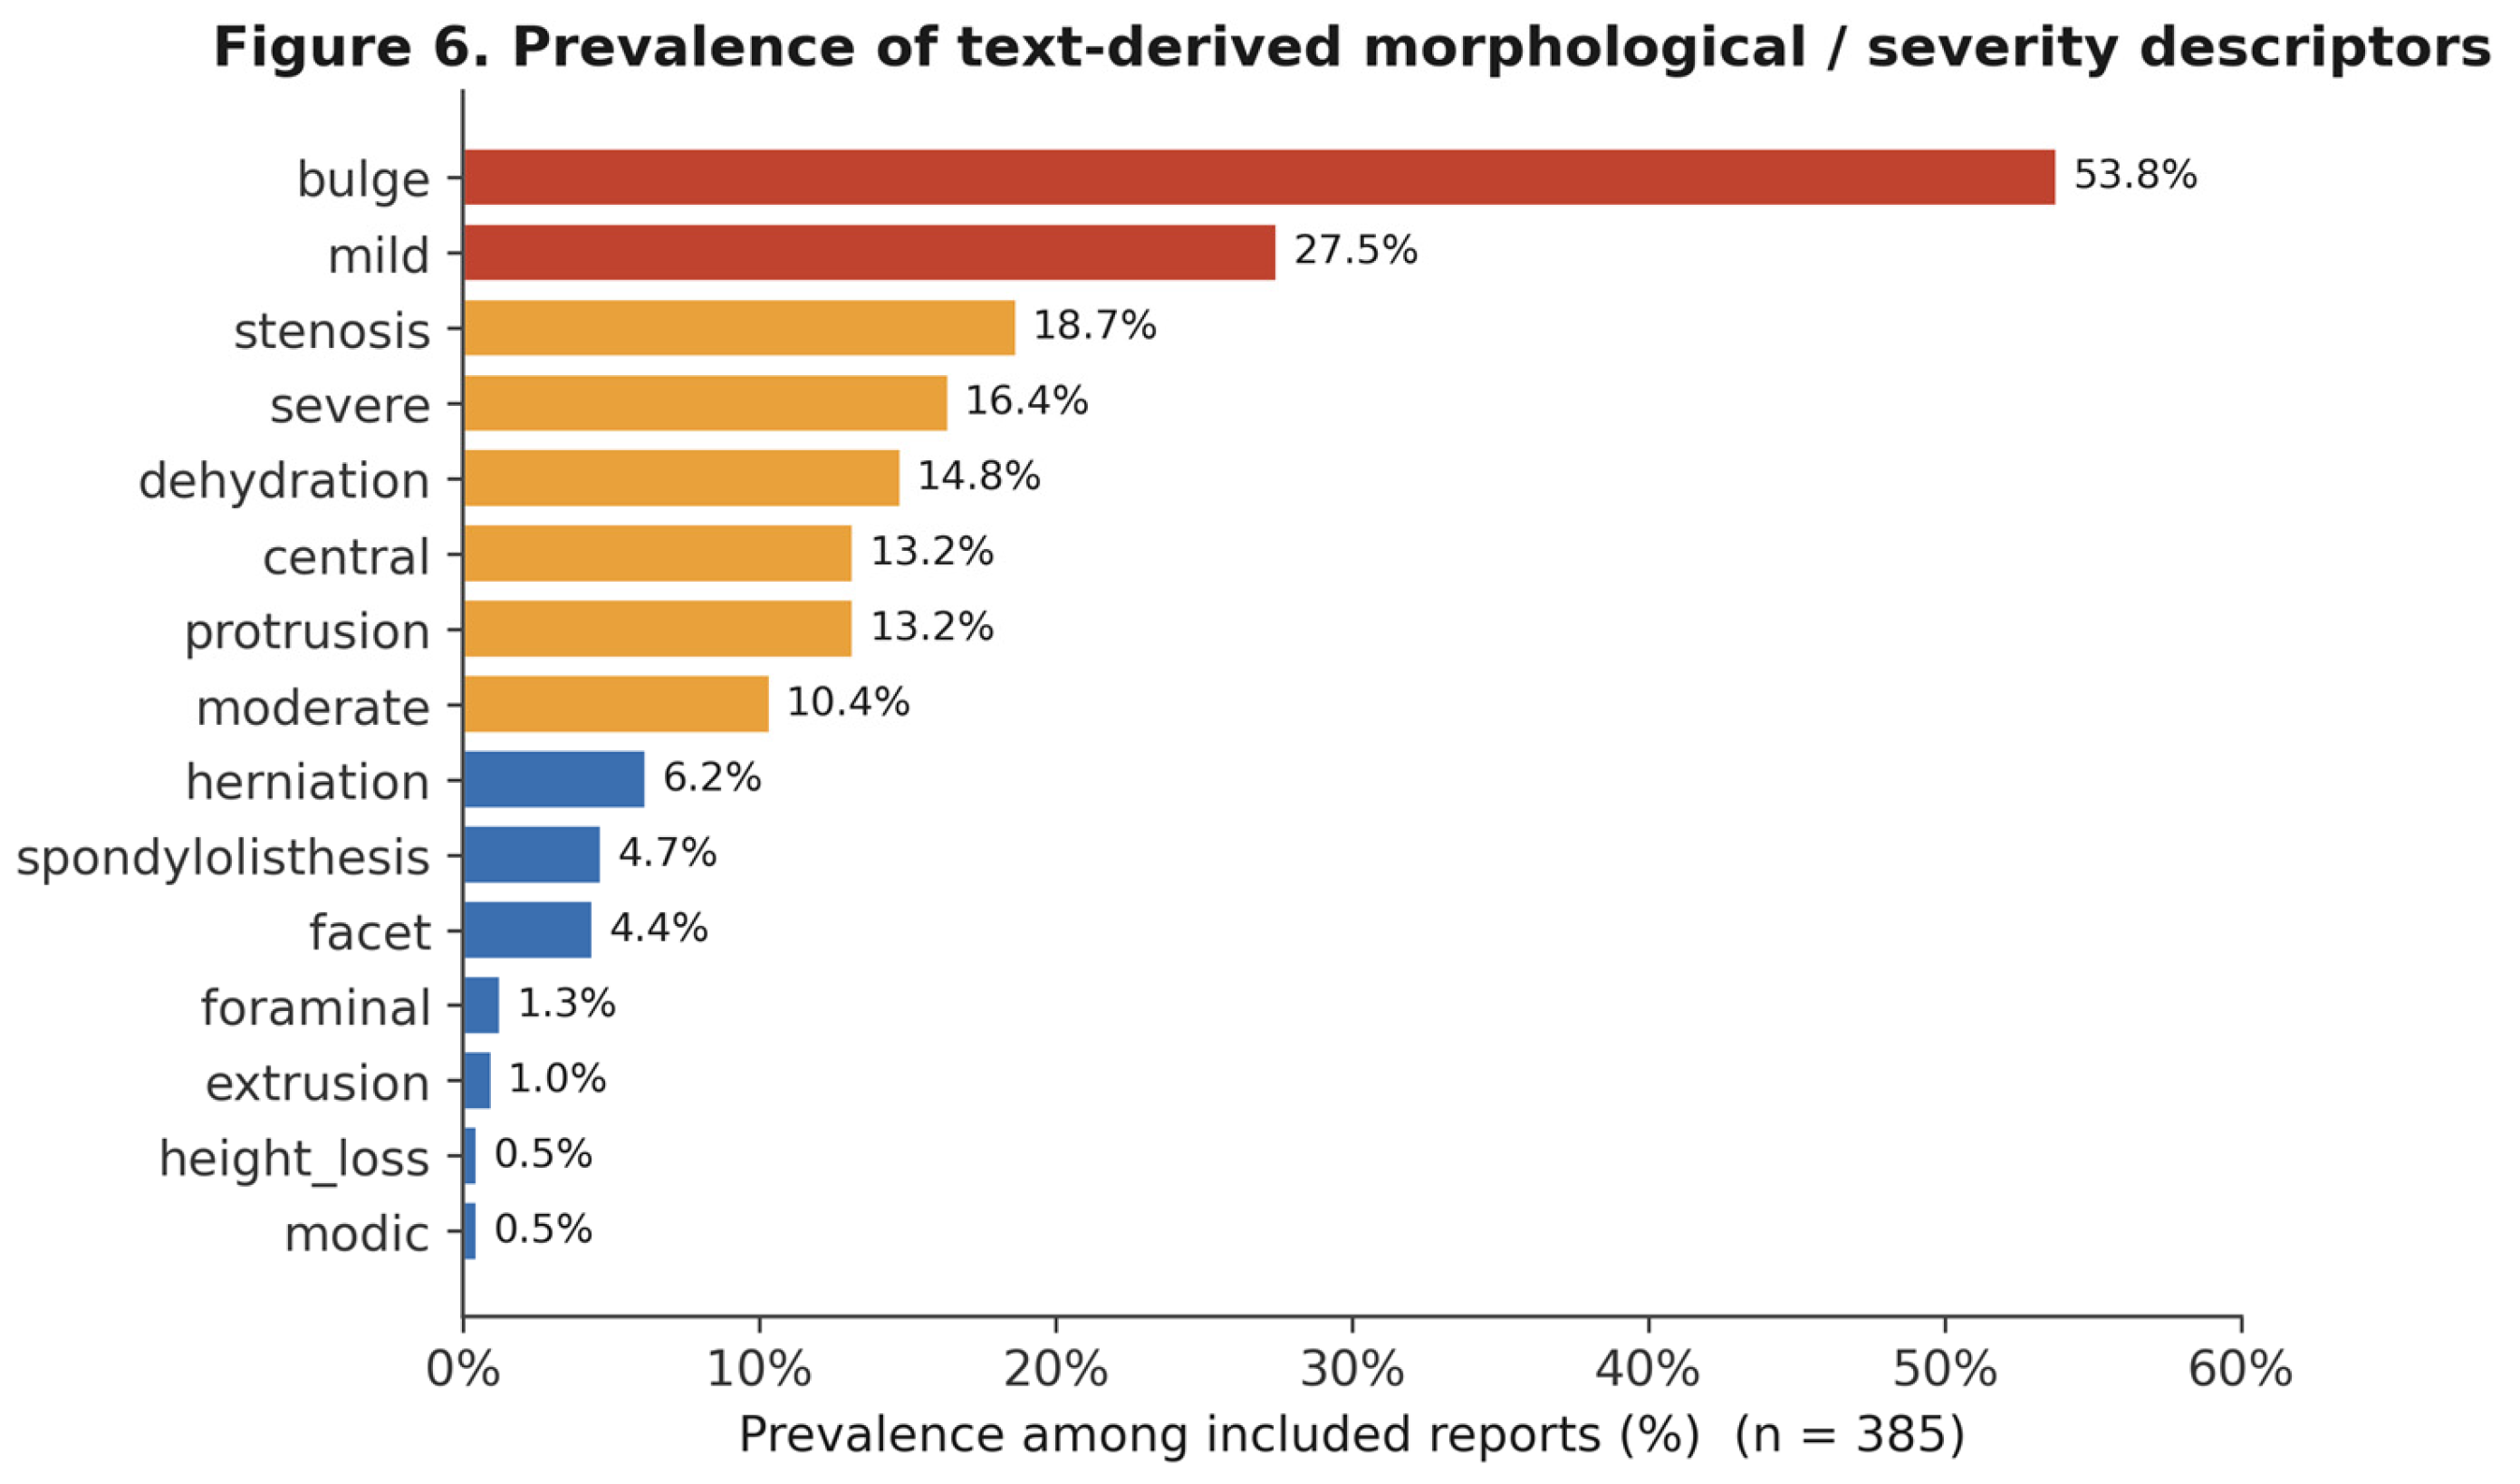
Figure 7.
Keyword prevalence in included versus excluded reports. Asterisks denote significance at FDR-adjusted q < 0.05 (Fisher exact test with Benjamini–Hochberg correction).
Figure 7.
Keyword prevalence in included versus excluded reports. Asterisks denote significance at FDR-adjusted q < 0.05 (Fisher exact test with Benjamini–Hochberg correction).
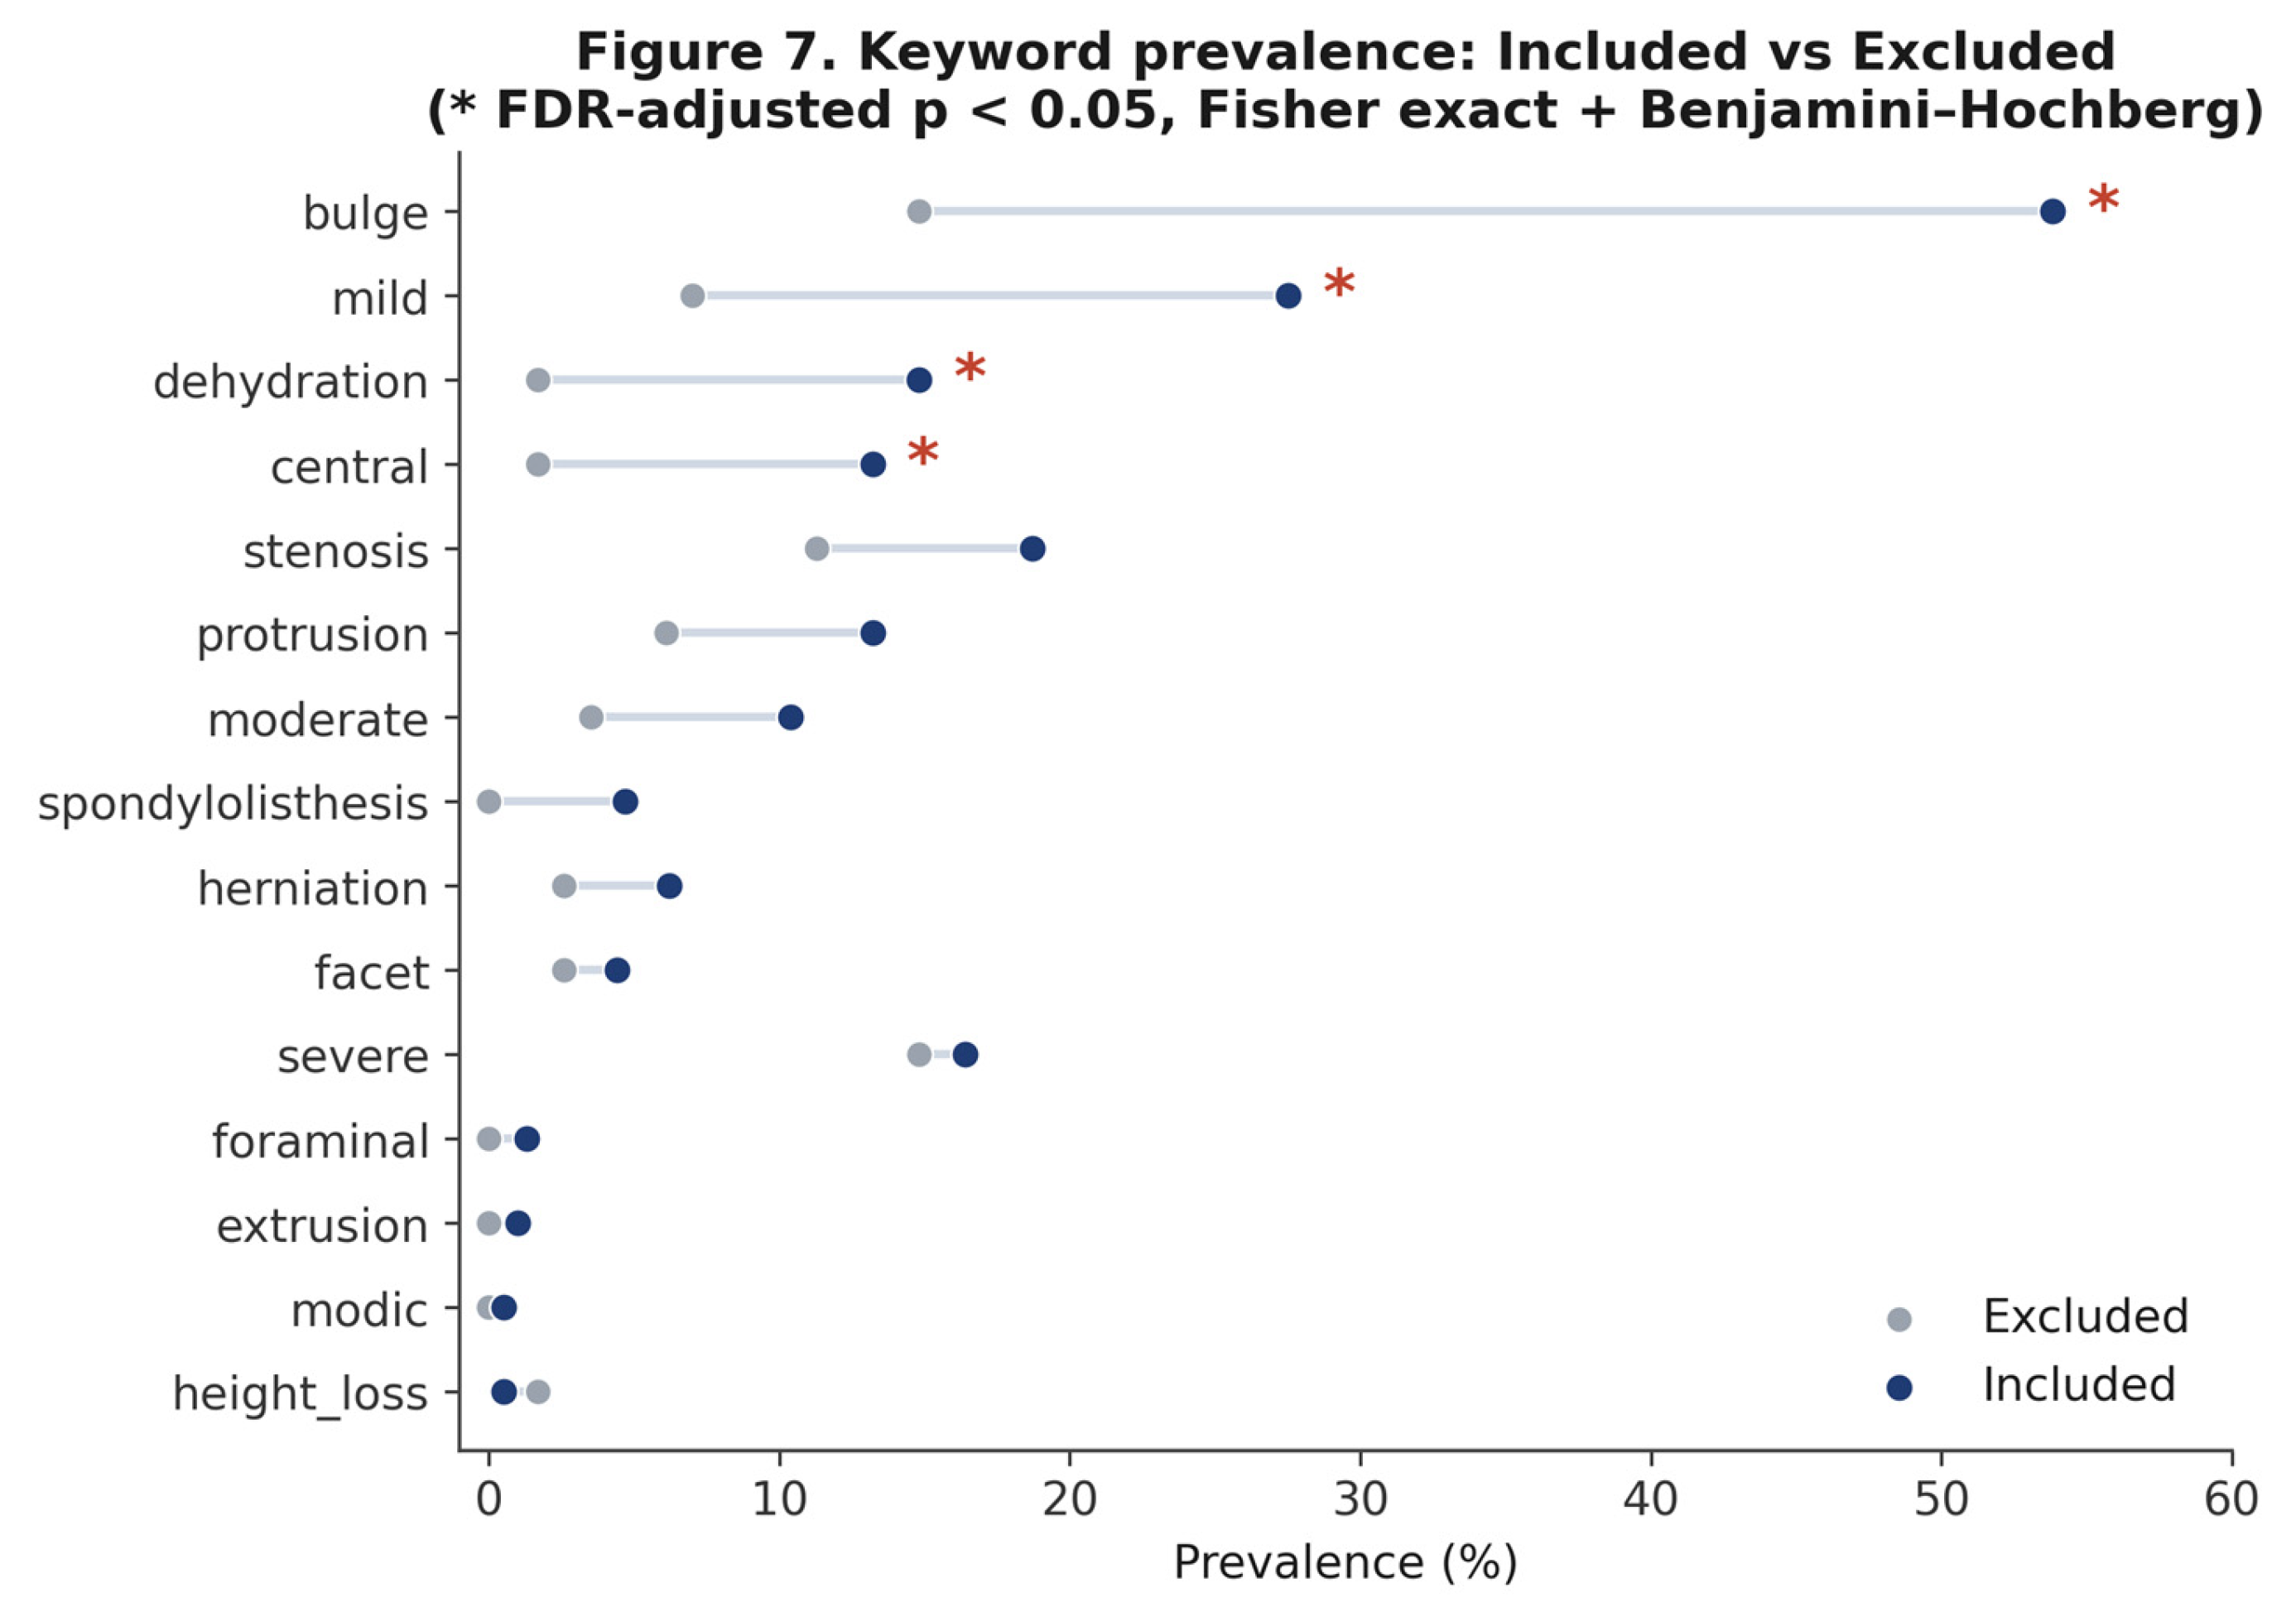
Figure 8.
Distribution of explicitly mentioned lumbar levels at report and patient level, showing caudal predominance at L4–L5 and L5–S1.
Figure 8.
Distribution of explicitly mentioned lumbar levels at report and patient level, showing caudal predominance at L4–L5 and L5–S1.
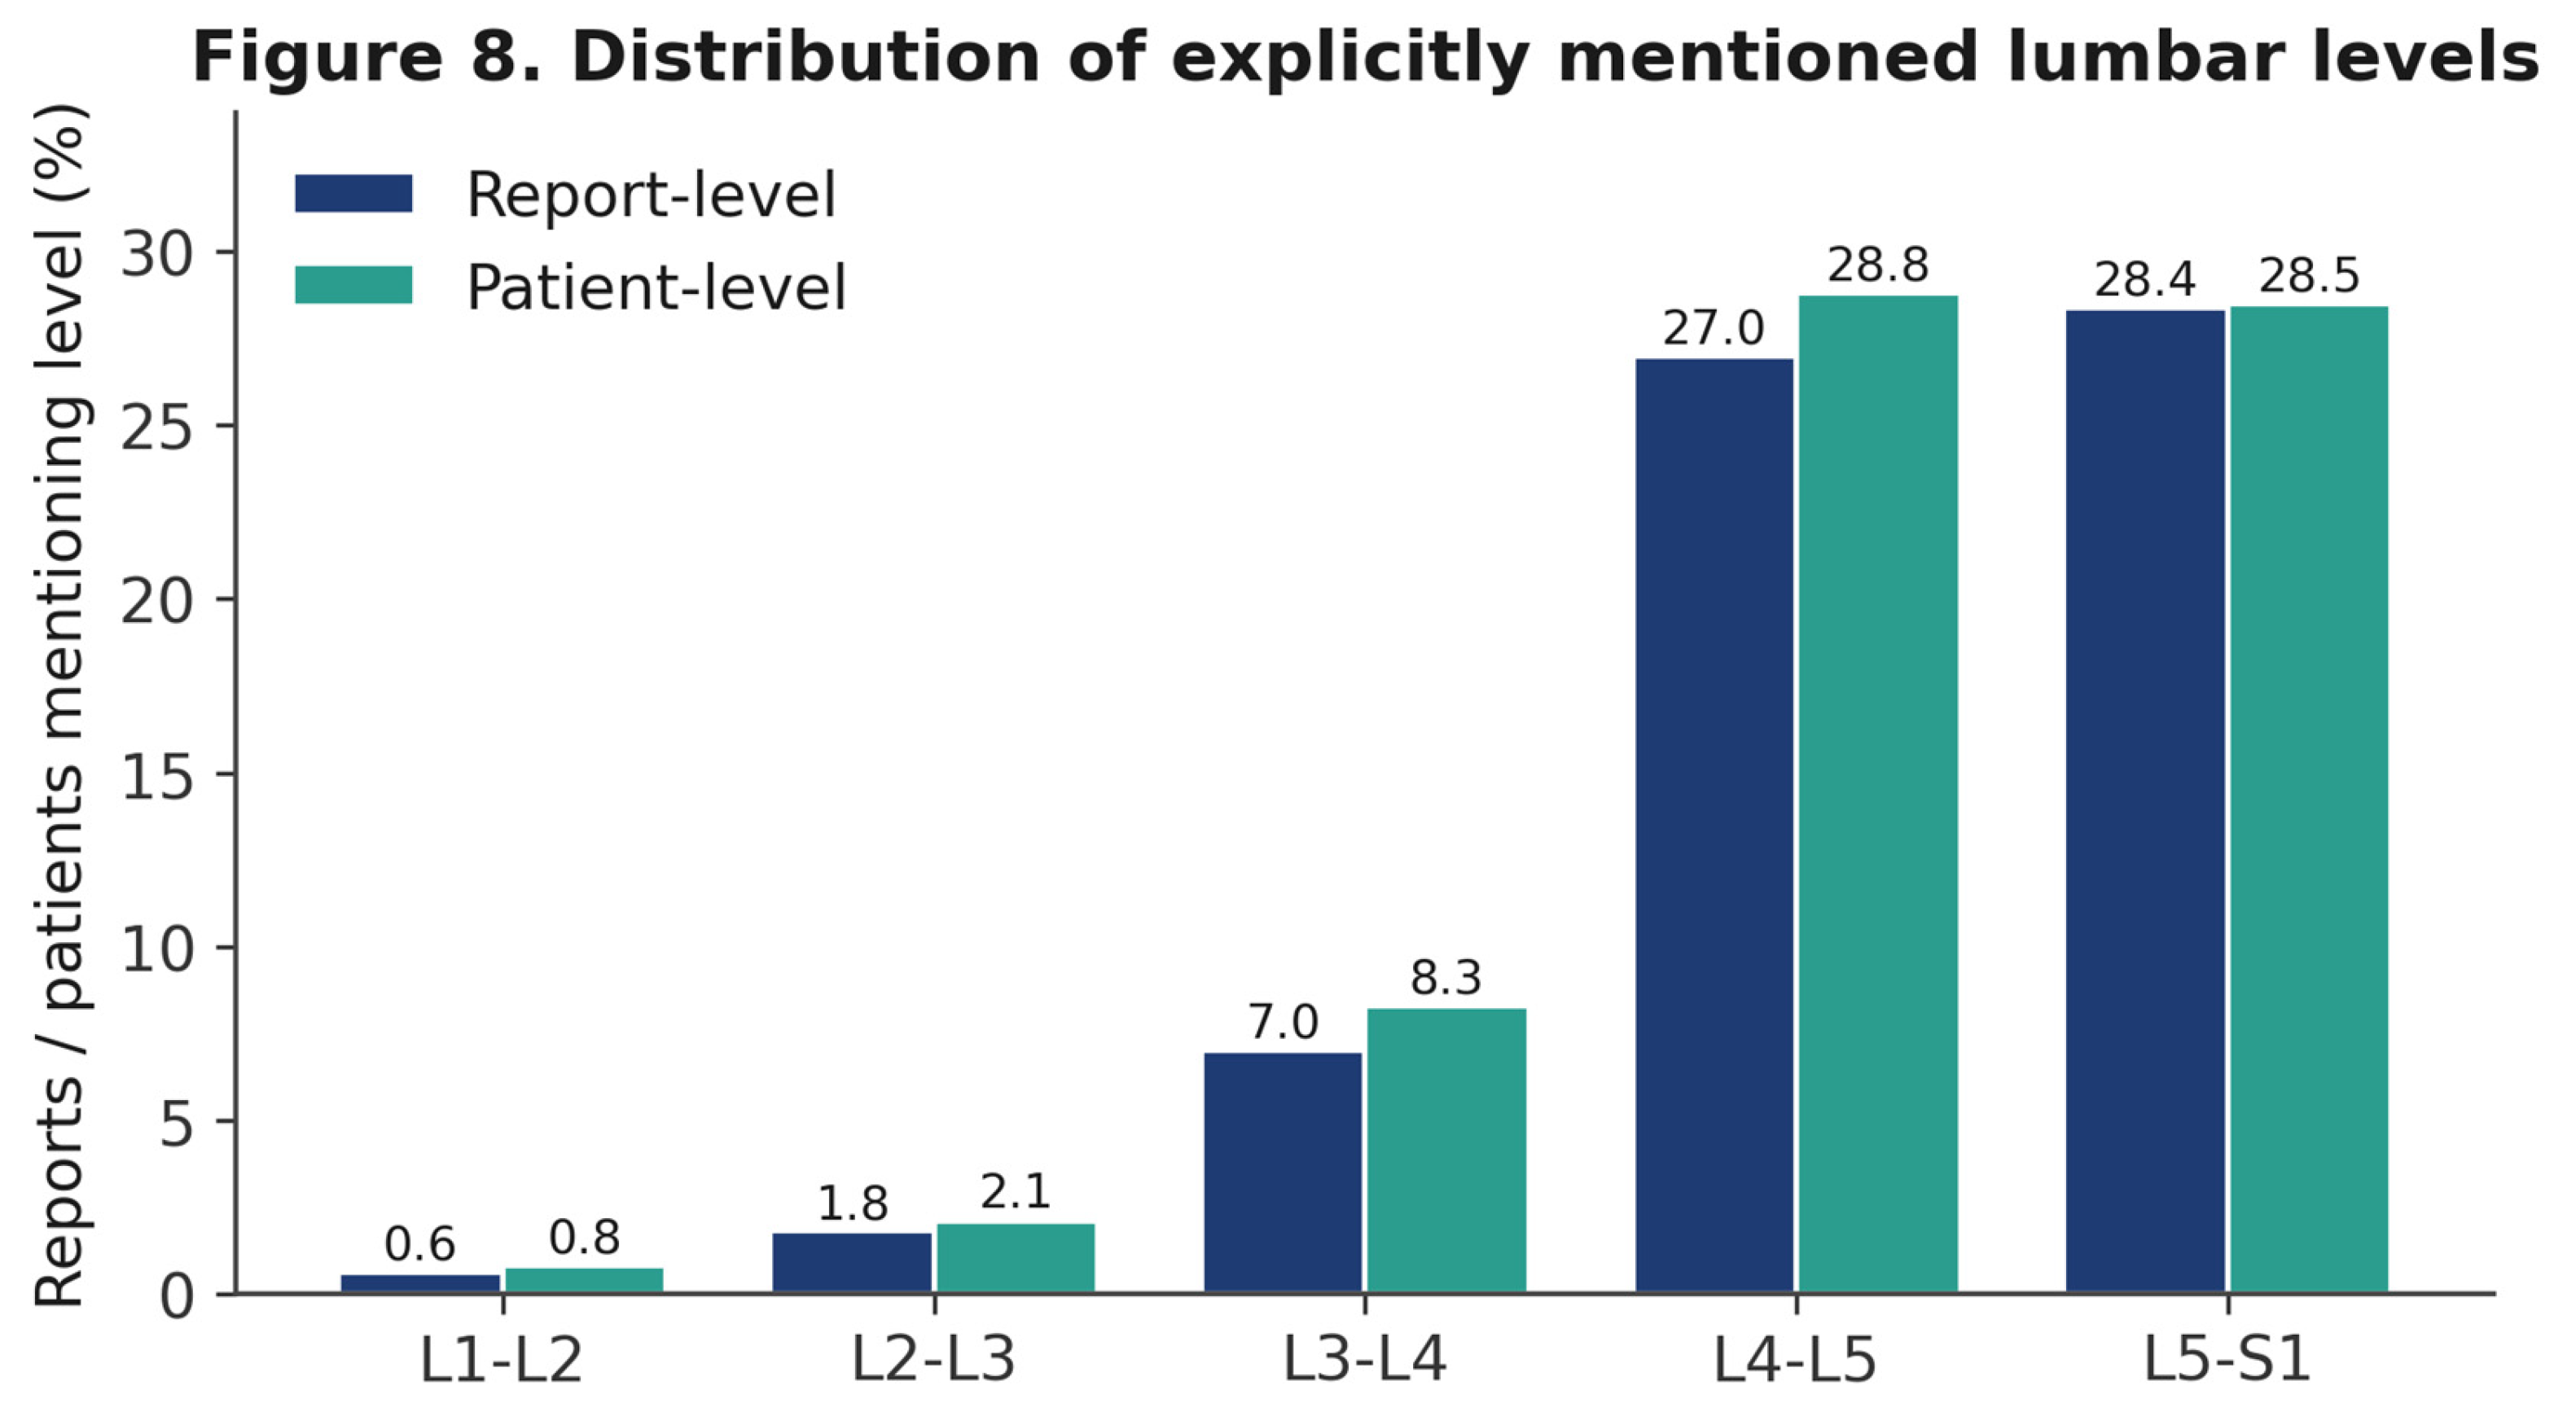
Figure 9.
Number of lumbar levels explicitly enumerated per report within the included cohort (mean 2.84, SD 1.39).
Figure 9.
Number of lumbar levels explicitly enumerated per report within the included cohort (mean 2.84, SD 1.39).
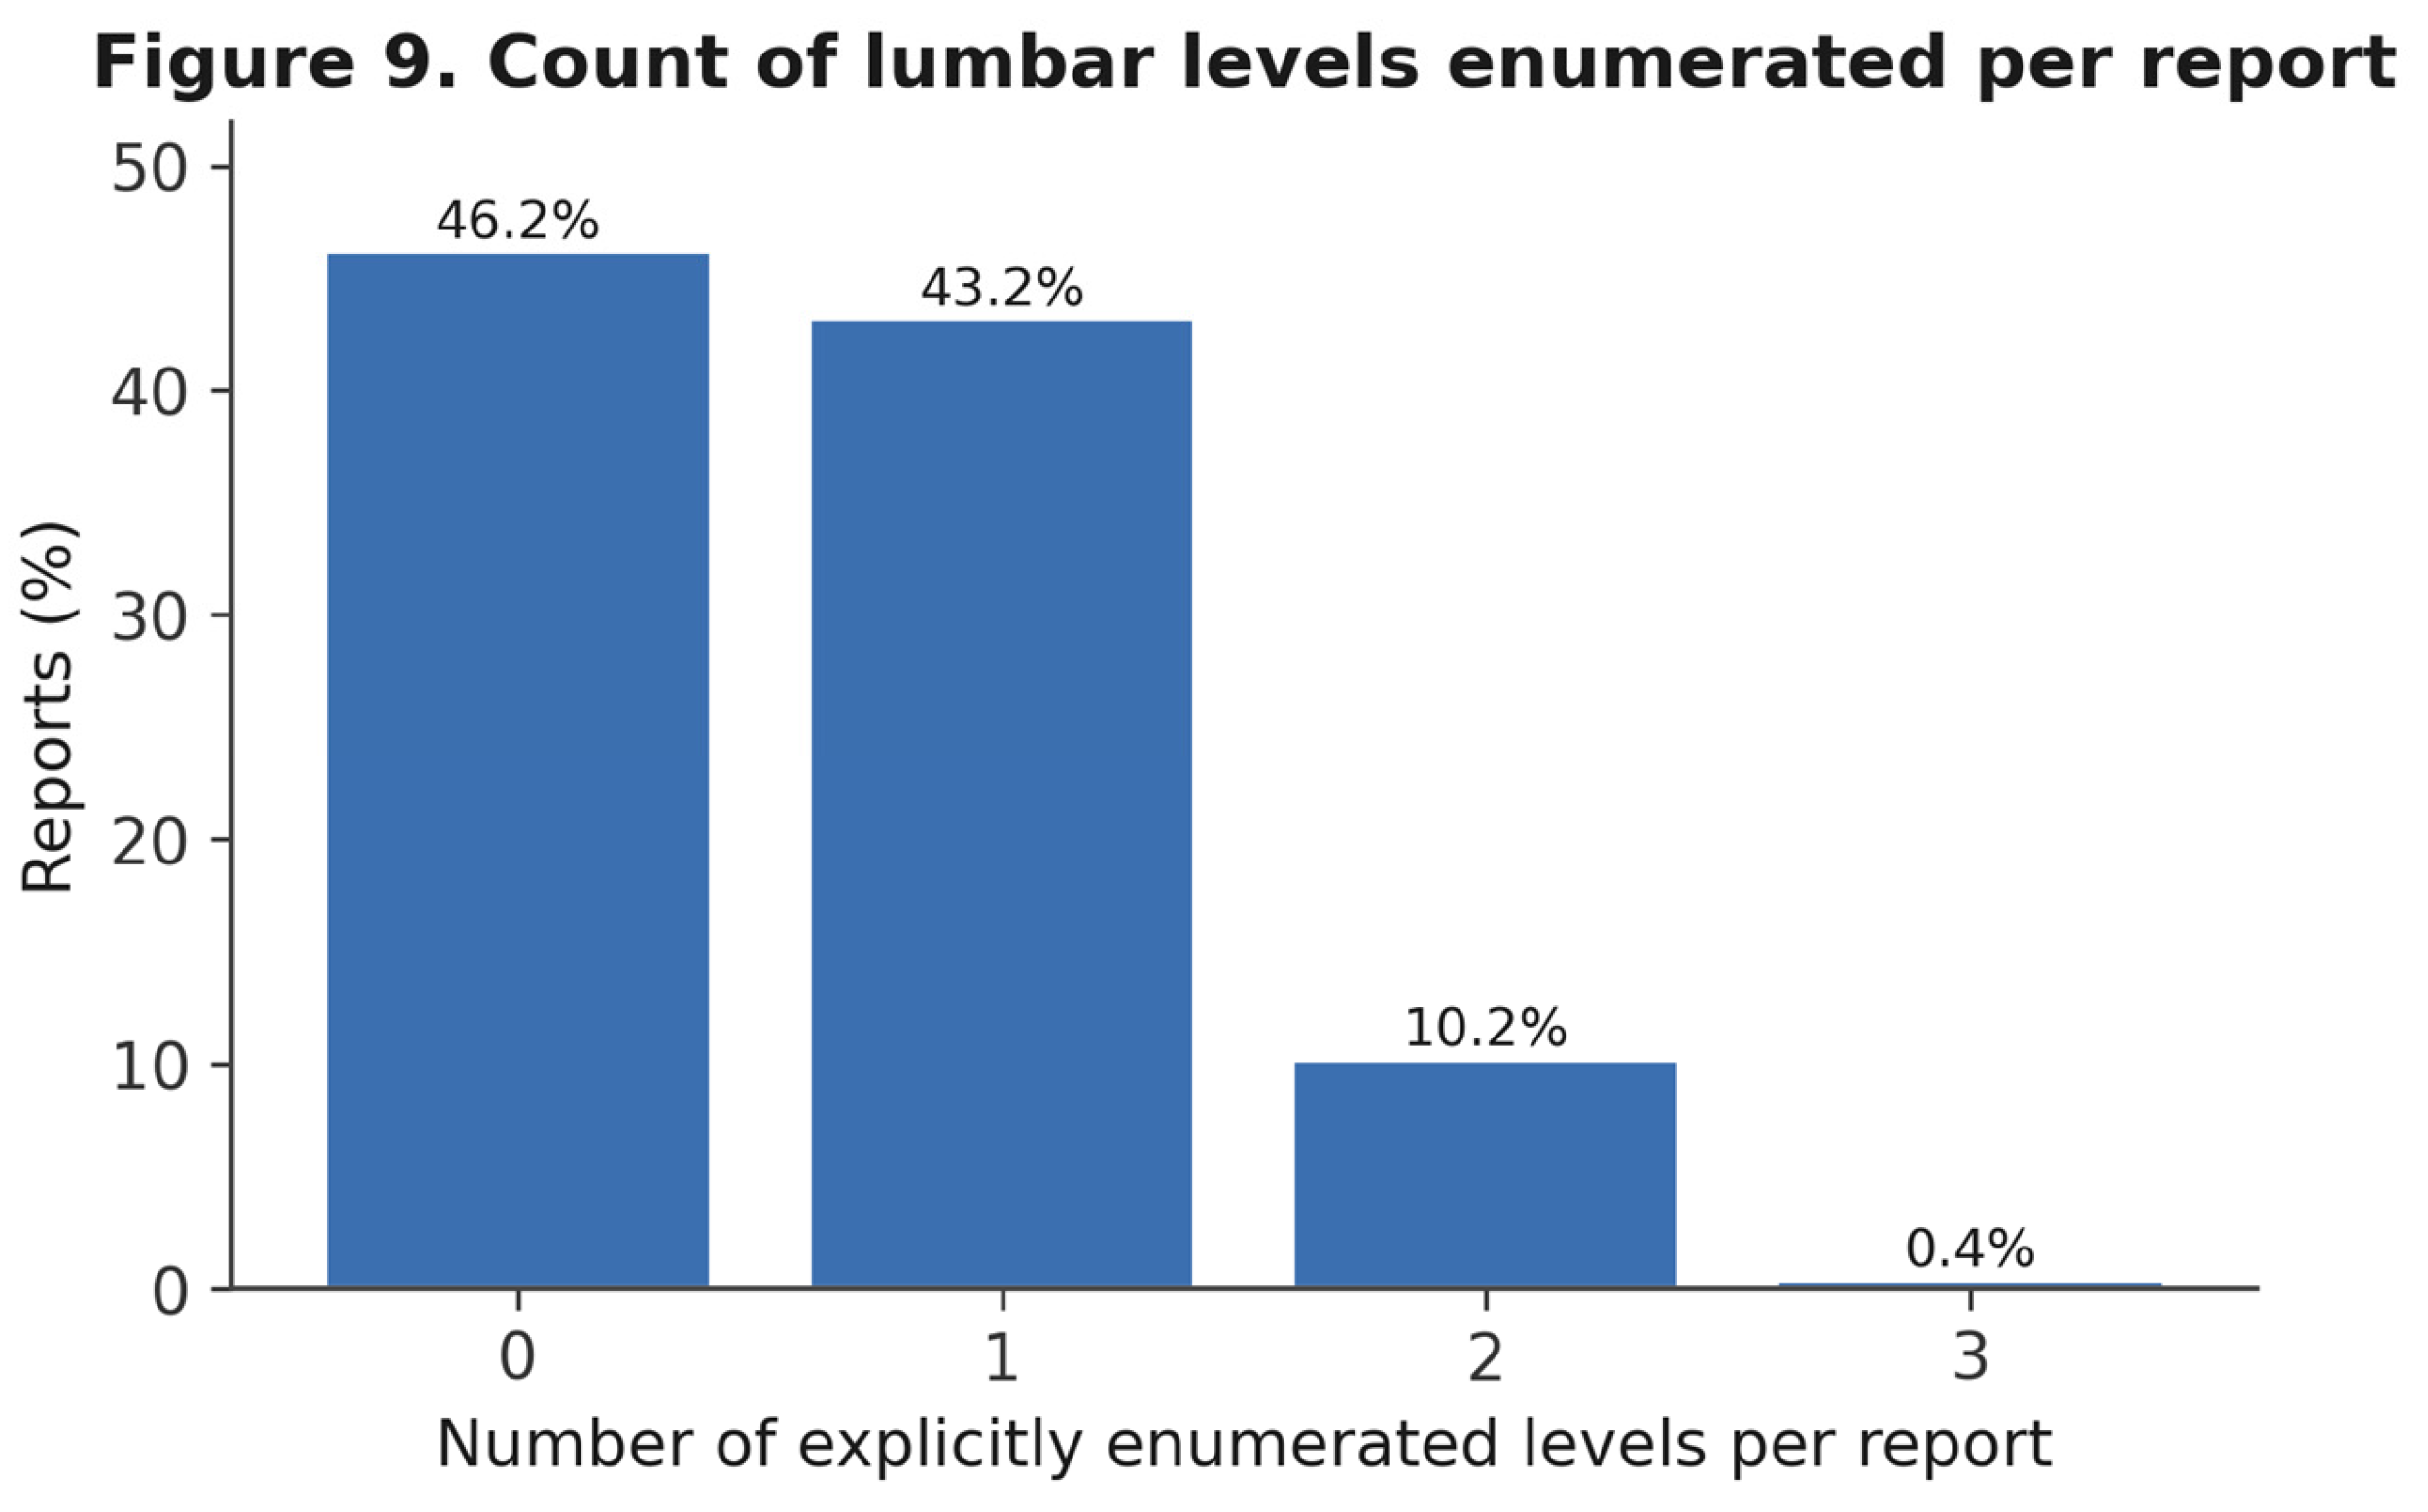
Figure 10.
Derived degeneration severity (0–3) at report and patient level, showing a broadly balanced distribution suitable for benchmarking.
Figure 10.
Derived degeneration severity (0–3) at report and patient level, showing a broadly balanced distribution suitable for benchmarking.
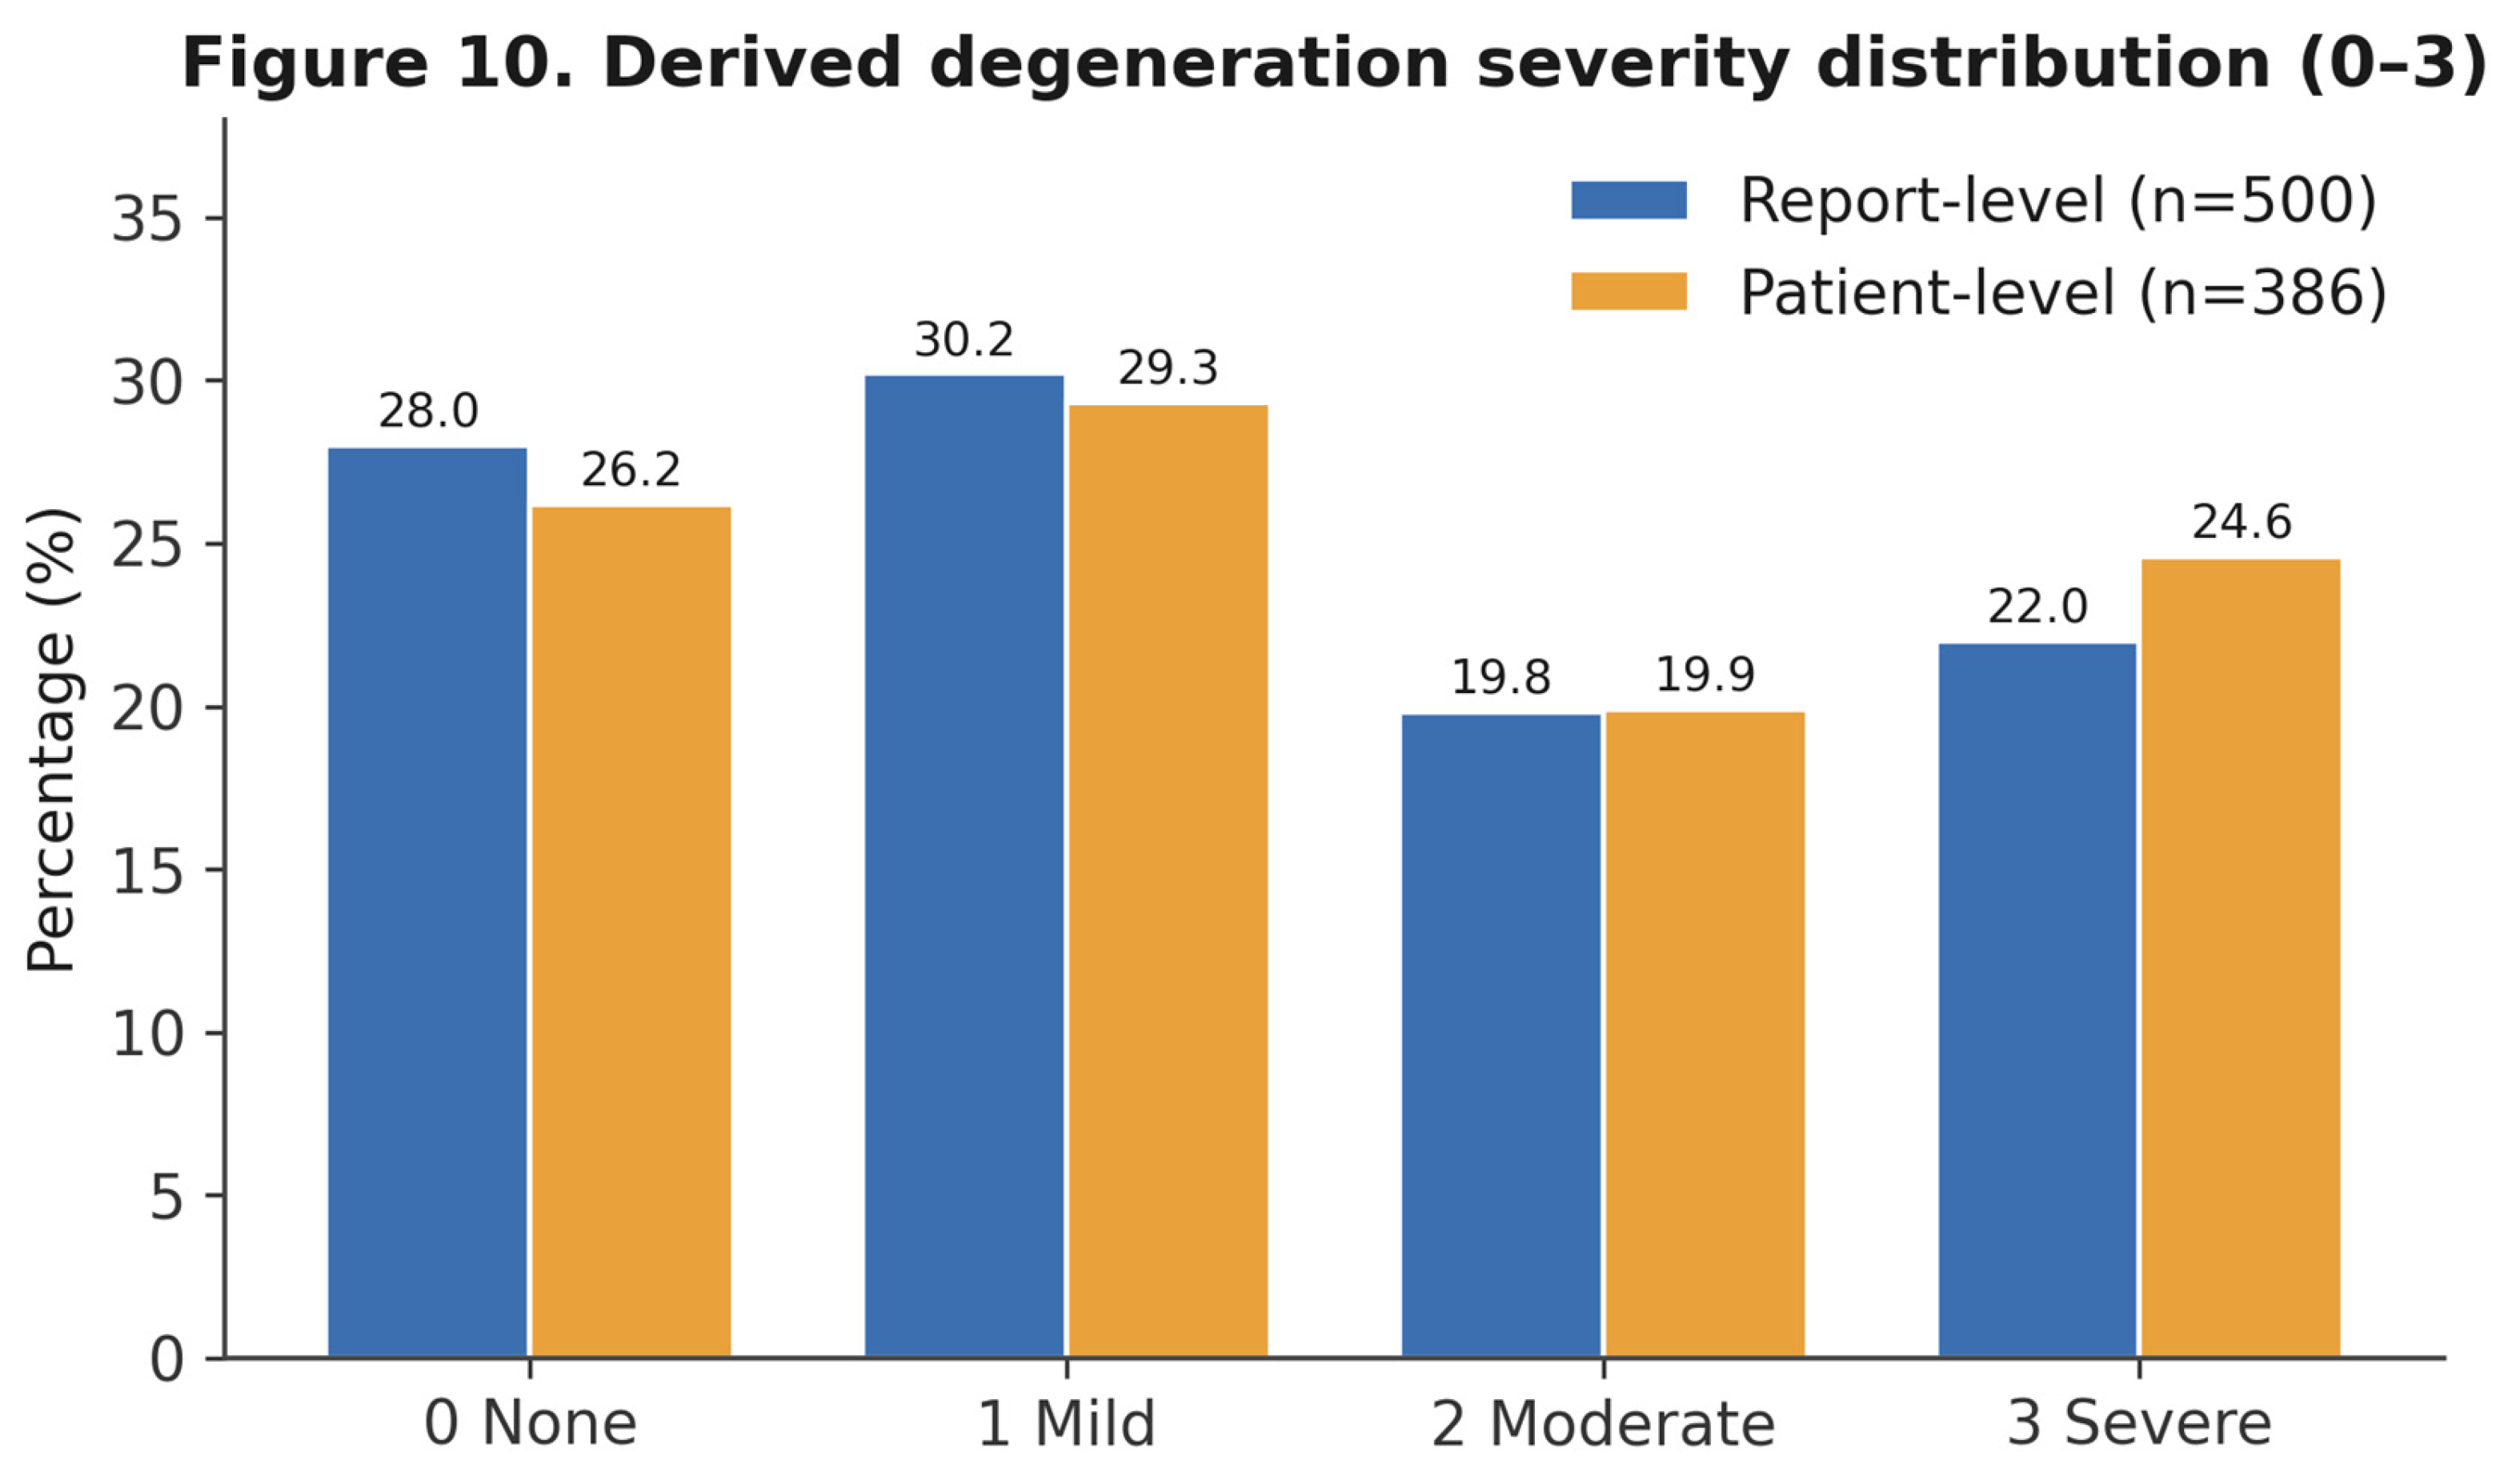
Table 1.
Cohort accounting and temporal coverage.
| Metric | Value |
|---|---|
| Reports extracted (total) | 500 |
| Included (degenerative) | 385 (77.0%) |
| Excluded | 115 (23.0%) |
| Unique patients (total) | 386 |
| Unique patients (≥1 included report) | 295 |
| Reports per patient (1/2/3/4) | 313/48/9/16 |
| Report date range | 24 Dec 2018 – 25 Nov 2025 |
Table 2.
Field completeness (missingness) for extracted variables.
| Field | Missing (%) |
|---|---|
| Morphological keyword (benchmark) | 49.4 |
| Age (numeric) | 16.4 |
| Source context/level | 0 |
| Primary clinical findings | 0 |
| Modic-change status | 0 |
| Inclusion/exclusion status | 0 |
| Sex | 0 |
Table 3.
Keyword prevalence and association with inclusion status (Fisher exact test with Benjamini–Hochberg FDR; sorted by risk difference).
Table 3.
Keyword prevalence and association with inclusion status (Fisher exact test with Benjamini–Hochberg FDR; sorted by risk difference).
| Keyword | Incl. % | Excl. % | Risk diff. (pp) | OR | q (FDR) |
|---|---|---|---|---|---|
| bulge | 53.8 | 14.8 | 39.0 | 6.70 | <0.001* |
| mild | 27.5 | 7.0 | 20.6 | 5.08 | <0.001* |
| dehydration | 14.8 | 1.7 | 13.1 | 9.82 | <0.001* |
| central | 13.2 | 1.7 | 11.5 | 8.63 | <0.001* |
| stenosis | 18.7 | 11.3 | 7.4 | 1.80 | 0.126 |
| protrusion | 13.2 | 6.1 | 7.2 | 2.36 | 0.097 |
| moderate | 10.4 | 3.5 | 6.9 | 3.22 | 0.058 |
| spondylolisthesis | 4.7 | 0.0 | 4.7 | — | 0.054 |
| herniation | 6.2 | 2.6 | 3.6 | 2.48 | 0.269 |
| severe | 16.4 | 14.8 | 1.6 | 1.13 | 0.828 |
pp, percentage points; OR, odds ratio ( indicates undefined OR due to a zero cell); * q < 0.05. Full 15-keyword table is provided in the accompanying figure-data workbook.
Disclaimer/Publisher’s Note: The statements, opinions and data contained in all publications are solely those of the individual author(s) and contributor(s) and not of MDPI and/or the editor(s). MDPI and/or the editor(s) disclaim responsibility for any injury to people or property resulting from any ideas, methods, instructions or products referred to in the content. |
© 2026 by the authors. Licensee MDPI, Basel, Switzerland. This article is an open access article distributed under the terms and conditions of the Creative Commons Attribution (CC BY) license.
Copyright: This open access article is published under a Creative Commons CC BY 4.0 license, which permit the free download, distribution, and reuse, provided that the author and preprint are cited in any reuse.


