

Submitted:
28 June 2026
Posted:
29 June 2026
You are already at the latest version
Abstract
The paper deals with a horizontal seat suspension system in which an electric motor is used as the force actuator. Its active system can operate in a motoring mode, but is also able to act as a generator in regenerative braking mode when the kinetic vibration energy is partially converted into electrical energy. Such an innovative approach to seat vibration control allows to improve the vibro-isolation properties of a suspension system together with reducing the energy consumption of a motor. Within the scope of this paper the effectiveness of an energy regeneration process under random vibration of various intensity is investigated experimentally. The presented results concern both the reduction of vibrations affecting the human body in sitting position, as well as the amount of energy recovered from the seat suspension system during its oscillatory motion.
Keywords:
horizontal seat suspension system
; vibration control
; energy harvesting
1. Introduction
Energy harvesting from vibrating systems is a key research area in the fields of mechanical and electrical engineering. It is also important in materials technology. The phenomenon is based on the conversion of mechanical energy, generated by ambient or system vibrations, into useful electrical energy. It can be used to IoT sensors power systems, self-sufficient technologies or to reduce the total energy demand of the system. The primary vibration energy recovery methods include electromagnetic, electrostatic, and piezoelectric solutions. These three technologies use a different energy conversion process, which determines their effectiveness, implementation limitations, and range of applications.
The piezoelectric conversion uses piezoelectric materials such as different types of ceramics [1,2], polymers [3,4], composites [5] or organic materials [6]. The phenomenon that allows the accumulation of energy is called a piezoelectric effect and was first observed in 1880 by the Pierre and Jacques Curie brothers. The ions or charges in a material are asymmetrically shifted when mechanical stress occurs. Their small size and low weight are ideal for use them in energy recovery subsystems in a wide range of ground transport for example roadways [7], rails [8], bridges [9] or speed bumps [10], and in areas related to everyday duties and natural phenomena.
Energy harvesters based on electrostatic conversion usually use the variable capacitance of capacitors. They convert vibrations from microelectromechanical systems into electrical energy when relative motion between two plates is present. The efficiency of this method depends on the scale of the system and its highest values are found in very small-scale systems such as microsensors. The major use of them is for medical purposes like intra-cardiac implants [11], neural implants [12], or wearable devices [13].
Electromagnetic harvesters work in accordance with Faraday’s Law. The energy is produced when magnetic flux induces a current in a coil or conductor. This method is commonly and widely used in automotive [14,15] as well as in railway [16] and other regenerative systems [17]. This method is characterized by long lifetime work, robustness, and higher output currents than previously mentioned ones. There are also some disadvantages like low output voltage and lower efficiency at small sizes of electromagnetic devices [18]. There are various configurations of technical solutions in the aspect of structures like single or multiple [19] magnet usage or in the aspect of moving parts like harvesters with moving coils [20] or magnets [21].
A further evolution of electromagnetic harvester can be considered as recuperative braking. In such systems kinetic energy during braking phases of electrical motor can produce portion of electrical energy in accordance with induction laws. It can be redirected to recharge batteries, supercapacitors or can be used directly to power sensors present in the system, thereby contributing to the overall energy efficiency of device. Moreover, advanced control strategies are employed to regulate the energy conversion process, ensuring optimal performance while minimizing potential issues like fluctuation in power output.
The recuperative braking can also be used for semi-active and active seat suspension systems. As mentioned in [22] the PMSM motor was adapted to the vehicle body and unsprung mass via mounting rings and played the role of electromagnetic damper. With an external circuit equipped with resistors and MOSFET drivers, this solution provides the possibility for controlling the damping force of suspensions by connecting phases of the motor in various series-parallel resistors configurations providing the possibility to semi-active control of the seat suspension system. In the present paper, this idea is extended to make the BLDC motor a force generator opposing the seat suspension forces or as an energy harvester in regenerative braking mode which will be explained further in the publication.
To summarize the harvesting an additional energy available from working devices is a better solution than implementation of the conventional batteries as source of power for their equipment because the overall value of energy delivered to the system is lower providing better coefficient of used energy, at the same time lowering the cost of machine operation.
2. Physical and Mathematical Model of the Active Horizontal Seat Suspension
In Figure 1a a schematic representation of an active horizontal seat suspension system is presented. The seat is connected to the servo-drive, which provides active force , generated via control inputs , , and subsequently the electrical currents , , . The motor generates a torque directly on the rotor of angular displacement , influencing the seat’s horizontal vibration . The mass m simulates the driver presence that is exposed to the input vibration considered as external disturbances. The Figure 1b shows an actual experimental set-up used to test the vibro-isolation properties of the seat. The seat is mounted on a test rig with mechanical components that simulate real-world vibrations and forces. The setup likely includes sensors and actuators to measure the seat’s response to vibrations, ensuring that the active suspension system can effectively mitigate unwanted oscillations.
The equation of motion for an active horizontal seat suspension is defined as the sum of forces acting on the isolated body:
where: m is the mass of isolated body, is the displacement of a seat, is the conservative force of two tension springs, is the discontinuous force of end-stop buffers that limit the overall stroke of a horizontal suspension, is the damping force of a shock-absorber, is the dissipative friction force of a suspension mechanism. The mathematical models of the passive forces mentioned above are discussed in the Authors’ previous paper [23]. The electromagnetic torque is generated by using the BLDC motor that is in turn converted into the horizontal force . The resulting active force is defined as follows:
where: p is the number of pole pairs, is the amplitude of flux induced by permanent magnets, is the length of a lever arm coupling the motor and suspension system, , , are the phase electromotive forces that are trapezoidal in the case of BLDC motors and , , are the phase currents flowing through the motor windings. These currents are oriented in the three-phase reference frame (-frame) and determined as [24]:
where: is the motor inductance, and are the supply voltages (phase to phase), is the motor resistance, is the external resistance responsible for regenerative braking of an induction motor, is the rotor angular position.
3. Active Vibration Control with Energy Regenerative Braking
The control strategy considered in this paper is based on the field-oriented control (FOC) that enables the induction motor torque control with relatively high efficiency. Block diagram of the proposed control system with the energy recovery braking subsystem is presented in Figure 2.
The FOC method requires decomposition of the three-phase instantaneous motor currents , , into two current components , oriented in the rotating reference frame ( frame) by using the Park transformation [25]:
where: and are the resulting direct and quadrature components of the invariable current vector, respectively. Then two proportional-integral controllers (PI in Figure 2) may be simply implemented to regulate the motor dynamics according to the following principles:
- changing the direct component is responsible for setting the magnetic flux,
- adjusting the quadrature component is responsible for controlling the motor torque.
Typically, the direct component of the current vector is settled to be zero () in order to maximize the motor torque. Thus the desired active force is assumed as proportional to the setting current of the quadrature component:
where: is the torque constant of BLDC motor, is the absolute velocity of isolated body, is the relative displacement of suspension system, and are the control parameters responsible for reducing the harmful vibration (feedback gain ) or limiting the suspension stroke (feedback gain ) in motoring mode of an electric actuator.
When the setting currents and are specified, then the PI controllers should efficiently minimize the errors between demanded and actually measured motor currents by applying appropriate voltages and . In succession, these voltages specified in rotating reference frame ( frame) shall be transformed back into stationary reference frame ( frame) by employing the inverse Park transformation [25]:
The braking force of an induction motor is approximated as the quadratic polynomial function with interactions between the relative velocity of a suspension system and the voltage signal that is used for motor control in regenerative braking mode:
where: a, b, c, d and e are the numerical constants to be calculated by using the least square method from the measurement results. The inverse polynomial model defining the control signal of an induction motor in braking mode is as follows:
where: is the ratio between the braking force achieved for an original hardware implementation of the energy recovery braking subsystem and the desired active force of a specific motor type. Numerical parameters of the BLDC motor and its braking subsystem are listed in Appendix A.
4. Hardware Implementation
In this work, a system was developed to implement the regenerative braking function for a BLDC motor. Braking resistors (, , , ..., , , ) are connected to the three windings of the motor through switching transistors (, , , ..., , , ). The schematic diagram of this solution is presented in Figure 3.
An external microcontroller converts the analogue braking voltage signal generated by the control logic into one of five digital signals (, ..., ). Each of these signals activates a specific group of MOSFET transistors via a transistor driver. At any given time, only one subgroup of transistors can be activated, enabling the braking intensity to be divided into five levels, ranging from minimum to maximum. The resistance values of individual resistors are determined experimentally to ensure an even distribution of braking force levels. The highest braking intensity corresponds to , while the lowest corresponds to . The corresponding resistance levels are as follows: ; ; , and . The currents , , , ..., , , induced in the motor windings during regenerative braking are measured using current sensors (ACS742 manufactured by Allegro Microsystems) based on the Hall effect. This approach enables precise recording and further analysis of the regenerated current intensity.
5. System Identification
The next objective of the research is to analyze how the active braking force generated by the BLDC motor changes as a function of the relative displacement and different set values of the quadrature current component . In Figure 4a the experimental data (dotted lines - measurements) showing the actual active force exerted by the motor for different values of , i.e. ; ; ; and are presented. In this case, the sinusoidal movement of suspension mechanism is applied at relative displacement of . The solid lines (approximations) show a very close match to the measurements, indicating a reliable approximation model (Figure 4b). The force output of an electric motor increases proportionally in the current domain. This suggests that the active force in motoring mode is primarily a function of setting current whereas the relative displacement of suspension mechanism is irrelevant. Therefore the objective is to identify the control signal (i.e. current) that corresponds to a desired active force.
The identification process shown in Figure 5 provides a detailed model of how a BLDC motor behaves in regenerative braking mode, focusing on both forward (direct) and inverse mappings between the braking force, control signal and relative velocity of suspension mechanism. To model the regenerated braking force as a function of brake signal and relative velocity, the experimental measurements is required. At first step the actual braking force is obtained for various combinations of control voltage and velocity. In Figure 5a the braking force as a function of brake signal and relative velocity is presented. The blue dots represent measured data points. Next the colored surface is obtained, which shows the approximated model i.e. the fitted surface over the measured data that estimates braking force. This surface is determined using a quadratic model of the regression function, suggesting that braking force increases with brake signal, decreases slightly with increasing velocity (at a fixed brake signal). It behaves in a smooth and continuous manner, suitable for control systems. In Figure 5b, the inverse model of the control signal as a function of braking force and relative velocity is shown. This inverse function is essential for feedback control. If a target braking force is applied and the current velocity is known then the control system can calculate the exact brake signal.
6. Laboratory Experimental Results
Figure 6 illustrates the behavior of the Brushless DC (BLDC) motor during both regenerative braking (energy regeneration – braking mode) and active phase (motoring mode), under three different excitation intensities, i.e. WN1, WN2 and WN3. This figure is organized in pairs of subplots for each excitation intensity. Whereas the figure columns represent energy regeneration and motoring mode respectively. In figures representing energy regeneration (blue curves) are referenced to setting current for the quadrature axis component during motoring mode. The (green curves) are the brake signals (control voltage) indicating regenerative operation. The pink shaded regions indicate regenerative braking intervals where becomes active. In Figure 6b, d and f representing motoring mode the signals (cyan curves), (magenta curves) and (yellow curve) are referenced to phase currents of the BLDC motor. The pink shaded regions indicate regenerative braking intervals as well.
General conclusions arise after analyzing regenerative and motoring modes. In the case of first one the shows alternating positive and negative setpoints, while spikes to positive voltages to activate braking. IN the pink regions quickly drops or reverses, indicating energy regeneration. The response of to braking commands remains sharp, showing effective switching between braking and motoring. Simultaneously, the phase currents , and exhibit stronger amplitudes oscillation with increasing intensity. This reflects greater energy recovery potential with higher excitation intensity. Such a dynamics suggest improved responsiveness and braking torque under WN3 conditions. Summarizing, when intensity excitation increases from WN1 to WN3 then the intensity of motor excitation increases as well. This results in faster and more dynamic transitions in , stronger and larger regenerated phase currents. Control behavior is effectively defined by signal in regenerative braking intervals and based on control requirements adapted signal that vanishes during regeneration.
The results in Figure 7 illustrate the transmissibility functions of different seat suspension systems (passive, active and regenerative) under varying load conditions (40 kg, 60 kg and 80 kg) and different excitation intensities (WN1-WN3). In the case of passive suspension system (Fig Figure 7a-b) the effect of excitation intensity (a - left panel) in the fact that the transmissibility is highest at low frequencies (0-3 Hz), gradually decreasing at higher frequencies. Variations between WN1-WN3 are minor but indicate that higher excitation intensities very slightly increase transmissibility at certain frequencies. The effect of mass load (b - right panel) shows increasing the mass load from 40 kg to 80 kg results in a slight shift in peak transmissibility. The transmissibility at lower frequencies (approx. 0.5 Hz) is firstly higher for lower mass loads (40 kg) but then reduces (in range 1-2 Hz) as mass increases, suggesting improved damping with heavier mass loads. Above 2 Hz to the end of tested frequency range the effect is the opposite one.
Figs. Figure 7c-d show the results for the fully active suspension system. The effect of excitation intensity (c - left panel), where the active system demonstrates a lower transmissibility compared to the passive system, indicates improved vibration control. The transmissibility remains relatively stable across different excitation intensities (WN1-WN3) and is bellow the value of 1. The effect of mass loading (d - right panel) is demonstrated by the fact that increasing the mass from 40 kg to 80 kg causes a reduction in peak transmission and is comparable in the low frequency range (1-5 Hz). Above 5 Hz to the end of tested frequency range the effect is the opposite one, i.e. a higher mass load causes a decrease in the magnitude of the transmissibility function. The active system maintains better stability across different mass loads compared to the passive system.
Figure 7e-f presents vibro-isolation properties of the proposed regenerative suspension system. The effect of excitation intensity (e - left panel) is comparable to the active system. However, the regenerative system shows significantly reduced transmissibility compared to the passive system, because the response is more stable across excitation intensities (WN1-WN3). In comparison to the active one, the regenerative system transmissibility slightly increase value of 1 for low frequency range (1-3 Hz). The effect of mass load (f - right panel) shows that the transmissibility function is similar to the active system, but some variations at higher frequencies suggest energy recovery effects, especially above 4 Hz. The higher mass loads generally reduce transmissibility, improving the damping effect as in other seat suspension cases, but in this case correlated with energy harvesting. The numerical values of SEAT factor and suspension travel for the passive, active and regenerative seat suspension at different excitation intensity and various mass load are reported in Table 1.
Figure 8 consists of two 3-D bar charts depicting the root mean square, i.e. RMS current and RMS power, generated by the energy recovery braking subsystem under different conditions. Figure 8a represents RMS current for different excitation signals (WN1, WN2, WN3) and mass loads (from 40 kg to 80 kg). It is clearly shown that the RMS current increases with higher excitation intensity (WN1-WN3) and the RMS current also generally increases with mass load but at different rates depending on the excitation signal. The highest RMS current (2.654 A) occurs at WN3 and mass load 80 kg and the lowest (1.02 A) at WN1 with a lower mass load (40 kg). Figure 8b represents RMS power under the same conditions. Similar to electrical current, RMS power increases with excitation intensity and mass load. The highest RMS power (7.692 W) is observed at WN3 with a heavier load 80kg, while the lowest power (2.13 W) appears at WN1 with a lighter load 40 kg. In general, the Figure 8 demonstrates that stronger excitation and heavier loads result in greater RMS current and power, emphasizing the efficiency of the braking energy recovery system under laboratory conditions.
7. Conclusions
Passive suspension introduces higher transmissibility with noticeable variations depending on the load and excitation intensity. Active suspension provides lower transmissibility and is effective in reducing vibrations across all load conditions. Regenerative suspension performs similarly to the active system especially at frequencies above 3 Hz but offers the additional advantage of energy recovery. The influence of mass load reveals that higher loads lead to reduced transmissibility indicating improved damping performance across all suspension types while in the case of the regenerative system this effect is also related to increased potential for energy harvesting. The identification results demonstrate that the active and regenerative braking forces of the BLDC motor can be precisely controlled using simple and well-approximated relationships with control signals and dynamic parameters. A linear relationship between the current signal and active force is identified allowing for a straightforward model to compute the required current for any desired force level. In regenerative braking mode the regenerated braking force is influenced by both the control signal and the relative velocity of suspension mechanism. A two-variable surface model accurately approximates this relationship and its inverse function enables the computation of the necessary control signal to achieve a desired braking force at a given relative velocity. Both modes of operation benefit from simple linear or bilinear models making them ideal for real-time implementation in control systems.
Author Contributions
Conceptualization, I.M. and A.B.; methodology, T.K.2.; software, T.K.1., S.P. and B.J.; validation, I.M. and J.B.; formal analysis, I.M., T.K.1. and A.B.; investigation, I.M. and S.P.; resources, T.K.1., T.K.2. and J.B.; data curation, I.M. and S.P.; writing—original draft preparation, I.M., A.B. and S.P.; writing—review and editing, I.M., A.B. and S.P.; visualization, I.M. and J.B.; supervision, T.K.1., T.K.2.; project administration, T.K.1., T.K.2.; funding acquisition, T.K.1., T.K.2. and J.B. All authors have read and agreed to the published version of the manuscript.
Funding
This research received no external funding.
Institutional Review Board Statement
Not applicable.
Informed Consent Statement
Not applicable.
Data Availability Statement
Not applicable.
Acknowledgments
We would like to thank Isringhausen GMBH and CO. KG for the assistance in the experimental research.
Conflicts of Interest
The authors declare no conflict of interest.
Appendix A. Numerical Parameters of the BLDC Motor and Its Braking Subsystem
| Model parameters | Numerical values |
| amplitude of a flux induced by permanent magnets () | |
| first controller setting () | 7 |
| second controller setting () | 20 |
| ratio between maximum braking force and maximum | |
| active force () | |
| torque constant of a motor () | |
| inductance of a motor () | |
| length of the lever arm () | |
| number of pole pairs (p) | 3 |
| resistance of a motor () |
References
- Li, Hao J.; Zhai, W.; J. Chen, H. Progress in high-strain perovskite piezoelectric ceramics. Mater. Sci. Eng. R Rep. 2019, 135, 1–57. [Google Scholar] [CrossRef]
- Bhimireddi, Ponraj B.; Varma, R.K.B.R. Effect of nano- and micron-sized K0.5Na0.5NbO3 fillers on the dielectric and piezoelectric properties of PVDF composites. J. Adv. Ceram. 2016, 5, 308–320. [Google Scholar] [CrossRef]
- Lang, S.B.; Muensit, S.; Lang, S.; Muensit, S. Review of some lesser-known applications of piezoelectric and pyroelectric polymers. Appl. Phys. A 2006, 85, 125–134. [Google Scholar] [CrossRef]
- Zhu, J.; Jia, L.; Huang, R. Electrospinning poly(l-lactic acid) piezoelectric ordered porous nanofibers for strain sensing and energy harvesting. J. Mater. Sci. Mater. Electron. 2017, 28, 12080–12085. [Google Scholar] [CrossRef]
- Li, Hou Ch.; Lin, Z. Fei Ch.; Luo, Q.; Wei, X.; Yang, X.; Lu, Y.; Quan, Q.; Dong, Y.; Chen, G.; Lu, Z.; Bao, X.; W. Yang, Y. Gradient piezoelectric composites for ultrasonic transducer design and imaging applications. J. Mater. 2025, 11((6) ID), 101049. [Google Scholar] [CrossRef]
- Kapat, K.; Shubhra, Q.T.H.; Zhou, M.; Leeuwenburgh, S. Piezoelectric Nano-Biomaterials for Biomedicine and Tissue Regeneration. Adv. Funct. Mater. 2020, 30((44) ID), 1909045. [Google Scholar] [CrossRef]
- Song, Y.; et al. Road energy harvester designed as a macro-power source using the piezoelectric effect. Int. J. Hydrogen Energy 2016, 41(29), 12563–12568. [Google Scholar] [CrossRef]
- Gao, M.Y.; Wang, P.; Cao, Y.; Chen, R.; Liu, C. A rail-borne piezoelectric transducer for energy harvesting of railway vibration. J. Vibroengineering 2016, 18(7), 4647–4663. [Google Scholar] [CrossRef]
- Wang, H.; Jasim, A.; Chen, X. Energy harvesting technologies in roadway and bridge for different applications – A comprehensive review. Appl. Energy 2018, 212, 1083–1094. [Google Scholar] [CrossRef]
- Chen, N.; Jung, H.J.; Jabbar, H.; Sung, T.H.; Wei, T. A piezoelectric impact-induced vibration cantilever energy harvester from speed bump with a low-power power management circuit. Sens. Actuators A Phys. 2017, 254, 134–144. [Google Scholar] [CrossRef]
- Lee, P. J.; et al. Early experience with intracardiac echocardiography guidance for atrial leadless pacemaker implantation. Heart Rhythm 2025. [Google Scholar] [CrossRef] [PubMed]
- Ahmed S. Kakkar, V. An Electret-Based Angular Electrostatic Energy Harvester for Battery-Less Cardiac and Neural Implants. IEEE Access 2017, 5, 19631–19643. [Google Scholar] [CrossRef]
- Linh, V.T.N.; Han, S.; Koh, E.; Kim, S.; Jung, H.S.; Koo, J. Advances in wearable electronics for monitoring human organs: Bridging external and internal health assessments. Biomaterials 2025, 314 ID, 122865. [Google Scholar] [CrossRef] [PubMed]
- Bai, S.; Liu, C. Overview of energy harvesting and emission reduction technologies in hybrid electric vehicles. Renew. Sustain. Energy Rev. 2021, 147 ID, 111188. [Google Scholar] [CrossRef]
- Bentouba, S.; Zioui, N.; Breuhaus, P.; Bourouis, M. Overview of the Potential of Energy Harvesting Sources in Electric Vehicles. Energies 2023, 16((13) ID), 5193. [Google Scholar] [CrossRef]
- Hadas, Z.; Rubes, O.; Ksica, F.; Chalupa, J. Kinetic Electromagnetic Energy Harvester for Railway Applications—Development and Test with Wireless Sensor. Sensors 2022, 22((30 ID), 905. [Google Scholar] [CrossRef] [PubMed]
- Taithongchai, T.; Leelarasmee. E., Adaptive electromagnetic energy harvesting circuit for wireless sensor application. 6th International Conference on Electrical Engineering/Electronics, Computer, Telecommunications and Information Technology, IEEE, May 2009; pp. 278–281. [Google Scholar] [CrossRef]
- Li, Z.; Yan, Z.; Luo, J.; Yang, Z. Performance comparison of electromagnetic energy harvesters based on magnet arrays of alternating polarity and configuration. Energy Convers. Manag. 2019, 179, 132–140. [Google Scholar] [CrossRef]
- Halim, M.A.; Park, J.Y. Modeling and experiment of a handy motion driven, frequency up-converting electromagnetic energy harvester using transverse impact by spherical ball. Sens. Actuators A Phys. 2015, 229, 50–58. [Google Scholar] [CrossRef]
- Qiu, J.; et al. Multi-directional electromagnetic vibration energy harvester using circular Halbach array. AIP Adv. 2017, 7(5). [Google Scholar] [CrossRef]
- Sun, S.; Dai, X.; Wang, K.; Xiang, X.; Ding, G.; Zhao, X. Nonlinear Electromagnetic Vibration Energy Harvester With Closed Magnetic Circuit. IEEE Magn. Lett. 2018, (9), 1–4. [Google Scholar] [CrossRef]
- Qin, A.; Zhang, B.; Ning, D.; Tan, B.; Du, H. A self-sensing approach for estimating suspension displacement and velocity in semi-active electromagnetic dampers. Mech. Syst. Signal Process. 2024, 208 ID, 111049. [Google Scholar] [CrossRef]
- Krzyzynski, T.; Maciejewski, I.; Meyer, L.; Meyer, H. Modelling and Control Design of Vibration Reduction Systems; Springer Nature Switzerland AG: Cham, 2019. [Google Scholar] [CrossRef]
- Krause, P.C.; Wasynczuk, O.; Sudhoff, S.D.; Pekarek, S. Analysis of Electric Machinery and Drive Systems; John Willey & Sons, Hoboken, 2013. [Google Scholar] [CrossRef]
- Chattopadhyay, S.; Mitra, M.; Sengupta, S. Electric Power Quality: Clarke and Park Transform; Springer Science & Business Media: Dordrecht, 2011. [Google Scholar] [CrossRef]
Figure 1.
Physical model of the active horizontal seat suspension (a) and experimental set-up for measuring its vibro-isolation properties
Figure 1.
Physical model of the active horizontal seat suspension (a) and experimental set-up for measuring its vibro-isolation properties
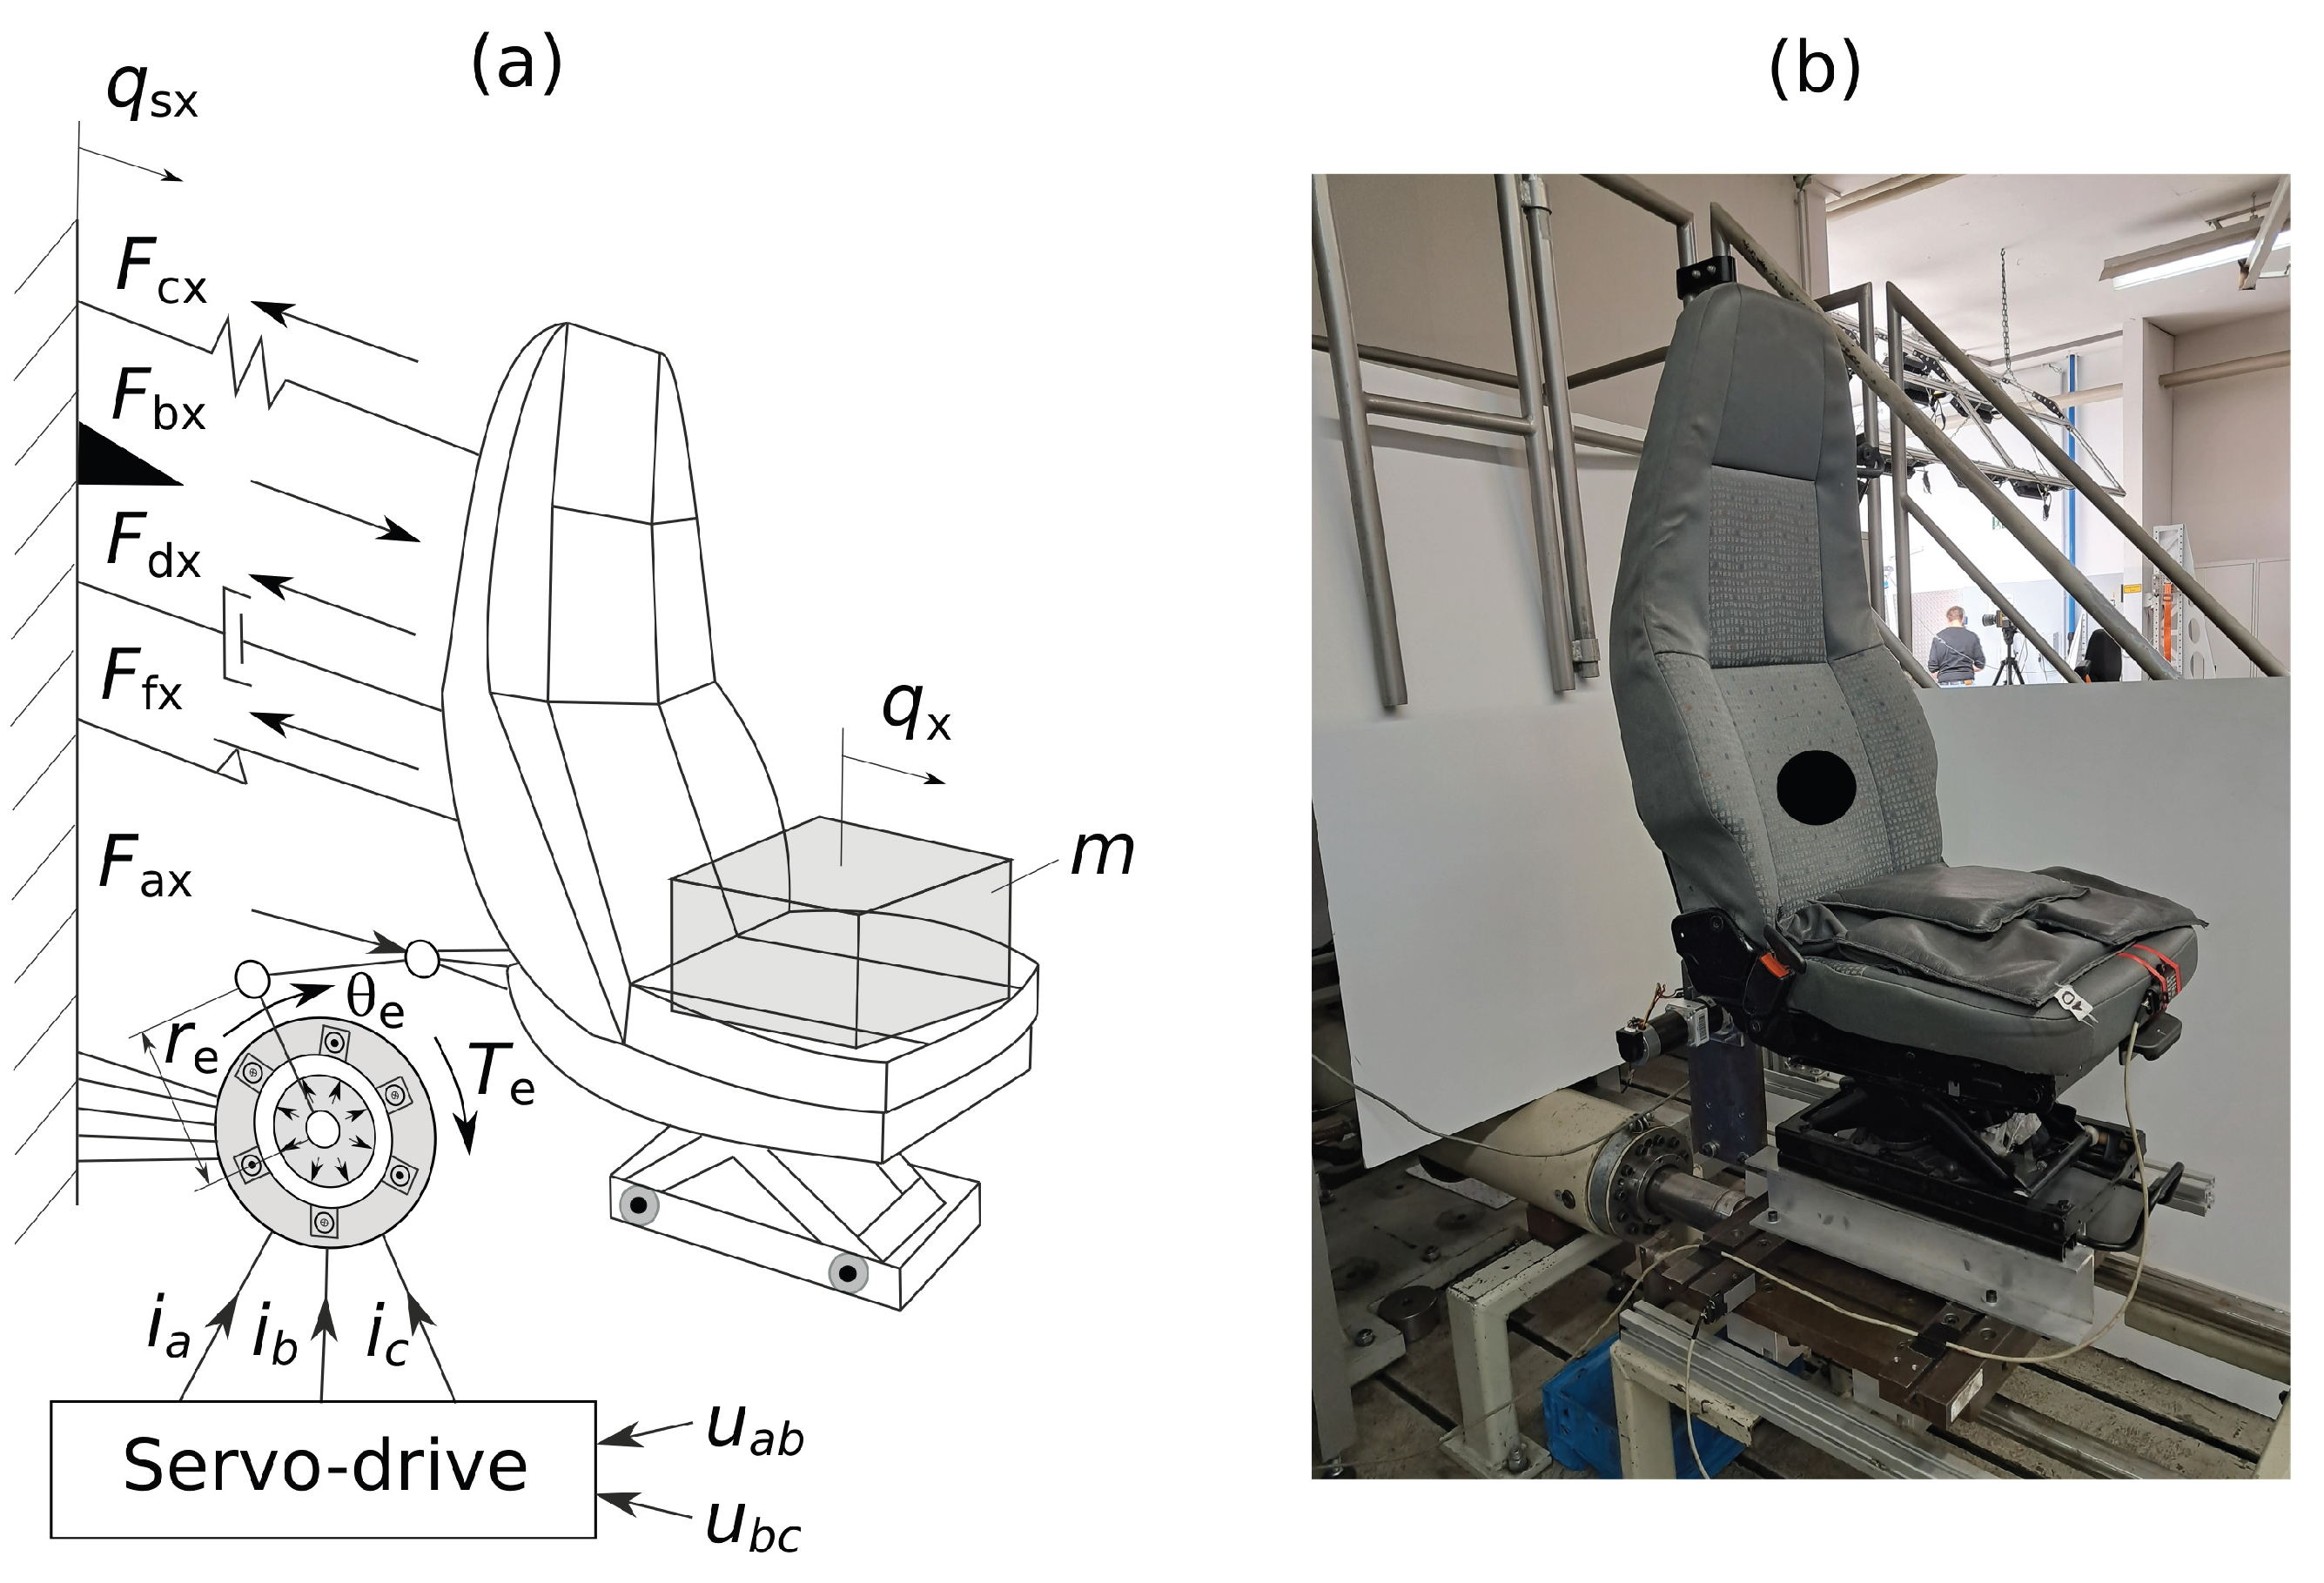
Figure 2.
Block diagram of the proposed control system of an active horizontal seat suspension with the energy recovery braking subsystem
Figure 2.
Block diagram of the proposed control system of an active horizontal seat suspension with the energy recovery braking subsystem
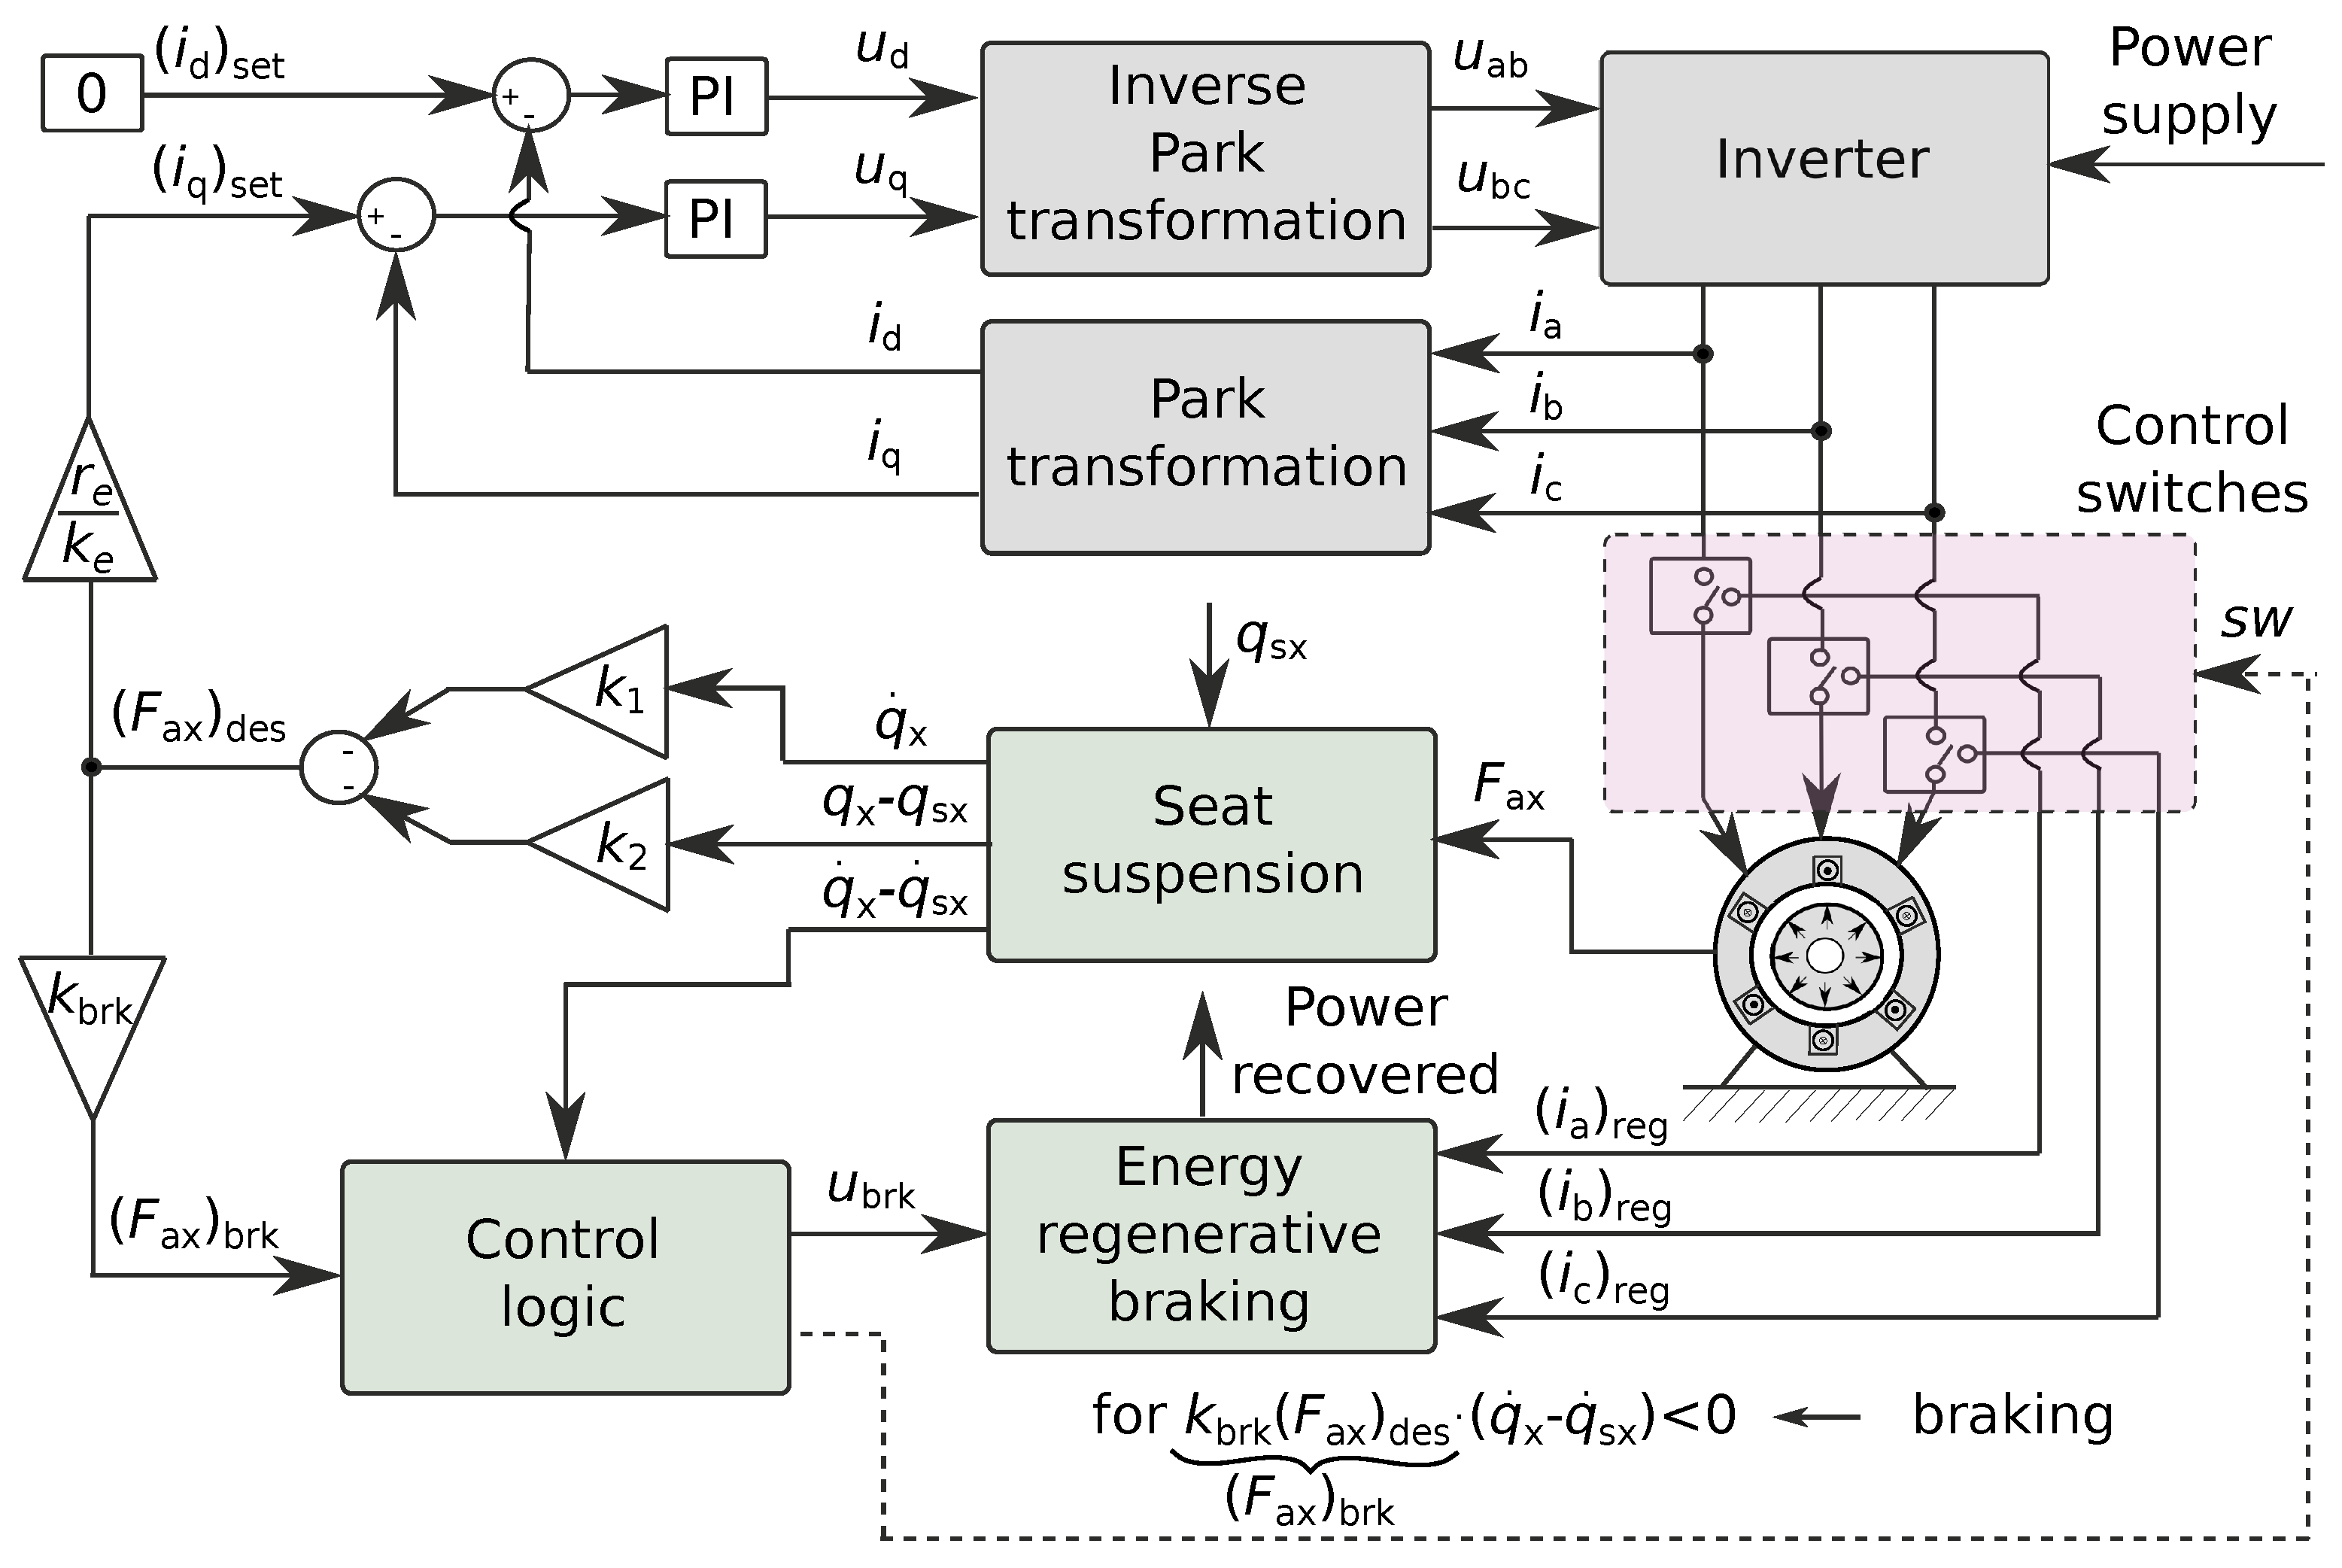
Figure 3.
Hardware implementation of the energy recovery braking subsystem operating together with BLDC motor
Figure 3.
Hardware implementation of the energy recovery braking subsystem operating together with BLDC motor
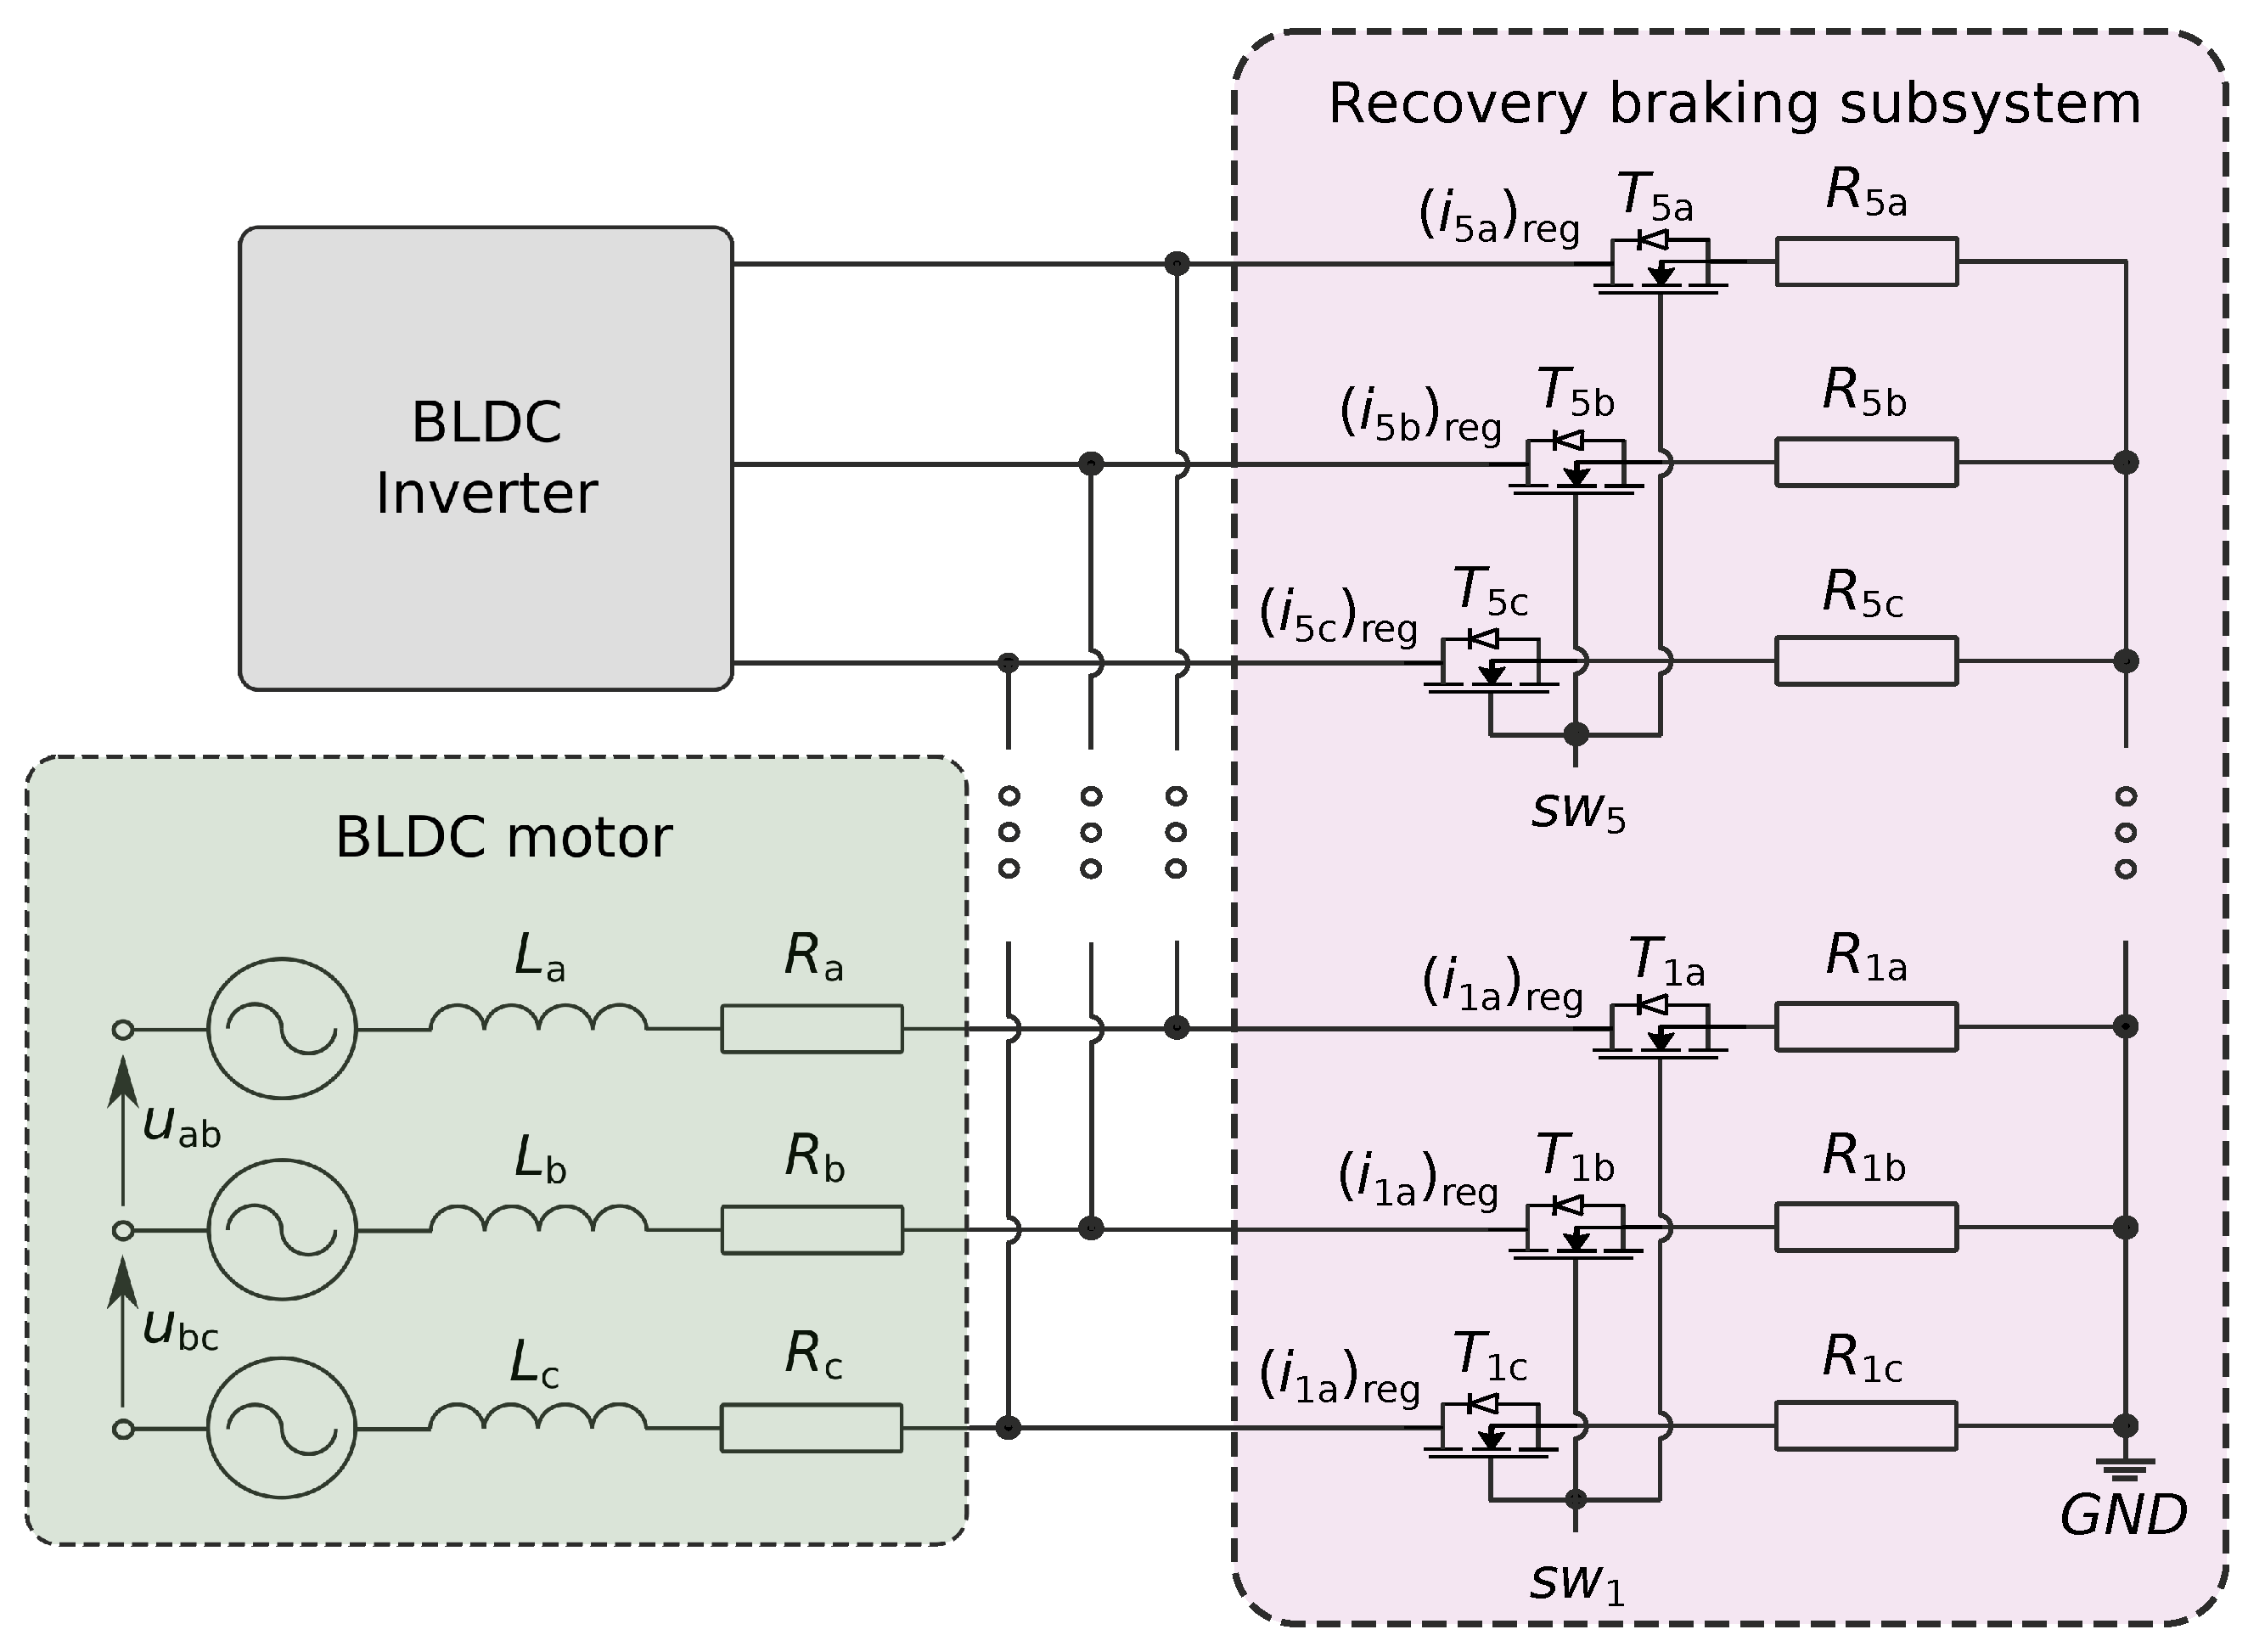
Figure 4.
Measured active force in motoring mode versus relative displacement of suspension mechanism at different setting current of quadrature component (a) and linear approximation of the desired active force (b)
Figure 4.
Measured active force in motoring mode versus relative displacement of suspension mechanism at different setting current of quadrature component (a) and linear approximation of the desired active force (b)
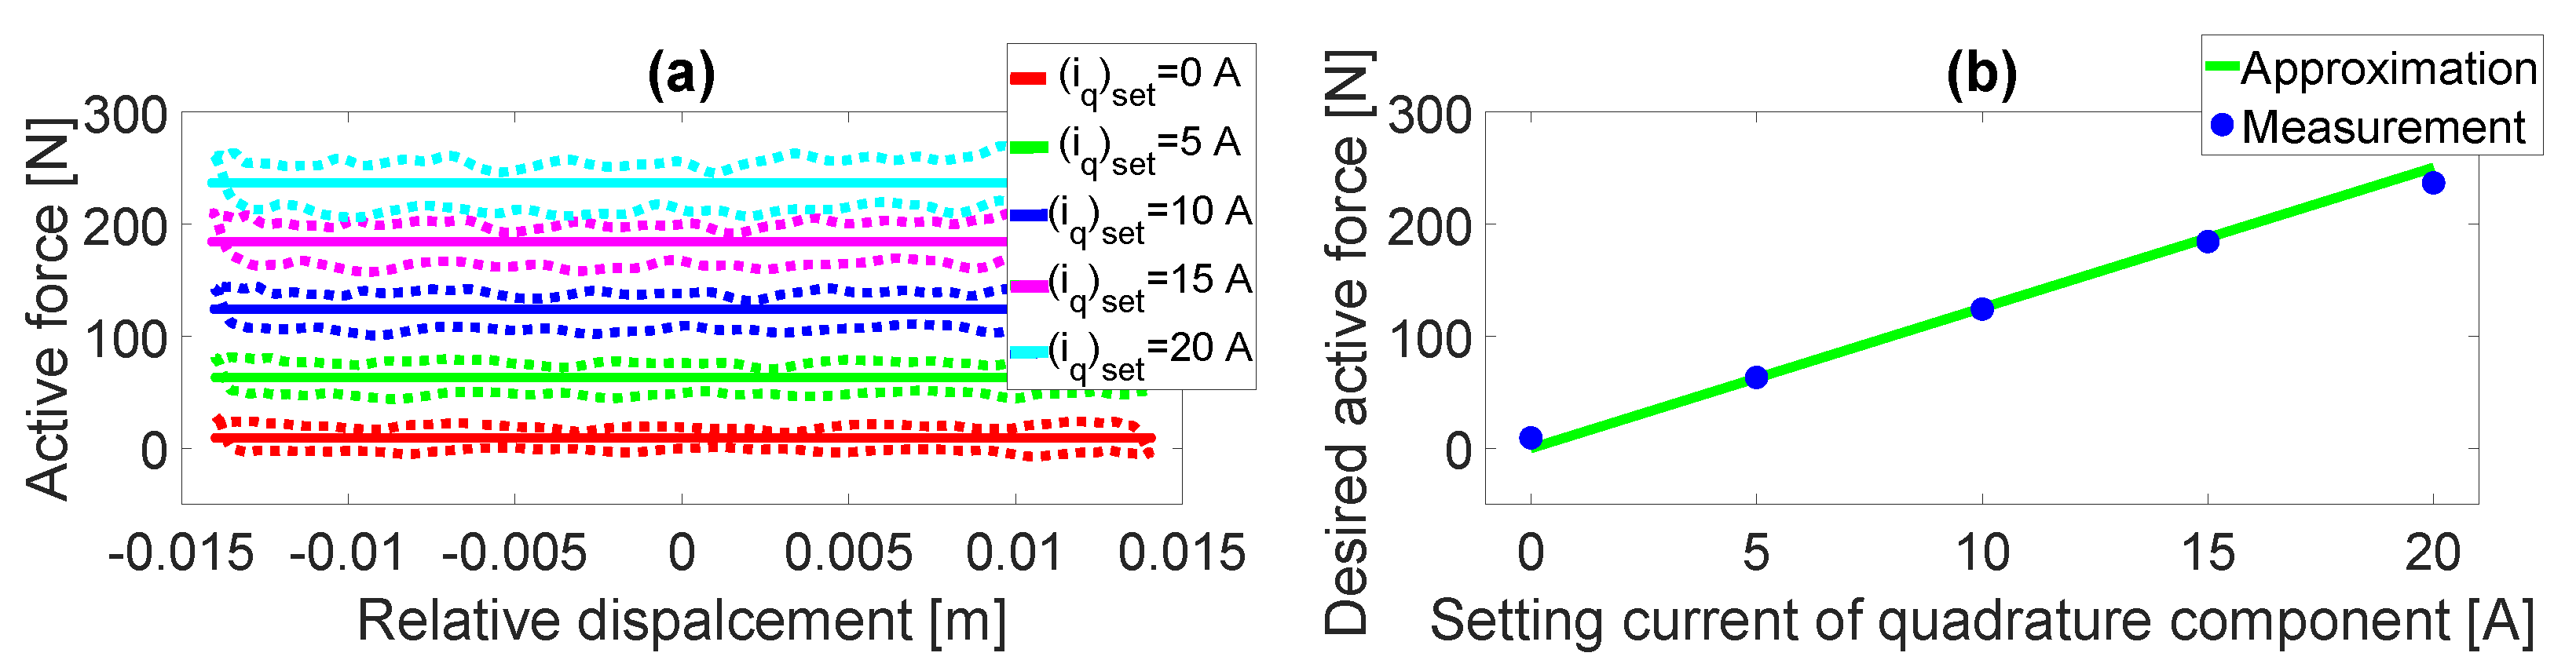
Figure 5.
Measured and approximated braking force versus relative velocity and brake signal (a) and its inverse approximation (b)
Figure 5.
Measured and approximated braking force versus relative velocity and brake signal (a) and its inverse approximation (b)
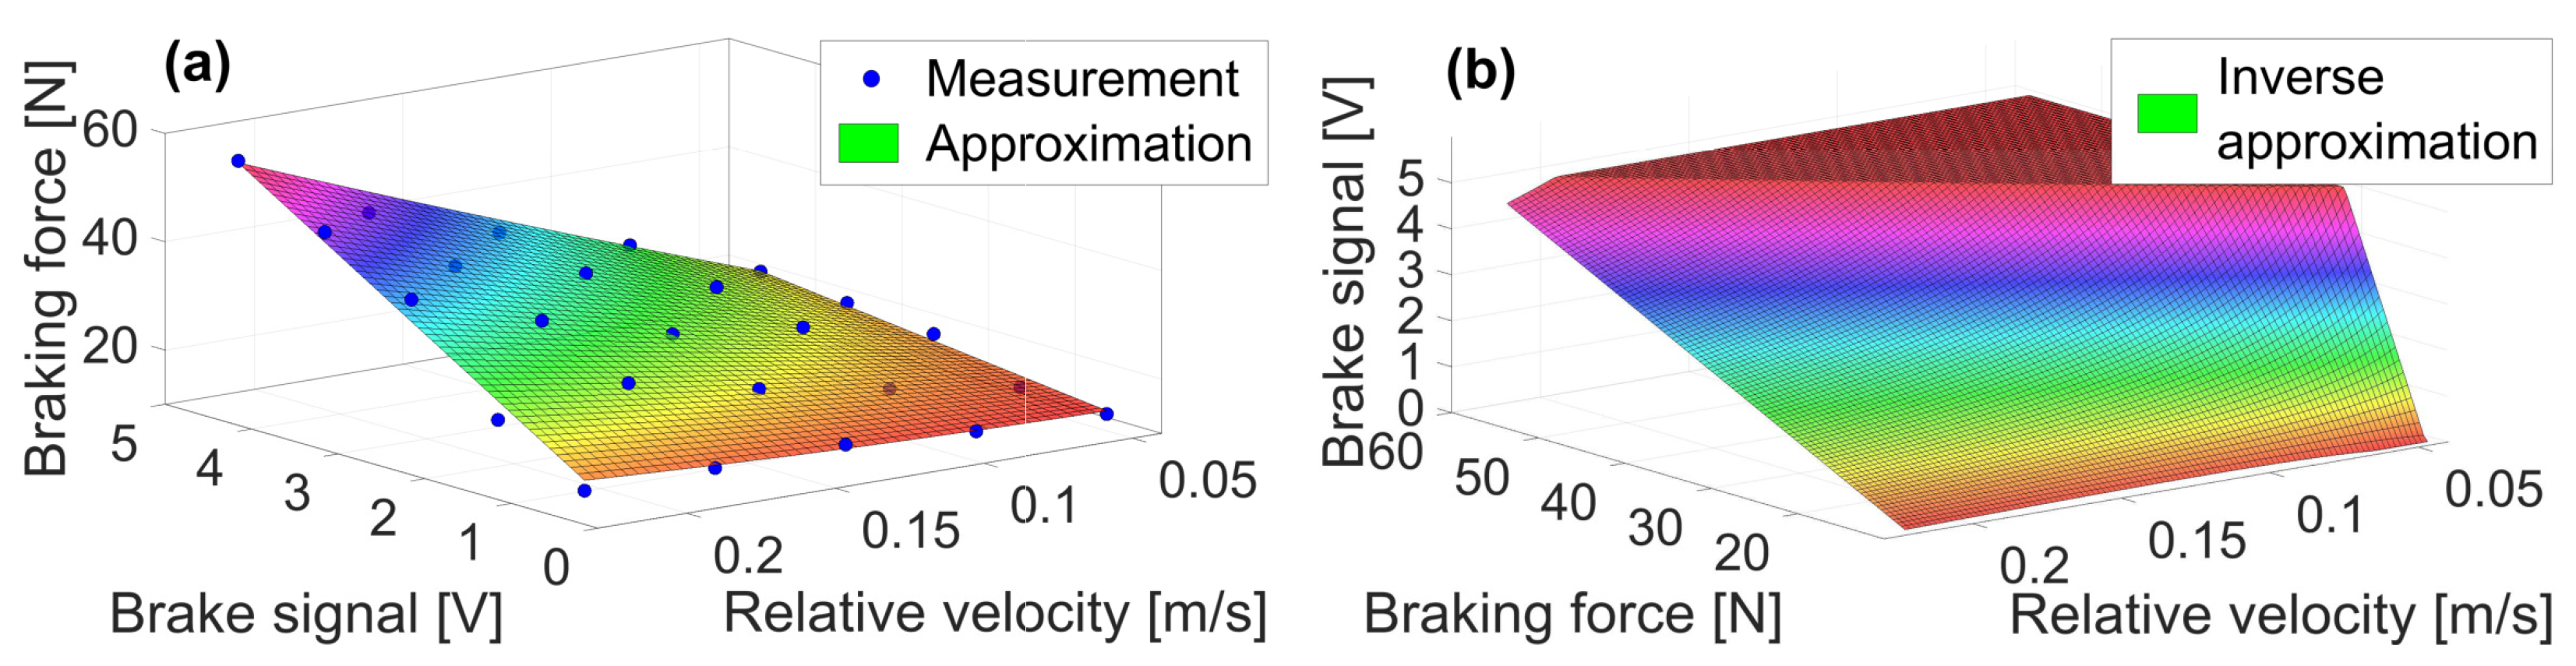
Figure 6.
Measured setting current of the quadrature component in motoring mode, voltage signal during regenerative braking mode and corresponding phase currents of the BLDC motor at different excitation intensity: WN1 (a-b), WN2 (c-d) and WN3 (e-f)
Figure 6.
Measured setting current of the quadrature component in motoring mode, voltage signal during regenerative braking mode and corresponding phase currents of the BLDC motor at different excitation intensity: WN1 (a-b), WN2 (c-d) and WN3 (e-f)
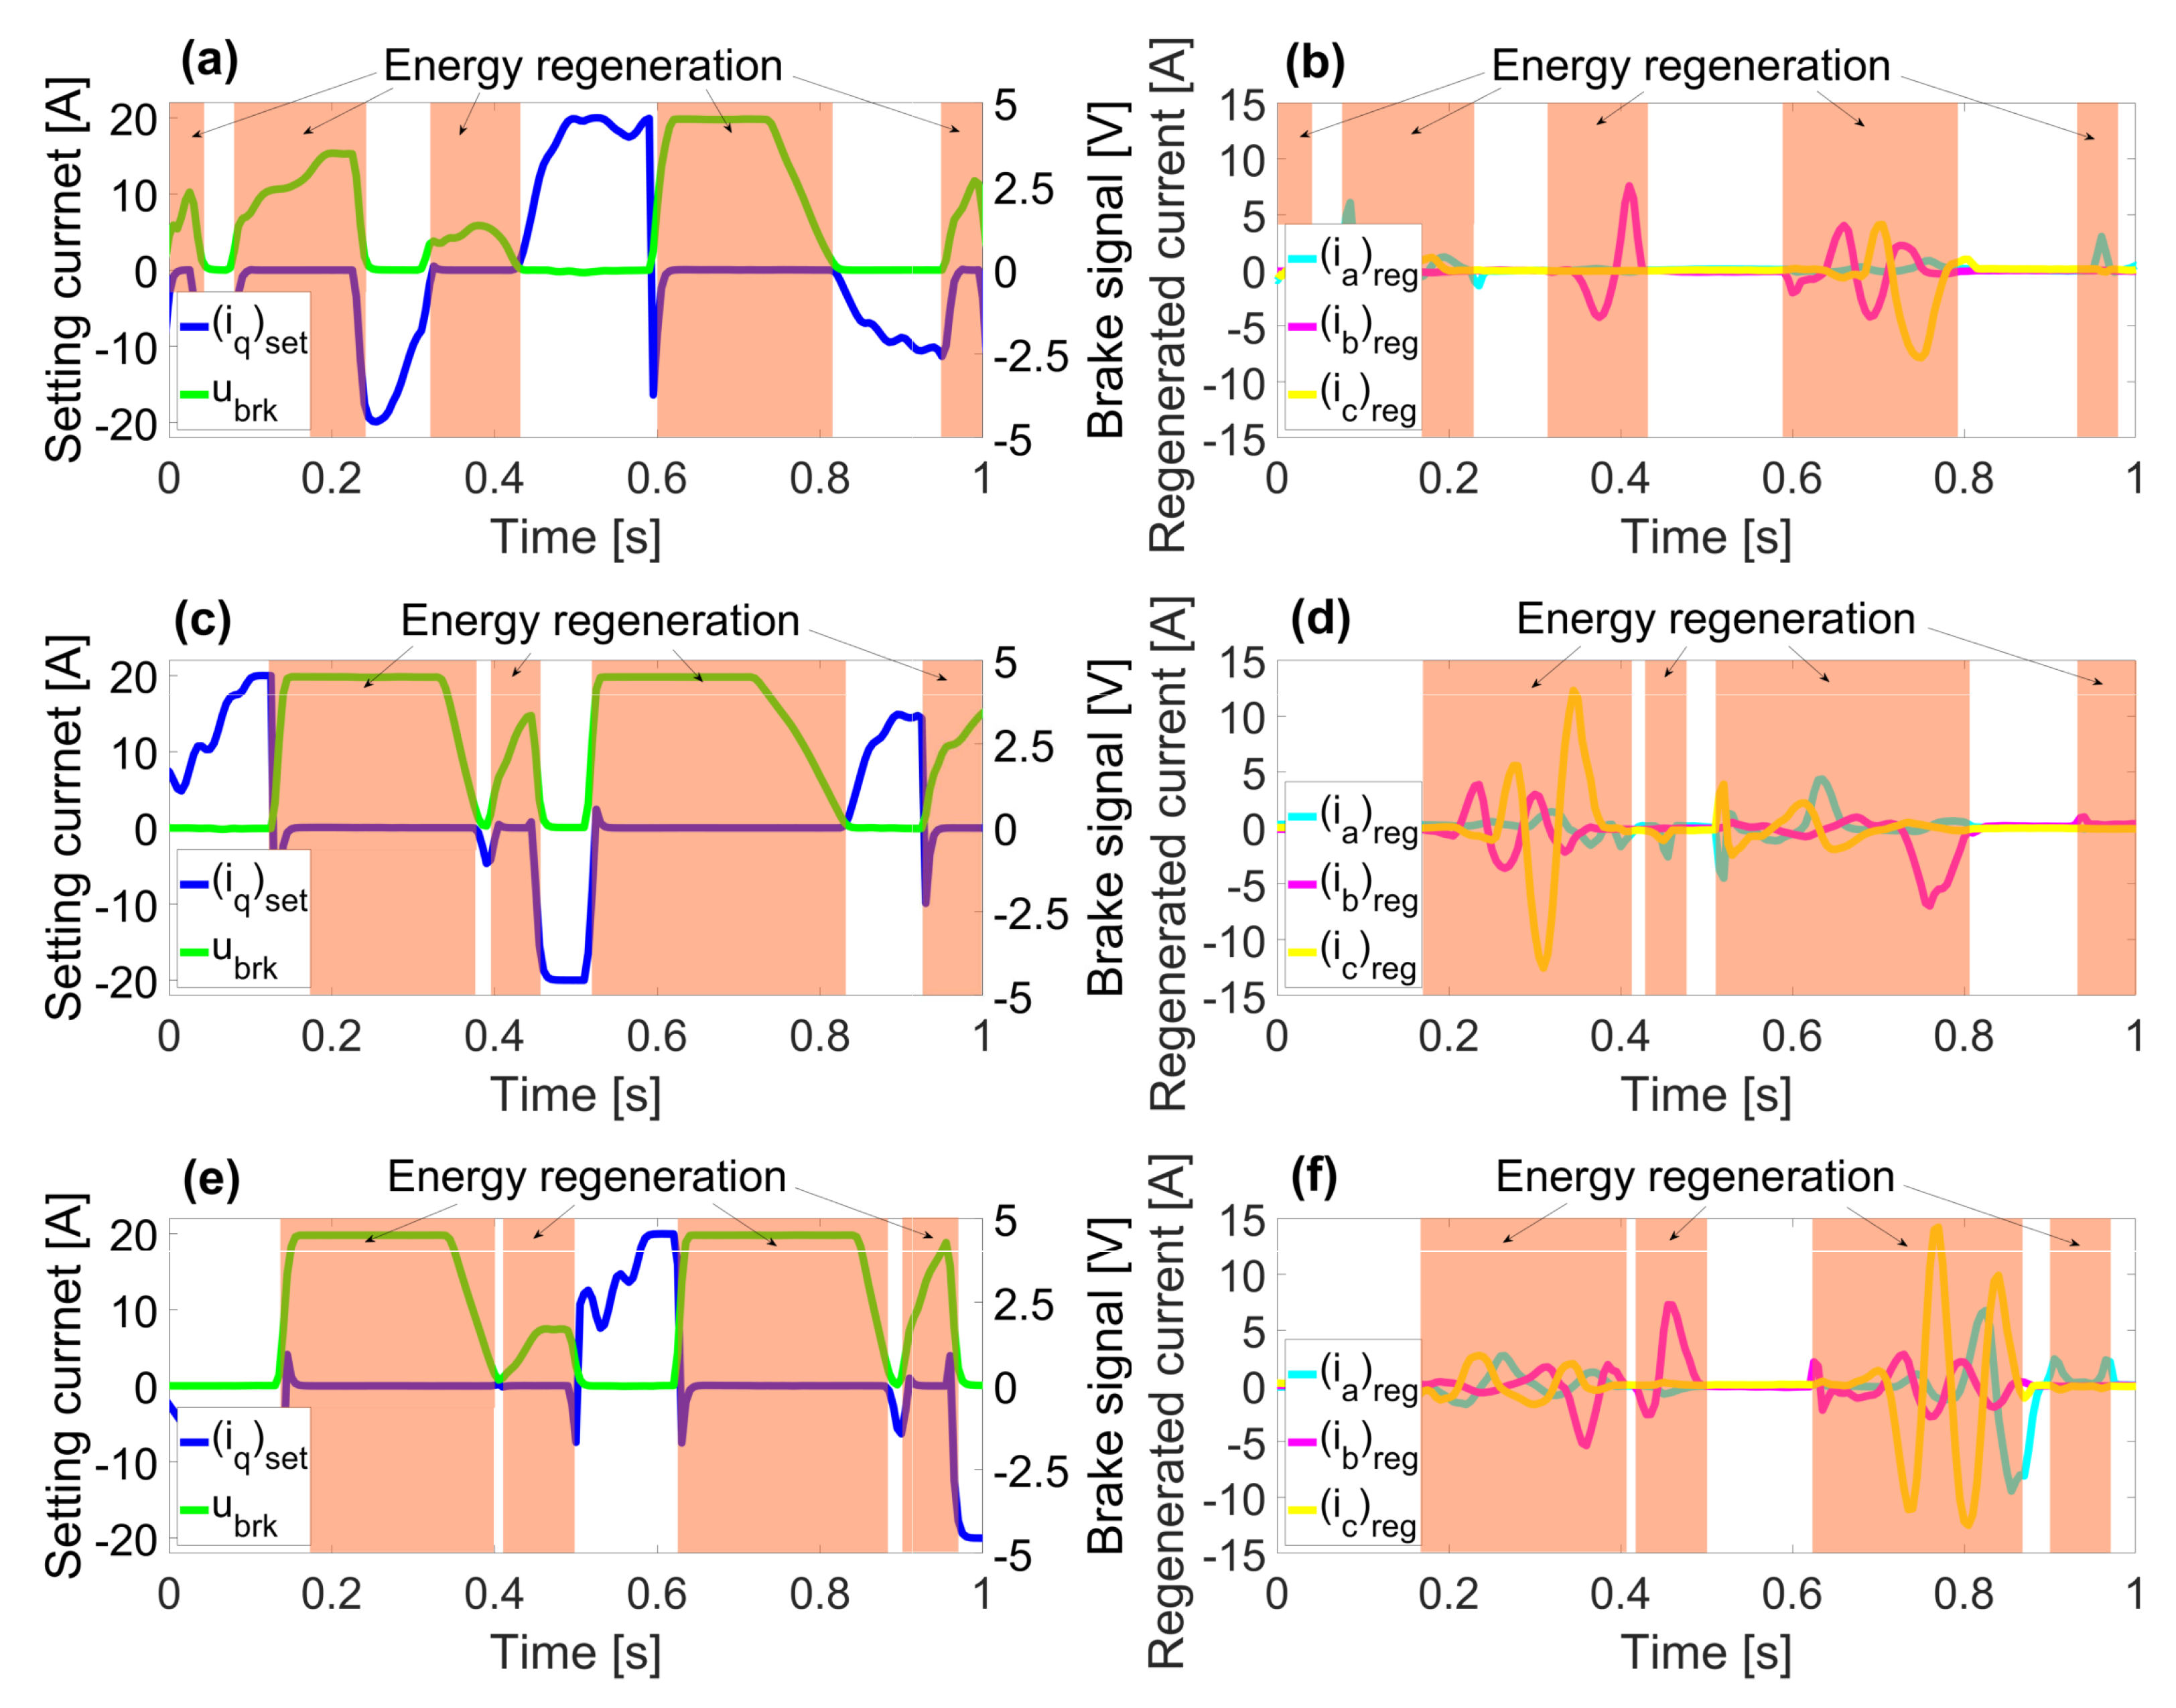
Figure 7.
Transmissibility functions of the passive (a), active (c) and regenerative (e) seat suspension system at different excitation intensity: WN1-WN3 and the same mass load 60 kg (figures on the left hand side), transmissibility functions of the passive (b), active (d) and regenerative (f) seat suspension system at various mass load: 40-80 kg and the same excitation intensity WN2 (figures on the right hand side)
Figure 7.
Transmissibility functions of the passive (a), active (c) and regenerative (e) seat suspension system at different excitation intensity: WN1-WN3 and the same mass load 60 kg (figures on the left hand side), transmissibility functions of the passive (b), active (d) and regenerative (f) seat suspension system at various mass load: 40-80 kg and the same excitation intensity WN2 (figures on the right hand side)
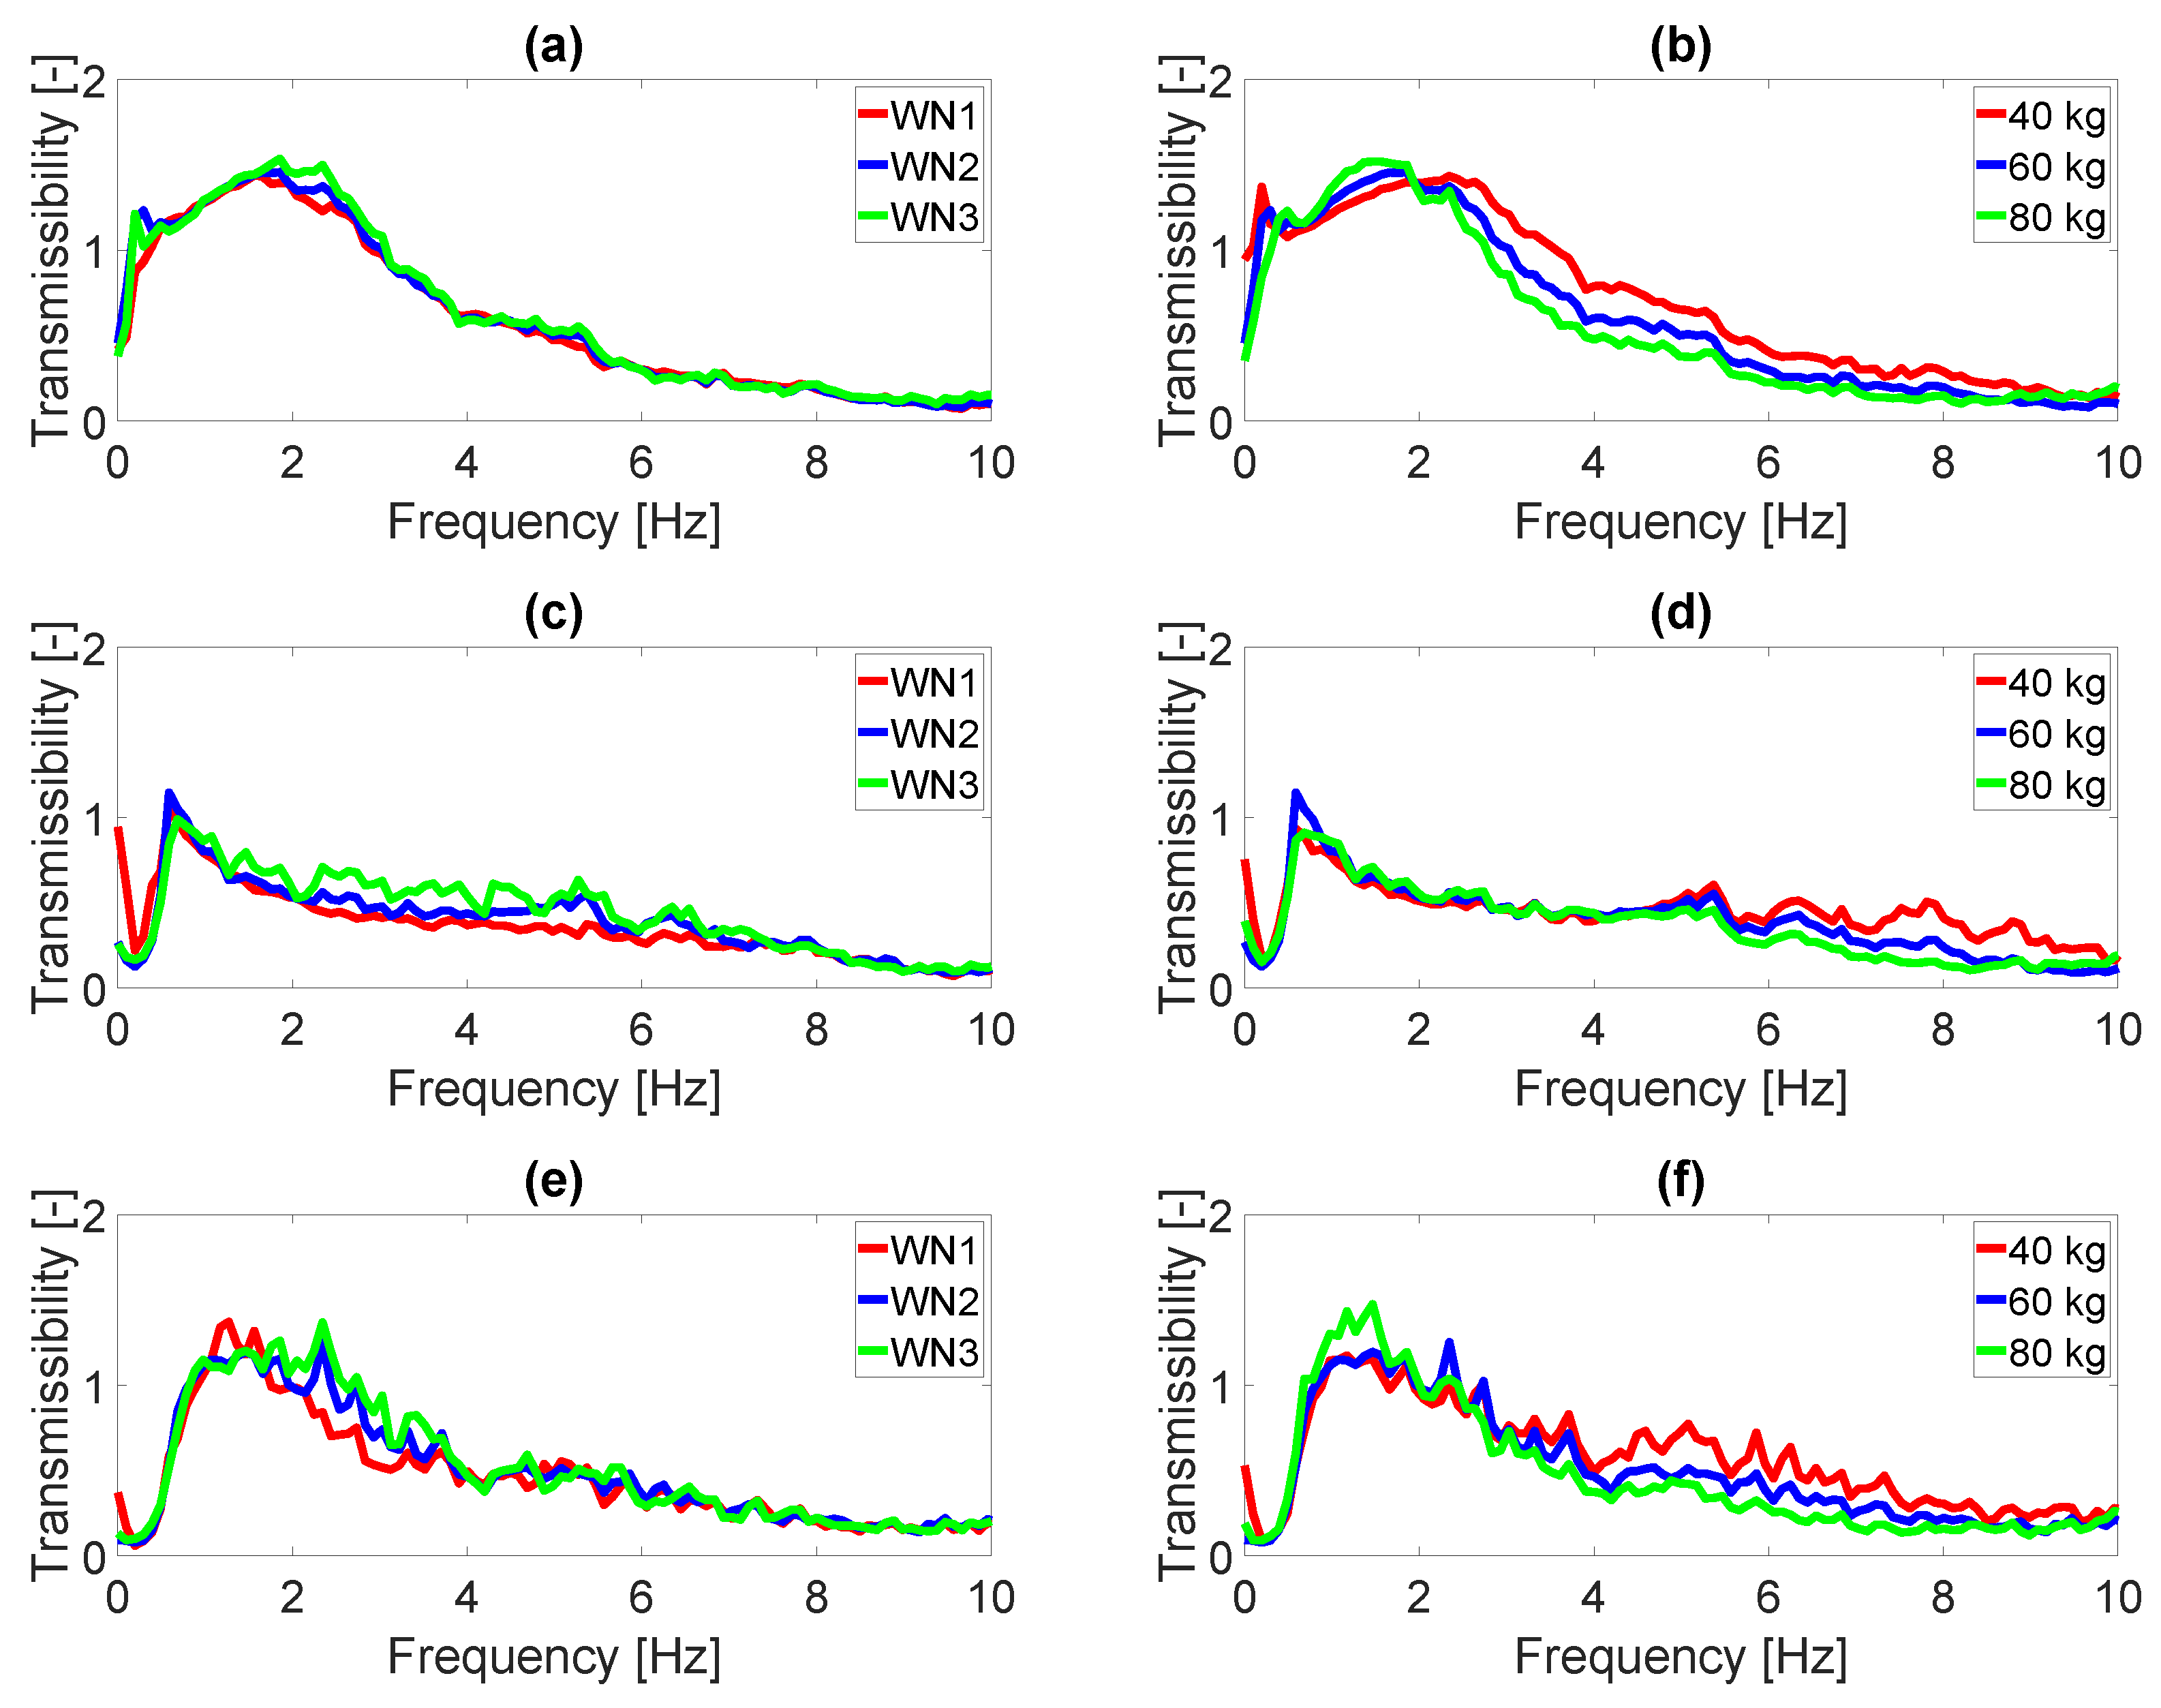
Figure 8.
RMS current (a) and RMS power (b) regenerated by the energy recovery braking subsystem at different excitation intensity: WN1-WN3 and at various mass load: 40-80 kg
Figure 8.
RMS current (a) and RMS power (b) regenerated by the energy recovery braking subsystem at different excitation intensity: WN1-WN3 and at various mass load: 40-80 kg
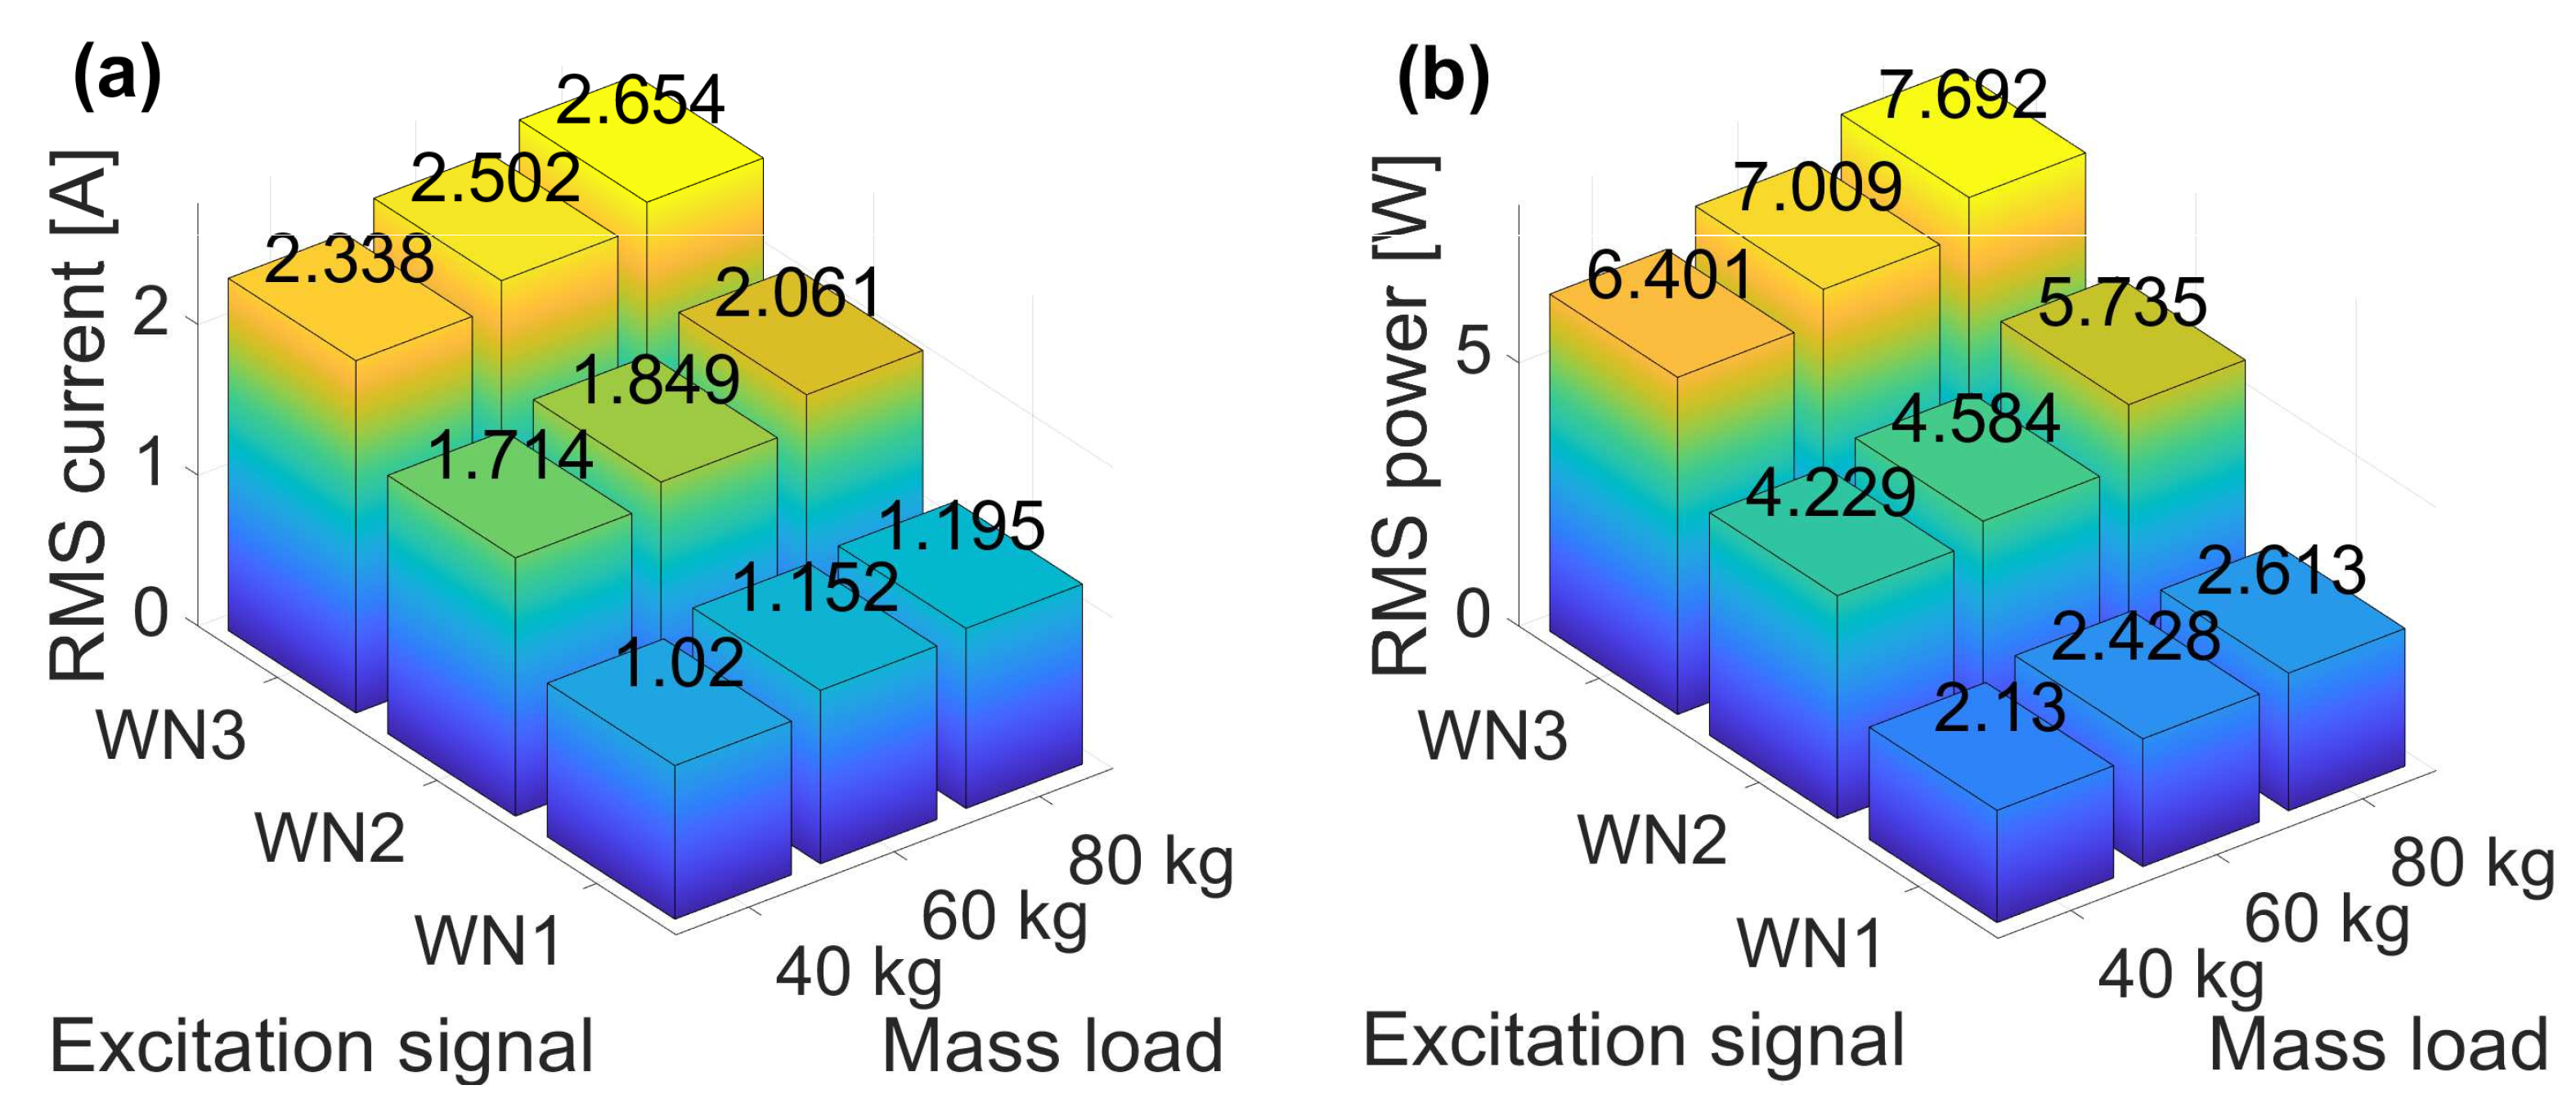

Table 1.
Numerical values of the SEAT factor and suspension travel for the passive, active and regenerative seat suspension at different excitation intensity and various mass load
Table 1.
Numerical values of the SEAT factor and suspension travel for the passive, active and regenerative seat suspension at different excitation intensity and various mass load
| Mass load | ||||||
|---|---|---|---|---|---|---|
| Passive | Active | Regenerative | ||||
| Excitation | SEAT | Suspension | SEAT | Suspension | SEAT | Suspension |
| signal | factor | travel | factor | travel | factor | travel |
| Mass load 40 kg | ||||||
| WN1 | 1.172 | 22.5 mm | 0.501 | 35.8 mm | 0.886 | 36.3 mm |
| WN2 | 1.178 | 29.5 mm | 0.536 | 39.1 mm | 0.885 | 33.2 mm |
| WN3 | 1.186 | 34.3 mm | 0.609 | 39.1 mm | 0.936 | 40.1 mm |
| Mass load 60 kg | ||||||
| WN1 | 1.123 | 26.3 mm | 0.507 | 35.9 mm | 0.845 | 36.9 mm |
| WN2 | 1.145 | 34.3 mm | 0.551 | 40.5 mm | 0.894 | 38.5 mm |
| WN3 | 1.186 | 38.4 mm | 0.637 | 40.2 mm | 0.953 | 41.0 mm |
| Mass load 80 kg | ||||||
| WN1 | 1.095 | 30.0 mm | 0.501 | 37.6 mm | 0.832 | 35.5 mm |
| WN2 | 1.132 | 37.1 mm | 0.563 | 40.8 mm | 0.927 | 39.3 mm |
| WN3 | 1.179 | 40.5 mm | 0.669 | 40.7 mm | 0.975 | 41.5 mm |
Disclaimer/Publisher’s Note: The statements, opinions and data contained in all publications are solely those of the individual author(s) and contributor(s) and not of MDPI and/or the editor(s). MDPI and/or the editor(s) disclaim responsibility for any injury to people or property resulting from any ideas, methods, instructions or products referred to in the content. |
© 2026 by the authors. Licensee MDPI, Basel, Switzerland. This article is an open access article distributed under the terms and conditions of the Creative Commons Attribution (CC BY) license (http://creativecommons.org/licenses/by/4.0/).
Copyright: This open access article is published under a Creative Commons CC BY 4.0 license, which permit the free download, distribution, and reuse, provided that the author and preprint are cited in any reuse.