

Submitted:
26 June 2026
Posted:
29 June 2026
You are already at the latest version
Abstract
Polarimetric synthetic aperture radar (PolSAR) semantic segmentation remains challenging due to large intra‑class scattering variability, high inter‑class scattering similarity, and boundary ambiguity caused by speckle. Real‑valued networks discard polarimetric phase information, while existing complex‑valued methods often directly extend real‑valued architectures without coordinated design. To address these issues, this paper proposes Complex‑Valued HRU‑Net, a lightweight encoder‑decoder network. A three‑stage complex‑valued HRNet encoder preserves fine spatial details through parallel multi‑resolution streams, and a complex‑valued U‑Net decoder progressively restores high‑resolution semantic feature maps. At the second skip connection, a Complex‑Valued Cross‑Gated Attention Enhancement (CV‑CGAE) module suppresses speckle‑contaminated responses and selectively transfers boundary‑ and texture‑related cues via sequential enhancement, cross‑attention interaction, and gated recalibration. Experiments on three airborne and spaceborne PolSAR datasets—AIRSAR San Francisco, AIRSAR Flevoland, and RADARSAT‑2 San Francisco—show that the proposed method achieves mean intersection‑over‑union (mIoU) values of 97.21%, 98.25%, and 96.38%, respectively. In the 15‑class Flevoland scene, all per‑class IoU values exceed 94%. Parameter‑fair comparisons and phase randomization experiments confirm that the performance gains stem from explicit use of phase information, not merely increased model capacity. The network provides improved boundary delineation and post‑hoc physical interpretability for complex‑valued PolSAR segmentation.
Keywords:
polarimetric synthetic aperture radar (PolSAR)
; semantic segmentation
; complex-valued neural networks
; attention mechanism
; HRNet
; physical interpretability
1. Introduction
Polarimetric synthetic aperture radar (PolSAR) measures the complex scattering responses of ground targets by transmitting and receiving electromagnetic waves with multiple polarization combinations. By retaining both amplitude and phase information in the polarimetric scattering matrix, PolSAR provides physically meaningful descriptors for land-cover analysis and has been widely used in land resource management, agricultural monitoring, and disaster assessment [1,2]. Based on electromagnetic scattering theory and polarimetric radar principles [3], pixel-level terrain classification remains a fundamental task in radar remote sensing. However, accurate PolSAR semantic segmentation is still challenged by three major factors: 1) large intra-class variability in scattering responses caused by variations in target orientation, dielectric properties, moisture conditions, and surface roughness [4]; 2) high inter-class similarity among polarimetric scattering mechanisms, which reduces class separability [5]; and 3) ambiguous scattering behavior along object boundaries induced by speckle, mixed pixels, and heterogeneous scattering near land-cover interfaces [6].
Traditional PolSAR classification methods based on statistical modeling [7,8,9], superpixel-based representation [10], and semi-supervised spatial learning [11] offer valuable physical interpretability. Nevertheless, their performance is often limited by the representational capacity of predefined features and by the separate optimization of feature extraction and classifier training. These limitations make it difficult for conventional methods to jointly learn discriminative polarimetric, spatial, and semantic representations in complex terrain scenes.
Deep learning has been increasingly adopted for dense prediction in remote sensing. In the real-valued domain, representative architectures have evolved from fully convolutional networks (FCNs) [12] for pixel-wise prediction, to U-Net [13] for multi-level feature fusion through encoder-decoder skip connections, and HRNet [14] for maintaining high-resolution representations through parallel multi-resolution branches. Despite their effectiveness, standard U-Net structures may have limited ability to represent highly variable multi-scale scattering responses, and direct skip connections can introduce speckle-contaminated shallow features into the decoder. HRNet preserves structural details through high-resolution streams, but its standard four-stage design introduces a relatively large number of parameters, which may increase overfitting risks on small-sample PolSAR datasets. To mitigate radar speckle and background clutter, spatial and channel attention mechanisms, such as the Convolutional Block Attention Module (CBAM) [15], have been introduced to recalibrate feature responses. However, attention mechanisms originally designed for optical imagery do not explicitly account for the multiplicative nature of radar speckle or the phase-dependent characteristics of polarimetric observations.
Transformer-based models have also been applied to enhance long-range contextual modeling. The original Transformer [16] has inspired several vision-oriented variants, including Swin Transformer [17], SegFormer [18], Vision Transformer [19], sequence-to-sequence Transformer segmentation [20], Segmenter [21], and TransUNet [22]. In PolSAR-related segmentation studies, hybrid convolutional neural networks (CNNs)–Transformer architectures have also been explored [23,24]. Although these methods improve global context aggregation, most remain real-valued and rely on amplitude or derived feature representations. Their computational complexity can also limit generalization in label-scarce PolSAR scenarios. Efficient topologies using context-guided feature reconstruction [25] or multi-scale window attention [26] reduce some computational costs, but they still do not explicitly model complex-valued phase information.
Complex-valued convolutional neural networks (CV-CNNs) [27] provide a natural framework for processing PolSAR data because they can preserve the algebraic structure of complex-valued polarimetric observations. Several complex-valued networks have been developed for PolSAR interpretation [28,29,30,31,32,33,34,35,36,37]. However, many existing methods are obtained by directly extending real-valued network components to the complex domain, with insufficient consideration of the coordinated architectural design among complex-valued representation learning, multi-scale spatial encoding, and encoder-decoder feature interaction. Moreover, the relationship between latent complex-valued features learned by deep networks and classical polarimetric physical descriptors, such as Cloude–Pottier entropy and scattering angle [38], remains insufficiently investigated. Although concept-based models have recently been introduced to improve PolSAR interpretability [39], post-hoc physical interpretation of learned complex-valued features remains underexplored.
To address these limitations, this paper proposes Complex-Valued HRU-Net, a unified architecture for PolSAR semantic segmentation. The proposed method goes beyond directly extending real-valued backbones to the complex domain by integrating phase-aware representation learning, multi-scale high-resolution encoding, and cross-attention-based feature interaction within a single framework. Specifically, the encoder adopts a lightweight three-stage complex-valued HRNet to preserve structural details through parallel multi-resolution subnetworks while reducing overfitting risks under limited-sample conditions. The decoder employs a complex-valued U-Net structure to progressively restore spatial resolution and semantic details. In addition, a Complex-Valued Cross-Gated Attention Enhancement (CV-CGAE) module is introduced at the second skip connection to bridge the encoder-decoder semantic gap. Through a sequential enhancement–interaction–recalibration mechanism, this module selectively propagates low-level spatial and textural information to support high-level semantic reconstruction while suppressing speckle-induced responses. Experiments on three benchmark PolSAR datasets, including AIRSAR San Francisco [40], AIRSAR Flevoland [41], and RADARSAT-2 San Francisco [42], show that the proposed method achieves mIoU values of 97.21%, 98.25%, and 96.38%, respectively, together with improved boundary preservation. Furthermore, phase randomization experiments and theoretical analysis of complex-valued convolution indicate that the proposed network exploits phase-related polarimetric information, providing physical interpretability for complex-valued PolSAR segmentation.
The main contributions of this study are summarized as follows:
(1) A unified Complex-Valued HRU-Net architecture is proposed for PolSAR semantic segmentation. By coupling parallel multi-resolution encoding with progressive decoder-based reconstruction, the network learns phase-aware, spatially detailed, and semantically discriminative complex-valued representations.
(2) A Complex-Valued Cross-Gated Attention Enhancement (CV-CGAE) module is developed for phase-aware feature transfer across the encoder-decoder semantic gap. The module improves multi-level feature interaction, suppresses speckle-contaminated responses, and enhances boundary-sensitive polarimetric representations.
(3) Phase randomization experiments and theoretical analysis are conducted to examine the role of complex phase information in class discrimination. The results indicate that preserving amplitude-phase interactions helps distinguish terrain categories with similar backscattering intensities but different dominant scattering mechanisms, thereby improving the physical interpretability of complex-valued deep networks.
2. Related Work
2.1. Overview
Semantic interpretation of polarimetric synthetic aperture radar (PolSAR) imagery has progressed from statistical and shallow machine-learning techniques [7,8,9,10,11] toward deep representation learning [12,13,14]. Although real-valued convolutional neural networks (CNNs) provide strong baselines for PolSAR classification and segmentation [43,44,45], they typically operate on amplitude-, covariance-, or other real-valued representations, thereby discarding or insufficiently exploiting the complex phase information inherent in multi-channel radar observations. Complex-valued CNNs (CV-CNNs) [27] address this limitation by performing neural operations directly in the complex domain [28,29,30,31,32,33,34,35,36,37]. Nevertheless, existing complex-valued frameworks rarely incorporate architectural co-design tailored to the physical characteristics of PolSAR data. This section reviews related studies from three perspectives: encoder-decoder topologies, attention mechanisms, and complex-valued neural networks.
2.2. Encoder-Decoder Architectures in PolSAR
Fully convolutional networks (FCNs) [12] introduced end-to-end pixel-wise dense prediction in remote sensing. U-Net [13] later adopted a symmetric encoder-decoder structure, in which progressive downsampling extracts multi-scale contextual features and skip connections transfer shallow spatial details to the decoder. Despite its wide use in PolSAR terrain mapping [43], the standard U-Net has two limitations in this task. First, it has limited ability to represent highly variable multi-scale scattering responses across complex land-cover types. Second, direct skip connections may propagate speckle-contaminated shallow features into the decoder, degrading boundary delineation and semantic discrimination.
HRNet [14] maintains high-resolution feature representations throughout the network through parallel multi-resolution streams with repeated cross-resolution information exchange. This design is effective for preserving structural details and object boundaries. However, the standard HRNet introduces relatively high computational and parameter costs, which may increase overfitting risks on small-sample or partially labeled PolSAR datasets. Moreover, its original real-valued formulation does not explicitly preserve the complex-valued structure of polarimetric scattering matrices.
To balance receptive-field enlargement and spatial-detail recovery, a variety of specialized networks have been explored. In the convolutional domain, MP-ResNet [44] employs parallel multi-scale branches, PSRN [45] reconstructs polarimetric descriptors through dual self-attention paths, and DSNet [46], a real-valued network designed for optical imagery, optimizes atrous convolutional layouts. MASA-SegNet [47] and DENet [48] further investigate asymmetric and densely connected encoder-decoder pathways, respectively. For multi-source interpretation, SDCAFNet [49] performs cross-modal feature fusion between PolSAR and optical data, while data-augmentation-based regularization strategies [50] have been used to stabilize representation learning.
More recently, Transformer-based architectures have been introduced to capture long-range contextual dependencies in PolSAR segmentation, including Swin Transformer variants [17], SegFormer [18], standard vision transformers (ViTs) [19], sequence-to-sequence formulations [20], and dense Segmenter baselines [21]. General and PolSAR-related hybrid CNN-Transformer frameworks [23,51] and TransUNet-style topologies [22] further combine local convolutional inductive biases with global context modeling. Although these methods improve long-range context aggregation, most remain real-valued and rely on amplitude or derived feature representations. Their computational complexity can also limit generalization in label-scarce PolSAR scenarios. Efficient topologies originally proposed for optical image segmentation, such as context-guided feature reconstruction [25] or multi-scale window attention [26], reduce some computational costs, but they still do not explicitly model complex-valued phase information.
2.3. Attention Mechanisms in Semantic Segmentation
The Convolutional Block Attention Module (CBAM) [15] is a representative channel-spatial attention mechanism that recalibrates feature responses with low computational overhead. Subsequent attention designs have extended single-level feature enhancement toward cross-level feature interaction, especially in encoder-decoder networks where skip-connection attention is used to reduce the semantic gap between shallow encoder layers and deep decoder representations.
In PolSAR segmentation, cross-level attention faces challenges associated with radar imaging and polarimetric scattering. Shallow encoder features retain fine spatial and textural information, but they are sensitive to speckle and localized backscattering fluctuations. In contrast, deep decoder features provide stronger semantic abstraction but may lose fine spatial details. Attention mechanisms originally designed for optical imagery do not explicitly account for the multiplicative nature of radar speckle or the phase-dependent characteristics of polarimetric observations. Although dual-attention variants have been explored for PolSAR classification [52], they typically operate on real-valued amplitude features. In contrast, the proposed Complex-Valued Cross-Gated Attention Enhancement (CV-CGAE) module performs feature enhancement, cross-gated interaction, and recalibration in the complex domain, enabling phase-aware feature transfer across the encoder-decoder boundary.
2.4. Complex-Valued Neural Networks in PolSAR
CV-CNNs [27] provide a suitable framework for PolSAR analysis because they can process complex-valued observations while preserving amplitude-phase relationships and inter-channel coherence information. Several complex-valued architectures have been developed for radar classification and segmentation. Yu et al. introduced a lightweight complex-valued DeepLabv3+ (L-CV-DeepLabv3+) [28] and a complex-valued U-Net with capsule blocks [29], while Xu et al. designed an attention-refined complex-valued BiSeNetV2 [32]. To address label scarcity, Zeng et al. proposed SemiPSCN [30], which incorporates polarimetric semantic constraints into a semi-supervised pipeline, and Jiang et al. [31] developed a lightweight complex-valued Siamese network for few-shot scenarios. Beyond conventional convolutional kernels, Kuang et al. [33] proposed CV-CPKAN, a complex-valued convolutional Kolmogorov-Arnold network for PolSAR interpretation. Additional extensions include three-dimensional complex-valued operations and multi-scale complex-valued feature extraction [37], as well as complex-valued frameworks optimized with the Lovász-Softmax loss [34]. To improve model interpretability, Ma et al. [35] and Alkhatib [36] investigated hybrid fusion of real- and complex-valued features by decoupling the modeling of diagonal power intensities and off-diagonal phase-related components.
Despite these advances, a notable methodological gap remains. Many complex-valued approaches are obtained by directly extending real-valued baselines to the complex domain, with limited structural co-design for intra-class scattering variability, inter-class scattering similarity, and boundary ambiguity. Moreover, the mathematical relationship between latent complex-valued representations and classical electromagnetic scattering descriptors, such as Cloude-Pottier entropy H and scattering angle α, remains insufficiently understood, limiting the physical interpretability of these models. Although Zhang et al. [39] introduced concept bottleneck layers to align features with scattering mechanisms, their method relies on explicit concept supervision during training rather than post-hoc analysis of phase utilization in learned complex-valued features. Similarly, while cross-domain fusion [53], complex-valued Kolmogorov-Arnold operations [33], and multi-scale complex-valued feature extraction [37] provide useful advances, they do not jointly integrate high-resolution complex-valued encoding, phase-aware cross-layer interaction, and physical interpretation within a unified segmentation framework.
To address these issues, the proposed Complex-Valued HRU-Net goes beyond simply complexifying existing backbones. It couples a lightweight complex-valued HRNet encoder with a complex-valued U-Net decoder through a noise-suppressing CV-CGAE module. The architecture integrates phase-aware feature representation, multi-scale detail preservation, cross-layer feature interaction, and physical interpretability based on phase utilization, thereby providing a coherent framework for complex terrain segmentation in PolSAR imagery.
3. Method
The proposed Complex-Valued HRU-Net is a lightweight encoder-decoder architecture designed for PolSAR semantic segmentation, as illustrated in Figure 1. It consists of a complex-valued HRNet encoder and a complex-valued U-Net decoder, with a complex-valued cross-gated attention enhancement (CV-CGAE) module inserted at the second skip connection. The following subsections describe the design motivation and implementation details of each component.
3.1. Design Motivation and Overall Architecture
The proposed architecture is designed to address three major challenges in PolSAR semantic segmentation, which are intra-class scattering variability, inter-class scattering similarity, and boundary ambiguity.
First, to alleviate intra-class scattering variability, the encoder adopts a parallel multi-resolution design to capture scattering characteristics at different spatial scales. This design improves robustness to variations in target orientation, surface roughness, dielectric properties, and local imaging conditions. In the proposed model, this multi-resolution encoding strategy is implemented using a lightweight complex-valued HRNet backbone, as detailed in Section 3.2.
Second, to improve discrimination between classes with similar backscattering intensities, the network is formulated in the complex-valued domain. This allows the model to explicitly exploit polarimetric phase information and amplitude-phase relationships, which are essential for distinguishing terrain categories with similar intensity responses but different dominant scattering mechanisms. The corresponding algebraic operations are described in Section 3.3, while Section 3.4 further analyzes how complex convolution models amplitude–phase interactions to produce discriminative features.
Third, to reduce boundary ambiguity, the proposed model combines high-resolution feature preservation in the encoder with CV-CGAE-based skip-connection refinement, enabling boundary- and texture-related cues to be selectively transferred to the decoder. This design guides semantic reconstruction while suppressing speckle-contaminated responses, as detailed in Section 3.5, and the decoder architecture is described in Section 3.6.
3.2. Complex-Valued Encoder
Although the standard HRNet [14] maintains high-resolution feature representations, its original four-stage architecture introduces a relatively large number of parameters. Since PolSAR datasets often contain limited labeled samples, highly parameterized networks are prone to overfitting under small-sample training conditions. Therefore, the proposed encoder adopts a lightweight three-stage complex-valued HRNet rather than the standard four-stage design.
As shown in the encoder part of Figure 1, the proposed encoder consists of three stages. In the first stage, the input is processed by two complex-valued convolutions with a stride of 1, producing feature maps. A lower-resolution branch is then generated using a complex-valued convolution with a stride of 2. In the second stage, each branch applies two complex-valued convolutions with a stride of 1, followed by multi-scale fusion through upsampling and downsampling, yielding feature maps of sizes and . The third stage introduces two additional lower-resolution streams, expanding the encoder into four parallel branches. Each branch performs three complex-valued convolutions with a stride of 1 and participates in repeated multi-scale fusion. The encoder finally outputs four feature maps with dimensions of , , , and , respectively.
The proposed encoder differs from conventional real-valued architectures in three aspects. First, each complex-valued convolution is followed by complex-valued batch normalization and complex-valued ReLU activation. Second, compared with the standard four-stage HRNet, the proposed encoder removes one stage and reduces the number of layer-wise convolutions, resulting in a more compact architecture. This design is suitable for the considered PolSAR datasets, where the number of available augmented training samples ranges from 1,400 to 7,000. Third, standard pooling-based downsampling is replaced with stride-2 complex-valued convolutions, which provide learnable resolution reduction while maintaining compatibility with complex-valued feature representations.
3.3. Complex-Valued Operations
To ensure reproducibility and analytical clarity, this subsection formalizes the basic complex-valued operators used in the proposed networks. Let the complex-valued input feature map be denoted as and let the complex-valued convolution kernel be denoted as , where and denote the real and imaginary components, respectively. The forward propagation of the complex-valued convolution is mathematically formalized as
where denotes the standard real-valued spatial convolution operation.
The complex-valued ReLU (CV-ReLU) activation applies the standard rectified linear unit to the real and imaginary channels independently, which is expressed as
Complex-valued batch normalization standardizes complex representations by considering the joint statistics of the real and imaginary components, including their variances and covariance, following the commonly used formulation in complex-valued neural networks [29]. In the proposed architecture, spatial upsampling is implemented using bilinear interpolation, whereas downsampling is performed using stride-2 complex-valued convolutions to provide learnable resolution reduction while preserving compatibility with complex-valued feature representations.
3.4. Physical Interpretability and Polarimetric Phase Mapping
This subsection analyzes how complex-valued convolutions can model phase-related polarimetric information, providing a theoretical basis for the interpretability analysis in Section 5. Under the monostatic reciprocity condition, the polarimetric scattering characteristics of a PolSAR target can be represented by the Hermitian coherency matrix , which is formulated as
The diagonal elements , , and describe the backscattering power of different polarimetric components, whereas the off-diagonal complex elements ,, and encode inter-channel correlation and relative phase information. Taking the phase angle as an example, values close to zero are often associated with surface scattering from targets such as water bodies or bare soil, while values near may indicate double-bounce scattering from dihedral-like structures in urban areas. In contrast, volume scattering from vegetation canopies generally leads to more diffuse phase distributions. These phase relationships are closely related to the identification of dominant scattering mechanisms in classical polarimetric decomposition theory.
Since is Hermitian, its six independent elements, including three real-valued diagonal elements and three complex-valued off-diagonal elements from the upper triangle, are used as the multi-channel complex-valued input tensor. For an arbitrary complex-valued convolution kernel in the initial layer, the output can be expanded as
where and denote the real and imaginary components of the th input polarimetric channel, respectively, and and denote the corresponding real and imaginary kernel components. The cross terms, such as and , couple the kernel weights with the real and imaginary components of the input. Therefore, complex-valued convolution can model amplitude-phase interactions rather than treating the two components independently. During backpropagation, gradients are propagated through these coupled terms, allowing the convolution kernels to be optimized according to phase-related polarimetric patterns.
As the network depth increases, these low-level amplitude-phase interactions can be hierarchically combined to represent higher-level nonlinear polarimetric characteristics, including features related to Cloude-Pottier entropy and mean scattering angle . In contrast, real-valued networks that use only power terms or magnitudes such as , , and do not explicitly preserve relative phase differences. This structural difference provides a theoretical motivation for the use of complex-valued networks to better distinguish terrain categories that have similar backscattering intensities but differ in their dominant scattering mechanisms.
3.5. Complex-Valued Cross-Gated Attention Enhancement
In standard U-Net architectures, skip connections directly concatenate encoder and decoder features along the channel dimension. However, in PolSAR semantic segmentation, such direct aggregation may introduce noisy shallow features into the decoder. Although shallow encoder layers retain fine-grained boundary and texture information, they are also sensitive to multiplicative speckle noise and localized scattering fluctuations. Directly transferring these features without refinement can reduce the quality of semantic reconstruction, particularly near land-cover boundaries.
To address this issue, the proposed framework introduces the Complex-Valued Cross-Gated Attention Enhancement (CV-CGAE) module at the second skip connection of the decoder. As illustrated in Figure 2, CV-CGAE uses decoder features as semantic guidance to selectively retrieve structurally relevant details from encoder features through a cross-attention mechanism. The module follows a three-stage pipeline consisting of feature enhancement, cross-interaction, and gated adaptive recalibration, as summarized in Algorithm 1.
Within the CV-CBAM enhancement stage, the real and imaginary components of the complex-valued features are decoupled and processed through two independent real-valued CBAM branches. While applying distinct attention weights to each component mitigates the rigidity of strict phase coupling, this decoupled design is strategically adopted to expand the network's capacity for adaptive noise suppression. Given that radar speckle noise often exhibits distinct statistical characteristics in the real and imaginary domains, optimizing independent spatial and channel recalibration weights allows the network to flexibly suppress uncorrelated interference within each domain. Subsequently, the enhanced components are concatenated and fed into the subsequent complex-valued cross-attention layer, where complex-valued convolutions () re-entangle the real and imaginary parts. This process effectively reconstructs a purified, phase-aware representation, ensuring coherent feature transfer prior to encoder-decoder interaction.
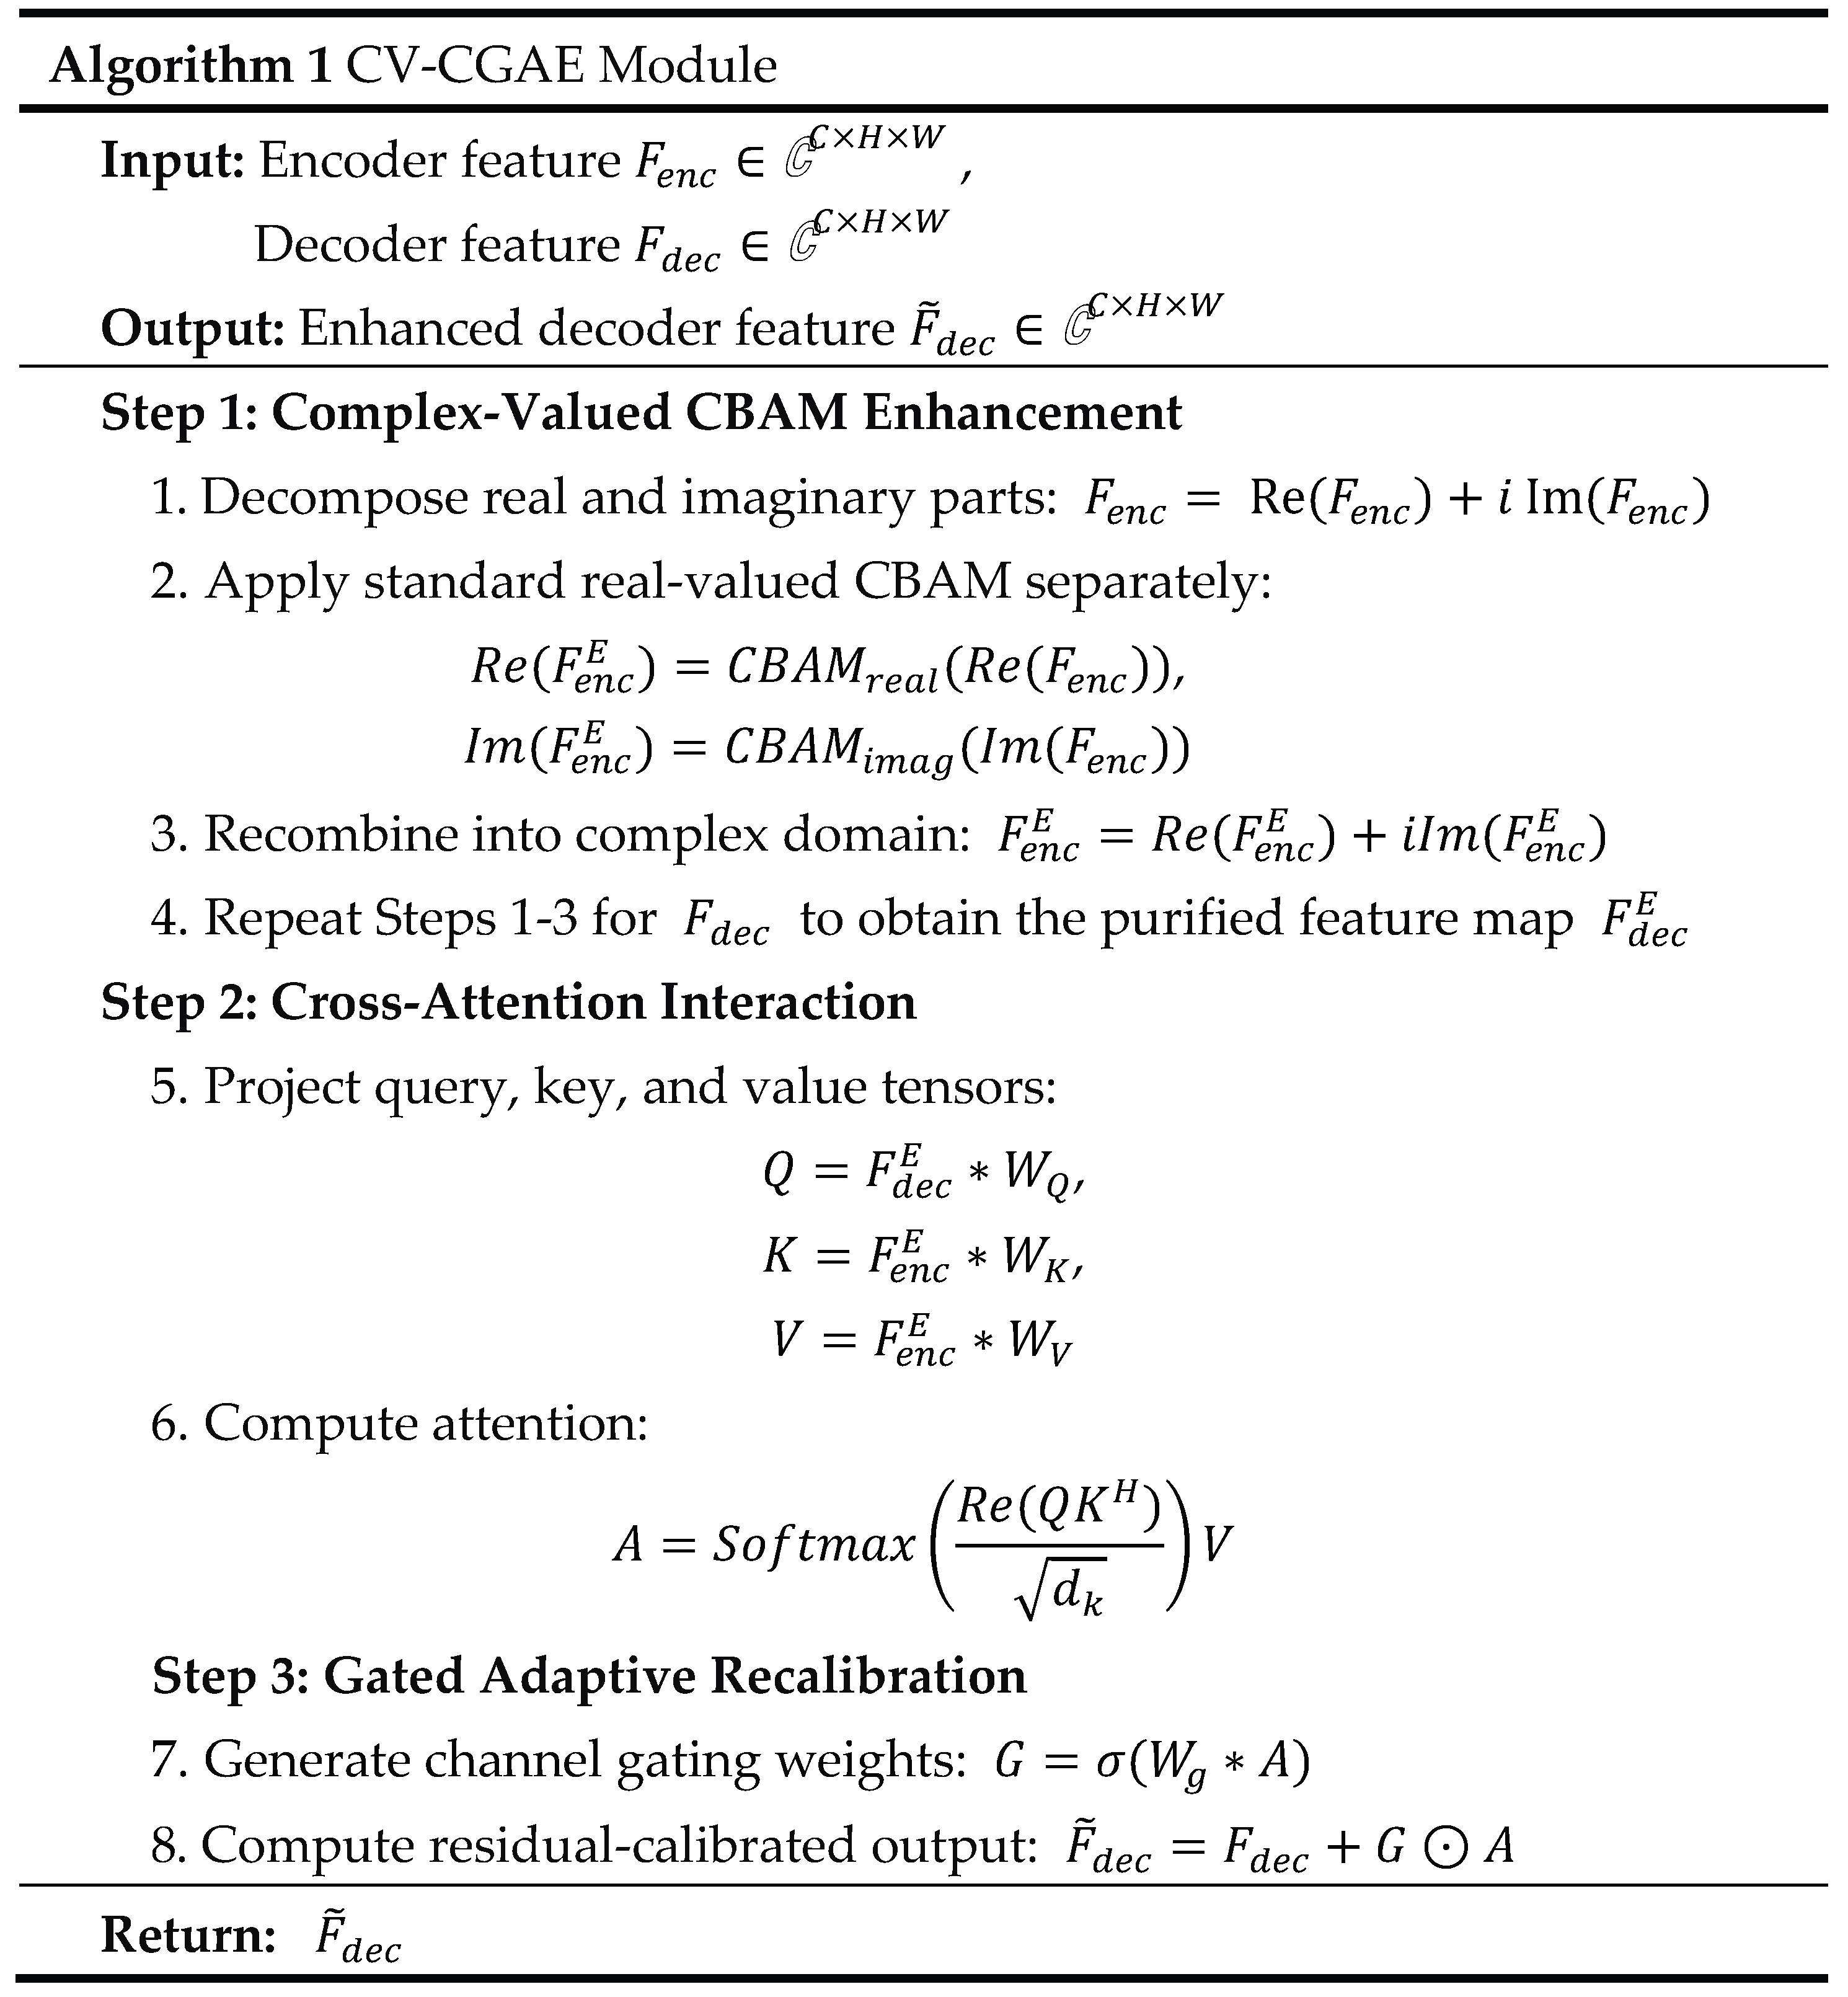
After this stage, let the enhanced encoder feature be denoted as and the enhanced decoder feature as . This preprocessing step suppresses redundant feature responses and emphasizes boundary- and texture-related information, providing refined feature representations for subsequent query-key matching.
During the cross-attention interaction stage, the decoder features generate the query vector , while the encoder features yield the key vector and value vector according to
where represent trainable complex-valued convolutional weights, and is the feature dimension per attention head. This asymmetric formulation ensures that the interaction is strictly driven by the immediate semantic requirements of the decoder. The scaled dot-product attention between and is subsequently computed, normalized via the Softmax operation, and weight-summed with to yield the attention output matrix via
where the superscript denotes the conjugate transpose operation acting as the complex-valued Hermitian inner product, and serves as the scaling factor to prevent gradient vanishing during backpropagation.
Specifically, the real part of the Hermitian inner product, , is explicitly extracted to compute the attention scores. This operation mathematically captures the phase-aligned coherent correlation between complex-valued features, ensuring that the Softmax activation is strictly applied in the real domain. Subsequently, applying the generated unified real-valued attention map to the value tensor scales the magnitude while rigorously preserving its original relative phase.
The gated adaptive recalibration stage introduces a localized gating mechanism to filter out any remaining irrelevant feature components from the attention output . The gating weights are generated via a complex-valued convolution coupled with a Sigmoid activation function, expressed as
where represents the Sigmoid activation, denotes the gating convolutional weights, and represents the channel-wise element-product operation. Finally, the recalibrated output is added back to the original decoder input through a complex residual connection to guarantee training stability. This complete sequence forms a highly noise-resistant information transfer chain where the three stages execute denoising, selective screening, and adaptive calibration in a unified series.
From a physical perspective, the effectiveness of the CV-CGAE module in PolSAR imagery is driven by two complementary mechanisms. First, the CBAM enhancement stage performs phase-aware channel selection, effectively suppressing channels dominated by random phase distributions indicative of speckle noise while amplifying channels that encode coherent scattering structures. Second, the cross-attention interaction leverages the high spatial resolution of the encoder features to enforce phase consistency calibration during semantic reconstruction. At sharp land-cover boundaries where scattering mechanisms transition abruptly, the phase response varies rapidly. The CV-CGAE module selectively propagates encoder features that maintain tight phase coherence across these boundaries, successfully recovering detailed structures that are otherwise obscured by speckle-induced phase fluctuations.
3.6. Complex-Valued Decoder and Feature Reconstruction
The decoder follows a lightweight complex-valued U-Net design for progressive feature reconstruction. It is structurally aligned with the encoder and contains three decoding stages, each incorporating a complex-valued upsampling block. The first decoding block performs upsampling followed by three complex-valued convolutions.
Different from the standard U-Net, which typically uses one skip connection at each decoding stage, the proposed decoder fuses three types of information: the upsampled feature from the previous decoder layer, the identity feature from the corresponding encoder stage, and multi-scale encoder features from other resolution levels. To ensure spatial alignment, higher-resolution shallow encoder features are downsampled using stride-2 complex-valued convolutions, whereas lower-resolution deep features are resized by bilinear interpolation. In addition, the CV-CGAE module is embedded at the second skip connection to adaptively refine boundary- and texture-related cues before multi-stream fusion. This design enables the decoder to integrate multi-level structural and semantic information while reducing the influence of speckle-contaminated responses.
The second and third decoding blocks each contain two complex-valued convolutions, with the number of output channels progressively reduced. Finally, a complex-valued convolution projects the feature channels to the number of land-cover classes. The resulting complex-valued tensor is converted into a real-valued prediction map through element-wise magnitude computation , and a Softmax layer is then applied to generate the pixel-wise semantic segmentation result.
4. Experiments and Result Analysis
This section describes the benchmark datasets, preprocessing, training setup, and evaluation metrics. We then present ablation studies and comparisons with state-of-the-art methods on three PolSAR datasets, demonstrating the architectural advantages and physical interpretability of our approach.
4.1. Datasets and Preprocessing
Three fully polarimetric SAR datasets are used in the experiments, including two L-band scenes acquired by the airborne AIRSAR sensor and one C-band scene acquired by the spaceborne RADARSAT-2 sensor. The statistical summary of the dataset partitioning is presented in Table 1, and the specific preprocessing and data augmentation workflows are detailed as follows:
1) AIRSAR San Francisco Dataset. This dataset was acquired by the NASA/JPL AIRSAR instrument over San Francisco in 1989. It contains five terrain categories: high-density urban, water, vegetation, developed urban, and low-density urban. Unlabeled pixels are treated as background and are excluded from accuracy evaluation. The Pauli RGB image and the corresponding ground-truth labels are shown in Figure S1 in the supplemental material.
2) AIRSAR Flevoland Dataset. This L-band dataset was acquired over an agricultural area in Flevoland, the Netherlands, in 1989. It contains 15 land-cover categories: stem beans, peas, forest, lucerne, wheat1, beet, potatoes, bare soil, grass, rapeseed, barley, wheat2, wheat3, water, and buildings. Unlabeled pixels are treated as background and are excluded from accuracy evaluation. The Pauli RGB image and the corresponding ground-truth labels are shown in Figure S2 in the supplemental material.
3) RADARSAT-2 San Francisco Dataset. This C-band spaceborne dataset was collected by RADARSAT-2 over San Francisco in 2008. It contains five land-cover categories: developed urban, low-density urban, high-density urban, sea, and vegetation. Unlabeled pixels are treated as background and are excluded from accuracy evaluation. The Pauli RGB image and the corresponding ground-truth labels are shown in Figure S3 in the supplemental material.
Under the monostatic reciprocity assumption, the polarimetric information of each pixel is represented by the complex-valued coherency matrix defined in Section 3.4. Since is Hermitian, its six unique upper-triangular elements are utilized as the input tensor for the proposed complex-valued network. To ensure a strictly fair comparison with real-valued baselines, these networks are provided with the same polarimetric information, structured as a nine-dimensional real-valued vector consisting of the three diagonal power terms and the real and imaginary components of the three off-diagonal complex elements. This data structuring ensures that both complex-valued and real-valued architectures operate on identical physical information content, thereby attributing any performance gains exclusively to the proposed network’s structural advantages. Given the limited availability of labeled pixels, each PolSAR image is first mirror-padded along its edges to minimize boundary artifacts and subsequently cropped into non-overlapping patches. The samples are randomly partitioned into training and test sets with a ratio of 7:3. To mitigate overfitting and improve generalization, on-the-fly spatial data augmentation—including random rotation () and multi-scale stretching (scale factor )—is applied exclusively to the training samples, while the test set remains unaugmented to maintain the fidelity of the evaluation metrics.
4.2. Experimental Setup and Evaluation Metrics
All models are implemented in PyTorch and trained on an Ubuntu server equipped with an NVIDIA Tesla P100 GPU with 16 GB memory. The Adam optimizer is used with the cross-entropy loss function. Unless otherwise specified, the batch size is set to 8, the initial learning rate is , and the number of training epochs is 800. The proposed method is compared with seven real-valued segmentation networks, including FCN, DeepLabv3+, TransUNet, SegFormer, DSNet, CGRSeg, and VWFormer, as well as two complex-valued networks, namely CV-Capsule U-Net and L-CV-DeepLabv3+. For quantitative evaluation, we report the class-wise intersection over union (IoU), mean IoU (mIoU), overall accuracy (OA), and mean pixel accuracy (MPA). In addition, boundary delineation quality is evaluated using the Boundary F1-score (BF1) with a tolerance threshold of pixels.
4.3. Ablation Experiments
Ablation experiments are conducted to evaluate the contribution of each component, including the baseline U-Net, the multi-resolution HRNet stream, the complex-valued formulation, and the CV-CGAE module. The quantitative results, parameter comparisons, and internal module ablations on the AIRSAR San Francisco dataset are summarized in Table 2, Table 3, and Table 4, respectively.
1) Core Module Ablation. As shown in Table 2, the real-valued U-Net baseline obtains an mIoU of 89.34% on the AIRSAR San Francisco scene. Incorporating the multi-resolution HRNet stream improves the mIoU to 92.84%, indicating that parallel high-resolution representations are beneficial for preserving spatial details and capturing multi-scale scattering patterns. In contrast, the standard four-stage HRNet achieves an mIoU of 71.77%, suggesting that a highly parameterized HRNet is less suitable for the limited-sample PolSAR setting considered in this study. This result supports the use of a lightweight HRNet design. Extending the lightweight architecture to the complex-valued domain further increases the mIoU to 93.59%, demonstrating the benefit of retaining polarimetric phase information. With the CV-CGAE module, the proposed model achieves the best performance, with 97.21% mIoU, 98.64% OA, and 98.57% MPA. Similar trends are observed on the Flevoland and RADARSAT-2 datasets, as reported in Table S1 and Table S2 in the supplemental material, indicating the general effectiveness of the proposed components across different PolSAR scenes.
2) Parameter-Fair Comparison Experiment. To examine whether the performance improvement is mainly caused by increased model capacity, a real-valued HRU-Net with doubled channel width is evaluated. As shown in Table 3, this expanded real-valued baseline contains approximately 5.86M parameters but achieves an mIoU of 91.35%, which is lower than that of the complex-valued HRU-Net with approximately 4.06M parameters. This comparison suggests that the improvement of the proposed model is not solely attributable to parameter scaling. Instead, the explicit use of complex-valued polarimetric information contributes to the enhanced segmentation accuracy.
3) Internal Ablation of CV-CGAE Module. Table 4 evaluates the internal components of the CV-CGAE module. Using cross-attention alone yields an mIoU of 93.59%. Adding the complex-valued CBAM enhancement stage improves the mIoU to 96.02%, indicating that channel and spatial recalibration can suppress redundant responses and enhance discriminative feature components. Introducing the gating mechanism further improves the mIoU to 96.76%. The complete CV-CGAE module achieves the highest mIoU of 97.21%, showing that feature enhancement, cross-attention interaction, and gated recalibration contribute complementarily to segmentation performance.
4) Qualitative Analysis of CV-CGAE via Feature Maps. The intermediate feature maps from the second decoder stage are visualized on the AIRSAR Flevoland dataset to further examine the effect of CV-CGAE, as shown in Figure 3. Without CV-CGAE, the feature maps present more diffuse activations and less distinct boundary responses, with visible interference from speckle-related fluctuations. After introducing CV-CGAE, the activations become more localized around terrain boundaries and land-cover contours, suggesting that the module helps enhance boundary- and texture-related responses while suppressing irrelevant feature components.
5) Visual Analysis of Ablation Configurations. To visually corroborate the quantitative ablation results in Table 2, Table S1, and Table S2, Figure S4-S6 present the segmentation maps of all six ablation variants on the three datasets. For each figure, subfigures (a)-(f) correspond to: (a) baseline U-Net, (b) standalone HRNet encoder, (c) real-valued HRU-Net (RV-HRU-Net), (d) RV-HRU-Net with real-valued CGAE, (e) complex-valued HRU-Net without CV-CGAE, and (f) the full proposed model with CV-CGAE.
On the AIRSAR San Francisco dataset (Figure S4), the baseline (a) produces scattered misclassifications, especially between developed and high-density urban areas. Standalone HRNet (b) introduces noisy patches and irregular boundaries, consistent with its low mIoU of 71.77% (Table 2). RV-HRU-Net (c) yields smoother regions but still confuses urban subclasses. Adding CGAE (d) refines some edges, yet misclassifications persist in low-density urban zones. CV-HRU-Net without CV-CGAE (e) improves class consistency in intensity-similar categories, and the full model (f) achieves the cleanest boundaries and fewest isolated errors, visually matching the highest mIoU of 97.21%.
Similar trends are observed on the 15-class Flevoland dataset (Figure S5) and the RADARSAT-2 San Francisco dataset (Figure S6). In Flevoland, the baseline and HRNet alone show fragmented crop parcels, while the full model produces coherent field boundaries and corrects the misclassification of small-sample classes such as buildings. On RADARSAT-2, the full model maintains continuous sea-land interfaces and preserves fine urban structures. These visual comparisons, together with the quantitative metrics in Tables S1 and S2, confirm the progressive contribution of each proposed component and the generalization of the CV-CGAE module across different sensors and frequency bands.
4.4. Semantic Segmentation Comparative Experiments
This subsection presents qualitative and quantitative comparisons between the proposed method and nine representative segmentation networks, including seven real-valued methods and two complex-valued methods, on three benchmark PolSAR datasets. For each dataset, the results are analyzed from both architectural and polarimetric perspectives to better explain the observed performance differences.
1) Results on AIRSAR San Francisco Dataset. Figure 4 shows the semantic segmentation maps generated by different methods on the AIRSAR San Francisco dataset. Three regions of interest (ROIs), marked by White Box 1, Box 2 and Box 3, are selected for detailed qualitative analysis.
White Box 1 evaluates overall segmentation performance across heterogeneous land-cover regions. Several real-valued networks misclassify parts of the sea surface as vegetation, which may be caused by similarities in backscattering intensity. In addition, most real-valued architectures show confusion between developed urban and high-density urban areas. The complex-valued methods, including L-CV-DeepLabv3+ and CV-Capsule U-Net, reduce part of this cross-class confusion, but their predicted boundaries remain relatively coarse in some local regions. In comparison, the proposed method produces more continuous sea-land interfaces and fewer isolated misclassified pixels.
White Box 2 examines the discrimination of terrain categories with similar backscattering intensities. FCN and SegFormer misclassify parts of the developed urban region as high-density urban, while DeepLabv3+ assigns some pixels to high-density urban and vegetation. From a polarimetric perspective, developed urban and high-density urban areas in L-band SAR observations may exhibit similar co-polarized backscattering power, making them difficult to separate using intensity-dominated representations alone. The proposed method achieves a developed urban IoU of 94.87%, outperforming the best real-valued network, TransUNet, by 0.87 percentage points and the second-best complex-valued network, CV-Capsule U-Net, by 0.13 percentage points. This improvement is consistent with the use of complex-valued convolutions, which preserve amplitude-phase interactions related to polarimetric scattering mechanisms. Developed urban areas with lower building density often contain mixed scattering components and relatively diffuse phase distributions, whereas high-density urban blocks are more likely to exhibit stronger double-bounce scattering and more coherent phase responses. By modeling these phase-related differences, the proposed method improves the separability of urban subclasses with similar intensity responses.
The built-up areas in this dataset are also affected by terrain azimuth modulation, where building orientation relative to the radar line of sight may introduce spatially varying polarimetric responses. Under such nonuniform scattering conditions, the proposed method obtains IoUs of 94.87% and 95.66% for developed urban and high-density urban categories, respectively. These results suggest that multi-scale fusion of complex-valued features improves robustness to orientation-induced scattering variability.
White Box 3 focuses on a dense low-density urban region. Several real-valued networks misclassify parts of this region as vegetation, whereas the proposed method better preserves the spatial continuity of urban structures. Quantitatively, the proposed method achieves a low-density urban IoU of 98.35%, which is higher than those of TransUNet and CV-Capsule U-Net, with IoUs of 94.55% and 94.81%, respectively.
The quantitative results in Table 5 are consistent with the visual comparisons. The proposed method achieves the best overall performance on this dataset, with an mIoU of 97.21%, an OA of 98.64%, and an MPA of 98.57%. By contrast, highly parameterized models such as CGRSeg and DeepLabv3+ obtain lower mIoU values of 69.77% and 71.84%, respectively, suggesting that large model capacity alone does not guarantee reliable performance under limited-sample PolSAR training conditions. The proposed lightweight complex-valued design achieves stronger accuracy with approximately 4.0M parameters, indicating a favorable balance between representational capacity and data scale.
2) Results on AIRSAR Flevoland Dataset. Figure 5 presents the semantic segmentation maps on the 15-class AIRSAR Flevoland dataset. This dataset is challenging because many crop categories exhibit similar polarimetric scattering responses. Three ROIs, marked by Black Box 1, Box 2 and Box 3, are selected for qualitative analysis.
Black Box 1 highlights a transition region between rapeseed and bare soil. Several real-valued networks misclassify rapeseed as beet or wheat, indicating the difficulty of separating crop types with similar intensity and textural characteristics. The proposed method provides clearer class separation and achieves a rapeseed IoU of 94.65%. This result may be attributed to the preservation of phase-related polarimetric information, including information associated with cross-polarized responses and canopy structural differences, which can be underutilized in purely real-valued representations.
Black Box 2 focuses on a wheat3 parcel to evaluate boundary preservation and class consistency. Baseline methods tend to misclassify boundary pixels as lucerne, wheat, or rapeseed, reflecting the difficulty of resolving fine-grained crop transitions under speckle and local scattering variability. The proposed method obtains a wheat3 IoU of 99.29% and produces more continuous parcel boundaries. This improvement is consistent with the proposed architectural design: the parallel high-resolution streams preserve spatial detail during encoding, while the CV-CGAE module selectively transfers boundary- and texture-related cues to support decoder reconstruction.
Black Box 3 evaluates the building category, which is a small-sample class with a limited pixel proportion. Several real-valued methods perform poorly on this category; for example, SegFormer, CGRSeg, and TransUNet achieve building IoUs of 15.65%, 25.60%, and 35.95%, respectively. In comparison, the proposed method increases the building IoU to 97.01%, outperforming the best real-valued baseline, DSNet, by 19.85 percentage points. This result suggests that the lightweight three-stage topology helps reduce overfitting risk for scarce categories, while the complex-valued formulation provides additional phase-related information for class discrimination.
The quantitative results in Table 6 further support these observations. The proposed method achieves an mIoU of 98.25%, and all 15 terrain categories obtain IoU values above 94%. In contrast, CGRSeg obtains an mIoU of 38.91%, with several classes showing very low IoU values. This result indicates that a highly parameterized Transformer-based backbone may be difficult to train effectively with the limited number of labeled samples in this dataset. Overall, the Flevoland results suggest that combining lightweight architecture design with complex-valued polarimetric representation is effective for small-sample PolSAR semantic segmentation.
3) Results on RADARSAT-2 San Francisco Dataset. Figure 6 presents the segmentation results on the RADARSAT-2 San Francisco dataset. Since this C-band spaceborne dataset covers a similar geographic region to the AIRSAR San Francisco dataset, it provides a useful cross-frequency and cross-platform evaluation.
White Box 1 and Box 2 cover vegetation and sea regions with relatively long and clear boundaries, making them suitable for assessing boundary localization. FCN misclassifies large sea areas as vegetation, low-density urban, and developed urban. DeepLabv3+, SegFormer, TransUNet, DSNet, CGRSeg, and VWFormer also show varying degrees of confusion near vegetation and urban boundaries. The two competing complex-valued networks reduce some of these errors, although L-CV-DeepLabv3+ still produces relatively coarse local boundaries. In comparison, the proposed method maintains more continuous terrain boundaries and fewer local misclassifications. Similar to the Flevoland dataset, this advantage is consistent with the combination of HRNet-based high-resolution feature preservation and CV-CGAE-based texture-guided feature refinement.
White Box 3 focuses on a developed urban region. Several real-valued networks misclassify parts of this area as vegetation or low-density urban, and the two complex-valued baselines also show localized errors. The proposed method correctly identifies most of the region and achieves a developed urban IoU of 97.89%, which is the highest among the compared methods. Together with the developed urban IoU of 94.87% on the L-band AIRSAR San Francisco dataset, this result indicates that the proposed model maintains stable discrimination of urban subclasses across different sensors and frequency bands. The multi-scale fusion strategy of the complex-valued HRNet may contribute to this stability by integrating scattering features across resolutions and reducing sensitivity to resolution-specific texture patterns.
The quantitative results are summarized in Table 7. The proposed method achieves an mIoU of 96.38%, exceeding the second-best complex-valued method, L-CV-DeepLabv3+, by 1.58 percentage points. Since the overall performance of most methods on this dataset is already relatively high, this improvement indicates that the proposed architecture provides additional benefit even in a high-accuracy regime.
5. Discussion
This section further analyzes the core components of the proposed method. First, the utilization of polarimetric phase information is examined from quantitative and physical perspectives. Second, the effects of boundary preservation and lightweight architectural design are discussed. Finally, the trade-off between model complexity and efficiency is analyzed, followed by limitations and future work.
5.1. Phase Information Utilization in Complex-Valued Networks
The performance improvement of Complex-Valued HRU-Net is closely related to its ability to preserve and process polarimetric phase information. This subsection provides supporting evidence from two aspects, namely phase randomization and physical scattering-mechanism analysis.
1) Phase Randomization Experiment. A phase randomization experiment is conducted to evaluate the dependence of the proposed model on polarimetric phase information. During testing, the phase components of the input coherency matrix are randomly shuffled while the corresponding amplitudes are kept unchanged. The randomized data are then fed into the trained model, and the results are compared with those obtained using the original complex-valued input. This experiment is conducted on the AIRSAR San Francisco dataset.
As shown in Table 8, phase randomization reduces the mIoU of Complex-Valued HRU-Net from 97.21% to 80.87%, corresponding to a decrease of 16.34 percentage points. Among the three urban categories, low-density urban shows the largest IoU decrease of 48.49 percentage points, followed by developed urban and high-density urban, with decreases of 18.96 and 8.35 percentage points, respectively. These categories often exhibit similar backscattering intensities, making them difficult to separate using amplitude information alone. The pronounced degradation after phase randomization indicates that the proposed network uses phase-related polarimetric information as an important discriminative cue, particularly for urban subclasses with similar intensity responses.
2) Physical Mapping with Polarimetric Scattering Mechanisms. The observed phase dependence can be interpreted using classical polarimetric scattering theory. In the monostatic reciprocity case, the phase of the off-diagonal coherency matrix element is related to the dominant scattering behavior. Values close to zero are often associated with surface scattering, values near may indicate double-bounce scattering, and volume scattering from vegetation generally produces a more diffuse phase distribution.
High-density urban areas often contain regularly aligned built-up structures with strong double-bounce scattering, leading to relatively concentrated phase responses. In contrast, developed urban areas may contain mixed built-up structures and vegetation, which increases the contribution of volume scattering and leads to more diffuse phase behavior and higher scattering entropy . Since the total backscattering power, such as , can be similar between these two urban categories, models relying mainly on real-valued intensity information may confuse them.
Complex-valued convolutions help reduce this ambiguity by modeling both local phase information and its spatial variation through amplitude-phase coupling terms. Compared with the real-valued DSNet baseline, the proposed method improves the developed urban IoU on the AIRSAR San Francisco dataset from 90.59% to 94.87%. Similarly, on the Flevoland dataset, the building IoU increases from 77.16% for DSNet to 97.01% for the proposed method. These results suggest that the learned complex-valued features are consistent with physical scattering characteristics and help separate classes with similar backscattering intensity but different dominant scattering mechanisms.
5.2. Boundary Preservation and Lightweight Design
Boundary ambiguity caused by speckle noise, mixed pixels, and heterogeneous scattering near land-cover interfaces can reduce the accuracy of PolSAR semantic segmentation. To evaluate the boundary localization capability of the proposed method, we conduct quantitative boundary assessment and architectural analysis.
1) Quantitative Evaluation of Boundary Quality. The Boundary F1-score (BF1) with a tolerance threshold of pixels is adopted to evaluate boundary adherence. This metric is computed as the harmonic mean of boundary precision and boundary recall, where boundary pixels are extracted from the predicted segmentation maps and ground-truth labels using morphological gradients.
As shown in Table 9, the proposed method achieves the highest BF1 scores on all three datasets. On the AIRSAR San Francisco dataset, it obtains a BF1 of 91.88%, outperforming the second-best model, TransUNet, by 3.83 percentage points. On the AIRSAR Flevoland and RADARSAT-2 San Francisco datasets, the proposed method achieves BF1 scores of 96.37% and 91.71%, exceeding the strongest baseline, CV-Capsule U-Net, by 2.61 and 1.08 percentage points, respectively.
Removing the CV-CGAE module reduces the BF1 score from 91.88% to 84.07% on AIRSAR San Francisco, from 96.37% to 93.68% on AIRSAR Flevoland, and from 91.71% to 88.67% on RADARSAT-2 San Francisco. These consistent decreases indicate that CV-CGAE contributes to preserving fine geometric boundaries by refining skip-connection features and reducing the influence of speckle-contaminated responses.
2) Architectural Synergy Mechanism Analysis. The boundary preservation capability of the proposed framework benefits from the combination of multi-scale high-resolution encoding and selective feature transfer. The parallel high-resolution subnetworks retain fine spatial details throughout the encoding stage, while skip connections provide pathways for recovering spatial resolution in the decoder. Within this architecture, the CV-CGAE module adaptively transfers boundary- and texture-related encoder features to the decoder, thereby reducing the direct propagation of noisy shallow responses.
Compared with conventional U-Net architectures, where repeated downsampling may weaken fine geometric structures, the proposed encoder maintains high-resolution feature streams to preserve localized details. Compared with Transformer-based models that emphasize global context modeling, the proposed architecture retains local spatial continuity by combining high-resolution convolutional encoding with gated skip-connection refinement.
The lightweight configuration further supports boundary preservation under limited-sample PolSAR training conditions. Highly parameterized networks may overfit to local noise or scene-specific textures, which can lead to fragmented or irregular predictions along class boundaries. By reducing network depth and parameter redundancy, the proposed lightweight design improves generalization and contributes to more stable boundary localization, as reflected by the BF1 results.
5.3. Model Complexity and Efficiency
Model efficiency is an important factor in evaluating the practical applicability of semantic segmentation networks. Table 10 compares the number of parameters, FLOPs, and inference speed in frames per second (FPS) of different methods on the AIRSAR San Francisco dataset. The proposed model contains 4.06M parameters, corresponding to 47.7% of the parameter count of L-CV-DeepLabv3+ (8.51M), and achieves an inference speed of 23.10 FPS, which is approximately twice that of L-CV-DeepLabv3+ (11.57 FPS). Although the parallel multi-resolution topology introduces relatively higher computational cost, requiring 4.96G FLOPs, it provides improved segmentation accuracy and boundary preservation. Compared with the lightest complex-valued baseline, CV-Capsule U-Net, which contains 3.42M parameters, the proposed model introduces only 0.64M additional parameters while improving mIoU by 1.80 percentage points. These results indicate that the proposed architecture offers a favorable balance between segmentation accuracy and model efficiency.
Complex-valued convolutions generally require more arithmetic operations than their real-valued counterparts because the real and imaginary components are coupled during multiplication and addition. This additional computation allows the network to preserve amplitude-phase interactions in the polarimetric coherency matrix, particularly the off-diagonal elements that contain inter-channel correlation and relative phase information. As shown in the parameter-fair comparison in Table3, simply increasing the capacity of the real-valued HRU-Net does not yield the same improvement as the complex-valued formulation. Moreover, the complex-valued HRU-Net improves mIoU by 0.75 percentage points over its real-valued counterpart in Table 2, suggesting that the retained phase-related information contributes to segmentation performance. For precision-oriented applications such as urban land-cover mapping, where developed urban and high-density urban areas may exhibit similar backscattering intensities but different scattering mechanisms, this trade-off can be considered acceptable.
5.4. Limitations and Future Outlook
Although the proposed method achieves strong performance on three benchmark datasets, several limitations remain and provide directions for future research.
First, the experimental validation covers L- and C-band PolSAR data acquired from both airborne and spaceborne platforms. However, its generalization to other frequency bands, such as X-band, as well as to different sensors, imaging geometries, and geographic regions, still requires further investigation. Because publicly available PolSAR datasets with pixel-level annotations remain limited, large-scale cross-domain evaluation is still challenging. Future work will explore domain adaptation and transfer learning strategies to improve robustness across heterogeneous sensors and scenes.
Second, the parallel multi-resolution topology improves boundary localization and multi-scale feature representation, but it also introduces higher computational cost. The proposed model requires 4.96G FLOPs, which is higher than that of CV-Capsule U-Net. For resource-constrained onboard or near-real-time processing scenarios, further model compression is needed. Future work will investigate pruning, quantization, and knowledge distillation methods tailored to complex-valued neural networks.
Third, the proposed method is trained in a fully supervised manner, which limits rapid deployment in practical applications where dense pixel-level annotations are expensive to obtain. Semi-supervised and self-supervised learning in the complex domain are promising directions for reducing annotation dependence. The phase randomization experiment indicates that phase coherence provides important information for scattering discrimination, which may guide the design of physics-informed data augmentation and self-supervised pretraining strategies for PolSAR segmentation.
Finally, the current physical interpretation is mainly supported by phase randomization experiments and theoretical analysis of complex-valued convolution, without a pixel-wise quantitative mapping between learned deep features and classical polarimetric decomposition parameters. Future work will establish explicit regression or correlation analyses between encoder features and Cloude-Pottier parameters, such as entropy and mean scattering angle , to provide more quantitative physical interpretability for complex-valued segmentation networks.
6. Conclusion
This paper has proposed the Complex-Valued HRU-Net, a lightweight encoder-decoder architecture for polarimetric synthetic aperture radar (PolSAR) semantic segmentation. The proposed framework integrates phase-aware representation learning, parallel multi-resolution high-resolution encoding, and cross-attention-based feature interaction within a unified complex-valued design. Specifically, the network addresses intra-class scattering variability and inter-class scattering similarity through the coordinated coupling of a lightweight three-stage complex-valued HRNet encoder and a progressive complex-valued U-Net decoder, yielding phase-aware, spatially detailed, and semantically discriminative representations. To bridge the encoder-decoder semantic gap and suppress speckle propagation, the Complex-Valued Cross-Gated Attention Enhancement (CV-CGAE) module is embedded at the second skip connection, performing sequential enhancement, cross-attention interaction, and gated adaptive recalibration, which leads to notably sharper land-cover boundaries and reduced misclassifications near interfaces. Furthermore, controlled experiments and theoretical analysis confirm that preserving amplitude-phase interactions enables the network to separate classes with similar backscattering intensities but distinct scattering mechanisms, thereby providing post-hoc physical interpretability.
Extensive experiments on three airborne and spaceborne PolSAR datasets—AIRSAR San Francisco, AIRSAR Flevoland, and RADARSAT-2 San Francisco—validate the effectiveness of the proposed method. Complex-Valued HRU-Net achieves mean Intersection-over-Union (mIoU) values of 97.21%, 98.25%, and 96.38%, respectively, and obtains improved Boundary F1-score performance across all three datasets. In the challenging 15-class Flevoland scene, all land-cover categories achieve IoU values above 94%, demonstrating stable fine-grained segmentation. Parameter-fair comparisons confirm that the performance gains stem from the explicit use of complex-valued polarimetric information rather than from increased model capacity alone.
Future work will focus on three aspects: cross-domain generalization to different frequency bands and sensors via domain adaptation or transfer learning; model compression for resource-constrained onboard processing; and quantitative mapping between learned complex-valued features and classical polarimetric decomposition parameters, such as entropy and scattering angle , to further enhance physical interpretability.
Supplementary Materials
The following supporting information can be downloaded at the website of this paper posted on Preprints.org, Figure S1: AIRSAR San Francisco Dataset; Figure S2: AIRSAR Flevoland Dataset; Figure S3: RADARSAT-2 San Francisco Dataset; Figure S4: Ablation study segmentation images on the AIRSAR San Francisco Dataset; Figure S5: Ablation study segmentation images on the AIRSAR Flevoland Dataset; Figure S6: Ablation study segmentation images on the RADARSAT-2 San Francisco Dataset; Table S1: Ablation Study Results on the AIRSAR Flevoland dataset (%); Table S2: Ablation Study Results on the RADARSAT-2 San Francisco dataset (%).
Author Contributions
Conceptualization, X.X. and L.D.; methodology, X.X. and L.Y.; software, P.X. and Y.G.; validation, L.Y. and M.L.; writing, P.X. and X.X. All authors have read and agreed to the published version of the manuscript.
Funding
This research was funded by the National Natural Science Foundation of China (no. 62561003, no. 62261027, no. 62566028, and no. 62266020), the Natural Science Foundation of Jiangxi Province (no. 20252BAC240198, no. 20224BAB202002, and no. 20224BAB212013).
Data Availability Statement
The AIRSAR San Francisco and Flevoland datasets are publicly available from the NASA/JPL AIRSAR platform (https://airsar.jpl.nasa.gov/). The RADARSAT-2 San Francisco dataset is proprietary and can be accessed via MDA (https://www.mda.space/radarsat-2/). The source code for the proposed CV-HRU-Net method is available at https://github.com/SmartSensingRadar/CV-HRUNet.
Conflicts of Interest
The authors declare no conflicts of interest.
References
- Ghanbari, M.; Xu, L.; Clausi, D.A. Local and Global Spatial Information for Land Cover Semisupervised Classification of Complex Polarimetric SAR Data. IEEE J. Sel. Top. Appl. Earth Obs. Remote Sens. 2023, 16, 3892–3904. [Google Scholar] [CrossRef]
- Liao, L.; Zhao, Q.; Song, W. Monitoring of Oil Spill Risk in Coastal Areas Based on Polarimetric SAR Satellite Images and Deep Learning Theory. Sustainability 2023, 15, 14504. [Google Scholar] [CrossRef]
- Lee, J.-S.; Pottier, E. Polarimetric Radar Imaging: From Basics to Applications; CRC Press: Boca Raton, FL, USA, 2009. [Google Scholar]
- Yin, Q.; Du, Y.; Li, F.; Zhou, Y.; Zhang, F. Multi-Temporal Dual Polarimetric SAR Crop Classification Based on Spatial Information Comprehensive Utilization. Remote Sens. 2025, 17, 2304. [Google Scholar] [CrossRef]
- Zhang, Q.; He, C.; He, B.; Tong, M. Learning Scattering Similarity and Texture-Based Attention with Convolutional Neural Networks for PolSAR Image Classification. IEEE Trans. Geosci. Remote Sens. 2023, 61, 5207419. [Google Scholar] [CrossRef]
- Nie, X.; Qiao, H.; Zhang, B.; Huang, X. A Nonlocal TV-Based Variational Method for PolSAR Data Speckle Reduction. IEEE Trans. Image Process. 2016, 25, 2620–2634. [Google Scholar] [CrossRef] [PubMed]
- Jiao, L.; Liu, F. Wishart Deep Stacking Network for Fast POLSAR Image Classification. IEEE Trans. Image Process. 2016, 25, 3273–3286. [Google Scholar] [CrossRef] [PubMed]
- Wu, Q.; Hou, B.; Wen, Z.; Jiao, L. Variational Learning of Mixture Wishart Model for PolSAR Image Classification. IEEE Trans. Geosci. Remote Sens. 2019, 57, 141–154. [Google Scholar] [CrossRef]
- Song, W.; Li, M.; Zhang, P.; Wu, Y.; Jia, L.; An, L. Unsupervised PolSAR Image Classification and Segmentation Using Dirichlet Process Mixture Model and Markov Random Fields with Similarity Measure. IEEE J. Sel. Top. Appl. Earth Obs. Remote Sens. 2017, 10, 3556–3568. [Google Scholar] [CrossRef]
- Guo, Y.; et al. Adaptive Fuzzy Learning Superpixel Representation for PolSAR Image Classification. IEEE Trans. Geosci. Remote Sens. 2022, 60, 5217818. [Google Scholar] [CrossRef]
- Wang, S.; et al. Semi-Supervised PolSAR Image Classification Based on Improved Tri-Training with a Minimum Spanning Tree. IEEE Trans. Geosci. Remote Sens. 2020, 58, 8583–8597. [Google Scholar] [CrossRef]
- Long, J.; Shelhamer, E.; Darrell, T. Fully Convolutional Networks for Semantic Segmentation. In Proceedings of the IEEE Conference on Computer Vision and Pattern Recognition (CVPR), Boston, MA, USA, 7–12 June 2015; pp. 3431–3440. [Google Scholar] [CrossRef]
- Ronneberger, O.; Fischer, P.; Brox, T. U-Net: Convolutional Networks for Biomedical Image Segmentation. In Proceedings of the International Conference on Medical Image Computing and Computer-Assisted Intervention (MICCAI), Munich, Germany, 5–9 October 2015; pp. 234–241. [Google Scholar] [CrossRef]
- Sun, K.; Xiao, B.; Liu, D.; Wang, J. Deep High-Resolution Representation Learning for Human Pose Estimation. In Proceedings of the IEEE/CVF Conference on Computer Vision and Pattern Recognition (CVPR), Long Beach, CA, USA, 15–20 June 2019; pp. 5686–5696. [Google Scholar] [CrossRef]
- Woo, S.; Park, J.; Lee, J.-Y.; Kweon, I.S. CBAM: Convolutional Block Attention Module. In Proceedings of the European Conference on Computer Vision (ECCV), Munich, Germany, 8–14 September 2018; pp. 3–19. [Google Scholar] [CrossRef]
- Vaswani, A.; Shazeer, N.; Parmar, N.; et al. Attention Is All You Need. In Proceedings of the Advances in Neural Information Processing Systems (NeurIPS), Long Beach, CA, USA, 4–9 December 2017; pp. 5998–6008. [Google Scholar]
- Liu, Z.; Lin, Y.; Cao, Y.; et al. Swin Transformer: Hierarchical Vision Transformer Using Shifted Windows. In Proceedings of the IEEE/CVF International Conference on Computer Vision (ICCV), Montreal, QC, Canada, 11–17 October 2021; pp. 10012–10022. [Google Scholar] [CrossRef]
- Xie, E.; Wang, W.; Yu, Z.; et al. SegFormer: Simple and Efficient Design for Semantic Segmentation with Transformers. In Proceedings of the Advances in Neural Information Processing Systems (NeurIPS), Virtual, 6–14 December 2021; Volume 34, pp. 12077–12090. [Google Scholar]
- Dosovitskiy, A.; Beyer, L.; Kolesnikov, A.; et al. An Image Is Worth 16×16 Words: Transformers for Image Recognition at Scale. In Proceedings of the International Conference on Learning Representations (ICLR), Virtual, 3–7 May 2021. [Google Scholar]
- Zheng, S.; Lu, J.; Zhao, H.; et al. Rethinking Semantic Segmentation from a Sequence-to-Sequence Perspective with Transformers. In Proceedings of the IEEE/CVF Conference on Computer Vision and Pattern Recognition (CVPR), Virtual, 19–25 June 2021; pp. 6881–6890. [Google Scholar] [CrossRef]
- Strudel, R.; Garcia, R.; Laptev, I.; Schmid, C. Segmenter: Transformer for Semantic Segmentation. In Proceedings of the IEEE/CVF International Conference on Computer Vision (ICCV), Virtual, 11–17 October 2021; pp. 7262–7272. [Google Scholar] [CrossRef]
- Chen, J.; Lu, Y.; Yu, Q.; et al. TransUNet: Transformers Make Strong Encoders for Medical Image Segmentation. arXiv 2021, arXiv:2102.04306. [Google Scholar]
- Liu, K.; Zheng, D.; Fan, J. Hybrid CNN-Transformer for Marine Aquaculture Semantic Segmentation Based on PolSAR Images. In Proceedings of the IEEE International Geoscience and Remote Sensing Symposium (IGARSS), Athens, Greece, 7–12 July 2024; pp. 8255–8258. [Google Scholar] [CrossRef]
- Fang, X.; Chen, N.; Jiang, Y.; et al. A Hybrid Framework with Scattering Distribution Perception and Edge Refinement for PolSAR Image Segmentation. IEEE J. Sel. Top. Appl. Earth Obs. Remote Sens. 2025, 18, 1–18. [Google Scholar] [CrossRef]
- Ni, Z.; Chen, X.; Zhai, Y.; et al. Context-Guided Spatial Feature Reconstruction for Efficient Semantic Segmentation. In Proceedings of the European Conference on Computer Vision (ECCV), Milan, Italy, 29 September–4 October 2024; pp. 239–255. [Google Scholar] [CrossRef]
- Yan, H.; Wu, M.; Zhang, C. Multi-Scale Representations by Varying Window Attention for Semantic Segmentation. In Proceedings of the International Conference on Learning Representations (ICLR), Vienna, Austria, 7–11 May 2024. [Google Scholar] [CrossRef]
- Trabelsi, C.; Bilaniuk, O.; Zhang, Y.; et al. Deep Complex Networks. In Proceedings of the International Conference on Learning Representations (ICLR), Vancouver, BC, Canada, 30 April–3 May 2018. [Google Scholar]
- Yu, L.; Zeng, Z.; Liu, A.; et al. A Lightweight Complex-Valued DeepLabv3+ for Semantic Segmentation of PolSAR Image. IEEE J. Sel. Top. Appl. Earth Obs. Remote Sens. 2022, 15, 930–943. [Google Scholar] [CrossRef]
- Yu, L.; Shao, Q.; Guo, Y.; et al. Complex-Valued UNet with Capsule Embedded for Semantic Segmentation of PolSAR Image. Remote Sens. 2023, 15, 1371. [Google Scholar] [CrossRef]
- Zeng, X.; Wang, Z.; Wang, Y.; et al. SemiPSCN: Polarization Semantic Constraint Network for Semi-Supervised Segmentation in Large-Scale and Complex-Valued PolSAR Images. IEEE Trans. Geosci. Remote Sens. 2024, 62, 5222418. [Google Scholar] [CrossRef]
- Jiang, Y.; Du, R.; Song, W.; et al. Lightweight Complex-Valued Siamese Network for Few-Shot PolSAR Image Classification. Remote Sens. 2026, 18, 344. [Google Scholar] [CrossRef]
- Xu, R.; Zhang, S.; Dong, C.; et al. Lightweight Attention Refined and Complex-Valued BiSeNetV2 for Semantic Segmentation of Polarimetric SAR Image. Remote Sens. 2025, 17, 3527. [Google Scholar] [CrossRef]
- Kuang, Z.; Liu, S.; Bi, H.; He, L.; Li, F. CV-CPKAN: Complex-Valued Convolutional Kolmogorov–Arnold Framework for PolSAR Image Classification. Remote Sens. 2026, 18, 330. [Google Scholar] [CrossRef]
- Guo, R.; Zhao, X.; Guo, L.; et al. A Complex-Valued PolSAR Image Segmentation Network with Lovász-Softmax Loss Optimization. IEEE J. Miniat. Air Space Syst. 2024, 5, 100–107. [Google Scholar] [CrossRef]
- Ma, Y.; Aghababaei, H.; Chang, L.; Deng, X.; Wei, J. A Joint Real- and Complex-Valued Network for Classification of Pol(In)SAR Images. IEEE J. Sel. Top. Appl. Earth Obs. Remote Sens. 2025, 18, 22256–22270. [Google Scholar] [CrossRef]
- Alkhatib, M.Q. DDF2Pol: A Dual-Domain Feature Fusion Network for PolSAR Image Classification. Pattern Recognit. Lett. 2025, 197, 110–116. [Google Scholar] [CrossRef]
- Jiang, N.; Zhao, W.; Guo, J.; Zhao, Q.; Zhu, J. Multi-Scale Feature Extraction with 3D Complex-Valued Network for PolSAR Image Classification. Remote Sens. 2025, 17, 2663. [Google Scholar] [CrossRef]
- Cloude, S.R.; Pottier, E. An Entropy Based Classification Scheme for Land Applications of Polarimetric SAR. IEEE Trans. Geosci. Remote Sens. 1997, 35, 68–78. [Google Scholar] [CrossRef]
- Zhang, J.; Han, F.; Zhuang, D.; Zhang, L.; Zou, B.; Yuan, L. Toward Interpretable PolSAR Image Classification: Polarimetric Scattering Mechanism Informed Concept Bottleneck and Kolmogorov–Arnold Network. IEEE Trans. Geosci. Remote Sens. 2026, 64, 1–16. [Google Scholar] [CrossRef]
- NASA/JPL AIRSAR. AIRSAR San Francisco Bay Area Dataset. Available online: https://airsar.jpl.nasa.gov/ (accessed on 1 June 2026).
- NASA/JPL AIRSAR. AIRSAR Flevoland Dataset. Available online: https://airsar.jpl.nasa.gov/ (accessed on 1 June 2026).
- MDA. RADARSAT-2 San Francisco Dataset. Available online: https://www.mda.space/radarsat-2/ (accessed on 1 June 2026).
- Wu, W.; Li, H.; Li, X.; et al. PolSAR Image Semantic Segmentation Based on Deep Transfer Learning Realizing Smooth Classification with Small Training Sets. IEEE Geosci. Remote Sens. Lett. 2019, 16, 977–981. [Google Scholar] [CrossRef]
- Ding, L.; Zheng, K.; Lin, D.; et al. MP-ResNet: Multipath Residual Network for the Semantic Segmentation of High-Resolution PolSAR Images. IEEE Geosci. Remote Sens. Lett. 2022, 19, 4012105. [Google Scholar] [CrossRef]
- Jing, H.; Wang, Z.; Sun, X.; et al. PSRN: Polarimetric Space Reconstruction Network for PolSAR Image Semantic Segmentation. IEEE J. Sel. Top. Appl. Earth Obs. Remote Sens. 2021, 14, 10716–10732. [Google Scholar] [CrossRef]
- Guo, Z.; Bian, L.; Wei, H.; Li, J.; Ni, H.; Huang, X. DSNet: A Novel Way to Use Atrous Convolutions in Semantic Segmentation. IEEE Trans. Circuits Syst. Video Technol. 2025, 35, 3679–3692. [Google Scholar] [CrossRef]
- Sun, J.; Yang, S.; Gao, X.; et al. MASA-SegNet: A Semantic Segmentation Network for PolSAR Images. Remote Sens. 2023, 15, 3662. [Google Scholar] [CrossRef]
- Zeng, X.; Wang, Z.; Sun, X.; Chang, Z.; et al. DENet: Double-Encoder Network with Feature Refinement and Region Adaption for Terrain Segmentation in PolSAR Images. IEEE Trans. Geosci. Remote Sens. 2022, 60, 5232219. [Google Scholar] [CrossRef]
- Chu, B.; Chen, J.; Chen, J.; et al. SDCAFNet: A Deep Convolutional Neural Network for Land-Cover Semantic Segmentation with the Fusion of PolSAR and Optical Images. IEEE J. Sel. Top. Appl. Earth Obs. Remote Sens. 2022, 15, 8928–8942. [Google Scholar] [CrossRef]
- Wang, Z.; Wang, Z.; Qiu, X.; Zhang, Z. Global Polarimetric Synthetic Aperture Radar Image Segmentation with Data Augmentation and Hybrid Architecture Model. Remote Sens. 2024, 16, 380. [Google Scholar] [CrossRef]
- Xu, Z.; Wu, D.; Yu, C.; et al. SCTNet: Single-Branch CNN with Transformer Semantic Information for Real-Time Segmentation. Proc. AAAI Conf. Artif. Intell. 2024, Volume 38, 6378–6386. [Google Scholar] [CrossRef]
- Xiao, D.; Wang, Z.; Wu, Y.; Gao, X.; Sun, X. Terrain Segmentation in Polarimetric SAR Images Using Dual-Attention Fusion Network. IEEE Geosci. Remote Sens. Lett. 2022, 19, 4018505. [Google Scholar] [CrossRef]
- Wang, S.; et al. CDFNet: Cross-Domain Feature Fusion Network for PolSAR Terrain Classification. IEEE Trans. Geosci. Remote Sens. 2025, 63, 1–15. [Google Scholar] [CrossRef]
Figure 1.
Architecture of Complex-Valued HRU-Net.
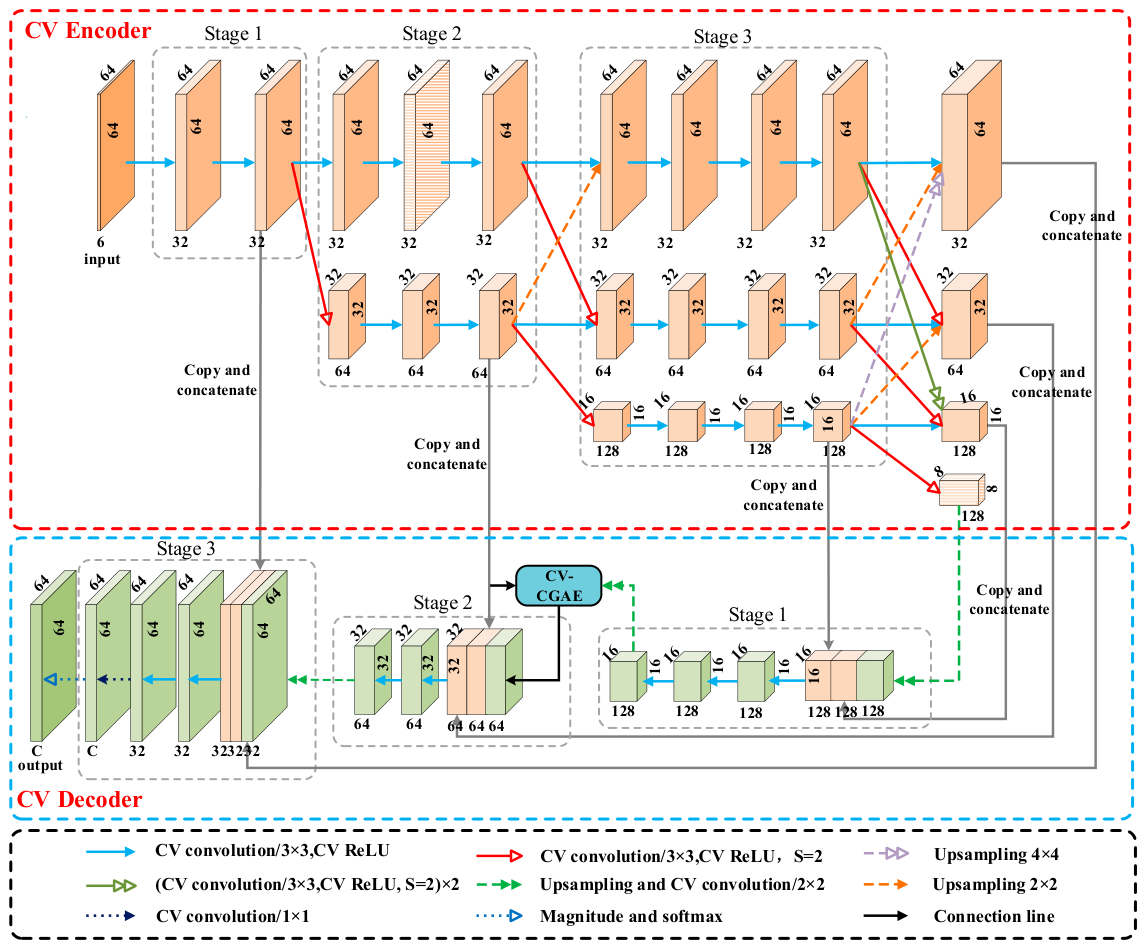
Figure 2.
Architecture of the Complex-Valued Cross-Gated Attention Enhancement (CV-CGAE) module.
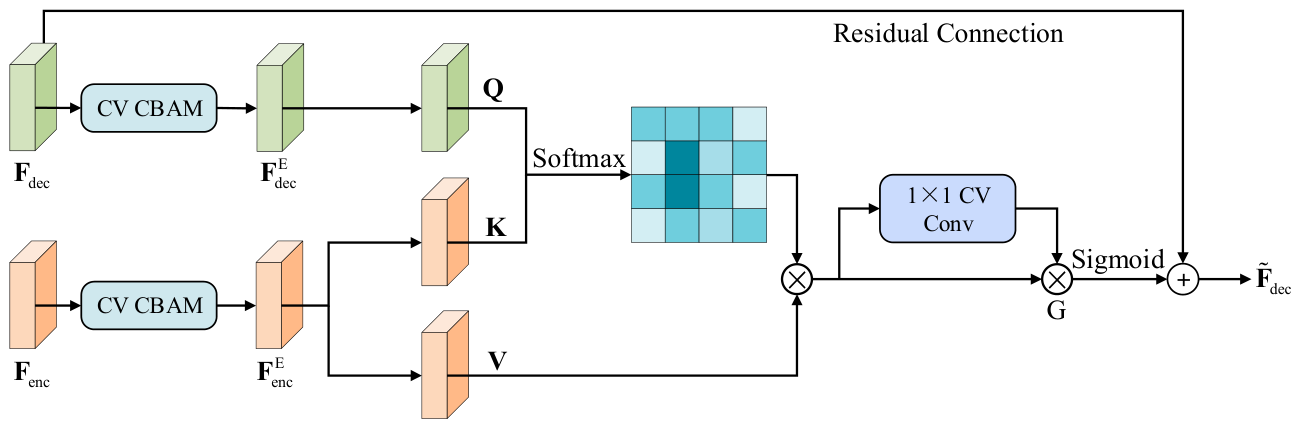
Figure 3.
Feature visualization on AIRSAR Flevoland dataset. (a) Cropped sample image. (b) Feature output of the second decoder stage of Complex-Valued HRU-Net. (c) Feature output after introducing the CV-CGAE module.
Figure 3.
Feature visualization on AIRSAR Flevoland dataset. (a) Cropped sample image. (b) Feature output of the second decoder stage of Complex-Valued HRU-Net. (c) Feature output after introducing the CV-CGAE module.
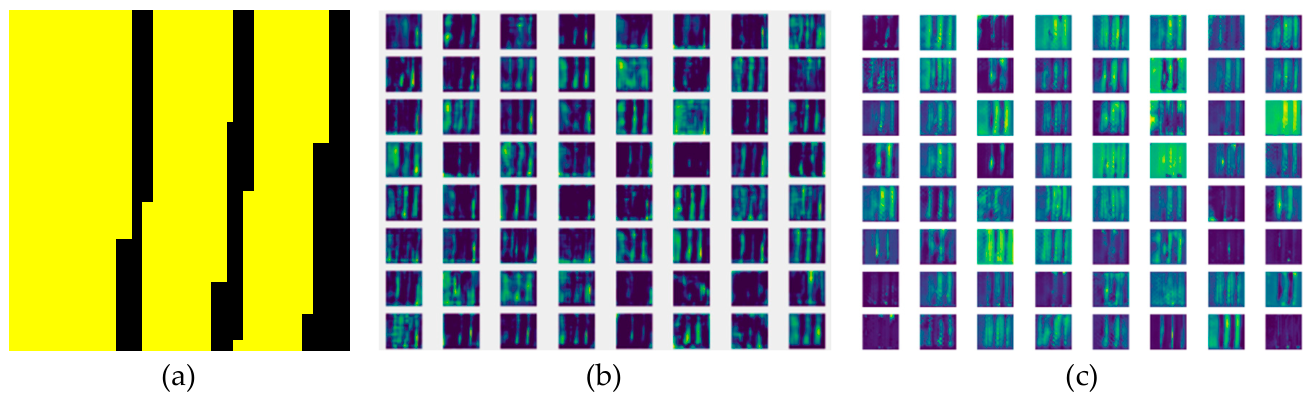
Figure 4.
Segmentation results on the AIRSAR San Francisco dataset. (a) FCN; (b) DeepLabv3+; (c) TransUNet; (d) SegFormer; (e) DSNet; (f) CGRSeg; (g) VWFormer; (h) L-CV-DeepLabv3+; (i) CV-Capsule U-Net; (j) Proposed; (k) ground truth.
Figure 4.
Segmentation results on the AIRSAR San Francisco dataset. (a) FCN; (b) DeepLabv3+; (c) TransUNet; (d) SegFormer; (e) DSNet; (f) CGRSeg; (g) VWFormer; (h) L-CV-DeepLabv3+; (i) CV-Capsule U-Net; (j) Proposed; (k) ground truth.
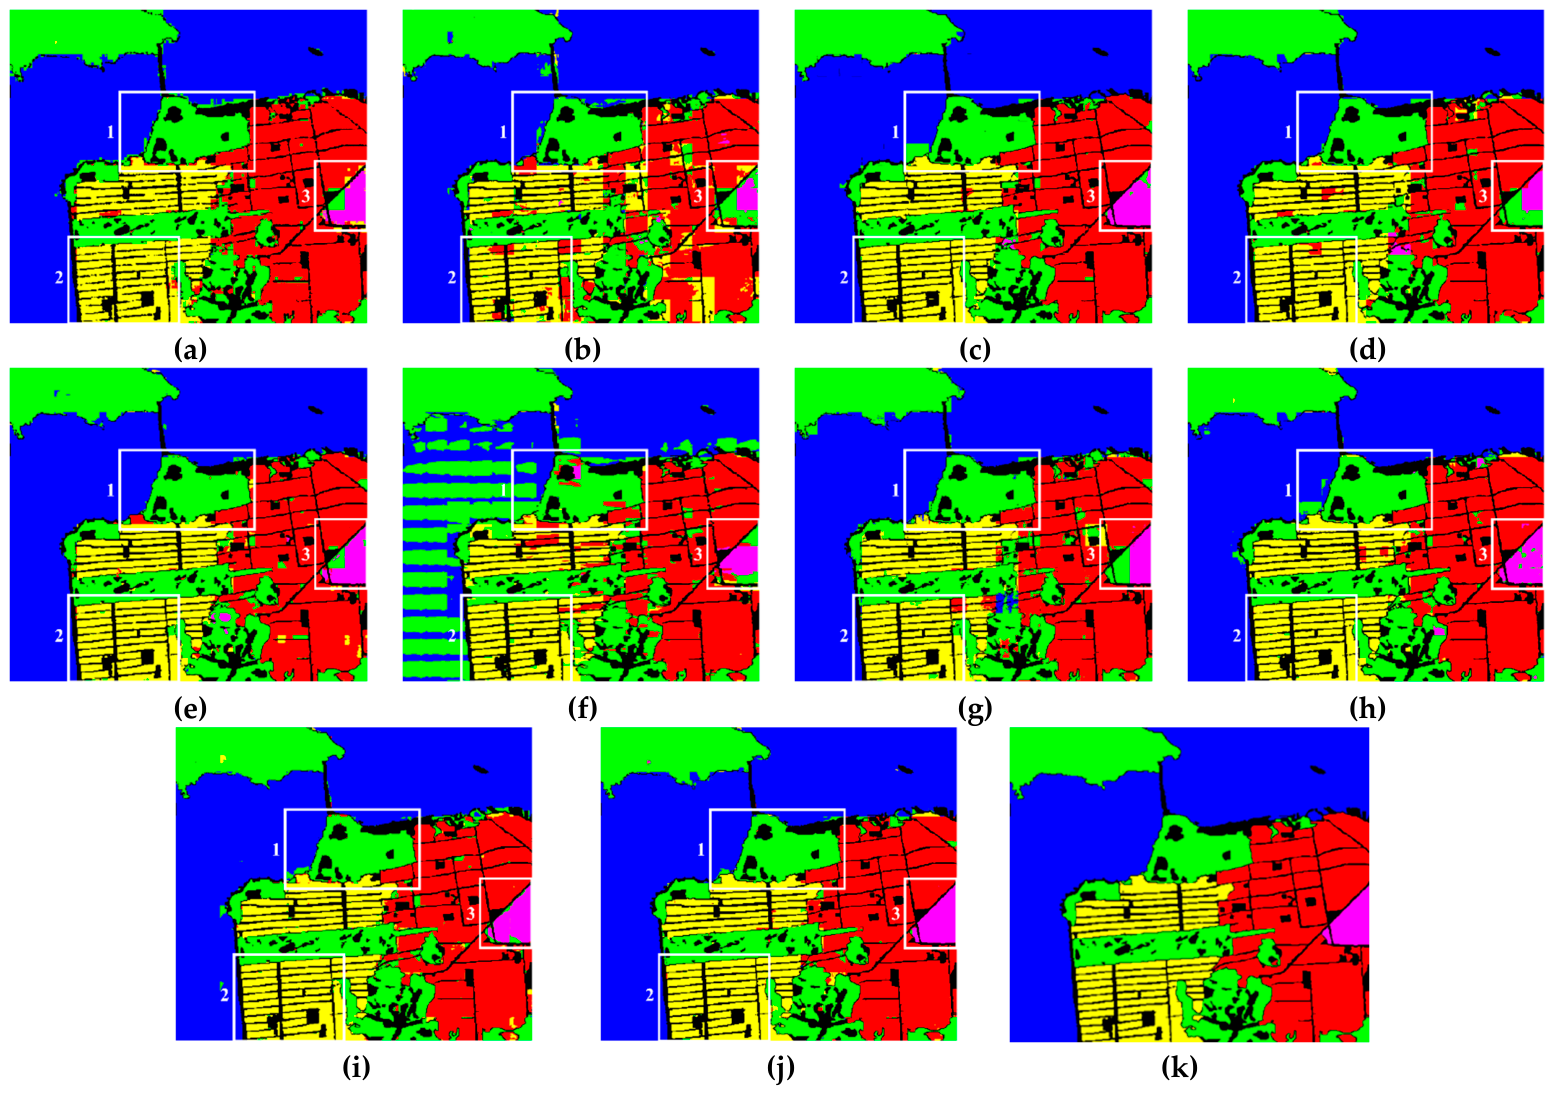
Figure 5.
Segmentation results on the AIRSAR Flevoland dataset. (a) FCN; (b) DeepLabv3+; (c) TransUNet; (d) SegFormer; (e) DSNet; (f) CGRSeg; (g) VWFormer; (h) L-CV-DeepLabv3+; (i) CV-Capsule U-Net; (j) Proposed; (k) ground truth.
Figure 5.
Segmentation results on the AIRSAR Flevoland dataset. (a) FCN; (b) DeepLabv3+; (c) TransUNet; (d) SegFormer; (e) DSNet; (f) CGRSeg; (g) VWFormer; (h) L-CV-DeepLabv3+; (i) CV-Capsule U-Net; (j) Proposed; (k) ground truth.
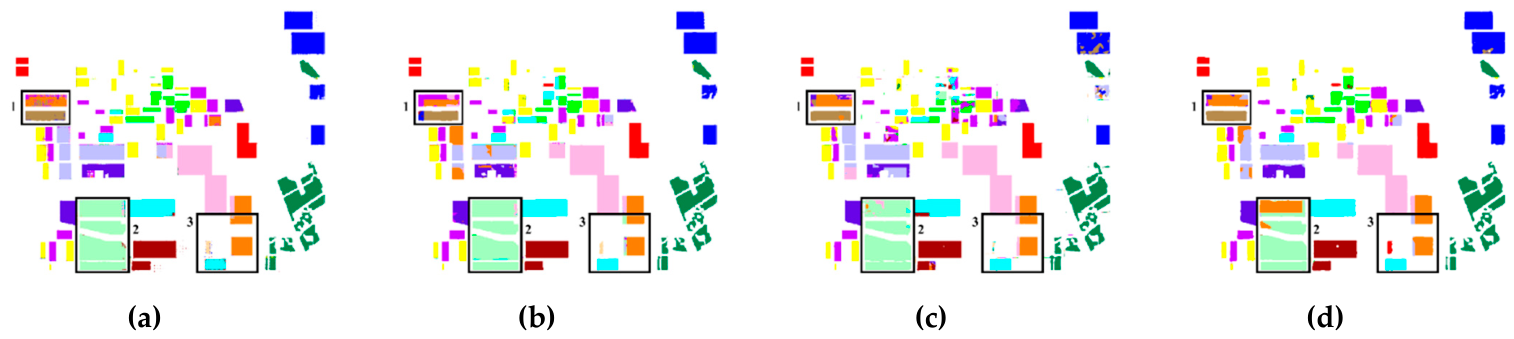
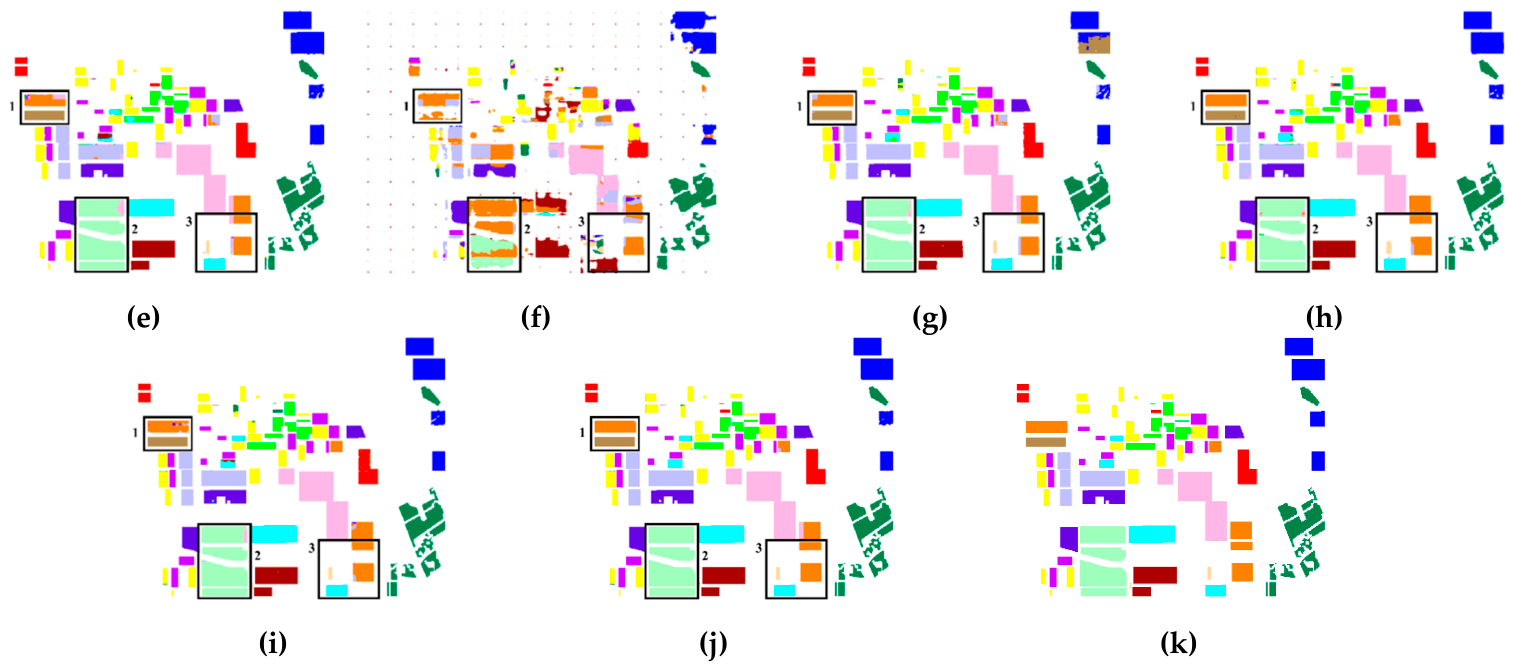
Figure 6.
Segmentation results on the RADARSAT-2 San Francisco dataset. (a) FCN; (b) DeepLabv3+; (c) TransUNet; (d) SegFormer; (e) DSNet; (f) CGRSeg; (g) VWFormer; (h) L-CV-DeepLabv3+; (i) CV-Capsule U-Net; (j) Proposed; (k) ground truth.
Figure 6.
Segmentation results on the RADARSAT-2 San Francisco dataset. (a) FCN; (b) DeepLabv3+; (c) TransUNet; (d) SegFormer; (e) DSNet; (f) CGRSeg; (g) VWFormer; (h) L-CV-DeepLabv3+; (i) CV-Capsule U-Net; (j) Proposed; (k) ground truth.
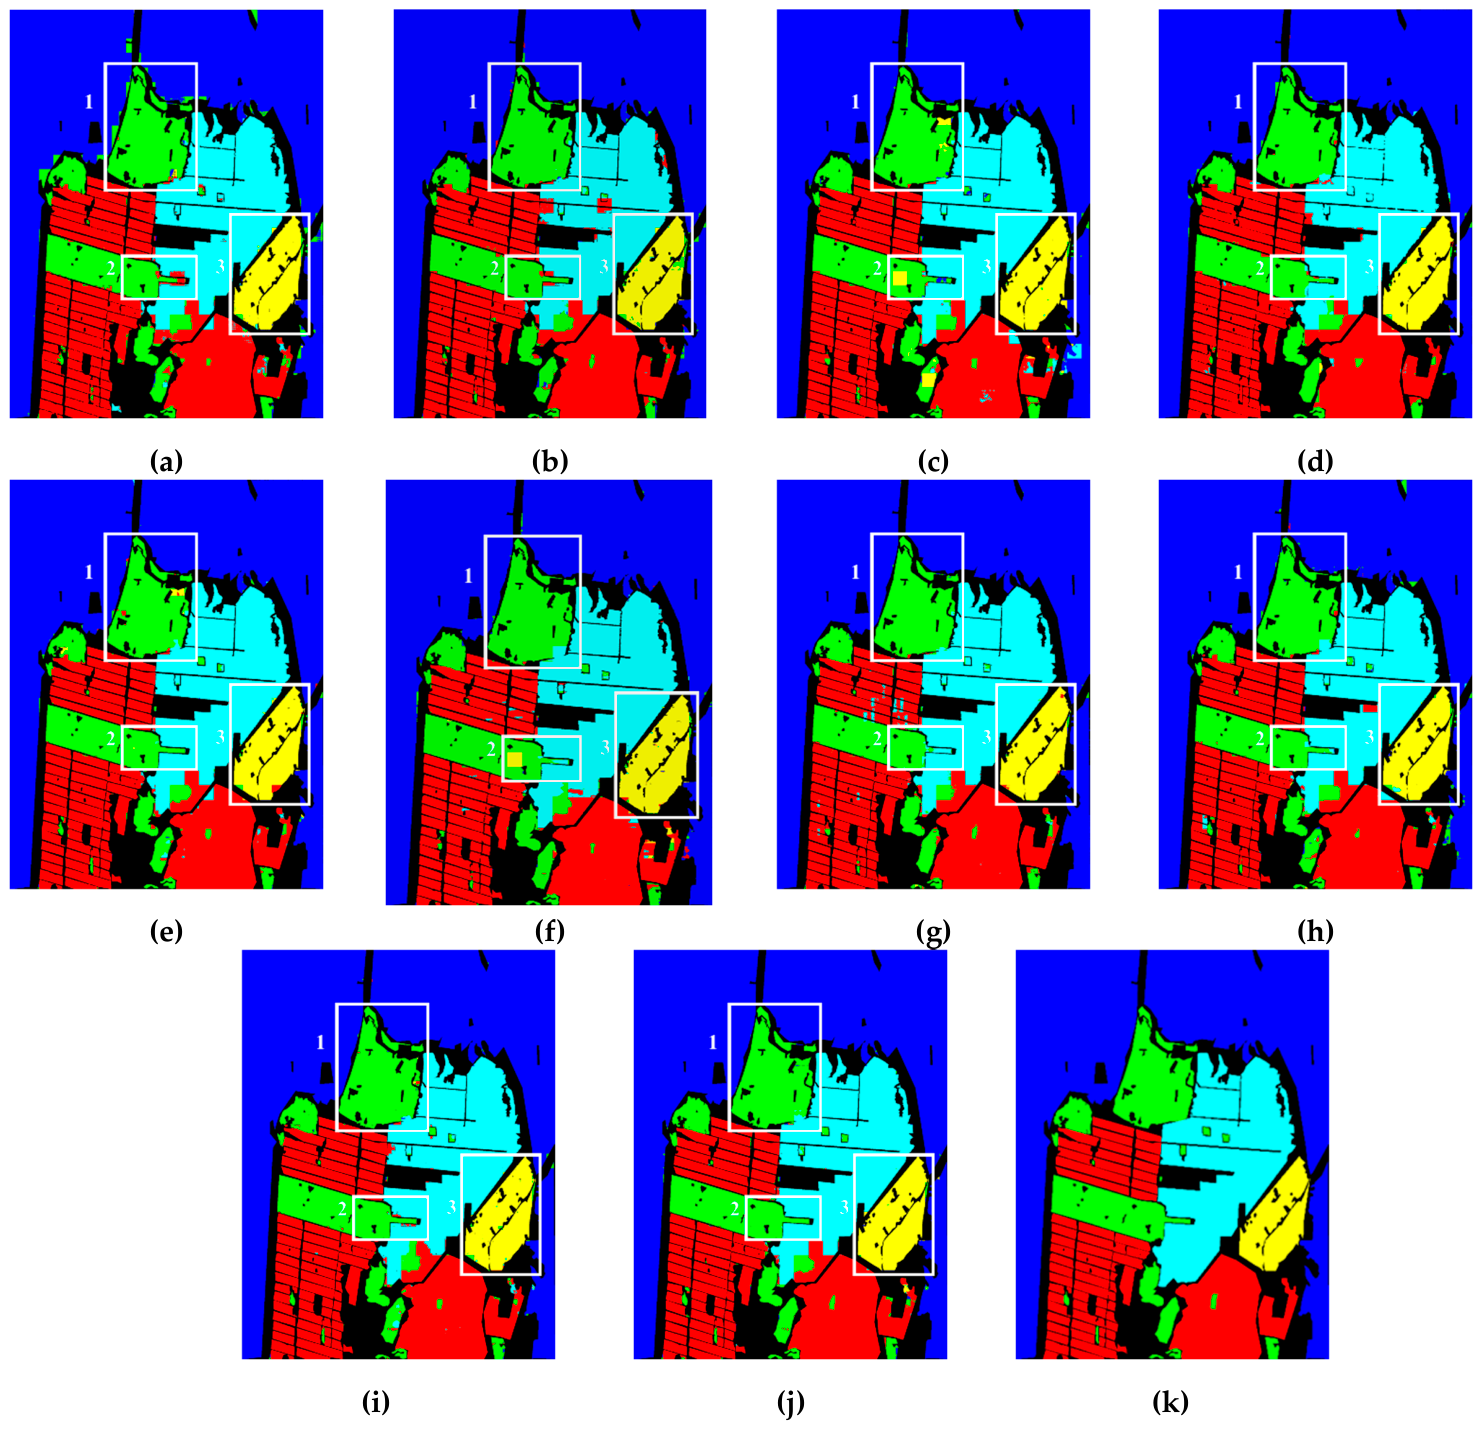

Table 1.
Summary of Experimental Datasets.
| Dataset | Platform | Band | Size | Classes | Train/Test |
|---|---|---|---|---|---|
| AIRSAR San Francisco | NASA/JPL AIRSAR | L | 1024/900 | 5 | 2,620/168 |
| AIRSAR Flevoland | NASA/JPL AIRSAR | L | 1024/750 | 15 | 1,404/87 |
| RADARSAT-2 San Francisco | RADARSAT-2 | C | 1380/1800 | 5 | 6,840/441 |
Note: The training numbers refer to augmented equivalent samples (original training patches × ~6.7 on-the-fly augmentation); test numbers are unaugmented original patches. The unaugmented patch counts are approximately: 392 + 168 (AIRSAR San Francisco), 203 + 87 (AIRSAR Flevoland), and 1,029 + 441 (RADARSAT-2 San Francisco), corresponding to a 7:3 train/test split.
Table 2.
Ablation Study Results on the AIRSAR San Francisco Dataset (%)
| Baseline | HRNet | CV | CGAE | mIoU | OA | MPA |
|---|---|---|---|---|---|---|
| ✓ | 89.34 | 96.50 | 93.51 | |||
| ✓ | 71.77 | 90.84 | 79.17 | |||
| ✓ | ✓ | 92.84 | 97.12 | 95.57 | ||
| ✓ | ✓ | ✓ | 94.44 | 98.38 | 95.88 | |
| ✓ | ✓ | ✓ | 93.59 | 98.07 | 96.56 | |
| ✓ | ✓ | ✓ | ✓ | 97.21 | 98.64 | 98.57 |
Table 3.
Parameter-fair Comparison on the AIRSAR San Francisco Dataset (%)
| Model | Input | Parameters | mIoU | OA |
|---|---|---|---|---|
| Real-valued HRU-Net | 9-channel real | ~1.47M | 92.84 | 97.12 |
| Real-valued HRU-Net (doubled) | 9-channel real | ~5.86M | 91.35 | 97.57 |
| Complex-valued HRU-Net | 6-channel complex | ~4.06M | 93.59 | 98.64 |
Table 4.
Internal Ablation of CV-CGAE Module on the AIRSAR San Francisco Dataset (%)
| Cross-Attention | CV-CBAM Enhancement | Gating Mechanism | mIoU | OA |
|---|---|---|---|---|
| ✓ | 93.59 | 98.07 | ||
| ✓ | ✓ | 96.02 | 98.50 | |
| ✓ | ✓ | 96.76 | 98.47 | |
| ✓ | ✓ | ✓ | 97.21 | 98.64 |
Table 5.
Semantic Segmentation Performance on the AIRSAR San Francisco Dataset (%)
| Class | FCN | DeepLabv3+ | TransUNet | SegFormer | DSNet | CGRSeg | VWFormer | L-CV-DeepLabv3+ | CV-Cap U-Net | Proposed |
|---|---|---|---|---|---|---|---|---|---|---|
| Dev Urban | 84.49 | 59.38 | 94.00 | 85.20 | 90.59 | 80.65 | 87.92 | 91.96 | 94.74 | 94.87 |
| LD Urban | 74.36 | 34.70 | 89.68 | 39.77 | 75.16 | 52.46 | 82.20 | 92.89 | 90.44 | 98.35 |
| HD Urban | 87.76 | 69.14 | 94.55 | 87.88 | 91.82 | 83.54 | 90.77 | 93.91 | 94.81 | 95.66 |
| Sea | 85.34 | 82.46 | 91.71 | 85.29 | 89.49 | 52.04 | 92.55 | 93.74 | 93.64 | 95.49 |
| Vegetation | 97.07 | 97.19 | 98.33 | 98.45 | 98.47 | 63.89 | 99.23 | 99.06 | 98.82 | 98.95 |
| mIoU | 84.96 | 71.84 | 92.84 | 80.55 | 89.38 | 69.77 | 91.01 | 94.17 | 95.41 | 97.21 |
| OA | 94.16 | 90.1 | 97.12 | 94.68 | 96.48 | 81.04 | 96.93 | 97.66 | 98.29 | 98.64 |
| MPA | 90.23 | 79.9 | 96.18 | 86.06 | 93.59 | 80.96 | 94.01 | 96.92 | 97.07 | 98.57 |
Table 6.
Semantic Segmentation Performance on the AIRSAR Flevoland Dataset (%).
| Class | FCN | DeepLabv3+ | TransUNet | SegFormer | DSNet | CGRSeg | VWFormer | L-CV-DeepLabv3+ | CV-Cap U-Net | Proposed |
|---|---|---|---|---|---|---|---|---|---|---|
| stem beans | 95 | 98.92 | 95.2 | 82.99 | 98.69 | 54.95 | 93.1 | 96.26 | 94.39 | 99.73 |
| peas | 88.72 | 84.56 | 59.25 | 85.14 | 96.73 | 82.11 | 94.95 | 96.27 | 96.97 | 96.23 |
| forest | 92.27 | 93.31 | 91.05 | 88.62 | 95.37 | 76.02 | 93.37 | 95.37 | 96.32 | 99.61 |
| lucerne | 92 | 79.46 | 70.62 | 95.86 | 89.29 | 5.69 | 93.9 | 95.8 | 97.99 | 96.12 |
| wheat1 | 85.73 | 88.34 | 83.3 | 93.53 | 84.35 | 76.31 | 92.64 | 98.15 | 97.83 | 96.3 |
| beet | 84.79 | 77.59 | 69.73 | 86.89 | 97.17 | 22.54 | 96.43 | 98.24 | 99.45 | 99.29 |
| potatoes | 95.49 | 97.02 | 92.38 | 90.68 | 98.33 | 71.88 | 93.61 | 99.13 | 97.37 | 99.04 |
| bare soil | 79.81 | 83.32 | 63.22 | 84.86 | 99.32 | 12.84 | 43.51 | 98.79 | 99.93 | 99.93 |
| grass | 90.42 | 60.03 | 37.76 | 84.26 | 86.54 | 0 | 90.88 | 92.23 | 99.03 | 98.26 |
| rapeseed | 81.77 | 44.72 | 72.2 | 53.7 | 76.92 | 32.02 | 81.02 | 93.71 | 93 | 94.65 |
| barley | 93.93 | 98.81 | 88.68 | 95.45 | 95.66 | 43.33 | 98.49 | 99.6 | 98.42 | 99.88 |
| wheat2 | 85.13 | 56.26 | 69.55 | 67.41 | 85.56 | 27.6 | 85.27 | 89.59 | 92.65 | 98.92 |
| wheat3 | 95.83 | 92.38 | 91.8 | 80.81 | 96.85 | 18.07 | 96.88 | 98.12 | 98.67 | 99.29 |
| water | 95.36 | 93.05 | 79.63 | 89.75 | 94.33 | 6.04 | 64.92 | 97.16 | 97.94 | 97.84 |
| buildings | 68.94 | 74.82 | 35.95 | 15.65 | 77.16 | 25.6 | 80.8 | 74.83 | 97.95 | 97.01 |
| mIoU | 89.04 | 82.63 | 74.9 | 80.87 | 91.99 | 38.91 | 87.44 | 95.19 | 97.37 | 98.25 |
| OA | 98.75 | 97.81 | 97.23 | 97.36 | 98.95 | 67.39 | 98.5 | 99.53 | 99.67 | 99.76 |
| MPA | 94.54 | 88.37 | 83.93 | 87.89 | 95.84 | 57.38 | 94.37 | 98 | 98.61 | 98.94 |
Table 7.
Segmentation performance of RADARSAT-2 San Francisco Dataset (%)
| Class | FCN | DeepLabv3+ | TransUNet | SegFormer | DSNet | CGRSeg | VWFormer | L-CV-DeepLabv3+ | CV-Cap U-Net | Proposed |
|---|---|---|---|---|---|---|---|---|---|---|
| Dev Urban | 94.28 | 94.35 | 84.72 | 94.34 | 92.78 | 88.85 | 96.45 | 96.06 | 97.37 | 97.89 |
| LD Urban | 90.56 | 90.91 | 93.15 | 90.04 | 93.67 | 93.12 | 92.79 | 93.85 | 95.1 | 95.19 |
| HD Urban | 88.87 | 87.91 | 90.2 | 87.67 | 91.3 | 91.1 | 90.13 | 90.35 | 91.41 | 92.28 |
| Sea | 97.8 | 99.17 | 99.03 | 99.05 | 99.51 | 99.13 | 99.6 | 99.13 | 99.82 | 99.65 |
| Vegetation | 83.24 | 89.19 | 87.54 | 87.01 | 90.83 | 87.99 | 91.42 | 89.91 | 93.03 | 93.33 |
| mIoU | 91.84 | 93.28 | 91.99 | 91.77 | 94.28 | 92.58 | 94.6 | 94.8 | 96.11 | 96.38 |
| OA | 96.59 | 97.36 | 97.36 | 96.55 | 97.94 | 97.35 | 97.84 | 97.99 | 98.55 | 98.61 |
| MPA | 95.96 | 96.07 | 96.52 | 95.69 | 97.03 | 96.31 | 97.03 | 97.2 | 97.83 | 98.11 |
Table 8.
Phase Randomization Experiment Results on the AIRSAR San Francisco Dataset (%)
| Condition | HD Urban | Dev Urban | LD Urban | mIoU | OA | MPA |
|---|---|---|---|---|---|---|
| Normal complex-valued | 95.66 | 94.87 | 98.35 | 97.21 | 98.64 | 98.57 |
| Phase randomized | 87.31 | 75.91 | 49.86 | 80.87 | 93.75 | 93.61 |
| Δ(Normal→Random) ↓ | 8.35 | 18.96 | 48.49 | 16.34 | 4.89 | 4.96 |
Table 9.
BF1-Score Comparison on Three Datasets (%)
| Method | AIRSAR San Francisco |
AIRSAR Flevoland |
RADARSAT-2 San Francisco |
|---|---|---|---|
| FCN | 74.9 | 79.6 | 80.34 |
| DeepLabv3+ | 60.81 | 79.65 | 84.3 |
| TransUNet | 88.05 | 70.48 | 86.33 |
| SegFormer | 74.51 | 82.9 | 86.13 |
| DSNet | 82.3 | 89.65 | 88.64 |
| VWFormer | 85.55 | 87.23 | 89.24 |
| CGRSeg | 62.43 | 36.06 | 86.7 |
| L-CV- DeepLabv3+ | 86.96 | 91.49 | 86.87 |
| CV-Capsule U-Net | 85.89 | 93.76 | 90.63 |
| CV HRU-Net | 84.07 | 93.68 | 88.67 |
| Proposed | 91.88 | 96.37 | 91.71 |
Table 10.
Model Complexity and Inference Efficiency on the AIRSAR San Francisco Dataset
| Networks | Total Parameters | FLOPs(G) | FPS |
|---|---|---|---|
| DeepLabv3+ | 3,052,742 | 0.86 | 27.03 |
| FCN | 69,755,026 | 0.5 | 45.85 |
| TransUNet | 105,144,934 | 2.02 | 38.12 |
| Segformer | 3,725,094 | 0.11 | 100.67 |
| DSNet | 10175122 | 0.82 | 69.77 |
| CGRSeg | 9348225 | 0.06 | 58.01 |
| VWFormer | 94565256 | 3.14 | 36.84 |
| CV-Capsule U-Net | 3,419,100 | 2.69 | 45.51 |
| L-CV-DeepLabv3+ | 8,511,316 | 3.87 | 11.57 |
| Proposed | 4,058,116 | 4.96 | 23.1 |
Disclaimer/Publisher’s Note: The statements, opinions and data contained in all publications are solely those of the individual author(s) and contributor(s) and not of MDPI and/or the editor(s). MDPI and/or the editor(s) disclaim responsibility for any injury to people or property resulting from any ideas, methods, instructions or products referred to in the content. |
© 2026 by the authors. Licensee MDPI, Basel, Switzerland. This article is an open access article distributed under the terms and conditions of the Creative Commons Attribution (CC BY) license (http://creativecommons.org/licenses/by/4.0/).
Copyright: This open access article is published under a Creative Commons CC BY 4.0 license, which permit the free download, distribution, and reuse, provided that the author and preprint are cited in any reuse.


