

Submitted:
26 June 2026
Posted:
29 June 2026
You are already at the latest version
Abstract
In the digital transformation of the petroleum industry, the massive multi-source heterogeneous tabular data scattered across systems poses challenges to efficient management and intelligent applications due to its unstructured nature and complex inter-table relationships. Existing table retrieval methods mainly rely on keyword matching or inter-table structure analysis to handle explicit associations, but they show limited adaptability to queries involving implicit associations, resulting in constrained retrieval accuracy and result coverage in complex real-world scenarios. To address these challenges, this paper proposes an implicit association reasoning table retrieval method, Relatab, designed for unstructured tabular data. By jointly modeling query-table relevance and latent inter-table associations, it automatically identifies tables that are indirectly related to the query but crucial to the answer. Specifically, the method first employs semantic matching techniques to compute the relevance between the query and candidate tables, then mines implicit inter-table relationships through semantic similarity of table content and contextual connections, and finally fuses the two scores to optimize retrieval ranking, generating a set of tables that cover key information. Experimental results demonstrate that on the Spider, Bird, and CementingTables datasets, the Top-2 recall rates of the proposed method are 79.21%, 61.26%, and 77.88%, respectively, outperforming the baseline model DTR by 1.74, 2.33, and 1.85 percentage points. This validates the method’s ability to improve retrieval coverage in complex query scenarios and its applicability in the petroleum domain.
Keywords:
digital transformationl
; table retrieval
; natural language processing (NLP)
; unstructured data
; implicit association reasoning
1. Introduction
Against the backdrop of digital transformation in the petroleum industry, the complexity of data storage and retrieval is increasing day by day. As a prevalent form of data representation, tables are widely utilized across various domains. Data within the petroleum industry comprises not only structured database tables but also a vast quantity of unstructured tables embedded within Word or PDF documents. These unstructured tables typically lack explicit structured connections or annotations, rendering it difficult for traditional retrieval methods to fully uncover the latent relationships between tables. Consequently, how to efficiently retrieve such unstructured tabular data has emerged as a critical issue demanding attention.
Table Retrieval is a crucial branch of Natural Language Processing (NLP), aimed at rapidly locating table information relevant to user queries within large-scale tabular data to accurately answer given questions [1]. Research in this field primarily focuses on three directions.
First, traditional table retrieval models [2,3,4] mainly rely on keyword matching and statistical analysis, achieving retrieval through the direct correspondence of table headers, column names, or numerical values with the query. However, these methods struggle to capture the deep semantic correlations between natural language queries and structured or unstructured tables [9] and are sensitive to noise [8].
Second, methods based on pre-trained language models [11,12,13] leverage the semantic understanding capabilities of these models to significantly enhance matching accuracy between structured data and natural language queries. Nevertheless, they still depend on table structural information and find it difficult to capture implicit associations within unstructured data. Furthermore, existing studies mostly focus on single-table or simple multi-table scenarios, with limited ability to model complex cross-table relationships, making it difficult to meet the requirements of complex multi-table queries.
Third, table matching-based retrieval methods [20,21,22] discover relevant tables by calculating similarity scores between input and candidate tables, making them suitable for multi-table associative queries. While effective for structured or semi-structured data by relying on explicit information such as column headers, entities, and inter-column relationships, their applicability is limited in unstructured data that lacks clear structural features.
How to efficiently mine implicit associations between tables and achieve effective retrieval of unstructured multi-table information has become a noteworthy issue. Figure 1 illustrates an example of unstructured multi-table retrieval involving implicit associations; the model must capture the implicit associative information within the data to obtain a set of tables containing the necessary information.
To further address the aforementioned challenges, this paper proposes a table retrieval method based on Implicit Association Inference. By integrating query-table relevance and inter-table correlation, this method solves the difficulty of handling implicit relationships in unstructured tabular data, identifying tables that are indirectly related to the query but hold significant value for answering it.
Specifically, the process is as follows: First, the query-table similarity is calculated based on semantic matching. Subsequently, inter-table correlation is computed by analyzing the semantic similarity or contextual connections of table contents to identify other tables implicitly associated with the candidate tables. Finally, the two similarity scores are combined to optimize the final table ranking and determine the result set.
Experimental results demonstrate that on the Spider [24], Bird [25], and CementingTables datasets, the Top-2 recall rates of the proposed method are 79.21%, 61.26%, and 77.88%, respectively, outperforming the baseline model DTR by 1.74, 2.33, and 1.85 percentage points. This validates the method’s ability to improve retrieval coverage in complex query scenarios and its applicability in the petroleum domain.
2. Related Work
2.1. Table Retrieval Models Based on Traditional Methods
In early research, Cafarella et al. [2,3] proposed models such as SimpleRank and SCPRank, which utilize web search engines and keyword frequency (e.g., TF-IDF) to extract the top-k tables from web pages. These models improve retrieval accuracy through attribute co-occurrence or re-ranking mechanisms. The OCTOPUS system adopted a similar approach; however, due to insufficient semantic understanding, such methods fail to capture the deep semantic relationships between queries and tables. Additionally, Venetis et al. [4] enhanced the model’s understanding of queries by extracting class labels and relational database metadata to attach to table columns, but this approach relies heavily on high manual annotation costs. Zhang et al. [5] utilized word or graph embedding techniques to calculate the similarity between tables and queries, while statistical ranking methods like BM25 [6] optimized retrieval results through field weighting. Trabelsi [7] employed Bayesian networks to construct probabilistic models, and Chen [8] evaluated the relevance of tables to queries using semi-structured document retrieval techniques based on field relevance or language models. However, these methods are relatively sensitive to data noise. In unstructured data, they are easily susceptible to interference from irrelevant columns or redundant values, leading to a decrease in retrieval accuracy.
2.2. Table Retrieval Methods Based on Pre-Trained Language Models
With the widespread application of Pre-trained Language Models (PLMs) in the field of Natural Language Processing, table retrieval methods based on such models have made significant progress in semantic understanding. Models such as TaBERT [11] and RoBERTa [12] serialize table column names, row values, and user queries into linear inputs. They generate embedding vectors through attention mechanisms and pooling operations, ranking results based on cosine similarity. However, these methods ignore the two-dimensional structural information of tables (such as row-column relationships), resulting in incomplete semantic representation of complex tables.
To address the unique structural issues of tables, researchers have developed pre-trained models specifically designed for tabular data. Tapas [13] extends BERT to adapt to sparse inputs and optimizes the matching between queries and tables through a cell selection prediction task. However, it focuses primarily on single-table queries and struggles to capture cross-table implicit associations, limiting its performance in multi-table scenarios. TUTA [14] parses tables into a hierarchical tree structure and learns structure-aware representations through tree node masking tasks, but it is highly dependent on structured data and shows insufficient representation capability for unstructured or irregular tables. TABBIE [15] combines Bidirectional GRU (Bi-GRU) [16] and Graph Neural Networks (GNN) to capture cell context and cross-table structural relationships, improving implicit association modeling. Nevertheless, its complex architecture significantly increases computational costs, making it difficult to apply to large-scale datasets.
Joint encoding methods enhance the semantic alignment between queries and tables through multimodal interaction. TURL [17] extends table understanding to knowledge base interactions through relevance calculation, improving semantic association capabilities; however, its reliance on external knowledge bases limits its applicability in unstructured data scenarios that lack such support. SATR [18] fuses table content, structure, and type features to jointly optimize retrieval and question-answering tasks, but its ability to reason with fused features for complex multi-table queries is limited, making it difficult to handle implicit associations. Table-LLaVA [19], based on multimodal Large Language Models, jointly encodes table images and queries, optimizing multi-table retrieval through two-stage training. While it performs excellently in various table tasks, its high training and inference costs limit its deployment in resource-constrained environments.
2.3. Table Retrieval Based on Table Matching
Retrieval methods based on table matching have been widely applied to handle multi-table association scenarios. Ahmadov et al. [20] utilized table elements (such as entities and headers) as keywords for querying, generating more complete multi-table associations through table matching and candidate set merging. However, due to the reliance on explicit keywords, this approach struggles to capture deep semantic relationships within unstructured data. Lehmberg et al. [21] proposed a search join engine that extends input tables through column header matching, filtering and scoring candidate tables that share column headers. Nevertheless, its inability to infer implicit inter-table relationships limits its applicability in unstructured scenarios. Sarma et al. [22] optimized multi-table associations by extending the rows (entity complementation) or columns (schema complementation) of seed tables, calculating similarity based on entity relevance and attribute gain. However, this method is sensitive to noise in unstructured data, leading to a decline in retrieval accuracy. Peter et al. [23] adopted an innovative re-ranking method that calculates query-table relevance and inter-table connectivity using Mixed Integer Programming (MIP) to infer necessary associations. Yet, it relies on structured connection information, limiting its effectiveness in unstructured data lacking explicit fields.
To address the aforementioned challenges, this paper proposes the Relatab method. By jointly modeling query-table relevance and implicit inter-table associations, Relatab automatically mines latent relationships within unstructured data, thereby enhancing retrieval precision and result coverage. This approach provides a novel solution for table retrieval in complex scenarios.
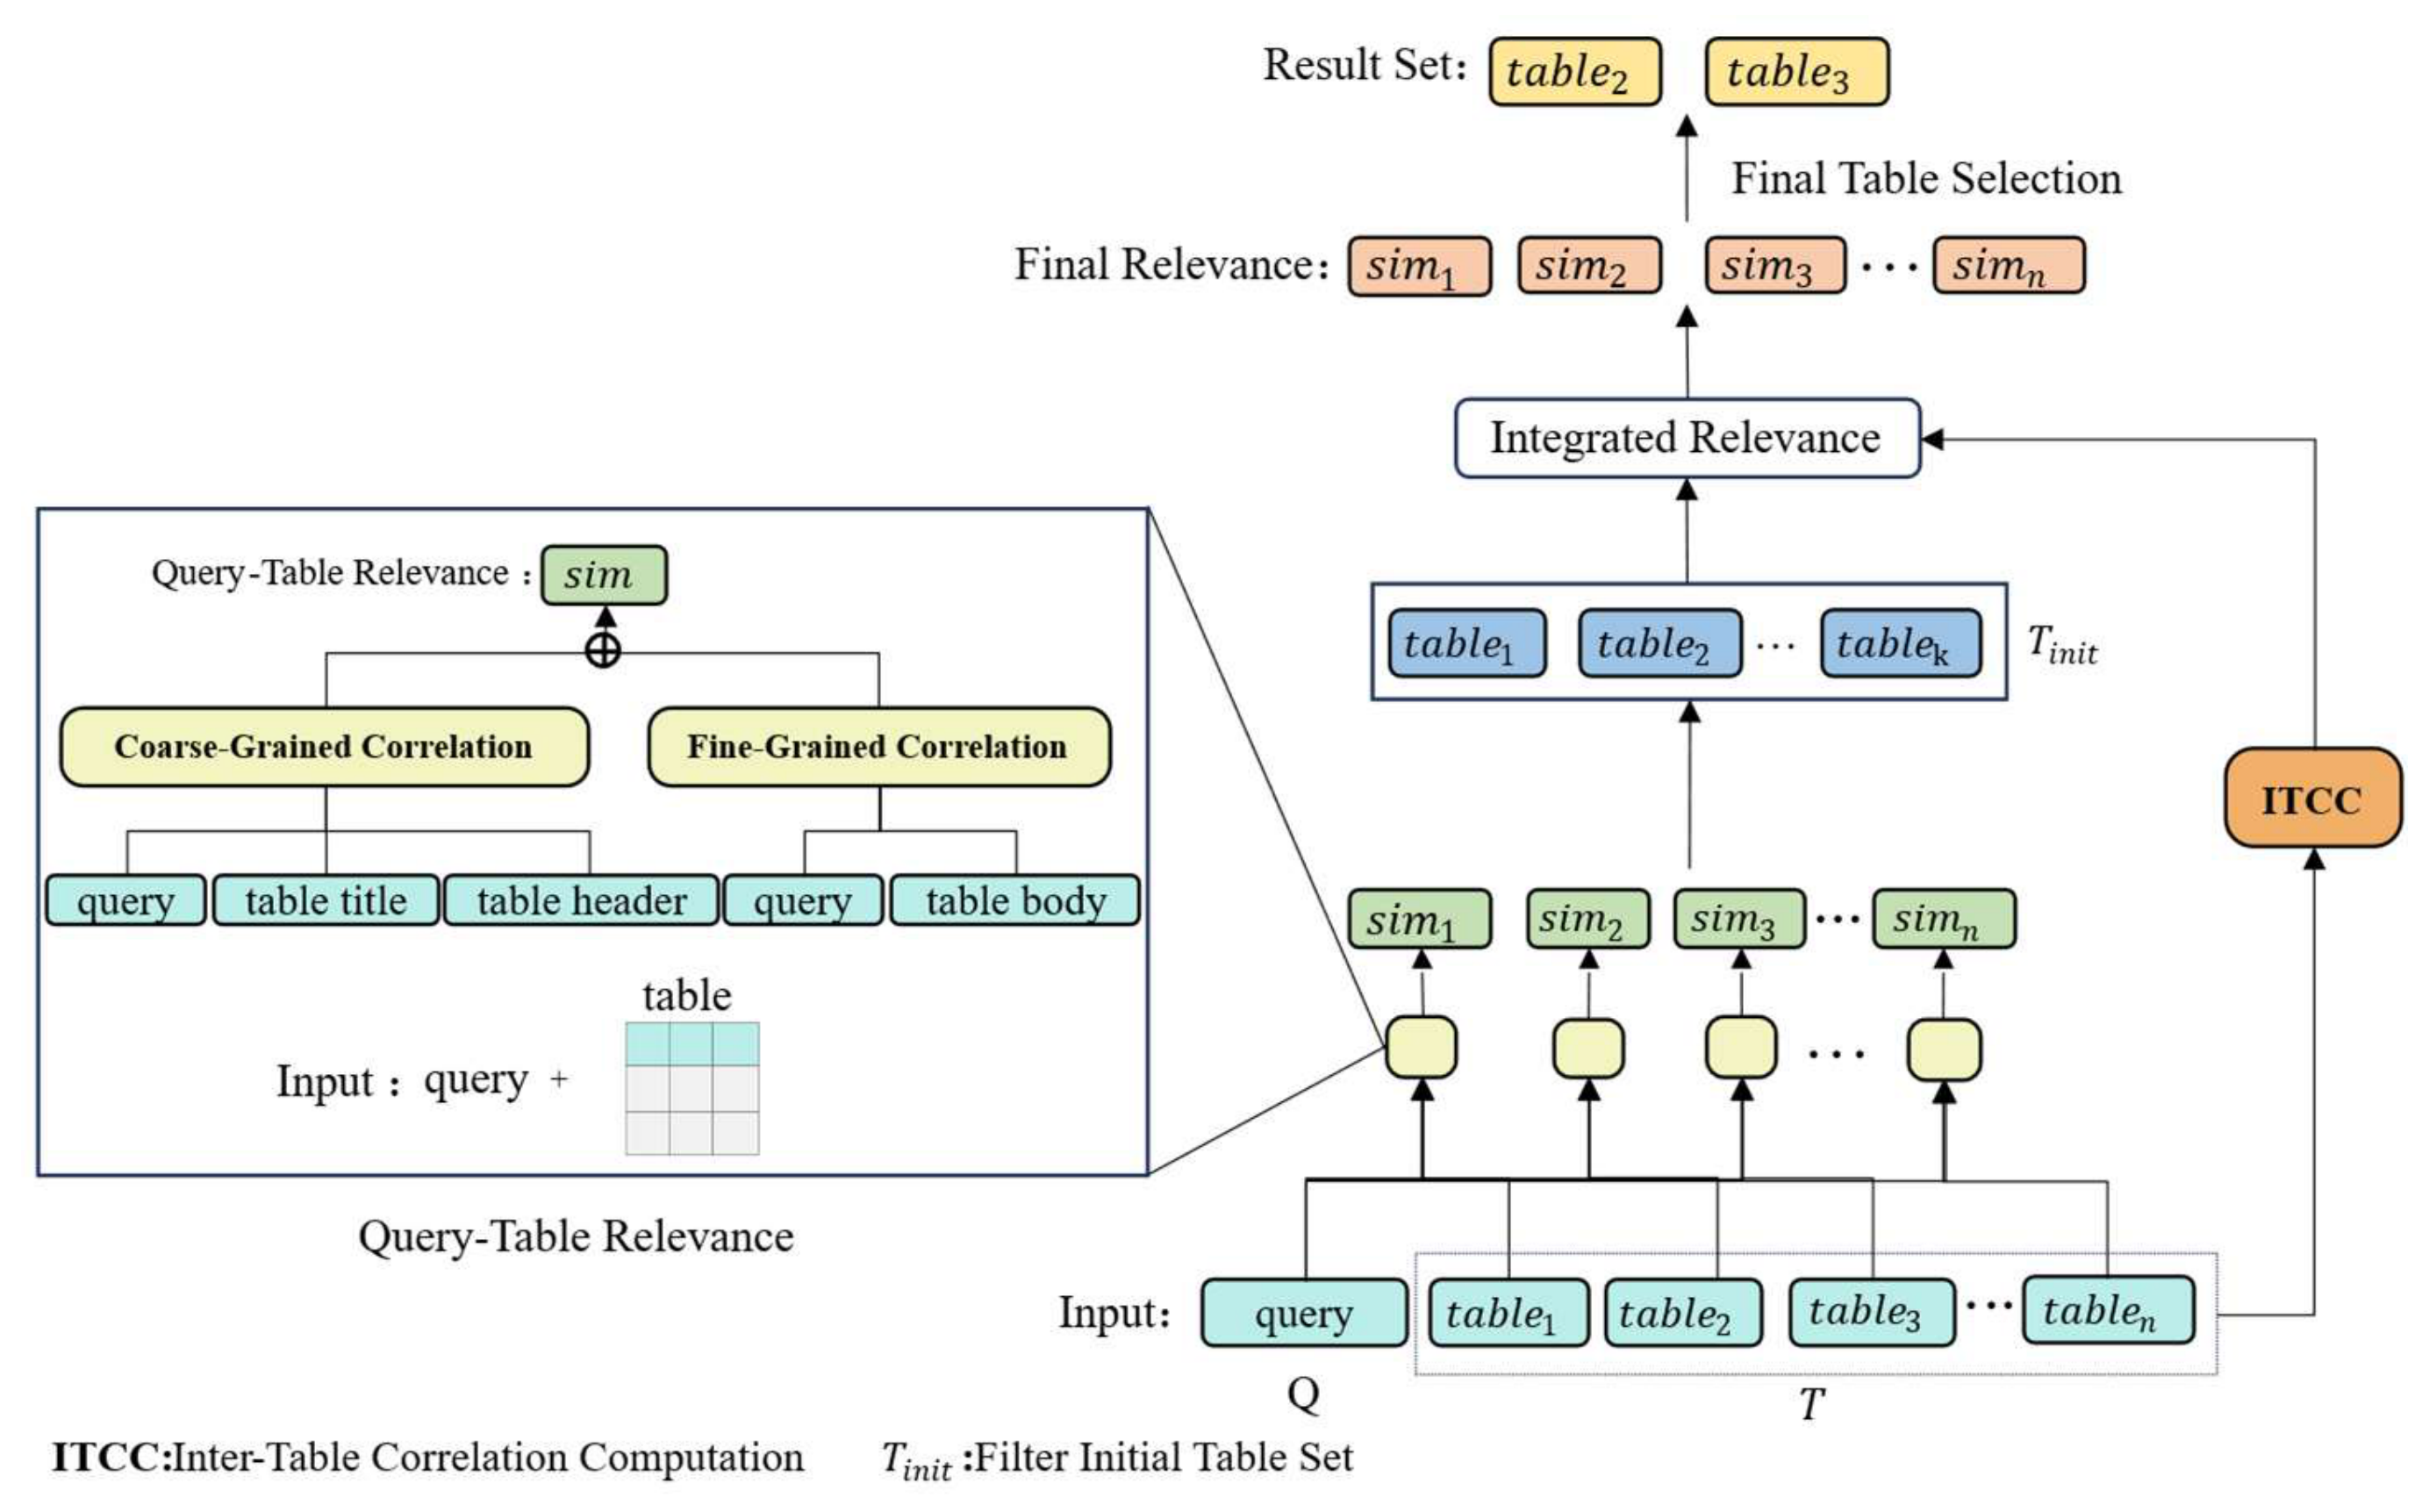
Figure 2.
Model architecture diagram.
3. Problem Formulation
This section may be divided by subheadings. It should provide a concise and precise description of the experimental results, their interpretation, as well as the experimental conclusions that can be drawn.
The core task of table retrieval is to select a set of tables from a corpus containing multiple tables, given a query , that are relevant to the query and capable of providing the necessary information to answer it. Traditional table retrieval methods typically assume that the answer to a query resides within a single table and rely on explicit matching to calculate the direct relevance between the query and the table. However, in real-world applications, especially in unstructured data scenarios, queries often necessitate the integration of content from multiple tables to derive a complete answer.
To address this challenge, this paper extends the task objective to unstructured multi-table retrieval. Given a query and a universal set of tables , the goal is to identify the set of tables necessary to answer query . Formally, the objective can be formulated as:
where represents the set of tables required for the complete answer to query , and denotes the universal set of all tables.
4. Methodology
To achieve efficient retrieval of unstructured multi-table information, this paper proposes a table retrieval method based on Implicit Association Inference. By integrating query-table relevance and inter-table correlation, this method addresses the challenge of implicit relationships in unstructured tabular data, identifying tables that are indirectly related to the query but hold significant value for answering it.
Specifically, the process is as follows: First, query-table similarity is calculated based on semantic matching. Subsequently, inter-table correlation is computed by analyzing the semantic similarity or contextual connections of table contents to identify other tables implicitly associated with the candidate tables. Finally, the two similarity scores are combined to optimize the final table ranking and determine the result set. The structure of this method is illustrated in Figure 2, which presents the overall framework of the retrieval model proposed in this paper.
4.1. Query-Table Relevance
In table retrieval tasks, the calculation of query-table relevance is a crucial step for evaluating the degree of matching between the two. This section proposes a query-table matching framework based on a dual-level matching mechanism (Table-Level and Value-Level) to achieve semantic matching between the query and the table. The following subsections detail the table-level relevance calculation, the value-level relevance calculation, and the comprehensive evaluation method of the two.
4.1.1. Table-Level Relevance Calculation
Table-level relevance calculation aims to rapidly assess the overall relevance between a query and a table , thereby filtering out a set of candidate tables. This method combines the semantic matching of table captions and column names to evaluate the global topical relevance of the table. A schematic diagram of table-level relevance is shown in Figure 3.
Table Title Matching: As the core identifier reflecting the theme of a table, the table title is directly used to measure the overall semantic similarity between the query and the table. By utilizing the SentenceBERT model, the query and the table title are transformed into embedding vectors and , respectively. The cosine similarity between them is then calculated as the title matching score . The calculation formula is as follows:
where denotes the cosine similarity function. SentenceBERT generates sentence embeddings with strong semantic associations; compared to traditional word embeddings (such as Word2Vec), it is better equipped to capture global semantic relationships between complex queries and table titles. All subsequent embedding calculations in this work are generated using the SentenceBERT model.
Column Name Matching: Column names reflect data dimensions and thematic information; thus, we evaluate the semantic relevance between the query and the table’s column names. Let the set of column names for a table be , and the semantic embedding vector for each column name be . Since the contribution of each column varies, an adaptive weighting scheme is required to adjust the influence of different columns. Here, the Entropy Weight Method (EWM) is employed to assign weights.
The EWM assigns weights by evaluating the entropy value of each column name (based on the distribution of generated embedding vectors or vocabulary frequency). Column names with lower information entropy (i.e., those with uneven distribution and higher distinctiveness) are assigned higher weights to reflect their importance in the table’s semantics. Finally, weight normalization ensures that .Compared to other weight allocation methods, the entropy method is computationally efficient and well-suited for the global matching requirements of table-level calculations involving limited features. The final column name matching score is calculated via weighted cosine similarity:
where denotes the total number of columns, and is dynamically determined by the entropy method.
Comprehensive Matching Calculation: To comprehensively evaluate the table-level relevance between the query and the table, this paper performs a weighted fusion of the table title matching score and the column name matching score to obtain the final table-level relevance score:
where is a hyperparameter used to balance the importance of table title matching and column name matching in the table-level relevance calculation.
4.1.2. Value-Level Relevance Calculation
Value-level relevance calculation serves as a vital component of the multi-table retrieval method based on Implicit Association Inference. It aims to capture deeper-level associations by analyzing the degree of semantic matching between the query and the values within table columns. This process compensates for the fine-grained information that may be overlooked by table-level relevance (which relies primarily on table titles and column names). A schematic diagram illustrating the value-level relevance calculation is presented in Figure 4.
In the calculation of value-level relevance, this paper adopts a column-oriented representation method, where represents the set of values in the -th column of table , and denotes the -th value within the -th column. Utilizing the SentenceBERT model, the query and are vectorized to obtain and , respectively. The cosine similarity is then calculated.
By analyzing the semantic similarity between each column of table and the query , the column value matching score is derived. To precisely assign weights to column values, the CRITIC method (Criteria Importance Through Intercriteria Correlation) is employed. The CRITIC method dynamically allocates weights based on the contrast intensity (standard deviation) and conflict (correlation between columns) of the similarities. The column value matching score is calculated using weighted cosine similarity:
This score captures the local semantic matching relationship between the query and column values, ensuring that the value-level analysis focuses on specific content.
To comprehensively evaluate the value-level relevance between the query and the table, this paper further integrates the column value matching scores to calculate the table’s overall value-level relevance score . The comprehensive score is obtained through the weighted fusion of individual column scores:
where denotes the number of table columns, and is the weight of the -th column, which is dynamically allocated by the Entropy Weight Method (EWM). This comprehensive score reflects the overall matching degree between the query and the table content.
4.1.3. Comprehensive Relevance Score
To comprehensively evaluate the overall relevance between the query and the table , this section integrates the table-level relevance score and the value-level relevance score to formulate the final table relevance score . This approach balances the table’s global topical matching (table-level) with its local content matching (value-level), providing a reliable basis for the screening and ranking of candidate tables. The table relevance score is calculated via the weighted fusion of the table-level score and the value-level score as follows:
where is a weighting parameter used to balance the importance of table-level relevance and value-level relevance.
Through the aforementioned weighted combination, is able to fully consider the matching performance of the table at different levels, thereby precisely identifying the target tables most relevant to the query from the candidate tables.
In summary, the comprehensive relevance score improves the precision and coverage of table retrieval in unstructured data through multi-level semantic matching, laying a solid foundation for the subsequent screening of target tables.
4.2. Inter-Table Correlation
In table retrieval tasks, complex queries often necessitate the integration of content from multiple tables to yield comprehensive answers. Consequently, capturing the latent associations between tables is central to achieving this objective. Within the context of unstructured data in the petroleum industry, inter-table relationships may be explicit (e.g., foreign keys) or implicit (e.g., content sharing or structural consistency). These implicit relationships are manifested through shared column names, data schemas, or semantic consistency.
This paper proposes a modeling method based on inter-table correlation, specifically designed to mine implicit associations within unstructured data. This section unfolds in two aspects: first, Inter-Table Similarity Calculation, which evaluates the similarity of column values between two tables; and second, Chain Relationship Modeling, which captures implicit relationships across multiple tables by constructing multi-hop paths.
4.2.1. Inter-Table Similarity Calculation
Inter-table similarity calculation is a pivotal step in assessing the correlation between two tables and serves as a prerequisite for measuring implicit inter-table associations. This section identifies inter-table associations by modeling the semantic consistency of column names and column contents between tables.
Let the sets of column names for Table A and Table B be and , respectively. Here, and denote the column names of the -th column in Table A and the -th column in Table B. Column name similarity measures the semantic consistency of the column names, which typically reflect the primary informational content of the table. Using the SentenceBERT model, the embedding vectors and corresponding to column names and are generated. The column name similarity is defined as the cosine similarity between the vectors and .
Column content similarity measures the semantic consistency between the contents (value sets) of two columns. Assuming the contents of columns and are value sets and , which are transformed into corresponding embedding vectors and , the column content similarity is defined as:
where and are the average embedding vectors of the value sets (obtained by performing Mean Pooling on all value embeddings).
By integrating column name similarity and column content similarity, the final similarity for a column pair, denoted as , is defined as:
where is a hyperparameter used to balance the weights of column name similarity and column content similarity. The calculation of comprehensive inter-column similarity is illustrated in Figure 5.
The overall similarity between Table A and Table B is defined as the maximum value among all column similarities. This approach is designed to highlight the strongest column association between the two tables. The calculation formula is:
By employing the above method, inter-table similarity quantifies the overall correlation between tables from the dual dimensions of column names and column contents, thereby enhancing the capability to capture implicit complementary relationships within unstructured data.
4.2.2. Chain Relationship Modeling
Section 4.2.1 described the calculation method for the inter-table correlation between two tables. However, relying solely on direct inter-table correlation cannot fully capture complex table relationships. For instance, if Table is associated with Table , and is further associated with Table , is there an implicit association between and ? Such indirect, cross-table association relationships are difficult to reveal through single pairwise analysis. To this end, Chain Relationship Modeling is introduced to mine implicit connections between tables through multi-hop association paths, constructing a broader representation of inter-table relationships, which helps improve the coverage and precision of multi-table retrieval.
A chain is defined as a path of tables connected by implicit associations. A single-hop chain indicates that and have an implicit association, while a multi-hop chain indicates an association between and via intermediate tables. The similarity of a chain is calculated by the accumulation of similarity scores for each hop, while introducing a decay factor to control the influence of indirect relationships, causing them to weaken gradually. The similarity of a single-hop chain is defined by Equation (3-10)[See Note]. The similarity of a -hop chain is defined as:
where is the number of hops in the chain, and and are two adjacent tables in the chain; denotes the similarity between adjacent tables.
To avoid introducing noise and improve computational efficiency, this paper imposes the following constraints on the calculation of multi-hop chains: First, a maximum hop limit is set to control the range of chain propagation, ensuring computational effectiveness. Second, a similarity threshold is established, retaining only chain paths with similarity scores greater than , thereby pruning low-quality chains. Furthermore, when multiple chains may connect and via different paths, the chain with the highest similarity is selected as the final score:
To efficiently calculate the relevance of multi-hop chains, this study introduces an inter-table similarity matrix . The element of matrix represents the similarity between table and . Leveraging the transitive property of matrices, the similarity of multi-hop paths can be computed rapidly. A single-hop chain corresponds to the similarity matrix itself, while a two-hop chain can be derived through the transmission of matrix . In general, the correlation of a -hop path can be expressed as:
where represents the index of the intermediate table, and denotes the total number of tables. Finally, the similarity of multi-hop chains is calculated using the following formula:
This method avoids the explicit enumeration of all chains; instead, it models the similarity of all possible chains through efficient matrix operations. Combined with the maximum similarity selection operation, it retains the path with the highest similarity score among multi-hop chains.
Although long chains can capture deeper complementary information, they may introduce noise. Therefore, by limiting the maximum number of hops and setting the similarity threshold , the precision and efficiency of chain relationship modeling are ensured.
4.3. Comprehensive Table Scoring and Target Table Selection
To achieve effective screening of candidate tables, this paper proposes a target table selection method based on comprehensive scoring. This method balances the weights of direct query-table relevance and inter-table complementary relevance to comprehensively evaluate the overall matching degree between candidate tables and the query, thereby providing robust support for the subsequent selection of target tables.
4.3.1. Comprehensive Score Calculation
In table retrieval tasks, obtaining a set of target tables capable of completely answering a user query requires the integrated consideration of both Query-Table Relevance and Inter-Table Correlation. Direct query-table relevance reflects the degree of semantic matching between the table and the query, whereas inter-table correlation is utilized to identify complementary tables that are closely associated with the tables directly relevant to the query. By fusing these two types of relevance scores, the proposed method can comprehensively evaluate the composite relevance of candidate tables, ultimately selecting a table set that can both directly answer the query and provide supplementary information.
The calculation of the comprehensive score is divided into two steps: first, determining the initial table set ; second, calculating the direct relevance and complementarity scores for the candidate tables. The initial table set is composed of tables that have high direct relevance to the query , filtered via the query-table relevance score. Specifically, a table must satisfy the following condition:
where is the threshold for direct query relevance.
For each candidate table (representing a specific table in the candidate set ), its direct relevance to the query, , is calculated first. This score reflects whether the table directly answers the query content. The direct query relevance combines both table-level and value-level similarity scores (refer to Sections 3.1.2 and 3.1.3).
After completing the calculation of direct query relevance, the complementarity of with respect to the initial table set is evaluated. The complementarity score is measured via the inter-table correlation , where . Specifically, the complementarity score for is defined as:
Using the maximum value to calculate the complementarity score between the candidate table and the most relevant table in allows the model to focus on the strongest association path between and the query, thereby avoiding the introduction of noise from weak associations. The inter-table correlation is defined based on Sections 3.2.1 and 3.2.2, reflecting the strength of implicit associations between the two tables.
Finally, by integrating the direct relevance score and the complementarity score, the final comprehensive relevance score for the candidate table is calculated as:
where is a hyperparameter used to balance the importance of direct query relevance and complementary relationships.
Through the above process, the comprehensive score fully reflects the candidate table’s ability to directly answer the query as well as its potential to provide additional information through inter-table complementarity, laying a solid foundation for the subsequent ranking and screening of target tables.
4.3.2. Target Table Selection
Upon completion of the calculation of the comprehensive relevance score , a straightforward threshold strategy can be adopted for the selection of target tables. Specifically, only tables with scores exceeding a preset threshold are retained to form the target table set . The selection rule is defined as:
where represents the minimum threshold for the comprehensive score, which can be configured according to the specific requirements of the task. The introduction of this threshold effectively filters out tables with low relevance to the query , thereby ensuring the quality of the target table set.
5. Experimental Design and Result Analysis
5.1. Evaluation Metrics
To comprehensively evaluate the performance of table retrieval, this paper adopts Precision, Recall, F1-score, and Normalized Discounted Cumulative Gain (NDCG) as standard evaluation metrics. These metrics effectively measure the system’s performance in terms of retrieval precision, coverage, and comprehensive capability, making them suitable for evaluating multi-table retrieval tasks based on implicit relationships.
Among them, NDCG primarily emphasizes the ranking order of the returned results; that is, strongly relevant results should be positioned earlier in the list. The relevance score of each item in the returned result list is termed as "gain". Considering the positional influence of each item—where items appearing later are subject to a greater discount—the Discounted Cumulative Gain (DCG) is calculated. The calculation formula is as follows:
where represents the number of returned items, and denotes the relevance score of the -th item.
Since the number of results returned by different queries varies, DCG is merely a cumulative value, making it difficult to compare performance across different queries. Therefore, normalization is required to derive the NDCG. The calculation formula is as follows:
where IDCG (Ideal DCG) represents the optimal ranking result obtained by sorting the DCG based on in descending order.
5.2. Datasets
5.2.1. Private Dataset in the Petroleum Domain
The CementingTables dataset is constructed following the format of the WikiTable dataset, based on tables extracted from documents regarding a cementing platform provided by a certain oil company. The queries in this dataset were formulated by relevant personnel from the School of Petroleum and actual users of the laboratory’s cementing engineering system. This dataset consists of a total of 2,341 query-table pairs. Its specific format is illustrated in Figure 6.
5.2.2. Public Datasets
Currently, public datasets for large-scale multi-table retrieval tasks are relatively scarce. Taking KaggleDBQA [26] as an example, it contains only 26 query samples involving multiple tables, which fails to meet the requirements of this study. Therefore, this paper selects Text2SQL datasets as the basis for constructing a multi-table retrieval dataset. Such datasets possess rich examples of multi-table queries and can provide effective support for research on multi-table retrieval tasks.
In terms of dataset construction, this paper adopts the method of Chen et al. [27], selecting Spider and Bird, two representative Text2SQL datasets, as evaluation objects. These two datasets organize data using a topic-partitioning strategy, where each topic corresponds to a database (containing an average of 5.4 data tables) and provides a corresponding set of queries.
To construct an unstructured implicit association dataset suitable for multi-table retrieval tasks, this paper processes the Spider and Bird datasets based on the following steps:
Corpus Integration: First, tables are integrated into a unified corpus while retaining unstructured characteristics (such as irregular headers and missing fields) to simulate scenarios involving Word or PPT documents.
Constraint Removal and Renaming: Second, all foreign key constraints and metadata are removed. Associated fields are replaced with names that are semantically similar but distinct (e.g., changing "dept_id" to "dept_code"). This compels the model to mine implicit associations through semantic reasoning.
Query Filtering: Finally, multi-table queries are filtered to exclude single-table queries, retaining only complex queries that require cross-table reasoning.
After processing, Spider contains 3,563 queries and 287 tables, while Bird contains 6,395 queries and 390 tables, constituting an unstructured multi-table retrieval dataset suitable for mining implicit associations. Table 1 summarizes the details of the datasets.
5.3. Experimental Setup
The experiment utilizes SentenceBERT, specifically the pre-trained model sentence-transformers/all-MiniLM-L6-v2, to provide efficient sentence embedding generation. The training settings include the use of the AdamW optimizer with a learning rate of 2e-5. The model is trained for 10 epochs with a Batch Size of 16 and 100 Warmup Steps. All parameters were optimized on the validation set.
5.4. Baseline Models
To verify the effectiveness of the proposed multi-table retrieval method based on implicit association inference in unstructured data, this paper selected multiple classic models for comparison on the same dataset. The chosen baseline models include Contriever-msmarco3 [28], TaBERT [11], DPR [29], and DTR [30]. These models represent mainstream approaches for text retrieval and semi-structured/unstructured table retrieval, respectively. The aim is to highlight the advantages of the proposed method in handling implicit associations in unstructured data through comparison.
5.5. Main Experimental Results
To validate the effectiveness of the Relatab model (based on implicit inter-table relationship inference) in multi-table retrieval, comparative experiments were conducted against baseline models (Contriever-msmarco3, TaBERT, DPR, and DTR) on the public datasets Spider and Bird. As shown in Table 2, the experimental results indicate that Relatab outperforms the baseline models in terms of Precision, Recall, and F1-score in both Top-2 and Top-5 scenarios.
On the Spider dataset, Relatab’s Top-2 Recall reached 79.21%, exceeding DTR by 1.74 percentage points; the F1-score reached 80.34%, exceeding DTR by 0.93 percentage points, demonstrating strong semantic matching capability in handling complex multi-table queries. The Top-5 Recall reached 97.55%, exceeding DTR by 1.67 percentage points, highlighting its advantage in coverage. This indicates that the algorithm achieves a superior ranking result.
On the Bird dataset, Relatab’s Top-2 Recall was 61.26%, surpassing DTR by 2.33 percentage points; the F1-score was 63.28%, surpassing DTR by 1.48 percentage points; and the Top-5 Recall reached 85.47%, surpassing DTR by 2.49 percentage points, further reflecting its coverage capability in multi-table retrieval. The NDCG@2 and NDCG@5 metrics were higher than those of the baseline models across all datasets, indicating that the proposed method possesses high ranking quality. The experimental results demonstrate that Relatab holds unique value in multi-table retrieval within the domain of unstructured data, providing a more effective solution for complex multi-table queries.
To verify the effectiveness of chain relationship modeling in table retrieval, this paper compared the F1-score performance on the Spider and Bird datasets under different maximum hop counts ( = 1, 2, 3, 4) to analyze their impact on retrieval performance. As shown in Table 3, the results indicate that is the optimal setting for mining implicit associations in unstructured data. As increases beyond this point, the F1-score shows a downward trend, suggesting that overly long chains may introduce noise or redundant associations, affecting retrieval accuracy. When , the F1-score is lower than that of , because with a small hop count, the model can only capture direct associations and fails to fully mine deeper implicit inter-table relationships, leading to limited retrieval capability. The variation in F1-score further validates the robustness of Relatab in unstructured data.
5.6. Ablation Study
To investigate the specific contributions of query-table relevance and inter-table correlation in table retrieval, this paper designed an ablation study comparing the retrieval performance of using only query-table relevance versus combining both query-table and inter-table correlations.
The experimental results (see Table 4) indicate that after incorporating inter-table correlation, the model’s Recall and F1-score improved significantly across multiple datasets. This improvement is primarily attributed to the ability of inter-table correlation to capture implicit relationships between tables, thereby assisting in the retrieval of more complementary tables related to the query. For instance, on the Spider dataset, Recall increased from 76.77% to 79.21% (an increase of 2.44 percentage points), while the F1-score increased from 78.14% to 80.34% (an increase of 2.20 percentage points). This demonstrates that the model maintains high precision while expanding the retrieval scope. On the Bird dataset, the F1-score increased from 62.53% to 63.28% (up 0.75 percentage points), and Recall increased from 58.99% to 61.26% (up 2.27 percentage points). These results further validate the effectiveness of inter-table correlation in unstructured table retrieval tasks.
To further analyze the effect of inter-table similarity in table retrieval tasks of varying difficulty, this paper explores the impact of inter-table similarity on retrieval performance by comparing the F1-scores of models under different numbers of tables. The number of tables is a key indicator for measuring task complexity; single-table tasks are relatively simple, whereas multi-table tasks (especially those involving 3 or more tables) are more challenging due to complex data associations. The experiments were conducted on the Spider and Bird datasets, and the results are illustrated in Figure 7.
As the number of tables increases, the overall F1-score of the model shows a downward trend, indicating that task complexity has a significant impact on retrieval effectiveness. Specifically, Relatab(QT+TT), by combining query-table relevance and inter-table correlation, effectively captures implicit relationships between tables. This provides more supplementary information for complex queries, thereby maintaining relatively stable performance in multi-table scenarios. Taking the results for tables in Figure 4-1 as an example, Relatab(QT+TT) demonstrates superior performance in difficult tasks compared to other baseline models. This suggests that inter-table similarity plays a crucial role in multi-table retrieval tasks, particularly when handling complex queries; it effectively compensates for the limitations of single-relevance methods, providing critical support for improving retrieval performance.
5.7. Hyperparameter Sensitivity Analysis
To further validate the robustness of the Relatab model and investigate the impact of core hyperparameters on retrieval performance, a sensitivity analysis was conducted on the Spider, Bird, and CementingTables datasets. We employed the control variable method, fixing other parameters to their optimal values while varying the target parameter. The evaluation metric used was the Top-2 F1-score. The variation trends of model performance across different hyperparameter values are illustrated in Figure 8.
5.7.1. Impact of Weight Parameters ()
The weight parameters primarily balance the contribution of different semantic levels. As shown in Figure 8(a-d), the model performance exhibits an inverted U-shape trend for these parameters. For instance, controls the balance between table title and column name matching. The model achieves its peak performance at , indicating that an equal emphasis on global titles and local columns is optimal. Similarly, setting effectively balances the table-level and value-level relevance. The parameter determines the fusion ratio of the complementary inter-table score. When exceeds 0.5, the performance declines, suggesting that excessive reliance on complementary tables may introduce noise. Thus, is selected to effectively capture implicit associations without overshadowing the direct query relevance.
5.7.2. Impact of Decay Factor and Thresholds ()
Figure 8(e) demonstrates the effect of the multi-hop decay factor . The performance peaks at revealing a balance between effectively propagating necessary indirect associations and suppressing multi-hop noise. If is too small (<0.5), crucial two-hop relationships are severed.
Threshold parameters () dictate the strictness of table filtering. As depicted in Figure 8(f-h), increasing the thresholds initially improves the F1-score by filtering out irrelevant noise. However, excessively high thresholds lead to a sharp decline in Recall, as relevant tables are erroneously discarded. The optimal combination () successfully strikes a balance between retrieval precision and coverage.
Overall, the sensitivity analysis reveals that the Relatab model exhibits strong robustness within a reasonable range () around the optimal hyperparameter values, proving that the proposed method does not rely on extreme parameter tuning to achieve high performance.
6. Conclusions
This paper proposes a multi-table retrieval method based on implicit inter-table relationship inference, designed to address the challenges posed by unstructured data in the petroleum industry within complex query scenarios. By integrating query-table relevance and inter-table correlation, this method achieves the effective mining of implicit multi-table associations.
Specifically, query-table relevance combines table-level matching (titles and column names) with value-level matching (column values), enabling the preliminary localization of relevant tables based on the query. Meanwhile, inter-table correlation further reveals latent connections between tables that are not explicitly labeled, utilizing inter-table similarity and multi-hop chain relationships.
Experimental results demonstrate that this fusion strategy enables the model to capture deeper semantic associations within unstructured data environments lacking clear structured connections, thereby enhancing the comprehensiveness and accuracy of retrieval.
References
- Reiter E, Dale R. Building applied natural language generation systems[J]. Natural Language Engineering, 1997, 3(1): 57-87.
- Cafarella M J, Halevy A, Wang D Z, et al. WebTables: Exploring the Power of Tables on the Web[J]. Proceedings of the VLDB Endowment, 2008, 1(1): 538-549. [CrossRef]
- Cafarella M J, Halevy A, Khoussainova N. Data Integration for the Relational Web[J]. Proceedings of the VLDB Endowment, 2009, 2(1): 1090-1101.
- Venetis P, Halevy A Y, Madhavan J, et al. Recovering Semantics of Tables on the Web[J]. Proceedings of the VLDB Endowment, 2011, 4(9): 528-538.
- Zhang S, Balog K. Ad hoc table retrieval using semantic similarity[C]//ACM. Proceedings of the 2018 World Wide Web Conference. Lyon, France: ACM, 2018: 1553-1562.
- Zelle, J. M, Mooney, R. J. Learning to parse database queries using inductive logic programming[C]//AAAI. Proceedings of the Thirteenth National Conference on Artificial Intelligence. Portland, Oregon: AAAI Press, 1996: 1050-1055.
- Trabelsi M, Davison B D, Heflin J. Improved table retrieval using multiple context embeddings for attributes[C]. 2019 IEEE international conference on big data (Big Data). Angeles, California, USA: IEEE, 2019: 1238-1244.
- Chen Z, Jia H, Heflin J, et al. Leveraging schema labels to enhance dataset search[C]//Advances in Information Retrieval: 42nd European Conference on IR Research, ECIR 2020. Lisbon, Portugal: Springer International Publishing, 2020: 267-280.
- Lai S, Xu L, Liu K, et al. Recurrent convolutional neural networks for text classification[C]//AAAI. Proceedings of the Twenty-Ninth AAAI Conference on Artificial Intelligence. Austin, Texas: AAAI Press, 2015: 2267-2273.
- Devlin J, Chang M W, Lee K, et al. BERT: Pre-training of Deep Bidirectional Transformers for Language Understanding[C]//Association for Computational Linguistics. Proceedings of the 2019 Conference of the North American Chapter of the Association for Computational Linguistics: Human Language Technologies. Minneapolis, Minnesota: Association for Computational Linguistics, 2019: 4171-4186.
- Pengcheng Y, Graham N, Wen-tau Y, Sebastian R, et al. TaBERT: Pretraining for Joint Understanding of Textual and Tabular Data[C]//Association for Computational Linguistics. Proceedings of the 58th Annual Meeting of the Association for Computational Linguistics. Online: Association for Computational Linguistics, 2020: 5116-5123.
- Liu Y H, Ott M, Goyal N, et al. RoBERTa: A robustly optimized BERT pretraining approach[C]//Proceedings of the Eighth International Conference on Learning Representations. Online: OpenReview.net, 2020.
- Herzig J, Nowak P K, Mueller T, et al. TaPas: Weakly Supervised Table Parsing via Pre training[C]//Association for Computational Linguistics. Proceedings of the 58th Annual Meeting of the Association for Computational Linguistics. Online: Association for Computational Linguistics, 2020: 4320-4333.
- Wang Z, Dong H, Jia R, et al. Tuta: Tree-based transformers for generally structured table pre-training[C]//ACM. Proceedings of the 27th ACM SIGKDD Conference on Knowledge Discovery and Data Mining. Virtual Event, Singapore: ACM, 2021: 1780-1790.
- Hiroshi I, Dung T, Varun M, Mohit I, et al. TABBIE: Pretrained Representations of Tabular Data[C]//Association for Computational Linguistics. Proceedings of the 2021 Conference of the North American Chapter of the Association for Computational Linguistics: Human Language Technologies. Online: Association for Computational Linguistics, 2021: 3446-3456.
- Dey R, Salem F M. Gate-variants of gated recurrent unit (GRU) neural networks[C]//IEEE. Proceedings of the 2017 IEEE 60th International Midwest Symposium on Circuits and Systems. Boston, MA, USA: IEEE, 2017: 1597-1603.
- Deng X, Sun H, Lees A, et al. Turl: Table understanding through representation learning[J]. ACM SIGMOD Record, 2022, 51(1): 33-40. [CrossRef]
- Chen D, O’Bray L, Borgwardt K. Structure-aware transformer for graph representation learning[C]//PMLR. Proceedings of the 39th International Conference on Machine Learning. Baltimore, Maryland, USA: PMLR, 2022: 3469-3489.
- Mingyu Z, Xinwei F, Qingyi S, Qiaoqiao S, Zheng L, Wenbin J, Weiping W, et al. Multimodal Table Understanding[C]//Association for Computational Linguistics. Proceedings of the 62nd Annual Meeting of the Association for Computational Linguistics (Volume 1: Long Papers). Bangkok, Thailand: Association for Computational Linguistics, 2024: 9102-9124.
- Ahmad A, Maik T, Julian E, Wolfgang L, Robert W, et al. Towards a Hybrid Imputation Approach Using Web Tables[C]//Unknown Editor. Proceedings of Big Data Computing. Location Unknown: Publisher Unknown, 2015: 21-30.
- Oliver L, Dominique R, Petar R, Robert M, Heiko P, Christian B, et al. The Mannheim Search Join Engine[J]. Journal of Web Semantics, 2015, 35: 159-166. [CrossRef]
- Anish D S, Lujun F, Nitin G, Alon Y H, Hongrae L, Fei W, Reynold X, Cong Y, et al. Finding Related Tables[C]//ACM. Proceedings of the 2012 ACM SIGMOD International Conference on Management of Data. Scottsdale, Arizona, USA: ACM, 2012: 817-828.
- Chen P B, Zhang Y, Roth D. Is Table Retrieval a Solved Problem? Exploring Join-Aware Multi-Table Retrieval[C]//Association for Computational Linguistics. Proceedings of the 62nd Annual Meeting of the Association for Computational Linguistics. Bangkok, Thailand: Association for Computational Linguistics, 2024: 2687-2699.
- Tao Y, Rui Z, Kai Y, Michihiro Y, Dongxu W, Zifan L, James M, Irene L, Qingning Y, Shanelle R, Zilin Z, Dragomir R, et al. Spider: A Large-Scale Human-Labeled Dataset for Complex and Cross-Domain Semantic Parsing and Text-to-SQL Task[C]//Association for Computational Linguistics. Proceedings of the 2018 Conference on Empirical Methods in Natural Language Processing. Brussels, Belgium: Association for Computational Linguistics, 2018: 3911-3921.
- Agarwal S. Data mining: Data mining concepts and techniques[C]//IEEE. Proceedings of the 2013 International Conference on Machine Intelligence and Research Advancement. Katra, India: IEEE, 2013: 203-207.
- Lee C H, Polozov O, Richardson M. KaggleDBQA: Realistic Evaluation of Text-to-SQL Parsers[J]. ACM Journal of Experimental Algorithmics, 2021, 26: 1-15.
- Gautier I, Mathilde C, Lucas H, Sebastian R, Piotr B, Armand J, Edouard G, et al. Unsupervised Dense Information Retrieval with Contrastive Learning[DB/OL]. [2022]. https://arxiv.org/abs/2112.09131.
- Gautier I, Mathilde C, Lucas H, Sebastian R, Piotr B, Armand J, Edouard G, et al. Unsupervised Dense Information Retrieval with Contrastive Learning[DB/OL]. [2022]. https://arxiv.org/abs/2112.09131.
- Karpukhin V, Oguz B, Min S, et al. Dense Passage Retrieval for Open-Domain Question Answering[C]//Association for Computational Linguistics. Proceedings of the 2023 Conference on Empirical Methods in Natural Language Processing. Online: Association for Computational Linguistics, 2023: 6769-6781.
- Jonathan H, Thomas M, Syrine K, Julian M E, et al. Open Domain Question Answering over Tables Via Dense Retrieval[C]//Association for Computational Linguistics. Proceedings of the 2021 Conference of the North American Chapter of the Association for Computational Linguistics: Human Language Technologies. Online: Association for Computational Linguistics, 2021: 512-519.
Figure 1.
Implicit Associations example.
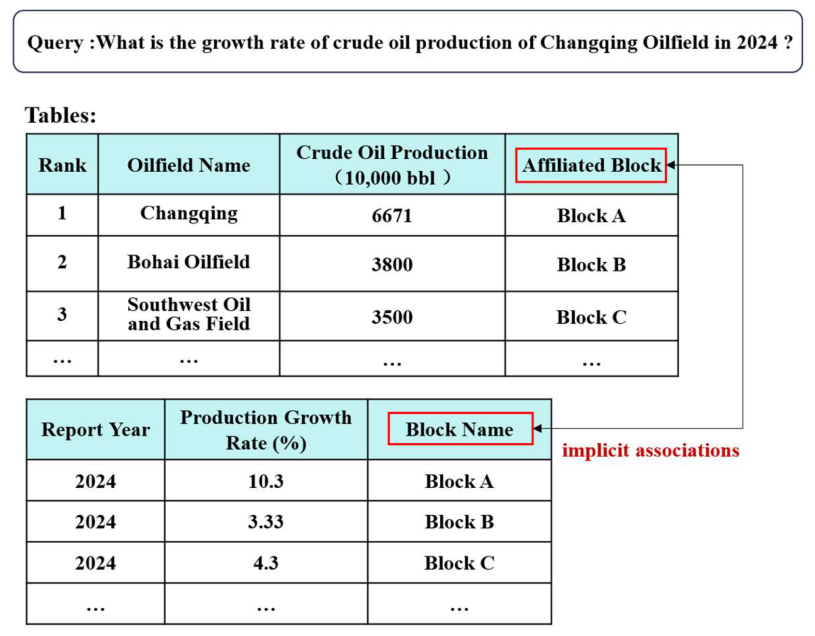
Figure 3.
Table-Level Relevance Diagram.
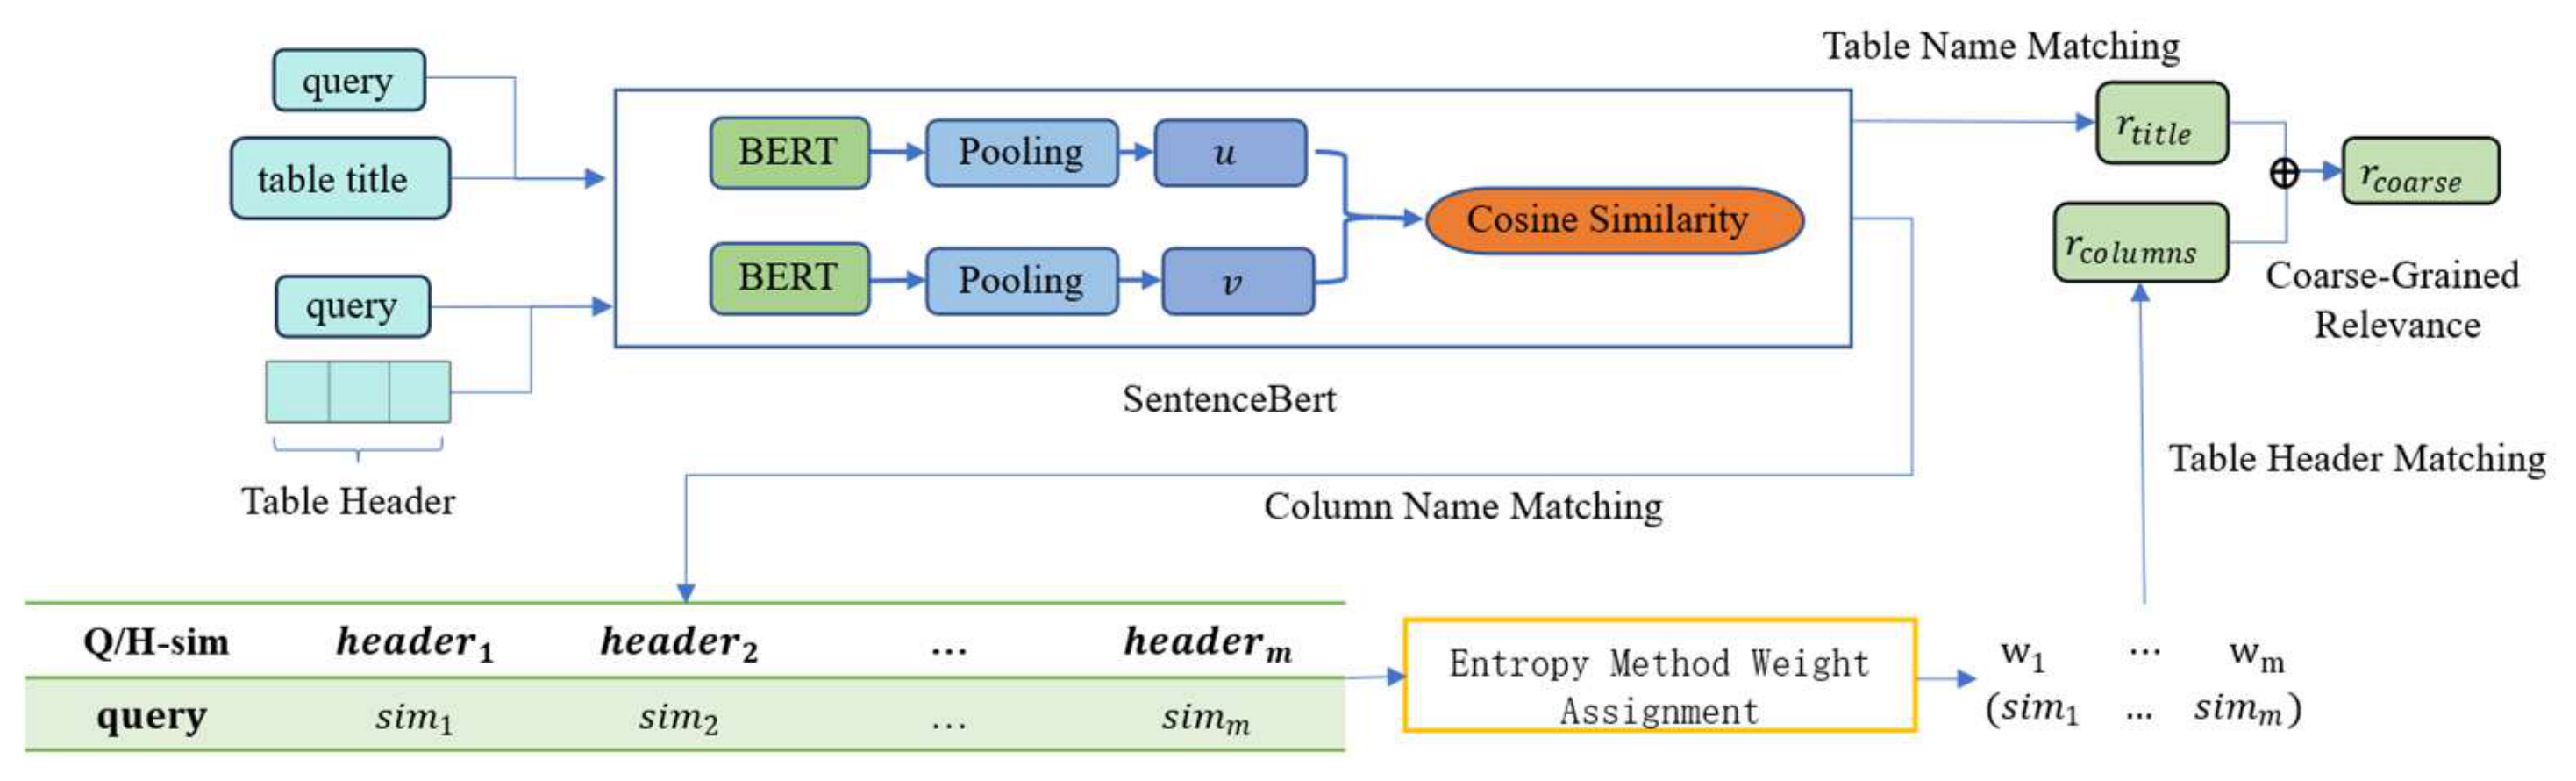
Figure 4.
Value-Level Relevance Computation Diagram.
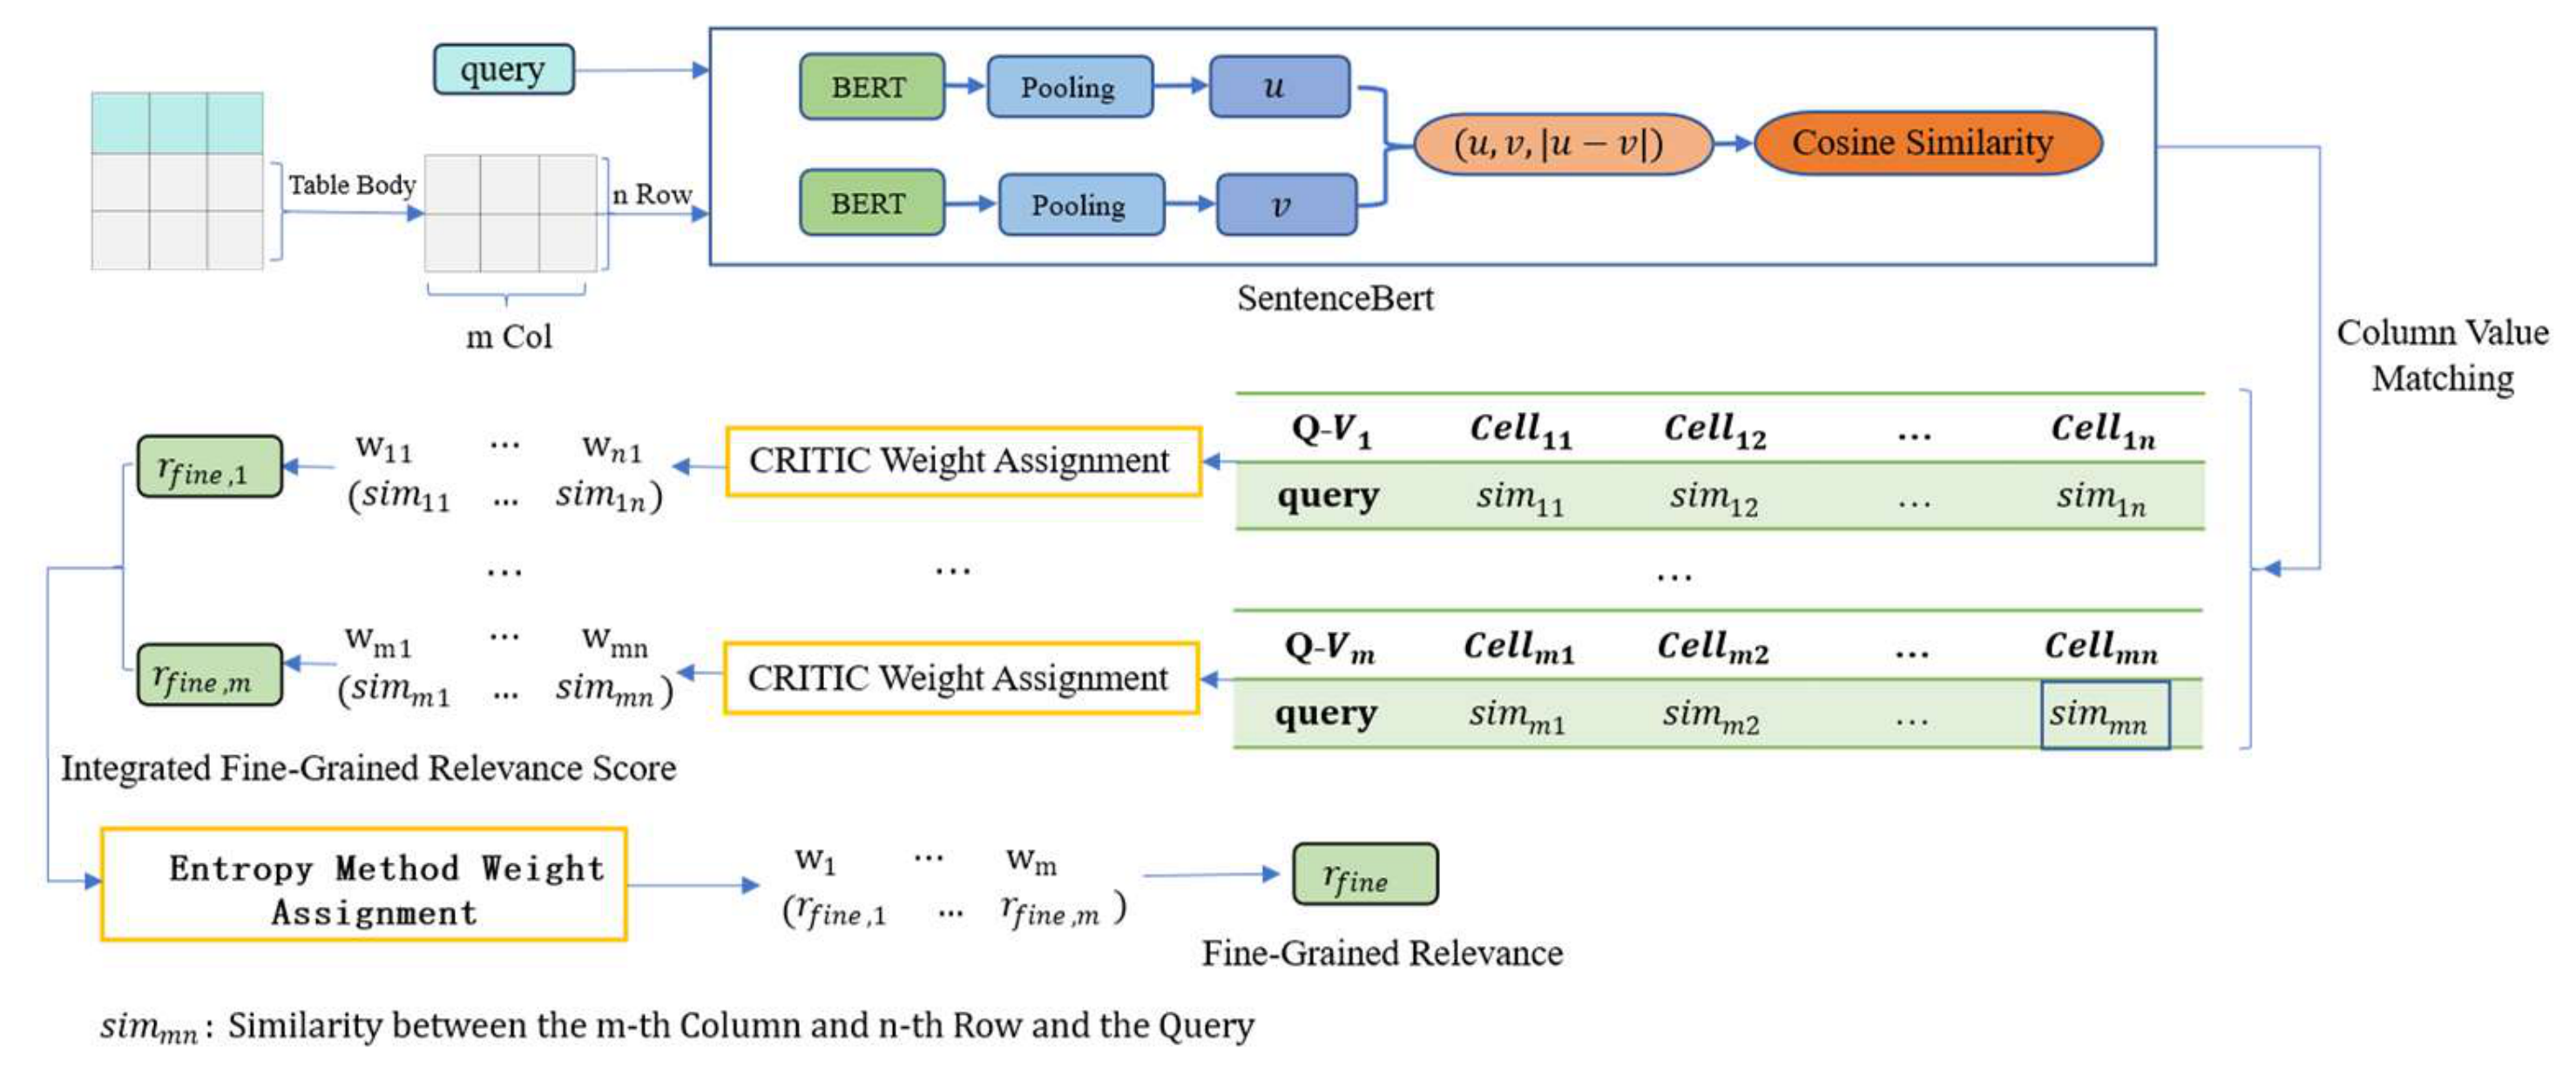
Figure 5.
Inter-Column Integrated Similarity Computation Diagram.
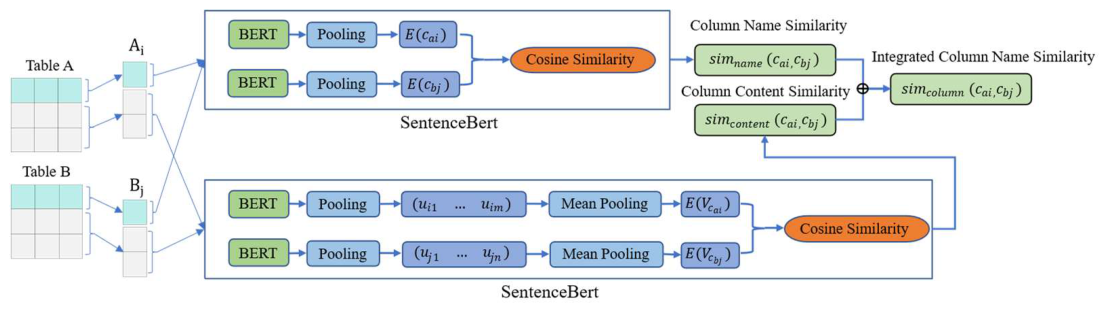
Figure 6.
Example of CementingTables.
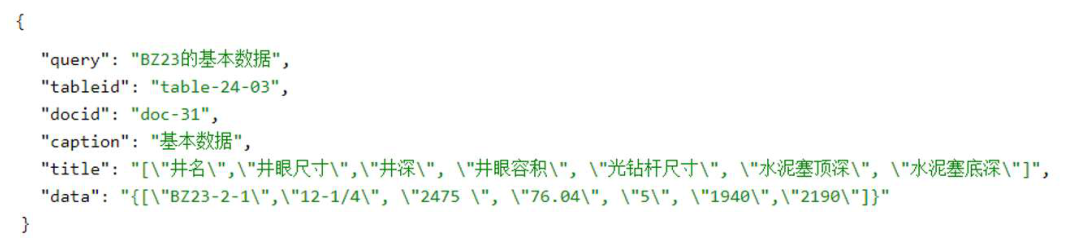
Figure 7.
Effect of Inter-Table Similarity on Retrieval Performance with Varying Table Counts.
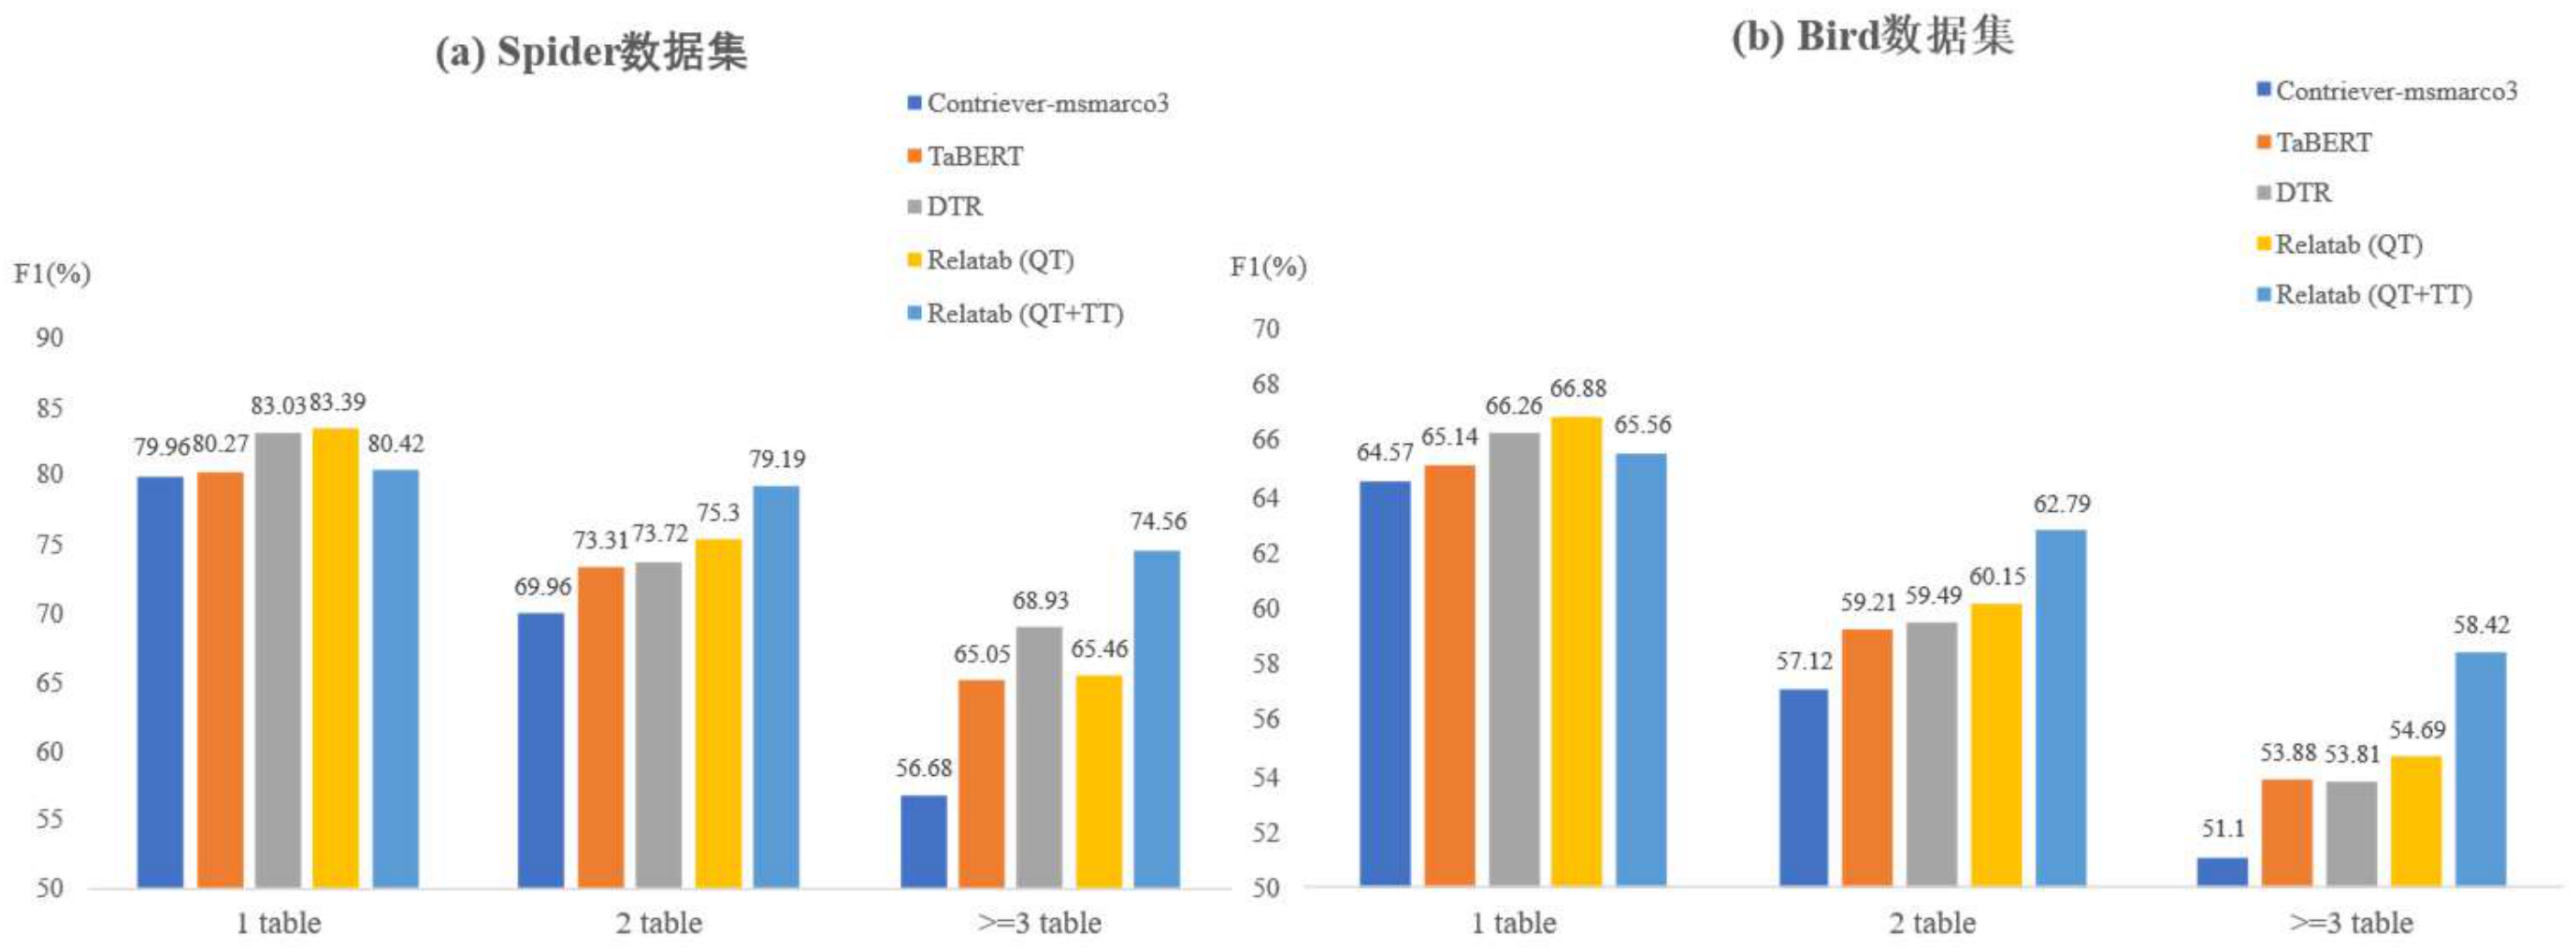
Figure 8.
Sensitivity analysis of hyperparameter variations across Spider, Bird, and CementingTables datasets evaluated by Top-2 F1-score. The red dotted lines indicate the optimal hyperparameter values used in the main experiments.
Figure 8.
Sensitivity analysis of hyperparameter variations across Spider, Bird, and CementingTables datasets evaluated by Top-2 F1-score. The red dotted lines indicate the optimal hyperparameter values used in the main experiments.
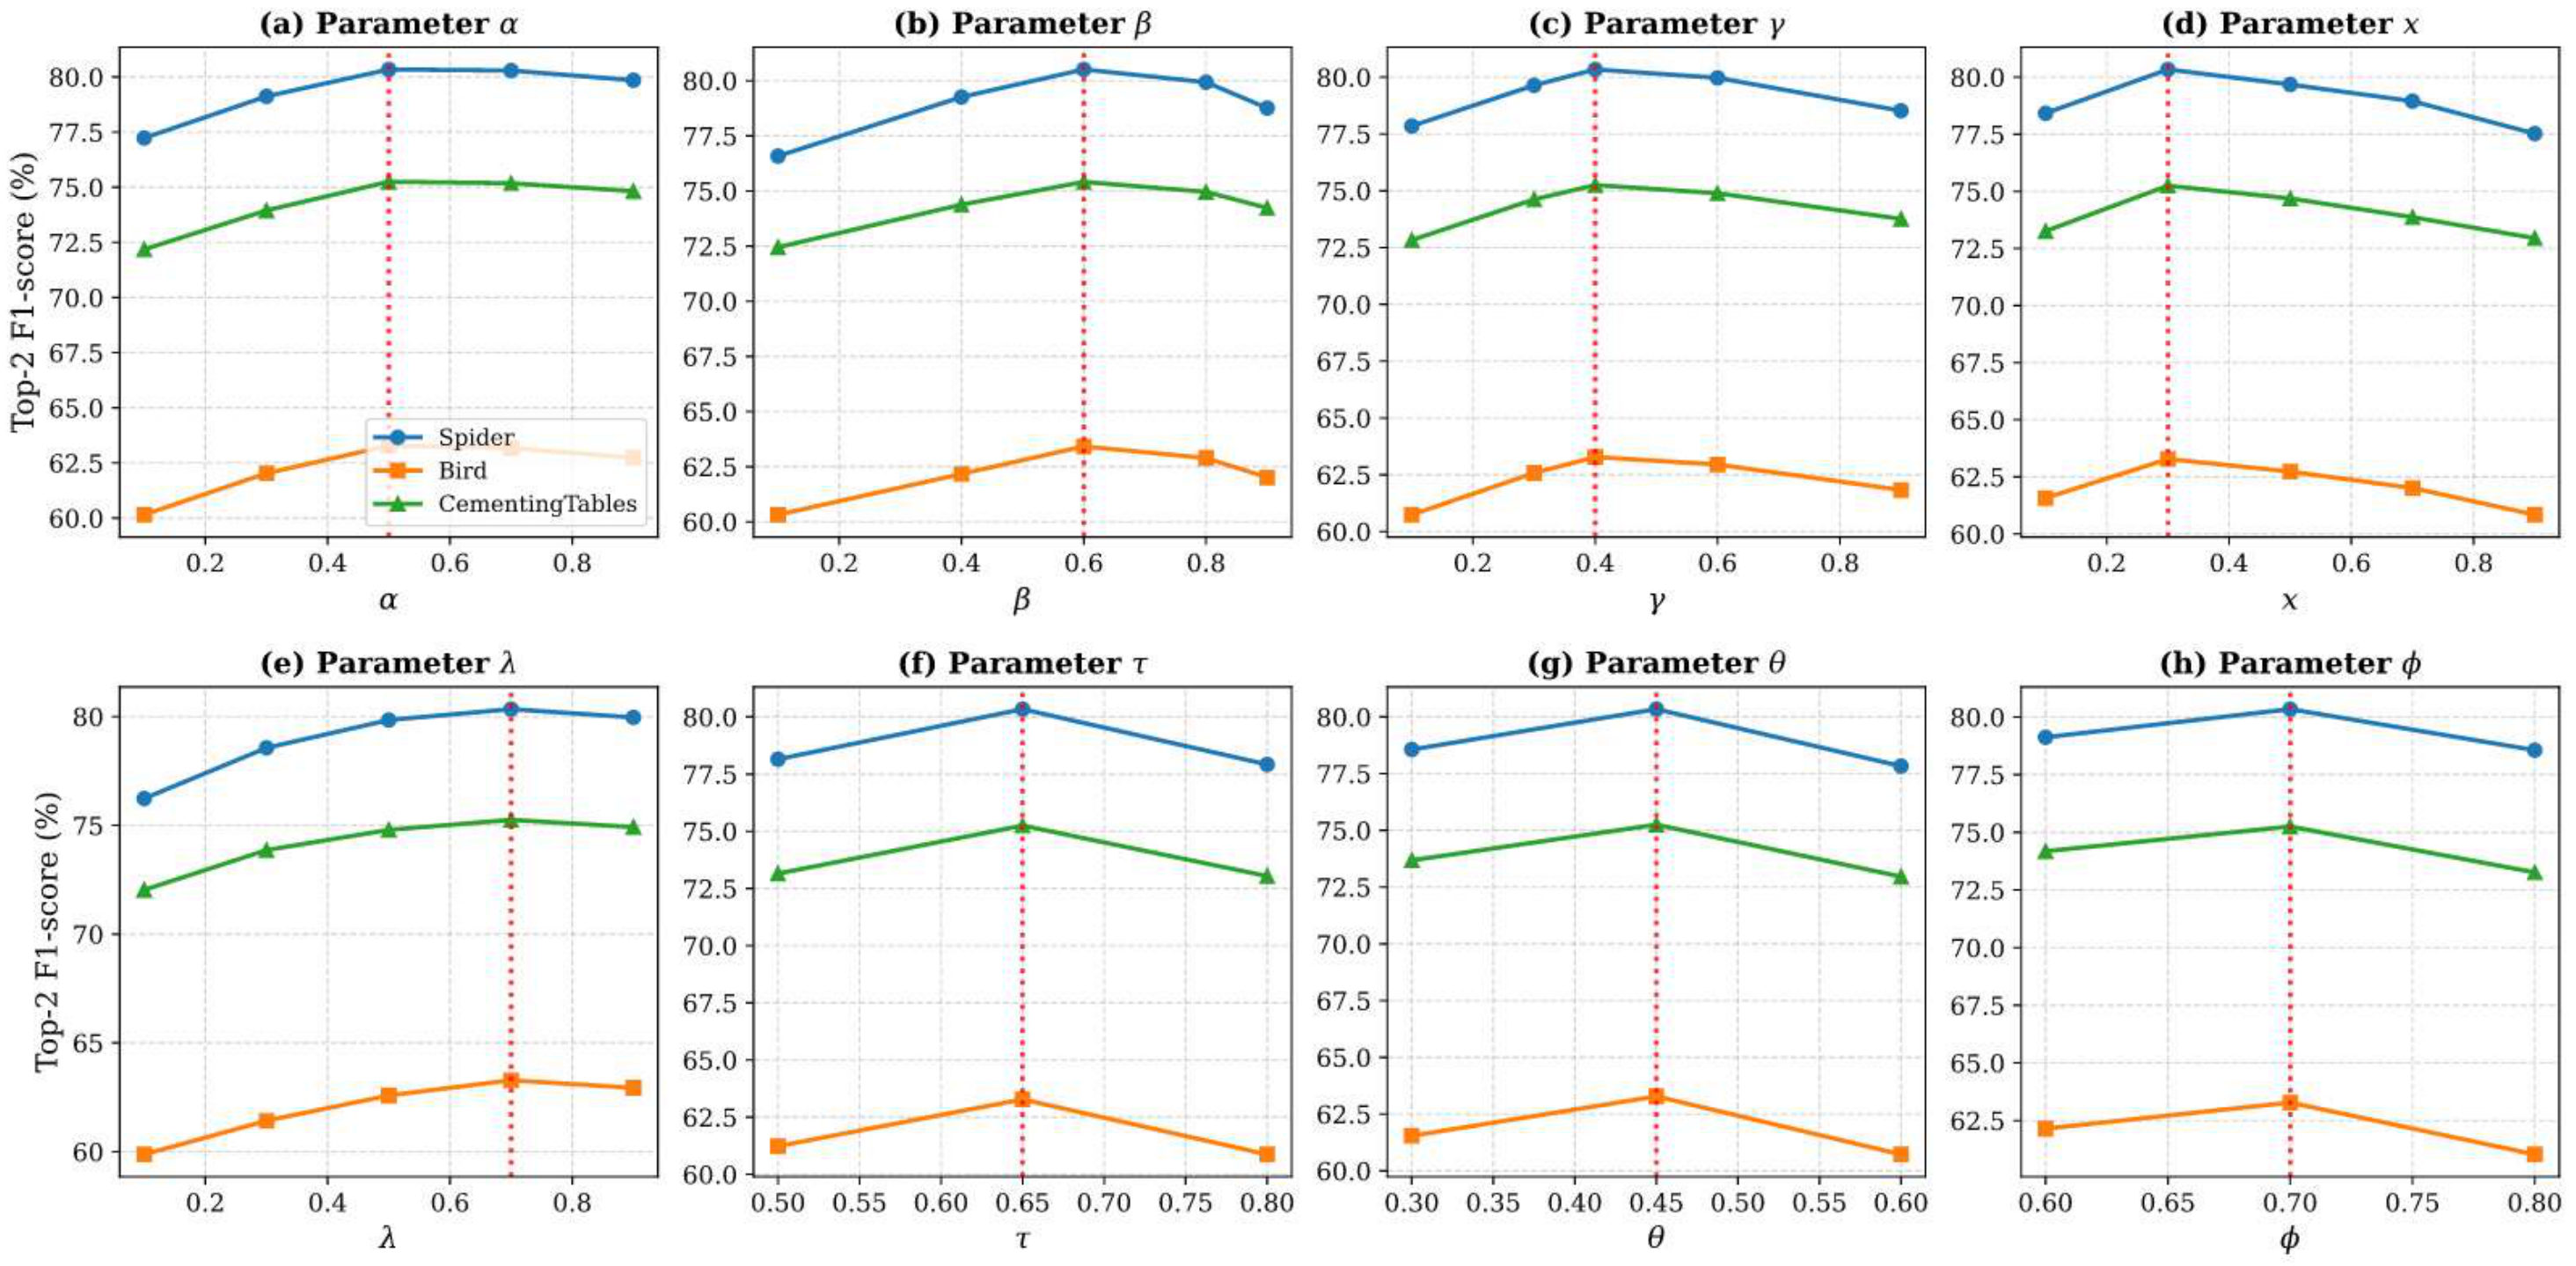

Table 1.
Statistics of multi-table retrieval.
| dataset | train | valid |
|---|---|---|
| Bird | 4476 | 639 |
| Spider | 2494 | 356 |
Table 2.
Comparative experimental results of this method with baseline methods.
| Dataset | Model | Top-2 | Top-5 | NDCG@2 | NDCG@5 | ||||
|---|---|---|---|---|---|---|---|---|---|
| P | R | F1 | P | R | F1 | ||||
| Spider | Contriever | 76.29 | 72.78 | 74.49 | 39.84 | 93.38 | 55.85 | 76.07 | 71.57 |
| TaBERT | 78.59 | 72.79 | 75.58 | 40.76 | 93.67 | 56.80 | 77.01 | 72.33 | |
| DPR | 81.20 | 77.23 | 79.15 | 40.93 | 94.97 | 57.47 | 82.72 | 72.64 | |
| DTR | 81.45 | 77.47 | 79.41 | 41.05 | 95.88 | 57.49 | 83.88 | 72.84 | |
| Relatab(Ours) | 81.50 | 79.21 | 80.34 | 40.88 | 97.55 | 57.62 | 84.61 | 73.96 | |
| Bird | Contriever | 65.03 | 59.46 | 62.12 | 37.04 | 82.96 | 51.21 | 70.63 | 67.27 |
| TaBERT | 66.23 | 59.17 | 62.50 | 37.96 | 83.21 | 52.14 | 72.25 | 68.08 | |
| DPR | 64.75 | 58.70 | 61.58 | 37.11 | 82.72 | 51.23 | 75.31 | 67.37 | |
| DTR | 64.97 | 58.93 | 61.80 | 37.21 | 82.98 | 51.38 | 75.51 | 67.47 | |
| Relatab(Ours) | 65.43 | 61.26 | 63.28 | 37.86 | 85.47 | 52.48 | 76.12 | 68.40 | |
| Cementing Tables |
Contriever | 67.36 | 73.44 | 70.27 | 39.91 | 94.06 | 56.04 | 72.32 | 68.40 |
| TaBERT | 68.81 | 74.22 | 71.41 | 40.38 | 94.60 | 56.60 | 73.03 | 69.38 | |
| DPR | 71.64 | 76.98 | 73.80 | 41.66 | 96.25 | 58.10 | 76.56 | 71.32 | |
| DTR | 71.76 | 76.03 | 73.83 | 41.72 | 96.32 | 58.22 | 76.66 | 73.96 | |
| Relatab(Ours) | 72.79 | 77.88 | 75.25 | 41.66 | 97.20 | 58.32 | 79.21 | 75.35 | |
* Note: P, R, and F1 denote Precision, Recall, and F1-score, respectively. Top-k indicates that the top- ranked tables are selected as the retrieval results.
Table 3.
F1-Score comparison under different maximum hop counts.
| Dataset | F1 | |||
|---|---|---|---|---|
| Spider | 78.41 | 80.34 | 79.82 | 76.34 |
| Bird | 62.85 | 63.28 | 63.04 | 59.11 |
| CementingTables | 72.87 | 75.25 | 73.54 | 70.93 |
Table 4.
CorrelationComparative experiment on Inter-Table correlation.
| Dataset | Model | P | R | F1 |
|---|---|---|---|---|
| Spider | Relatab (QT) | 79.57 | 76.77 | 78.14 |
| Relatab (QT+TT) | 81.50 | 79.21 | 80.34 | |
| Bird | Relatab (QT) | 66.53 | 58.99 | 62.53 |
| Relatab (QT+TT) | 65.43 | 61.26 | 63.28 | |
| CementingTables | Relatab (QT) | 68.79 | 75.23 | 71.87 |
| Relatab (QT+TT) | 72.79 | 77.88 | 75.25 |
*Note: QT denotes the method using only Query-Table relevance calculation, whereas QT+TT indicates the method incorporating both Query-Table relevance and Inter-Table correlation calculations.
Disclaimer/Publisher’s Note: The statements, opinions and data contained in all publications are solely those of the individual author(s) and contributor(s) and not of MDPI and/or the editor(s). MDPI and/or the editor(s) disclaim responsibility for any injury to people or property resulting from any ideas, methods, instructions or products referred to in the content. |
© 2026 by the authors. Licensee MDPI, Basel, Switzerland. This article is an open access article distributed under the terms and conditions of the Creative Commons Attribution (CC BY) license (http://creativecommons.org/licenses/by/4.0/).
Copyright: This open access article is published under a Creative Commons CC BY 4.0 license, which permit the free download, distribution, and reuse, provided that the author and preprint are cited in any reuse.


