

Submitted:
25 June 2026
Posted:
26 June 2026
You are already at the latest version
Abstract
We present a global metadata comprising results from studies investigating the effects of cover crops (CCs) on six key soil hydraulic properties, namely total porosity, infiltration rate, saturated hydraulic conductivity, water retention at field capacity and permanent wilting points, and available water holding capacity. This data repository is the result of a global meta-analysis entitled “Cover crop performance and functional groups regulate improvements in Soil Hydrology: A Global Meta-analysis". Globally, numerous studies have investigated the role of CCs on soil hydraulic properties, but the results have varied across sites and years. Hence, the objective of the meta-analysis was to synthesize existing knowledge base to assess overall effects of CCs on these soil hydraulic properties and evaluate how environmental and management factors moderate these overall CC responses. We searched for peer-reviewed research articles published through 5th October 2024 in the ISI Web of Science database and reference checking following the Preferred Reporting Items for Systematic Reviews and Meta-Analyses (PRISMA) guidelines. A total of 146 relevant articles were identified from which data on CC responses were extracted. The metadata consists of 1007 pairwise observations comparing CC vs no-CC controls across diverse geographic regions worldwide. Moreover, we collected associated metadata for each pairwise comparison that includes a broad set of bibliographic, geographic, soil, climate, and management variables. Categorical variables were grouped into pre-defined factor levels or classes. Missing soil and climate data were filled using publicly available data-products. Our data repository can be a valuable resource for the field and modeling community to identify knowledge gaps and guide future research.
Keywords:
cover crops
; environmental and management controls
; soil hydraulic properties
; sustainable agriculture
1. Summary
Cover crops are plants grown after cash crop harvest primarily to protect and improve soil health and water resources [1,2,3]. Cover crops represent an incremental step towards diversified crop rotations. Furthermore, CCs in combination with conservation tillage (i.e., minimal or no soil disturbance) represent a premier strategy for advancing full-stack soil health management principles in our cropping systems. For instance, CCs incorporate the remaining three of four soil health principles (i.e., maximizing soil cover, biodiversity, and the presence of living roots). Besides improving soil health and enhancing systems’ resilience, CCs provide several other agronomic and ecological services, some of which include weed suppression, soil moisture conservation, erosion control, soil N scavenging and reduced nitrate leaching losses, biological N fixation and supply, improvement in soil structural and hydraulic properties, and yield stability [4,5,6,7,8,9,10].
Among the multiple ecosystem services provisioned by CCs, improvements in soil hydraulic properties are of particular interest to enhance the long-term sustainability of our cropping systems. This is because these soil properties are key soil health indicators governing soil water movement, retention, and availability in our agricultural fields [11,12,13]. It is partly through the improvements in soil physical environment, CCs can buffer against weather extremities reducing inter-annual variability and improving yield stability over years [4,13]. The CC-associated improvements in soil hydraulic properties can be ascribed to multiple inter-connected mechanisms or pathways as illustrated in Figure 1.
Globally, numerous field studies have been conducted by independent researchers to investigate the effects of CCs on multiple specific soil hydraulic properties. However, individual field studies are limited to their specific environmental and management context, and therefore, the findings are both mixed and inconclusive. Studies have reported both positive and negative or neutral responses of CCs to a set of soil hydraulic properties. For example, while a body of evidence suggests that CCs increase the infiltration rate [14,15], some studies reported no change [16,17] or even a decrease in infiltration rate [18] with CCs compared to no-CC control. Such inconsistencies have created greater uncertainty about the generalizable effects of CCs on soil hydraulic properties and functioning.
Meta-analysis offers a powerful approach to quantitatively synthesize and contextualize all available relevant articles investigating a specific research question. With that, we conducted a meta-analysis [19] to quantify the overall effects of CCs on six key soil hydraulic properties, namely total porosity, infiltration rate, saturated hydraulic conductivity (Ksat), water retention at field capacity and permanent wilting points, and available water holding capacity (AWHC). We further investigated how soil, climate, and management influence the magnitude and direction of overall CC effects on soil hydraulic properties. The dataset presented here is the result of this meta-analysis and integrates data from individual studies investigating CC effects on soil hydraulic properties worldwide. This dataset provides a standardized and transparent resource for testing future research hypothesis, updating meta-analysis, and supporting informed management and policy decisions on CC adoption among farmers.
2. Data Description
The metadata consists of 1007 rows of data extracted from 146 peer-reviewed publications comparing CC effects on at least one of the six soil hydraulic properties considered in this meta-analysis. These soil hydraulic properties include total porosity, infiltration rate, Ksat, water retention at field capacity and permanent wilting points, and AWHC. Each row in the metadata represents a pairwise comparison between CC vs. no-CC control treatment groups which includes treatment means, standard deviations, and number of replications for both groups. Each pairwise observation is further associated with a broad set of ancillary variables which include bibliographic, geographic, soil, climate, and management (Table 1). The geographic variables (e.g., latitude and longitude) were included to fill the missing soil and climate data using publicly available databases (e.g., SSURGO and ISRIC SoilGrids for soil; PRISM, WorldClim, and Köppen-Grieger Classification for climate). Similarly, soil, climate, and management were included as either categorical or continuous variables. This facilitates moderator and meta-regression analysis to assess how soil, climate, and management shape the overall CC response on each of the individual soil hydraulic properties. Description of column names and abbreviations used in the metadata is detailed in Table 1.
The geographical distribution of the studies included in the metadata is shown in Figure 2. For all soil hydraulic properties, the majority of the studies included in this metadata originated from North America followed by Europe, Asia, and South America. Studies from both Africa and Oceania continents were poorly represented in the metadata. Studies were evenly distributed across all soil textural classes or groups.
The box and whisker plots presented in Figure 3 depicts the distributions of responses for CC vs. no-CC groups. We observed considerable variations in the observed response across studies for all soil hydraulic properties. In most cases, the observed response was slightly higher in CC as compared to no-CC controls. This indicates that the CC-associated improvements in soil hydraulic properties are highly consistent and have been observed globally across studies.
Figure 4 shows the regression analyses between CC vs. no-CC groups for all six soil hydraulic properties. The majority portion of the fitted regression lines were above the 1:1 line across all panels, suggesting that soil hydraulic properties under CCs were universally higher than those under no-CC control groups. However, it should be noted that the slopes of the fitted regression lines were different. This indicates that CCs influence certain soil hydraulic property more strongly than the others.
We calculated individual effect sizes (i.e., log of the response ratios: ) to determine the magnitude and direction of CC effects on soil hydraulic properties in each row in the metadata. For each soil hydraulic property, were symmetrically distributed across both positive, negative, and neutral values indicating no evidence for publication bias. We further conducted Pearson correlation analysis among individual effect sizes for all six soil hydraulic properties (Figure 5). We found that multiple of these were highly correlated suggesting that the CC-associated improvements in soil hydraulic properties are inter-connected and linked to each other. For instance, the for total porosity was positively correlated with the for Ksat, water retention at field capacity, water retention at permanent wilting points, and AWHC. The for infiltration rate was positively correlated to the for Ksat and AWHC. In addition, the for field capacity was positively correlated with for permanent wilting points and AWHC.
3. METHODS
3.1. Literature search and screening:
Data was collected through a systematic search and screening of peer-reviewed articles investigating CC effects on soil hydraulic properties worldwide. For this, we followed Preferred Reporting Items for Systematic Reviews and Meta-Analyses (PRISMA) guidelines (Figure 6). An initial search was conducted based on topic words (i.e., titles, abstracts, and keywords) in the Thomson Reuters ISI Web of Science database using the search terms as listed in Table 2. The search resulted in 726 articles published through 5th October 2024.
All articles were passed through the two-step screening to assess their relevance for inclusion in the metadata. This included an abstract followed by full-text screening. First screening based on abstracts resulted in a total of 268 relevant articles. Second screening based on full texts was conducted to determine if these articles passed through the pre-defined eligibility and inclusion criteria listed in Table 3. Full-text screening resulted in a total of 127 eligible articles to be included in the final metadata. Further, we found six additional articles from the Soil Health Database published by Jian et al. [20], which were not indexed in our initial search via the ISI Web of Science database. In addition, we screened references of the existing meta-analyses and systematic review articles to ensure the inclusion of any other remaining articles that were not already identified. As a result, we obtained thirteen additional articles: nine from a previous meta-analysis by Basche and DeLonge [21] and four from a review article by Haruna et al. [22]. Altogether, our final metadata included data from 146 peer-reviewed publications.
3.2. Data extraction and standardization:
We extracted soil hydrological responses and associated metadata from the studies. As response data, we recorded treatment means and measures of variability i.e., standard deviation (SD), standard error (SE), coefficient of variation (CV), or least significant difference (LSD) for all the soil hydraulic properties considered, if available. The response means were converted into standard units: total porosity (cm3 cm−3), infiltration rate (cm h−1), Ksat (cm d−1), and all water retention characteristics (i.e., field capacity, permanent wilting point, and available water holding capacity) (cm3 cm−3). Similarly, reported measures of variability other than SD were converted into SD using the following equations.
where ‘t’ is the t-test value, ‘n’ is the sample size, and ‘b’ is the number of blocks or replications.
When the data were available for multiple soil depths, we recorded data for uppermost soil depth. Similarly, when multiple time-series measurements for a response were reported per site-year, we considered only the latest data available for the cropping cycle. In this dataset, total porosity was calculated as the summation of micro-, meso-, and macro-porosity when studies reported them separately. Similarly, we considered volumetric moisture content at water potential between –10 and –33 kPa as the field capacity, and that at -1500kPa as the permanent wilting point. When AWHC was not explicitly reported, we calculated it as the difference between the reported water retention at the field capacity and the permanent wilting point.
The associated metadata for each pair-wise observation in the repository included bibliographic, geographic, soil, climate, and management information, as listed and detailed in Table 1. When soil and climate data were not reported in original publications, we extracted them from publicly available data products using the site’s latitudinal and longitudinal coordinates. For US locations, missing soil and climate data were obtained from the Soil Survey Geographic Database (SSURGO) API and PRISM Climate Group, respectively. For non-US locations, missing soil and climate data were retrieved from the ISRIC SoilGrids Rest API and WorldClim v 2.1 Climate Data, respectively. Following data extraction, categorical moderator variables were grouped into pre-defined factor levels or classes (Table 4). This aids in data harmonization among individual studies, thereby facilitating moderator analysis in a meta-analysis.
3.3. Effect size calculation:
We further calculated the effect size of CCs for each response variable, i.e., total porosity, infiltration rate, Ksat, water retention at field capacity and permanent wilting points, and AWHC. Effect sizes were calculated for each pair-wise observation as the natural logarithm of the response ratios, as described in Equation 4.
where ‘’ is the natural logarithm of the response ratio and represents individual effect sizes for each pair-wise observation in the metadata; ‘’ and ‘’ are the mean values of the response variables for CC and no-CC groups, respectively. Positive values of indicate improvements in soil hydraulic properties under CCs as compared to no-CC controls and vice-versa.
4. User Notes:
4.1. Value of the data:
- The dataset provides a comprehensive synthesis of the effects of CCs on key soil hydraulic properties, namely total porosity, infiltration rate, saturated hydraulic conductivity (Ksat), water retention at field capacity and permanent wilting point, and available water holding capacity (AWHC).
- Continuous data are converted into standardized units; categorical variables are clearly defined and grouped. This facilitates easy reuse of data for meta-analysis and modeling purposes.
- The dataset aids in identifying knowledge gaps and guiding future research areas (e.g., CC studies investigating soil hydraulic properties are under-represented in dry and tropical regions).
- The dataset can be used to foster cross-disciplinary research collaboration in soil science, agronomy, hydrology, and climate change adaptation, and can be used to make informed management and policy decisions regarding cover cropping.
4.2. Limitations:
- Depending on the response variables, a measure of variability (e.g., SD) was reported in the original publications in only 10-29% of the pair-wise observations included in this metadata. To impute the missing SDs, we first estimate the bootstrapped mean coefficient of variation (CV) based on the reported data and then multiplied it by their respective treatment means in each pairwise observation. Our sensitivity analysis indicated that the bootstrapping-based imputing approach applied in this metadata to estimate missing SDs was robust.
- The dataset contains only a limited number of pairwise observations for certain factor levels or classes within a specific categorical moderator variable. For example, data from dry and tropical climate zones as well as residue removal category were underrepresented in the dataset. This results in huge uncertainty in the observed CC response, thereby restricting our ability to make robust inference in these cases. However, this also points to direction for future research avenues.
- In some cases, the dataset does not contain data on all moderator variables considered in this repository. This is because information regarding these moderator variables was not always reported in the original publications. For example, only a limited number of pairwise observations in the dataset were associated with data on CC biomass at the time of termination. Despite limited reporting, we found CC biomass at termination as the most important moderator regulating the overall CC response on multiple soil hydraulic properties. This point to specific data caveats that should be considered while collecting in-field measurements and ultimately publishing findings in similar research areas.
Author Contributions
Resham Thapa: Writing—review & editing, Writing—original draft, Visualization, Validation, Supervision, Software, Resources, Project administration, Methodology, Investigation, Funding acquisition, Formal analysis, Data curation, Conceptualization. Sabin Shrestha: Writing—original draft, Visualization, Methodology, Investigation, Formal analysis, Data curation, Conceptualization. Puja Sapkota: Writing—review & editing, Data curation. Jason de Koff: Writing—review & editing. Bharat Sharma Acharya: Writing—review & editing. Pokharel Bharat: Writing—review & editing.
Funding
Funding support for this study is received from the USDA Evans-Allen Grant Program (Accession No. 7004826), USDA-NIFA Capacity Building Grant (Award No. 2024–38821–42058), and USDA-NRCS Equity in Conservation Outreach Agreements (Award No. NR243A750003C100).
Acknowledgments
We appreciate the primary researchers whose work contributed to this meta-analysis.
Ethics declarations
None.
Consent for publication
All authors have agreed to the submission and publication of this manuscript.
Declaration of Competing Interest
The authors declare that they have no known competing financial interests or personal relationships that could have appeared to influence the work reported in this paper.
References
- Dabney SM, Delgado JA, Reeves DW. Using winter cover crops to improve soil and water quality. Communications in Soil Science and Plant Analysis. 2001;32(7–8):1221–1250. PAGE:STRING:ARTICLE/CHAPTER. [CrossRef]
- Fageria NK, Baligar VC, Bailey BA. Role of cover crops in improving soil and row crop productivity. Communications in Soil Science and Plant Analysis. 2005;36(19–20):2733–2757. REQUESTEDJOURNAL:JOURNAL:LCSS20;WGROUP:STRING:PUBLICATION. [CrossRef]
- Farmaha BS, Sekaran U, Franzluebbers AJ. Cover cropping and conservation tillage improve soil health in the southeastern United States. Agronomy Journal. 2022;114(1):296–316. [CrossRef]
- Kaye JP, Quemada M. Using cover crops to mitigate and adapt to climate change. A review. Agronomy for Sustainable Development. 2017;37(1):1–17. [CrossRef]
- Osipitan OA, Dille JA, Assefa Y, Radicetti E, Ayeni A, Knezevic SZ. Impact of cover crop management on level of weed suppression: A meta-analysis. Crop Science. 2019;59(3):833–842. WGROUP:STRING:PUBLICATION. [CrossRef]
- Basche AD, Kaspar TC, Archontoulis S V., Jaynes DB, Sauer TJ, Parkin TB, Miguez FE. Soil water improvements with the long-term use of a winter rye cover crop. Agricultural Water Management. 2016;172:40–50. [CrossRef]
- Delgado JA, Barrera Mosquera VH, Alwang JR, Villacis-Aveiga A, Cartagena Ayala YE, Neer D, Monar C, Escudero López LO. Potential use of cover crops for soil and water conservation, nutrient management, and climate change adaptation across the tropics. Advances in Agronomy. 2021;165:175–247. [CrossRef]
- Blanco-Canqui H. Cover crops and water quality. Agronomy Journal. 2018;110(5):1633–1647. SUBPAGE:STRING:FULL. [CrossRef]
- Thapa R, Poffenbarger H, Tully KL, Ackroyd VJ, Kramer M, Mirsky SB, Thapa R, Tully KL, Ackroyd VJ, Kramer M, et al. Biomass Production and Nitrogen Accumulation by Hairy Vetch-Cereal Rye Mixtures: A Meta-Analysis. Agron. J. 2009;110:1197–1208. [CrossRef]
- Marcillo GS, Thapa R, Mirsky SB, Martin N. The nitrogen value of cover crops: How much N can cover crops replace? Agricultural & Environmental Letters. 2024;9(2):e70006. [CrossRef]
- Hillel D. Environmental Soil Physics—1st Edition. No. of pages: 771 Language: English Copyright: © Academic Press 1998 Published: 31st August 1998 Imprint: Academic Press Hardcover ISBN: 9780123485250 eBook ISBN: 9780080544151. 1977:771.
- Bagnall DK, Morgan CLS, Bean G Mac, Liptzin D, Cappellazzi SB, Cope M, Greub KLH, Rieke EL, Norris CE, Tracy PW, et al. Selecting soil hydraulic properties as indicators of soil health: Measurement response to management and site characteristics. Soil Science Society of America Journal. 2022;86(5):1206–1226. [CrossRef]
- Indoria AK, Sharma KL, Reddy KS. Hydraulic properties of soil under warming climate. Climate Change and Soil Interactions. 2020 Jan 1:473–508. [CrossRef]
- Gabriel JL, García-González I, Quemada M, Martin-Lammerding D, Alonso-Ayuso M, Hontoria C. Cover crops reduce soil resistance to penetration by preserving soil surface water content. Geoderma. 2021;386:114911. [CrossRef]
- Singh N, Kumar S, Jin VL, Schneider S. Short-term soil physical responses to grazing and cover crops in an integrated crop-livestock agroecosystem. Journal of Soil and Water Conservation. 2022;77(5):516–527. [CrossRef]
- Nouri A, Lee J, Yin X, Tyler DD, Saxton AM. Thirty-four years of no-tillage and cover crops improve soil quality and increase cotton yield in Alfisols, Southeastern USA. Geoderma. 2019;337:998–1008. [CrossRef]
- Sindelar M, Blanco-Canqui H, Jin VL, Ferguson R. Cover Crops and Corn Residue Removal: Impacts on Soil Hydraulic Properties and Their Relationships with Carbon. Soil Science Society of America Journal. 2019;83(1):221–231. [CrossRef]
- Irmak S, Sharma V, Mohammed AT, Djaman K. Impacts of Cover Crops on Soil Physical Properties: Field Capacity, Permanent Wilting Point, Soil-Water Holding Capacity, Bulk Density, Hydraulic Conductivity, and Infiltration. Transactions of the ASABE. 2018;61(4):1307–1321. [CrossRef]
- Shrestha S, Sapkota P, Acharya BS, de Koff J, Pokharel B, Thapa R. Cover crop functional groups and performance moderate improvements in soil hydrology: A global meta-analysis. Agriculture, Ecosystems and Environment. 2026;411(June):110594. [CrossRef]
- Jian J, Du X, Stewart RD. A database for global soil health assessment. Scientific Data. 2020;7(1). [CrossRef]
- Basche, DeLonge. The Impact of Continuous Living Cover on Soil Hydrologic Properties: A Meta-Analysis. Soil Science Society of America Journal. 2017;81(5):1179–1190. [CrossRef]
- Haruna SI, Anderson SH, Udawatta RP, Gantzer CJ, Phillips NC, Cui S, Gao Y. Improving soil physical properties through the use of cover crops: A review. Agrosystems, Geosciences & Environment. 2020;3(1):e20105. [CrossRef]
Figure 1.
Conceptual diagram illustrates the multiple inter-connected mechanisms or pathways by which cover crops improve soil hydraulic properties and functioning (created by Dr. Thapa using BioRender).
Figure 1.
Conceptual diagram illustrates the multiple inter-connected mechanisms or pathways by which cover crops improve soil hydraulic properties and functioning (created by Dr. Thapa using BioRender).
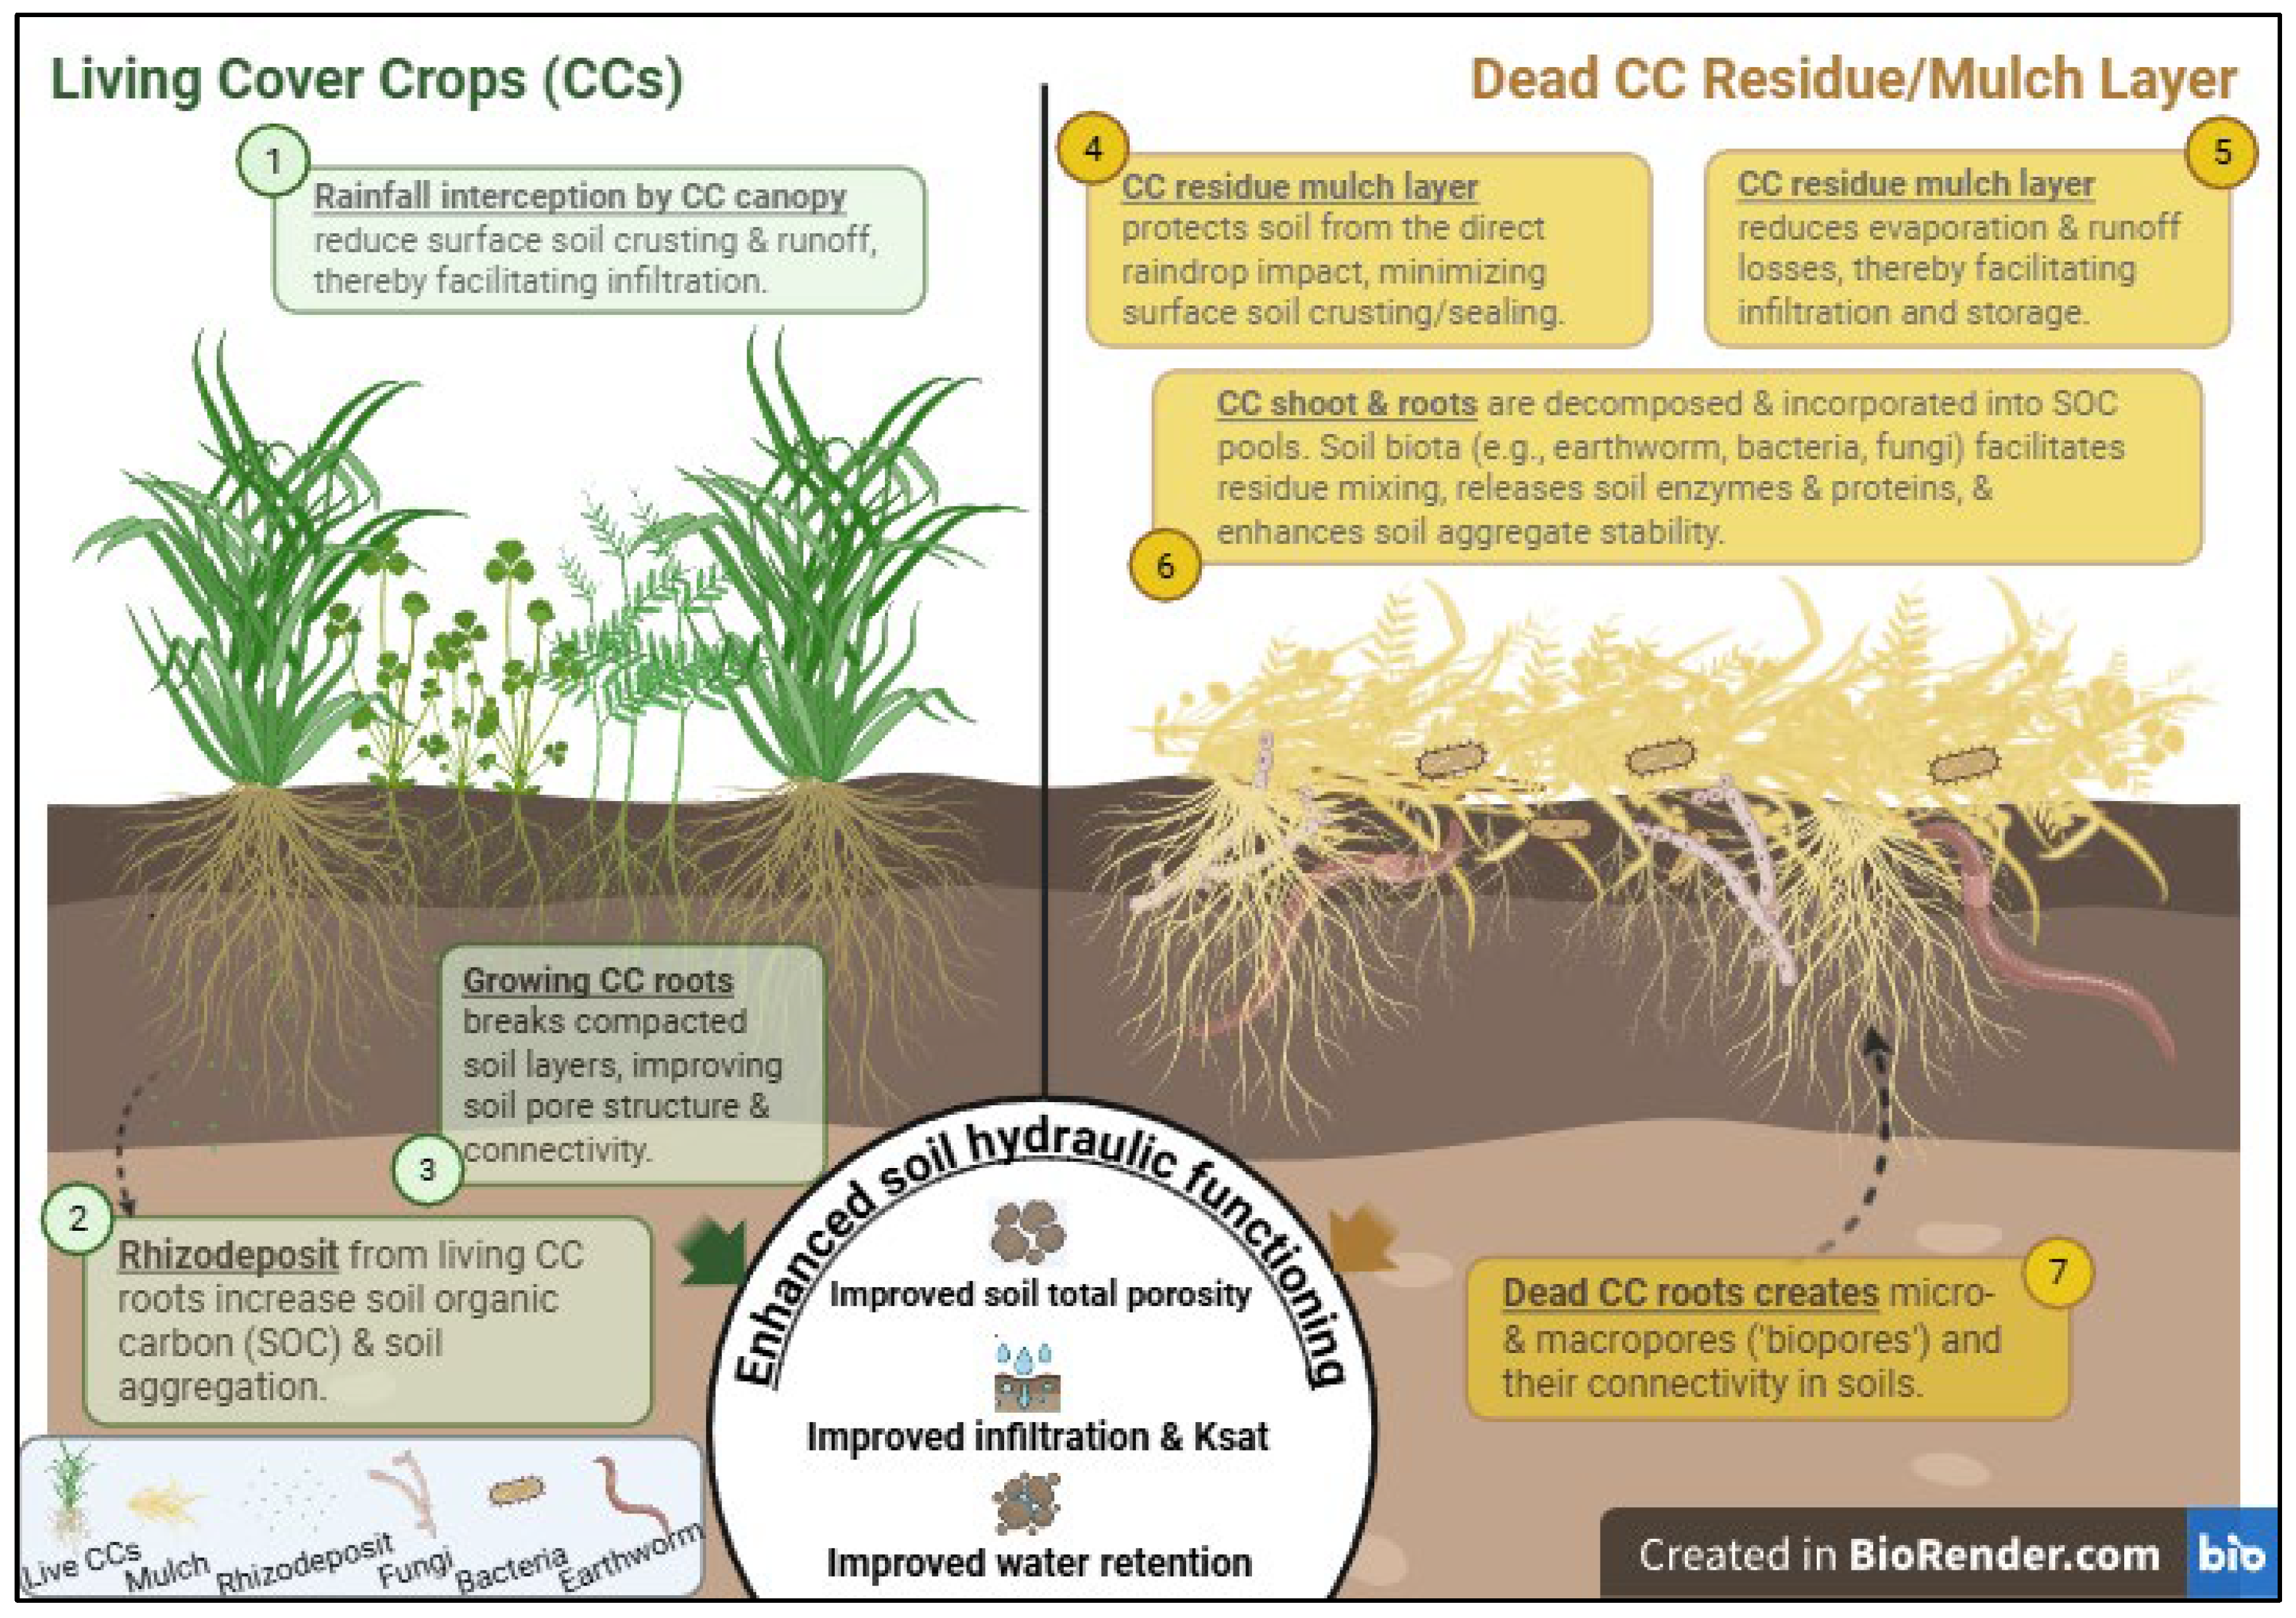
Figure 2.
The right panel shows the geographical distribution of studies investigating cover crop (CC) effects on each of the six soil hydraulic properties: a) Total porosity (TP); b) Infiltration rate (IR); c) Saturated hydraulic conductivity (Ksat); d) Water content at ield capacity (FC); e) Water content at permanent wilting points (PWP); and f) Available water holding capacity (AWHC). The middle panels show the relative distributions of studies grouped by continents. The left panels show the relative distributions of studies overlaid over the soil textural triangle diagram.
Figure 2.
The right panel shows the geographical distribution of studies investigating cover crop (CC) effects on each of the six soil hydraulic properties: a) Total porosity (TP); b) Infiltration rate (IR); c) Saturated hydraulic conductivity (Ksat); d) Water content at ield capacity (FC); e) Water content at permanent wilting points (PWP); and f) Available water holding capacity (AWHC). The middle panels show the relative distributions of studies grouped by continents. The left panels show the relative distributions of studies overlaid over the soil textural triangle diagram.
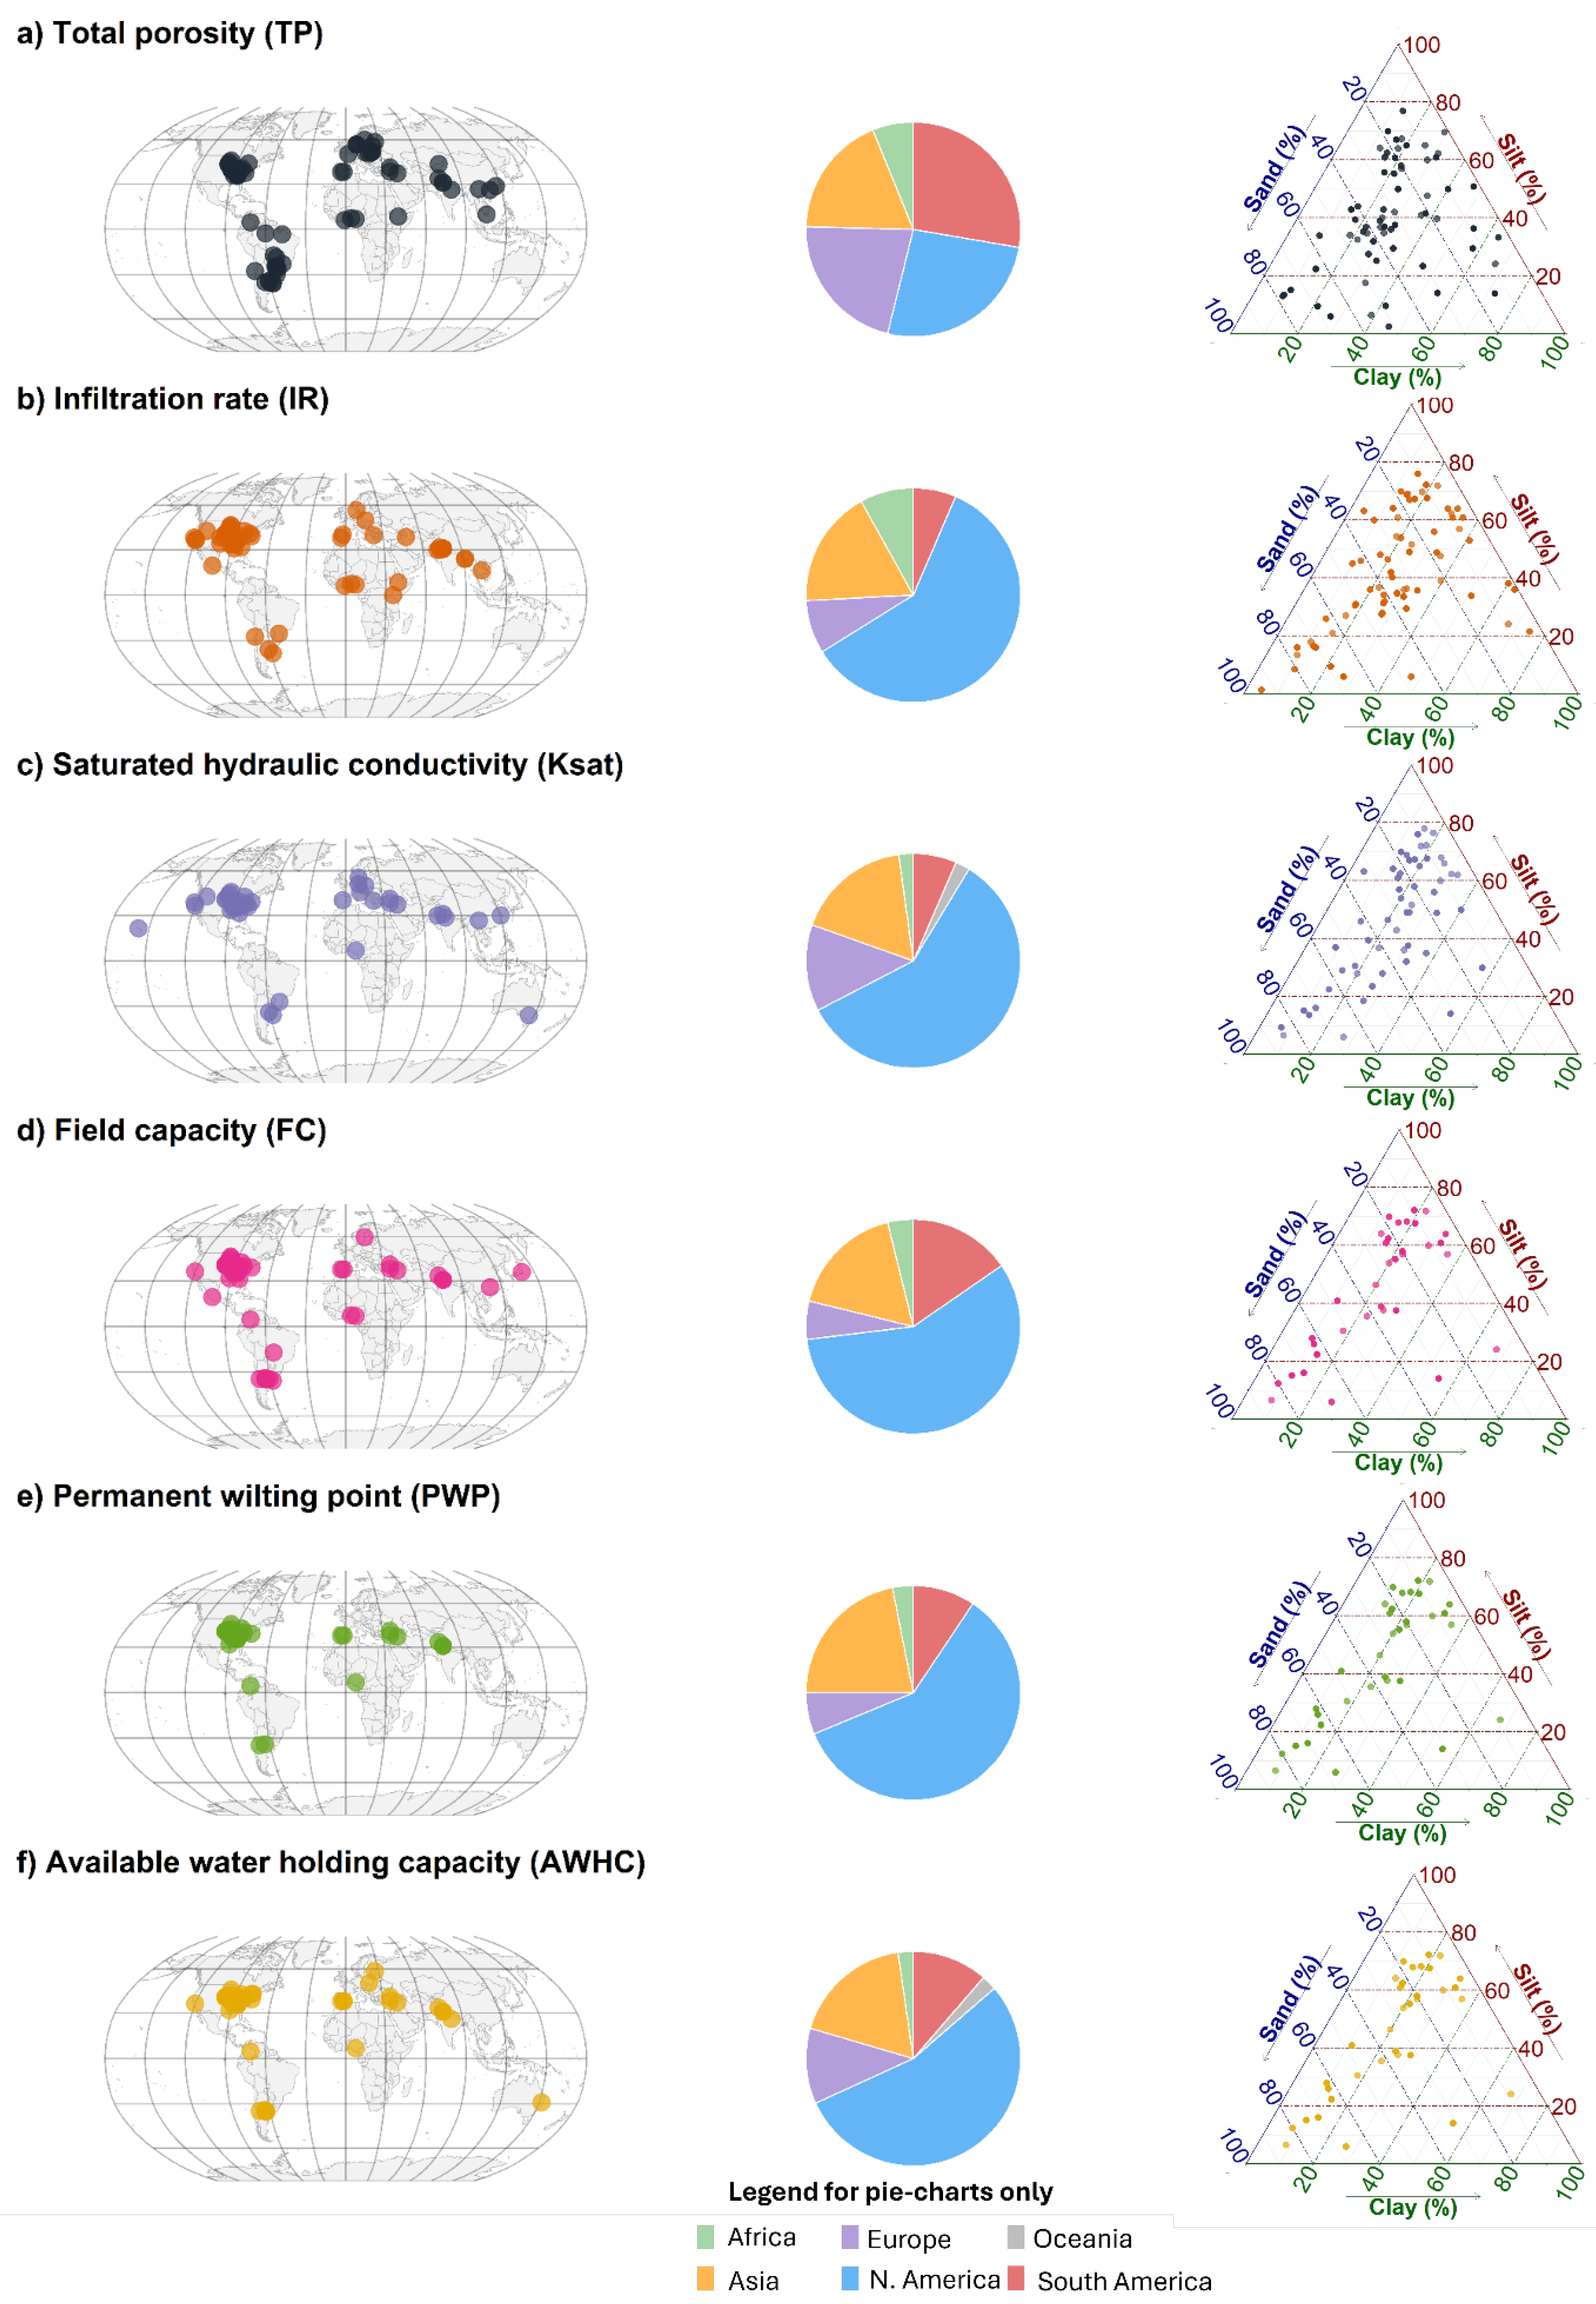
Figure 3.
The box and whisker plots showing the distributions of reported data for each of the six soil hydraulic properties for both cover crop (CC) and no-CC control groups: a) Total porosity (TP); b) Infiltration rate (IR); c) Saturated hydraulic conductivity (Ksat); d) Water content at field capacity (FC); e) Water content at permanent wilting points (PWP); and f) Available water holding capacity (AWHC).
Figure 3.
The box and whisker plots showing the distributions of reported data for each of the six soil hydraulic properties for both cover crop (CC) and no-CC control groups: a) Total porosity (TP); b) Infiltration rate (IR); c) Saturated hydraulic conductivity (Ksat); d) Water content at field capacity (FC); e) Water content at permanent wilting points (PWP); and f) Available water holding capacity (AWHC).
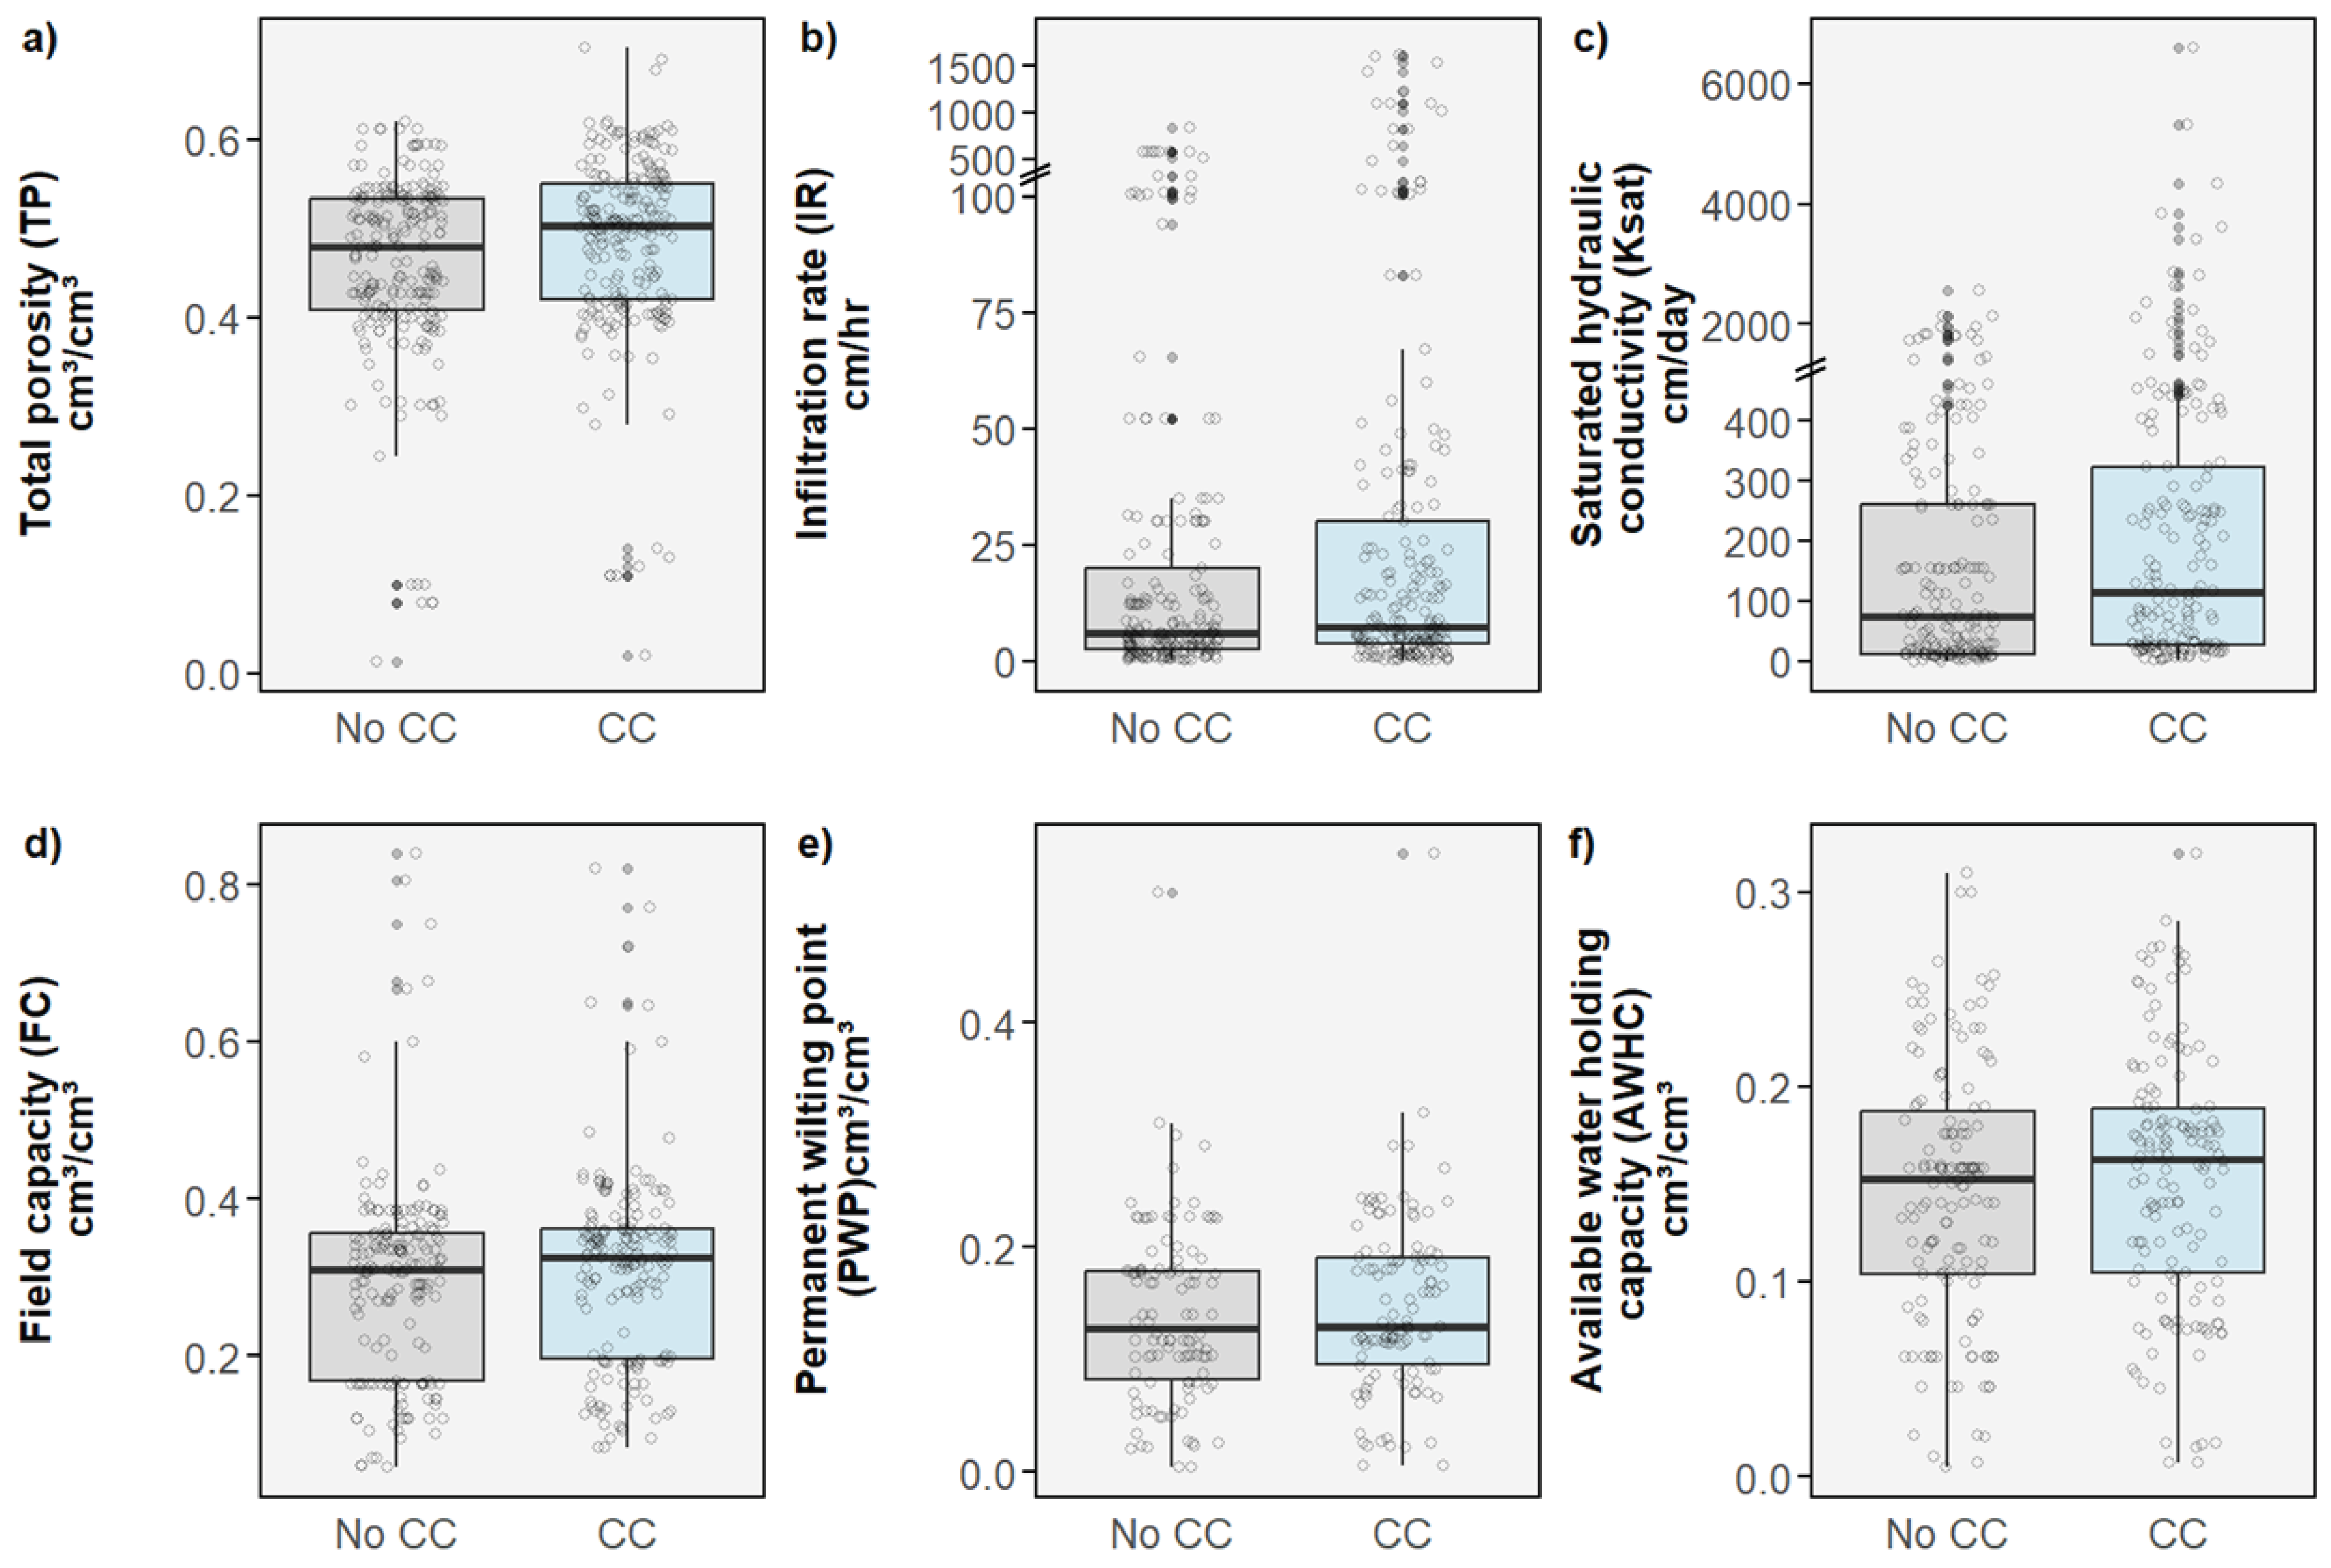
Figure 4.
Relative effects of cover crops (CCs) compared to no-CC controls on: a) Total porosity (TP); b) Infiltration rate (IR); c) Saturated hydraulic conductivity (Ksat); d) Water retention at field capacity (FC); e) Water retention at permanent wilting points (PWP); and f) Available water holding capacity (AWHC). The solid lines (—) represent the linear regression fits between the response value for the CC and no-CC control groups. The red dashed lines (--) represent the 1:1 relationship where the response value would be same for the CC and no-CC control groups.
Figure 4.
Relative effects of cover crops (CCs) compared to no-CC controls on: a) Total porosity (TP); b) Infiltration rate (IR); c) Saturated hydraulic conductivity (Ksat); d) Water retention at field capacity (FC); e) Water retention at permanent wilting points (PWP); and f) Available water holding capacity (AWHC). The solid lines (—) represent the linear regression fits between the response value for the CC and no-CC control groups. The red dashed lines (--) represent the 1:1 relationship where the response value would be same for the CC and no-CC control groups.
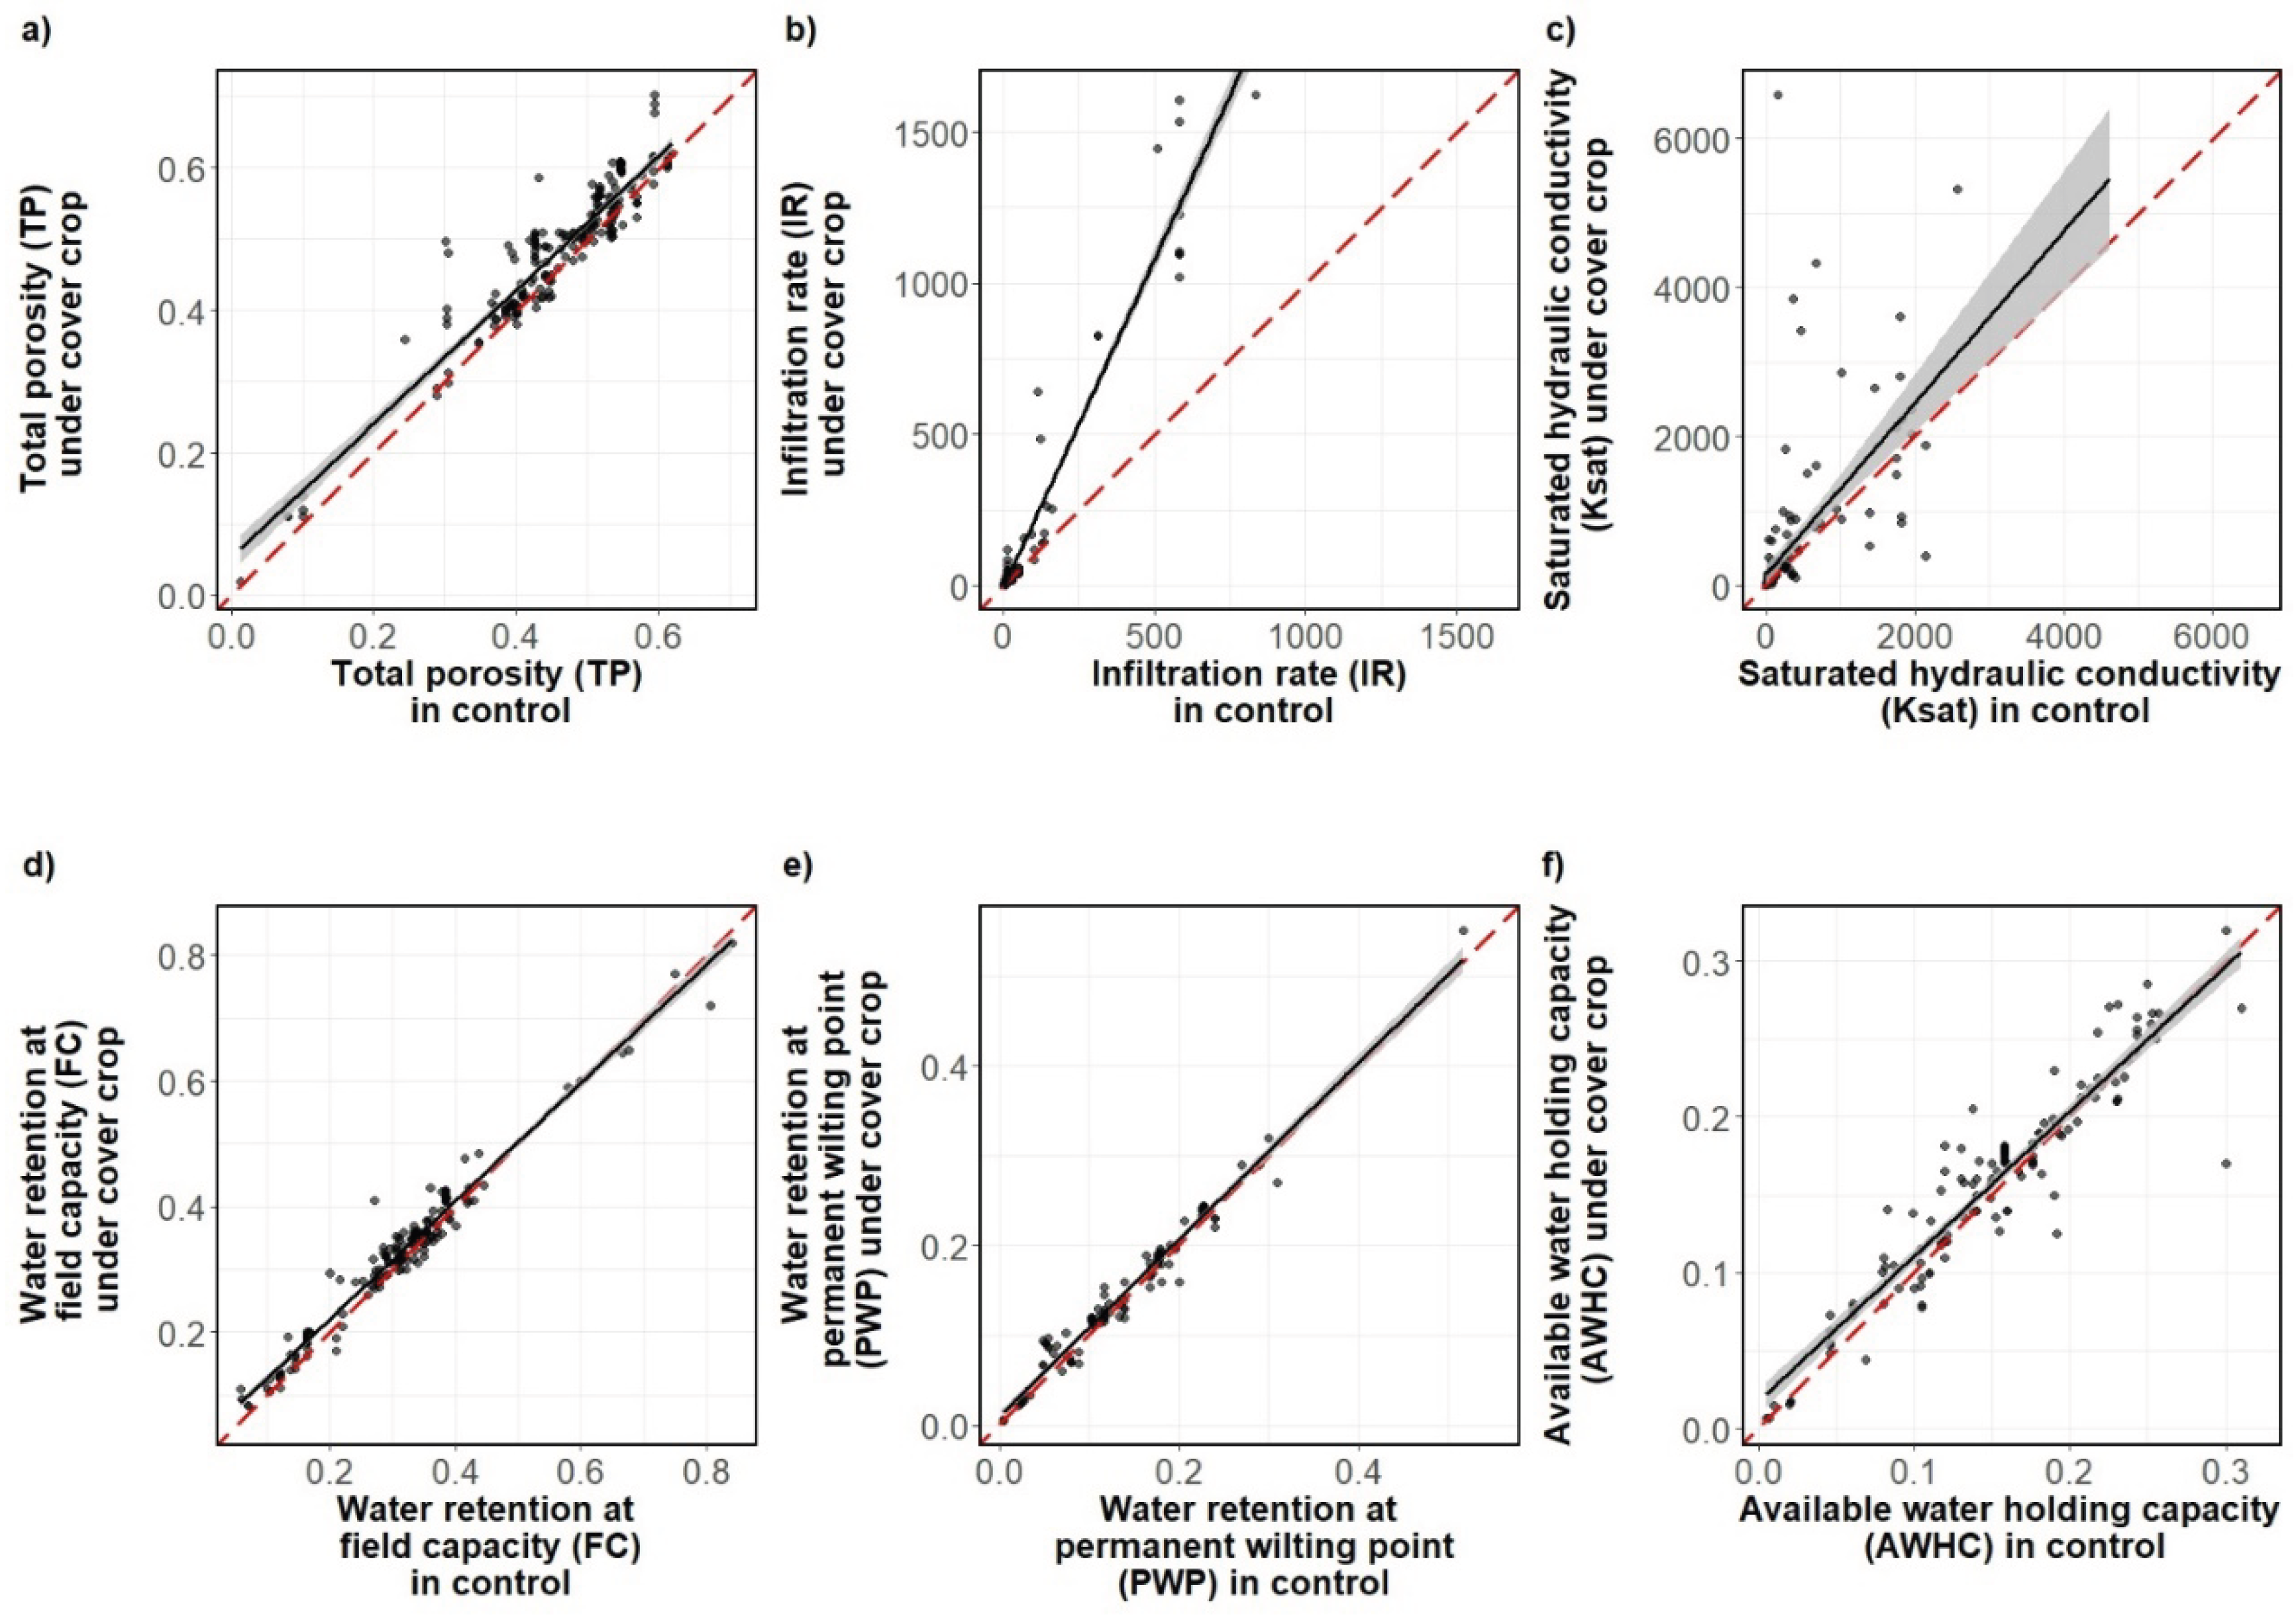
Figure 5.
Pearson correlation analysis among effect sizes (i.e., log response ratio) depicting cover crop (CC) effects on soil hydraulic properties. Diagonal panels show density distributions of effect sizes for each property. Upper triangle panel displays scatter plots with a regression line (black line). Lower triangle panel shows Pearson correlation coefficients with significance levels indicated by asterisks (* p < 0.05, ** p < 0.01, *** p < 0.001). TP = Total porosity, IR = Infiltration rate, Ksat = Saturated hydraulic conductivity, FC = Water retention at field capacity, PWP = Water retention at permanent wilting points, AWHC = Available water holding capacity.
Figure 5.
Pearson correlation analysis among effect sizes (i.e., log response ratio) depicting cover crop (CC) effects on soil hydraulic properties. Diagonal panels show density distributions of effect sizes for each property. Upper triangle panel displays scatter plots with a regression line (black line). Lower triangle panel shows Pearson correlation coefficients with significance levels indicated by asterisks (* p < 0.05, ** p < 0.01, *** p < 0.001). TP = Total porosity, IR = Infiltration rate, Ksat = Saturated hydraulic conductivity, FC = Water retention at field capacity, PWP = Water retention at permanent wilting points, AWHC = Available water holding capacity.
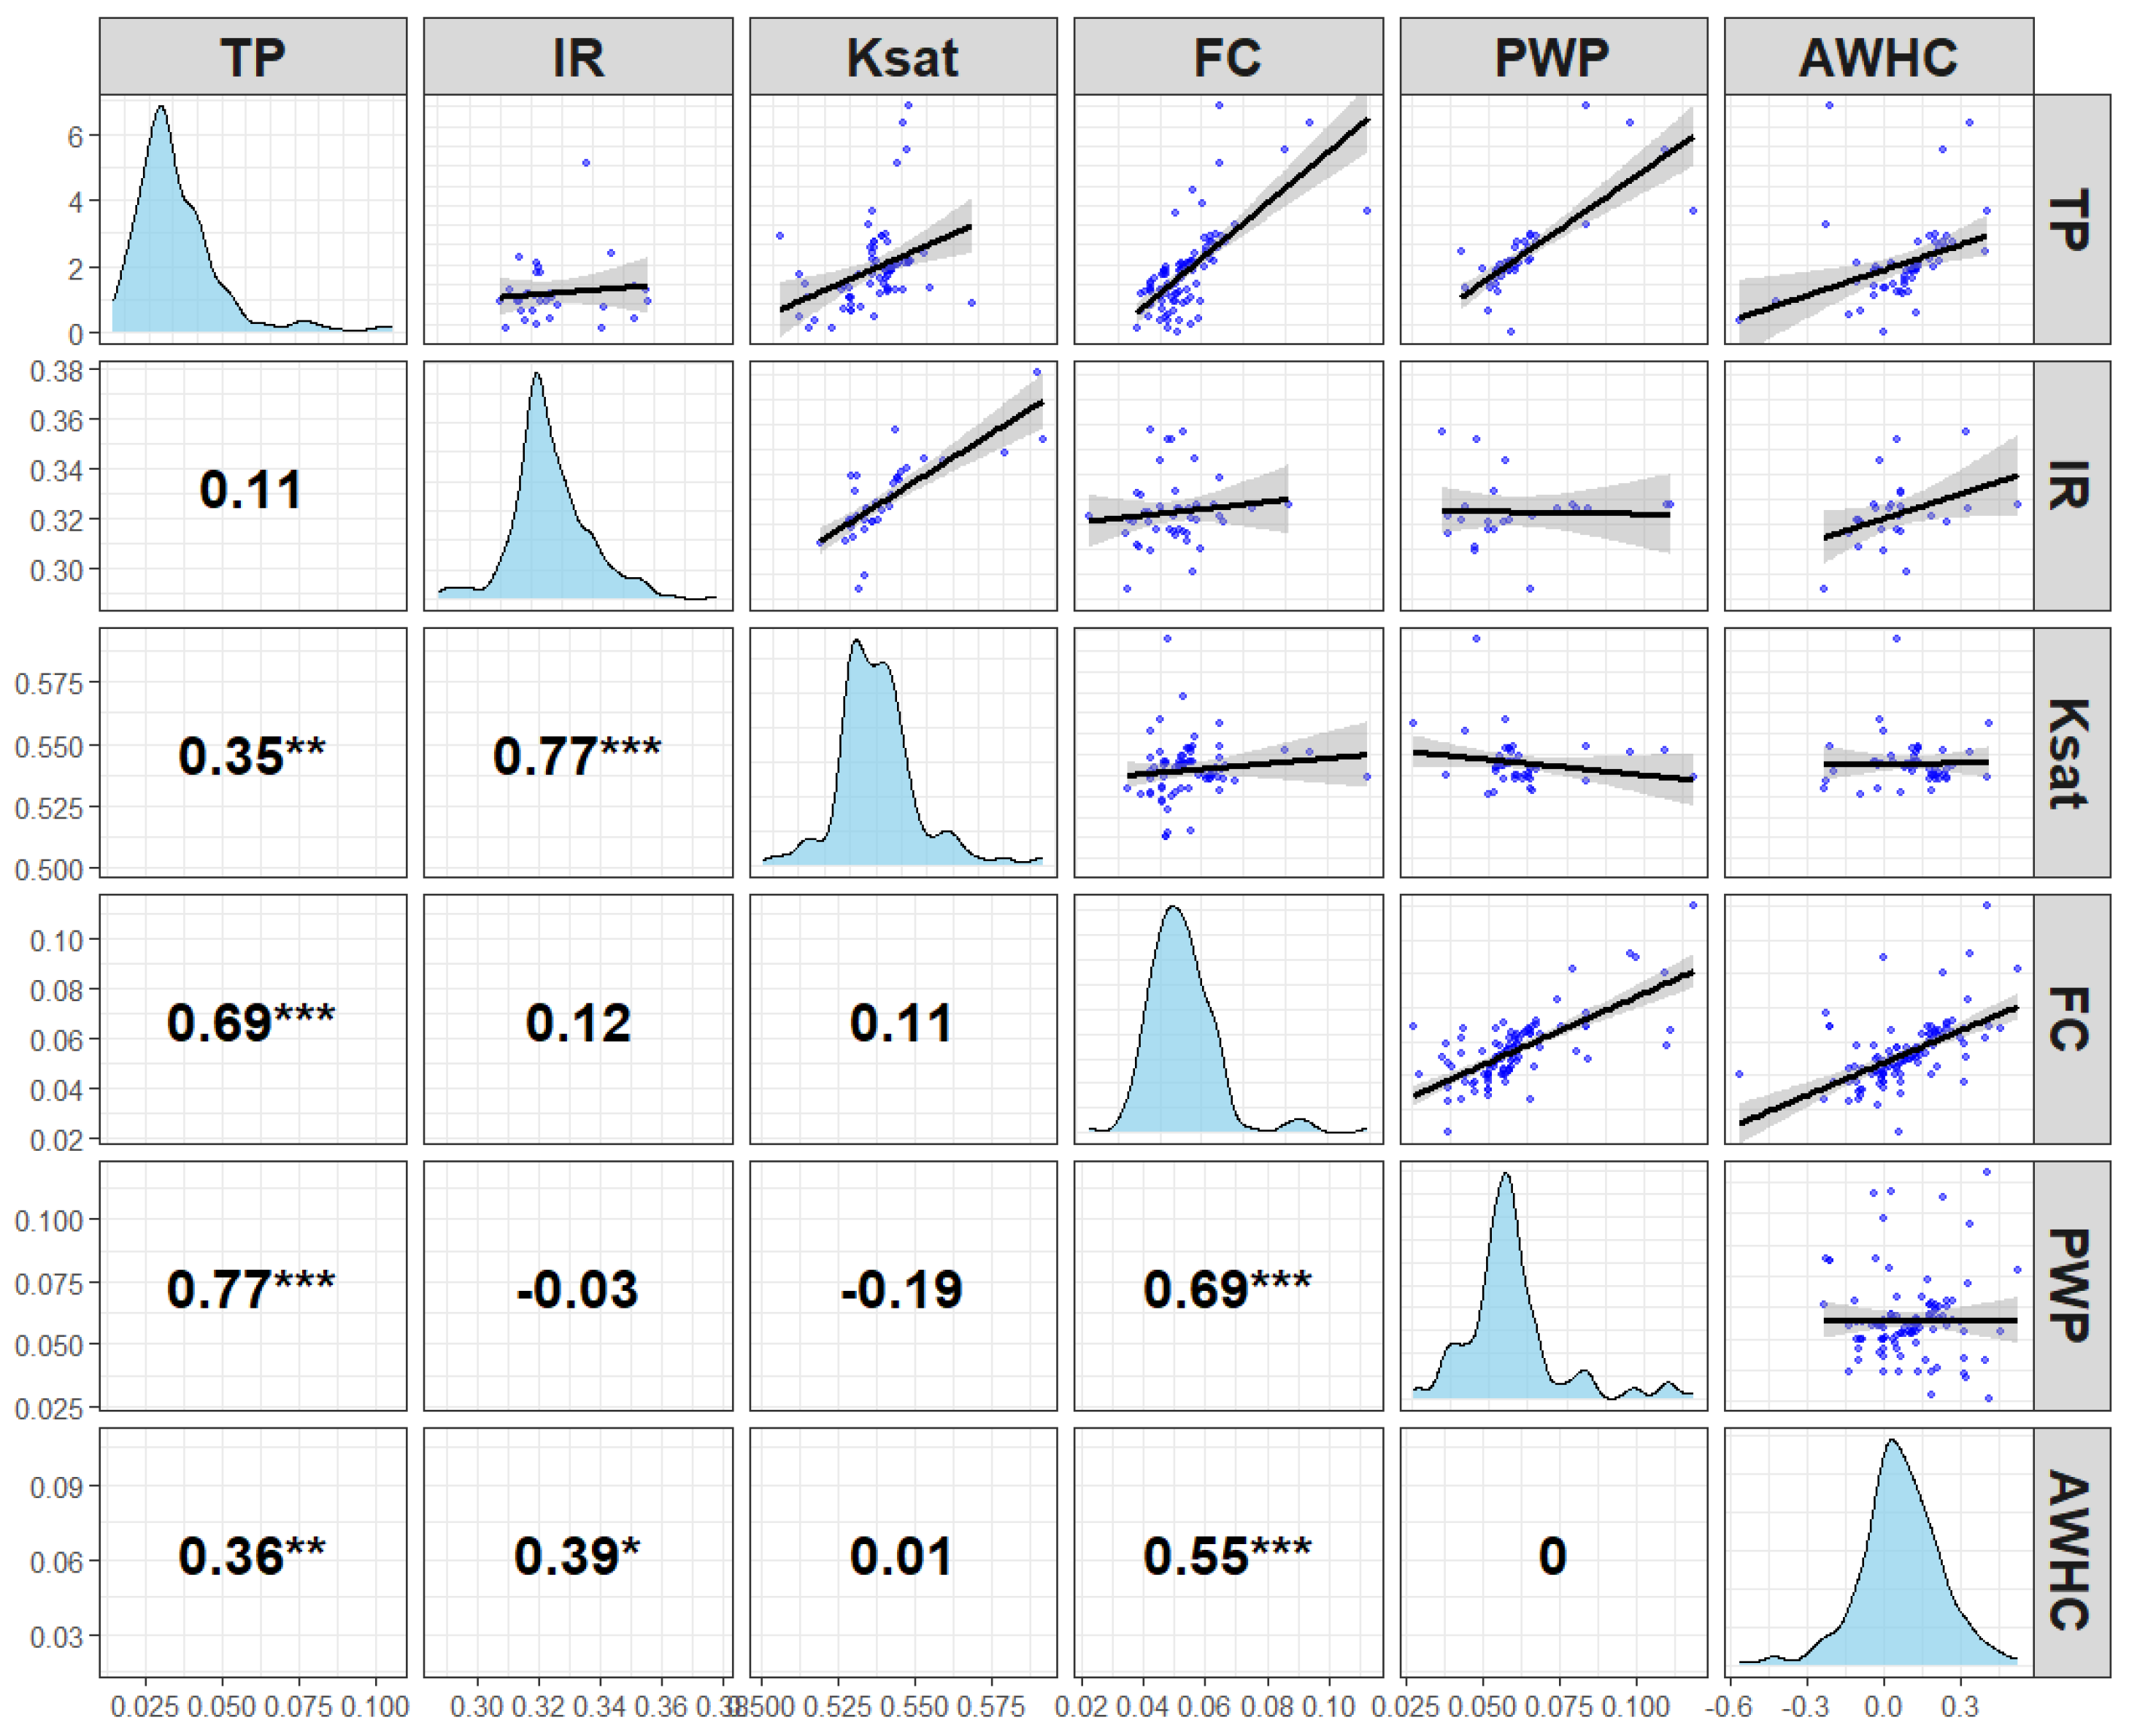
Figure 6.
Flow-diagram depicting the Preferred Reporting Items for Systematic Reviews and Meta-Analyses (PRISMA) guidelines adopted to perform comprehensive screening and inclusion of articles in the final metadata.
Figure 6.
Flow-diagram depicting the Preferred Reporting Items for Systematic Reviews and Meta-Analyses (PRISMA) guidelines adopted to perform comprehensive screening and inclusion of articles in the final metadata.
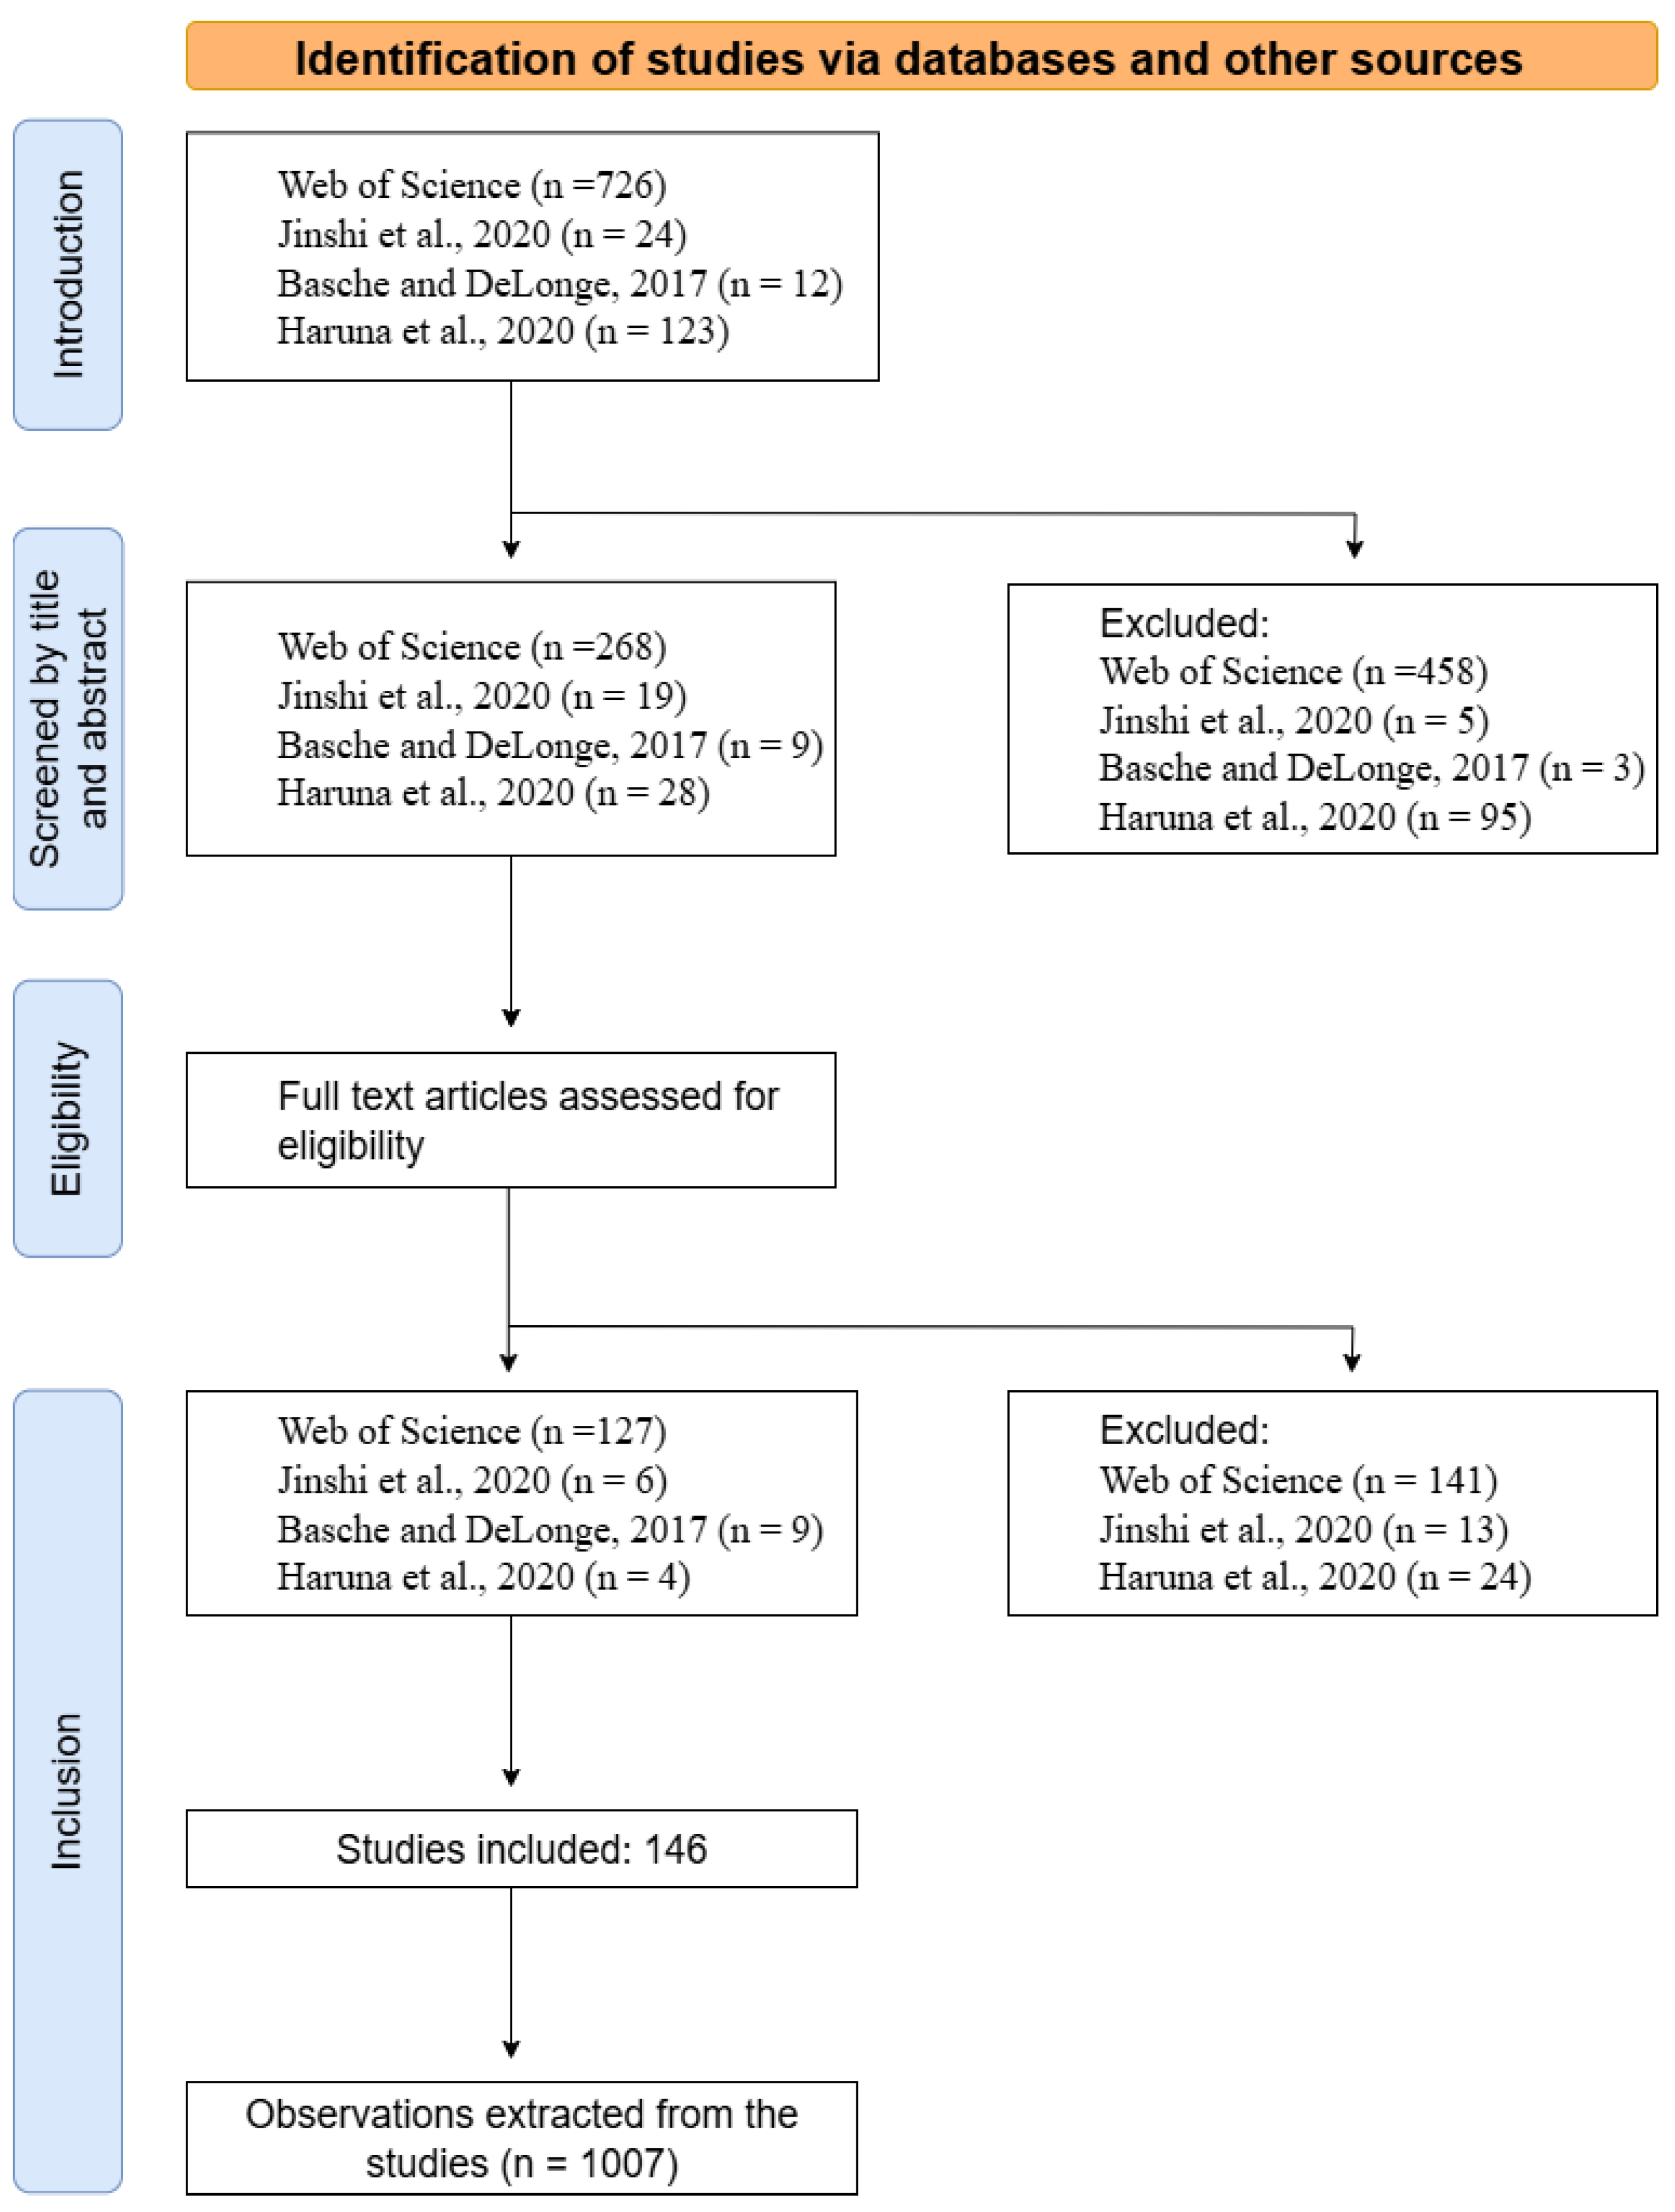

Table 1.
Description of column names and abbreviations used in the metadata.
| Column names | Description |
| A. Bibliographic variables | |
| study_id | Unique identifier assigned to each study. |
| site_year | Unique identifier representing each experimental site by year combination. |
| common_control | Unique identifier representing multiple CC treatments sharing the same common no-CC control group for each site-year |
| doi | Digital object identifier for the studies included. |
| author_year | First author of the publication followed by publication year. |
| B. Geographic variables | |
| site | Location of the experiment site. |
| country | Country of the experimental site. |
| continent | Continent of the experimental site: Africa, Asia, Europe, North America, Oceania, and South America. |
| latitude | Angular distance North/South in decimal degrees. |
| longitude | Angular distance East/West in decimal degrees. |
| C. Soil variables | |
| soil_BD | Soil bulk density in g cm−3. |
| sand_% | Fraction of sand in %. |
| silt_% | Fraction of silt in %. |
| clay_% | Fraction of clay in %. |
| texture | Soil textural class based on relative proportions of sand, silt, and clay (e.g., sandy loam, clayey, silt loam, etc.) |
| textural_category | Broad soil textural categories: Fine, Medium, and Coarse |
| soc_initial | The initial soil organic carbon content at the experimental site in %. |
| soil_data_source | Source of the soil data included: Reported; SSURGO API for US locations; ISRIC SoilGrids Rest API for non-US locations. |
| D. Climate variables | |
| kgc_climateZ | Climate zone classes for the experimental site based on Köppen -Geiger climate zone classification (e.g., Aw, Af, As, etc.) |
| ClimateZ | Climate zone of the experimental site based on Köppen -Geiger climate zone classification: Cold or continental; Dry; Temperate; and Tropical. |
| MAT_C | Mean annual temperature of the experimental site in °C |
| MAP_mm | Mean annual precipitation of the experimental site in mm. |
| climate_data_source | Source of the climate data included: Reported; PRISM Climate Data for US locations; WorldClim v 2.1 Climate Data for non-US locations. |
| E. Management variables | |
| CC_species | Name of the cover crop species studied. |
| CC_group | CC functional groups or types categorized into grass, legume, broadleaf, or mixtures. |
| cash_crop | Cash crop(s) that are grown in rotation with the cover crop. |
| crop_rotation | Type of crop rotation practiced in the study site. |
| tillage_type | Specific tillage type practiced in the study (e.g., no-tillage, disk harrow, chisel, moldboard plough, etc.) |
| tillage_category | Broad tillage categories: Conservation (reduced or no-till) and Conventional. |
| CC_biomass_kgha | Cover crop shoot biomass at termination in kg ha−1. |
| CC_termination | Cover crop termination method categorizes: Chemical; Mechanical; Frost; and Integrated. |
| CC_residue_fate | Fate of CC residue following termination: Surface; Incorporated; and Removed. |
| CC_years | Years of cover cropping at the experimental site at the time of measurements |
| F. Other ancillary variables | |
| sample_depth | The uppermost soil sampling depth in cm in which the soil hydraulic measurements were conducted. |
| sample_size | Number of samples used to calculate the reported mean values. |
| rep | Number of replications used in the experiment. |
| exp_design | Experimental design |
| G. Response variables: 1. Total Porosity (TP) | |
| TP_mean_NCC | Mean of total porosity in the no-CC control treatment. |
| TP_mean_CC | Mean of total porosity in the CC treatment. |
| TP_SD_NCC | Standard deviation of total porosity in the no-CC control treatment. |
| TP_SD_CC | Standard deviation of total porosity in the CC treatment. |
| TP_SD_impute | Denote whether standard deviations were reported or imputed via bootstrapping. |
| TP_units | Unit of total porosity in cm3cm−3. |
| G. Response variables: 2. Infiltration Rate (IR) | |
| IR_mean_NCC | Mean of infiltration rate in the no-CC control treatment. |
| IR_mean_CC | Mean of infiltration rate in the CC treatment. |
| IR_SD_NCC | Standard deviation of infiltration rate in the no-CC control treatment. |
| IR_SD_CC | Standard deviation of infiltration rate in the CC treatment. |
| IR_SD_impute | Denote whether standard deviations were reported or imputed via bootstrapping. |
| IR_units | Unit of infiltration rate in cmhr−1. |
| G. Response variables: 3. Saturated hydraulic conductivity (Ksat) | |
| Ksat_mean_NCC | Mean of Ksat in the no-CC control treatment. |
| Ksat_mean_CC | Mean of Ksat in the CC treatment. |
| Ksat_SD_NCC | Standard deviation of Ksat in the no-CC control treatment. |
| Ksat_SD_CC | Standard deviation of Ksat in the CC treatment. |
| Ksat_SD_impute | Denote whether standard deviations were reported or imputed via bootstrapping. |
| Ksat_units | Unit of Ksat in cmday−1. |
| G. Response variables: 4. Water retention at Field Capacity (FC) | |
| FC_mean_NCC | Mean of FC in the no-CC control treatment. |
| FC_mean_CC | Mean of FC in the CC treatment. |
| FC_SD_NCC | Standard deviation of FC in the no-CC control treatment. |
| FC_SD_CC | Standard deviation of FC in the CC treatment. |
| FC_SD_impute | Denote whether standard deviations were reported or imputed via bootstrapping. |
| FC_units | Unit of FC in cm3cm−3. |
| G. Response variables: 5. Water retention at Permanent Wilting Points (PWP) | |
| PWP_mean_NCC | Mean of PWP in the no-CC control treatment. |
| PWP_mean_CC | Mean of PWP in the CC treatment. |
| PWP_SD_NCC | Standard deviation of PWP in the CC treatment. |
| PWP_SD_CC | Standard deviation of PWP in the CC treatment. |
| PWP_SD_impute | Denote whether standard deviations were reported or imputed via bootstrapping. |
| PWP_units | Unit of PWP in cm3cm−3. |
| G. Response variables: 6. Available Water Holding Capacity (AWHC) | |
| AWHC_mean_NCC | Mean of AWHC in the no-CC control treatment. |
| AWHC_mean_CC | Mean of AWHC in the CC treatment. |
| AWHC_SD_NCC | Standard deviation of AWHC in the CC treatment. |
| AWHC_SD_CC | Standard deviation of AWHC in the CC treatment. |
| AWHC_SD_impute | Denote whether standard deviations were reported or imputed via bootstrapping. |
| AWHC_units | Unit of AWHC in cm3cm−3. |
Table 2.
Terms used for comprehensive literature search in the ISI Web of Science database.
| Intervention terms | Boolean operator | Outcome terms |
| “Porosity” OR “hydraulic conductivity” OR “infiltration” OR “field capacity” OR “permanent wilting” OR “water retention” OR “moisture retention” OR “available water holding capacity” | AND | “Cover crop*” OR “green manure*” OR “catch crop*” |
Table 3.
Eligibility and inclusion criteria for articles included in the final metadata.
| S. No. | Inclusion criteria | Exclusion criteria |
| 1. | Field-based studies. | Greenhouse or model-based simulation studies. |
| 2. | Consists of both CC and no-CC control groups. | Consists only of multiple CC groups. |
| 3. | Reported data for at least one of six response variables: total porosity, infiltration rate, saturated hydraulic conductivity, water retention at field capacity and permanent wilting points, and available water holding capacity. | No data reported for soil hydraulic properties |
| 4. | Both CC and no-CC treatment groups are under the same management. | Differing management. |
| 5. | CCs were raised and terminated in the same place. | CC residues introduced into experimental plots from other sources. |
| 6. | Published in English language. | Published in other languages. |
Table 4.
Factor levels or classes used for each categorical moderator variable in the metadata.
| Class | Definition/Description |
| Soil textural category | |
| Fine | Clay, sandy clay, silty clay, sandy clay loam, silty clay loam, clay loam |
| Medium | Silt, silt loam, loam |
| Coarse | Sand, loamy sand, sandy loam |
| Köppen–Geiger climate zone classification | |
| Cold or Continental | Dfa, Dfb, Dsa |
| Dry | BWh, BWk, BSh, BSk |
| Temperate | Cfa, Cfb, Cfc, Cwa, Cwb, Cwc, Csa, Csb, Csc |
| Tropical | Aw, Af, Am, As |
| Cover crop functional groups or types | |
| Legume | Leguminous species (e.g., crimson clover, hairy vetch, australian winter pea, sun hemp, mimosa, mucuna, Stylosanthes, Sesbania, berseem clover, beans) |
| Grass | Grass (e.g., cereal rye, oats, winter wheat, broomgrass, millet, sorghum sudan grass, winter barley) |
| Broadleaf | Non-legume broadleaf species (e.g., radish, buckwheat, turnip, mustard, Phacelia) |
| Mixture | Any combination of legume, grass, and broadleaf species |
| CC residue fate following termination | |
| Surface-mulched | Cover crop residues left on the soil surface after termination, including both mulched and standing CC residues. |
| Incorporated | Cover crop residues ploughed into the soil. |
| Removed | Cover crop residues removed from the field after termination. |
| Averaged | When the response data is averaged across different CC residue fates. |
| Tillage type | |
| Conservation | No-tillage: No mechanical disturbance of soil |
| Reduced tillage: minimal disturbance, including disk, harrow, chisel, rototiller, and strip tillage | |
| Conventional tillage | Full soil inversion: moldboard plough |
| Averaged | When the response data is averaged across different tillage methods. |
| CC termination method | |
| Chemical | Use of herbicides for CC termination, e.g., glyphosate, 2,4-D. |
| Mechanical | Use of roller crimper for CC termination. |
| Frost | Frost killing of CCs. |
| Integrated | Use of multiple methods for CC termination |
| Averaged | When the response data is averaged across different termination methods. |
Disclaimer/Publisher’s Note: The statements, opinions and data contained in all publications are solely those of the individual author(s) and contributor(s) and not of MDPI and/or the editor(s). MDPI and/or the editor(s) disclaim responsibility for any injury to people or property resulting from any ideas, methods, instructions or products referred to in the content. |
© 2026 by the authors. Licensee MDPI, Basel, Switzerland. This article is an open access article distributed under the terms and conditions of the Creative Commons Attribution (CC BY) license (http://creativecommons.org/licenses/by/4.0/).
Copyright: This open access article is published under a Creative Commons CC BY 4.0 license, which permit the free download, distribution, and reuse, provided that the author and preprint are cited in any reuse.