

Submitted:
25 June 2026
Posted:
26 June 2026
You are already at the latest version
Abstract
The European Union has emerged as the world’s leading region in green bond issuance, yet market development across Member States remains markedly uneven. This article investigates the factors underlying these differences by distinguishing between two dimensions: entry into the sovereign green bond market and the depth of the green debt market as a whole. Using a balanced panel of the EU-27 for 2021–2025, constructed from ECB Securities Issues Statistics (CSEC) and Eurostat data, market entry is modelled using a Probit specification, while market depth is examined using a Tobit specification that accounts for countries remaining outside the market. The results show that the two dimensions are driven by different factors. Sovereign market entry is associated primarily with economic scale, whereas the fiscal position has no detectable effect on participation. Market depth, by contrast, is associated not only with economic scale but also with a stronger budget balance, suggesting that green debt markets deepen where fiscal credibility already exists rather than serving as a substitute for it. No statistically significant negative relationship is identified between environmental taxation and green debt market depth, providing no evidence of substitution and remaining consistent with the use of the two instruments as distinct and potentially parallel policy tools. The principal policy implication is that efforts should focus on reducing market-entry costs and strengthening institutional capacity in smaller Member States.
Keywords:
green bonds
; sovereign debt
; fiscal sustainability
; environmental taxes
; green finance
; EU-27
; Probit
; Tobit
; capital markets
; green transition
1. Introduction
The European Union’s green transition requires investment on a scale that public budgets alone cannot provide. The European Green Deal itself emphasises the need to mobilise both public and private financial resources in order to achieve the Union’s climate objectives (European Commission, 2019). Green bonds are debt securities whose proceeds are earmarked for environmental and climate-related projects, thereby combining market-based financing with the targeted allocation of capital to sustainable investments (Fatica et al., 2021; Flammer, 2021). They have consequently become one of the principal instruments for directing private capital towards the green transition.
Europe has emerged as the leading global region in green bond issuance (Climate Bonds Initiative, 2026). This development has been supported by a clearly defined policy and regulatory framework, including the European Green Deal, the EU Taxonomy for sustainable activities, and the European Green Bond Standard. Together, these initiatives seek to enhance transparency and comparability and to reduce the risk of greenwashing (European Commission, 2019; European Parliament & Council of the European Union, 2020, 2023).
The market has expanded rapidly. The outstanding stock of green debt securities issued by EU-27 residents increased more than fourfold over a five-year period. By April 2026, it was approaching EUR 1.3 trillion, according to the authors’ calculations based on European Central Bank data (European Central Bank [ECB], 2026). The market now encompasses sovereign, banking, and corporate issuers.
This overall success, however, conceals a considerable imbalance. A relatively small group of Member States accounts for the majority of outstanding green debt. In the most developed national markets, outstanding green debt securities exceed 10% of gross domestic product (authors’ calculations based on ECB, 2026; Eurostat, 2026c). At the same time, participation by several Member States remains highly limited, while some countries have yet to develop a meaningful green debt market. Approximately half of the Member States have never issued a sovereign green bond. The central question is therefore no longer whether green bonds are important for financing the green transition—they clearly are—but why some countries participate actively whereas others remain on the periphery of the market.
This question is closely related to fiscal sustainability. Green bonds constitute debt, and their issuance is embedded in the broader sovereign debt-management policy of each country. The nature of the relationship between green bond issuance and fiscal sustainability is not self-evident. Green issuance may represent an alternative financing channel for fiscally constrained governments seeking less expensive or more diversified sources of funding. Conversely, it may be primarily accessible to fiscally stable issuers whose credibility supports investor demand.
It is also unclear whether green debt complements or substitutes for other green policy instruments, particularly environmental taxation. Understanding these relationships is important for the design of European policy, especially if the green bond market is expected to support the transition in all Member States rather than only in the largest and wealthiest economies.
Trust and external verification are particularly important in this market. Empirical evidence indicates that the green characteristics of a bond are not assessed independently of issuer quality, information concerning the use of proceeds, and external verification mechanisms. Fatica et al. (2021) find that the pricing effects associated with green bonds depend on the type of issuer, the presence of an external review, and repeated access to the market. Hyun et al. (2020) similarly demonstrate that bonds certified by an external reviewer may benefit from lower yields.
These findings support an understanding of green bonds not merely as instruments for financing the transition, but also as components of a market whose depth depends on institutional credibility, transparency, and fiscal reputation.
The aim of this article is to examine the factors explaining the development of the green bond market in the European Union by distinguishing between two dimensions: Member States’ entry into the sovereign green bond market and the overall depth of their green debt markets. The analysis addresses the following three research questions:
RQ1. Which factors explain EU Member States’ participation in the sovereign green bond market?
RQ2. Which factors determine the depth of national green debt markets in the European Union?
RQ3. Is environmental taxation negatively associated with green debt market depth, as would be expected if the two instruments operated as substitutes?
The study employs a panel comprising all 27 EU Member States over the period 2021–2025. The dataset combines ECB statistics on green debt securities with Eurostat macroeconomic, fiscal, and environmental tax data (European Central Bank, 2026; Eurostat, 2026a, 2026b, 2026c). Entry into the sovereign green bond market is modelled using a Probit specification. Market depth is examined using a Tobit specification that accounts for countries that remain outside the market, while the descriptive analysis is based on monthly data covering the period from December 2020 to April 2026.
The article makes three principal contributions. First, it distinguishes between market entry and market depth—two dimensions that the literature on green bond market development commonly examines together—and demonstrates that they are influenced by different factors.
Second, it identifies the role of the fiscal position not as a prerequisite for market entry, but as a determinant of the extent to which the market subsequently deepens. This represents the principal connection between green debt financing and fiscal sustainability examined in the study.
Third, the article provides evidence concerning the relationship between environmental taxation and green debt. These are two important green policy instruments whose interaction has received comparatively limited empirical attention in the context of the European Union.
2. Literature Review and Hypotheses
2.1. Green Bonds and Sustainable Finance in the EU
Green bonds are debt instruments based on the earmarked use of proceeds, whereby the capital raised is allocated to projects pursuing environmental, climate-related, or broader sustainability objectives. Their distinguishing feature does not lie in a repayment mechanism different from that of conventional bonds, but rather in the issuer’s commitment to use the proceeds for predefined green activities and to disclose information regarding their allocation and expected impact. In this respect, green bonds are regarded as a market-based mechanism that connects demand for sustainable investment assets with the need to finance the transition towards a low-carbon economy (Flammer, 2021; Tang & Zhang, 2020).
Within the European Union, this instrument has developed in a particularly strong institutional environment. The European Green Deal places the transition towards climate neutrality at the centre of the Union’s economic strategy and emphasises the need to mobilise substantial private and public investment (European Commission, 2019). It was followed by the development of a more comprehensive sustainable finance framework, including Regulation (EU) 2019/2088 on sustainability-related disclosures in the financial services sector, Regulation (EU) 2020/852 establishing the EU Taxonomy for sustainable activities, and Regulation (EU) 2023/2631 on European Green Bonds (European Parliament & Council of the European Union, 2019, 2020, 2023). These legislative acts share a common objective: to enhance the transparency, comparability, and credibility of sustainable financial products and to reduce the risk of merely formal or self-declared “green” financing.
The EU Taxonomy is particularly important for the green bond market because it provides a common classification framework for identifying economic activities that may be regarded as environmentally sustainable. It establishes a logic according to which a sustainable activity must make a substantial contribution to one or more environmental objectives, must not cause significant harm to the remaining objectives, and must comply with minimum social safeguards (European Parliament & Council of the European Union, 2020). The European Green Bond Standard builds upon this framework by establishing a voluntary but harmonised designation for bonds whose proceeds are aligned with the EU Taxonomy and are accompanied by requirements concerning pre-issuance information, post-issuance reporting, and external review (European Parliament & Council of the European Union, 2023).
The academic literature examines green bonds both as financing instruments and as signals to investors. From the issuers’ perspective, green bonds may broaden the investor base, demonstrate a commitment to sustainability, and improve access to capital markets. Empirical evidence indicates that markets frequently respond positively to green bond issuance, with observable effects on issuers’ market valuation, institutional ownership, and stock liquidity (Tang & Zhang, 2020). Among corporate issuers, green bond issuance may also be associated with subsequent improvements in environmental performance and a stronger commitment to climate-related objectives (Flammer, 2021).
At the same time, the literature does not unconditionally support the proposition that a green label automatically reduces financing costs. Evidence concerning the so-called “greenium” remains mixed and depends on issuer characteristics, sector, liquidity, bond type, and the quality of the information disclosed. Zerbib (2019) identifies a small negative yield spread for green bonds relative to comparable conventional bonds, whereas Wulandari et al. (2018) demonstrate that liquidity risk also affects green bond yields. Fatica et al. (2021) find a pricing advantage for green bonds issued by supranational institutions and non-financial corporations, but not for those issued by financial institutions. They also emphasise the importance of external review and repeated access to the green bond market.
These findings draw attention to trust as a key prerequisite for market development. Investors cannot independently and fully monitor whether the proceeds from each issuance are actually used to finance environmentally meaningful projects. External reviews, certification, allocation reports, and impact reports therefore reduce information asymmetry and the risk of greenwashing. Hyun et al. (2020) demonstrate that a higher degree of green credibility, including external certification, may be reflected in more favourable bond-pricing conditions. In the European context, this function has gradually become institutionalised through the requirements governing external reviewers and disclosures under the European Green Bond Standard.
The development of the green bond market depends not only on the regulatory framework but also on broader macroeconomic and institutional conditions. Research on market growth indicates that economic size, the maturity of capital markets, institutional quality, and national climate commitments influence countries’ capacity to develop green debt financing (Tolliver et al., 2020). This is particularly important within the European Union, where a common regulatory framework coexists with substantial differences among national markets in terms of scale, liquidity, administrative capacity, and experience in debt issuance.
Green bonds in the European Union should therefore be viewed not merely as a distinct financial product but as part of a broader sustainable finance architecture. This architecture seeks to direct capital towards the green transition, but its practical effectiveness depends on the capacity of individual countries and issuers to develop credible frameworks, identify eligible projects, ensure transparency, and maintain investor confidence. This also explains the need, in the following sections, to distinguish between market entry and market depth. Although the regulatory framework establishes common rules, it does not eliminate the differences among Member States in economic scale, fiscal capacity, and institutional preparedness.
2.2. Sovereign Green Bonds, Market Access and Fiscal Capacity
Sovereign green bonds represent a specific application of green debt instruments in which the state acts as the issuer and the proceeds are allocated to public expenditure or investment with environmental and climate-related objectives. Unlike corporate green bonds, where the issuance decision is primarily associated with the investment strategy and capital structure of an individual enterprise, a sovereign green bond issuance forms part of the broader framework of public debt management. It must be integrated into the annual borrowing programme, the maturity structure of government debt, the investor-base strategy, and the country’s overall fiscal framework. Consequently, the decision to enter the sovereign green bond market cannot be explained solely by the need to finance green projects.
The literature emphasises that green bond market development depends on a combination of macroeconomic, institutional, and market-related factors. Tolliver et al. (2020) demonstrate that macroeconomic conditions, capital market development, institutional quality, and national climate commitments are important drivers of green bond market growth. In the context of the European Union, Dan and Tiron-Tudor (2021) similarly find that green bond issuance is associated with countries’ economic, governance, and financial characteristics, indicating that market participation is not merely a function of environmental financing needs. These findings are particularly relevant to the present study because they suggest that Member States with larger economies and more developed financial markets are better positioned to access green debt financing.
Sovereign green bond issuance requires a minimum effective scale. An issuer must have a sufficiently large and predictable borrowing programme to structure the green bond as a recognisable and liquid financial instrument. Institutional investors generally prefer issues of sufficient size, supported by a clearly established yield curve and opportunities for secondary-market trading. Small countries, particularly those with limited annual financing requirements and relatively narrow domestic government securities markets, may experience difficulties in providing such liquidity. In this respect, market entry is associated not only with fiscal financing needs but also with the depth and organisation of the sovereign debt market itself.
In addition to market scale, sovereign green bond issuance requires administrative and project-development capacity. The state must prepare a green bond framework, identify eligible green expenditure, ensure the traceability of proceeds, produce allocation and impact reports, and arrange for external review. The European Green Bond Standard reinforces this logic by introducing requirements concerning Taxonomy alignment, pre-issuance information, post-issuance reporting, and the involvement of external reviewers, including specific provisions applicable to sovereign issuers (European Parliament & Council of the European Union, 2023). Such requirements strengthen investor confidence but also create fixed costs associated with the preparation and maintenance of the issuance framework.
The importance of confidence and institutional quality is also confirmed by studies examining the role of external verification and issuer characteristics. Bachelet et al. (2019) demonstrate that green bond premia and liquidity depend on the type of issuer and the presence of a third party certifying the green characteristics of the issue. Gianfrate and Peri (2019) find that green bonds may provide financial advantages to issuers, but that these benefits are associated with the market’s assessment of the quality and credibility of the instrument. For sovereign issuers, therefore, the green label is not sufficient in itself. It must be supported by a credible institutional framework, transparency, and the capacity to provide regular reporting.
Sovereign green bonds may also perform a catalytic role in the broader sustainable debt market. Cheng et al. (2024) demonstrate that a sovereign green bond debut may stimulate subsequent growth in corporate green bond issuance, improve market liquidity, and promote the use of external verification. This implies that sovereign market entry may serve both as a signal and as an infrastructural benchmark for other issuers. A sovereign green bond creates a reference asset, establishes reporting practices, and may enhance the legitimacy of the market among institutional investors. This catalytic role, however, presupposes that the state itself possesses sufficient capacity to act as a credible initial issuer.
The European context presents an additional distinctive feature. A common regulatory framework does not eliminate national differences in administrative preparedness, the availability of eligible green expenditure, or the maturity of sovereign debt markets. The Recovery and Resilience Facility requires national recovery and resilience plans to incorporate measures related to the green transition and to align them with the broader priorities of the European Union (European Parliament & Council of the European Union, 2021d). This creates a foundation for public green investment, but it does not automatically ensure readiness for market-based financing through sovereign green bonds. Effective issuance requires coordination among budgetary planning, project selection, public debt management, and investor communication.
It follows that small economies may remain outside the market not because they lack a need for green financing or do not support the climate transition, but because their relative market-entry costs are higher. A limited borrowing programme, a smaller portfolio of eligible projects, lower market liquidity, and more restricted administrative resources may make an independent sovereign green bond issuance more difficult. This is consistent with the broader understanding that green bonds affect not only the source of financing but also the manner in which issuers organise their sustainability strategies, reporting processes, and engagement with investors (Maltais & Nykvist, 2021; Monk & Perkins, 2020).
Accordingly, the present study assumes that entry into the sovereign green bond market is primarily a function of economic scale, institutional preparedness, and market infrastructure rather than a direct consequence of the current fiscal position. Fiscal stability may influence the volume and sustainability of subsequent market development, but initial participation requires a minimum effective scale and sufficient administrative capacity. On this basis, the first hypothesis is formulated as follows:
H1. Economic scale is positively associated with participation in the sovereign green bond market, whereas the current fiscal position has no significant independent effect.
2.3. Fiscal Sustainability and Green Bond Market Depth
Fiscal sustainability is a key prerequisite for the development of any sovereign debt market, including its green segment. In broad terms, it refers to the government’s ability to service its current and future obligations without requiring abrupt fiscal policy adjustments or losing access to market financing. The classical literature examines fiscal sustainability through the response of budgetary policy to debt accumulation. An improvement in the primary balance as the level of public debt increases signals corrective fiscal action and, consequently, greater fiscal sustainability (Bohn, 1998). This logic is particularly important in the European context, where Member States operate within an environment characterised by common fiscal rules, market discipline, and considerable investor sensitivity to sovereign debt indicators.
Green bonds do not alter the fundamental nature of sovereign financing. They remain debt instruments and are therefore assessed through the same principal channels that apply to conventional government bonds: issuer creditworthiness, debt sustainability, fiscal position, liquidity, the yield curve, and institutional confidence. The green label may broaden the investor base and enhance the issuer’s visibility among sustainability-oriented investors, but it does not eliminate the assessment of sovereign risk. Empirical studies of the euro-area sovereign debt crisis demonstrate that the market pricing of sovereign risk responds both to fiscal fundamentals and to changes in market expectations and contagion risk (Arghyrou & Kontonikas, 2012; Beirne & Fratzscher, 2013; De Grauwe & Ji, 2013).
From this perspective, it is important to distinguish between two separate decisions. The first concerns whether a country enters the sovereign green bond market at all. The second concerns whether, following market entry, it succeeds in developing a deep and sustainable green debt market. The first decision may depend more strongly on minimum effective scale, administrative preparedness, and the availability of eligible green expenditure. The second is more closely related to fiscal credibility because market depth requires more than a one-off issuance. It implies the capacity to provide bonds regularly, maintain consistent reporting practices, and preserve investor confidence over time.
High public debt and weak fiscal positions may restrict precisely this capacity for market deepening. They increase perceived sovereign risk, heighten sensitivity to the interest-rate environment, and may reduce the scope for a predictable issuance policy. Research on the euro area indicates that high and increasing levels of public indebtedness may be associated with adverse macroeconomic effects and constraints on economic growth, particularly when debt reaches elevated levels (Checherita-Westphal & Rother, 2012). Under such conditions, a green bond can hardly serve as a substitute for fiscal credibility. It may form part of a better-structured debt-management strategy, but it cannot, by itself, compensate for a weakened budgetary position.
The reformed European economic governance framework similarly emphasises sustainable public finances and medium-term fiscal-structural plans. Regulation (EU) 2024/1263 explicitly connects the coordination of economic policies with the sustainability of public finances and the establishment of multiannual fiscal trajectories that reflect the specific debt-related challenges faced by individual Member States (European Parliament & Council of the European Union, 2024). This is important for green financing because climate-related investment requires a long-term perspective, while its debt financing must remain compatible with the issuer’s sustainable fiscal position.
The green bond literature further supports this argument. Evidence concerning the existence of a greenium remains mixed and suggests that any pricing advantage associated with green bonds is limited and conditional. Hachenberg and Schiereck (2018) find that green bonds may trade at narrower spreads than comparable conventional bonds, although the effect depends on credit rating, sector, and issuer characteristics. MacAskill et al. (2021) demonstrate that empirical findings concerning the green premium differ between primary and secondary markets and are influenced by governance arrangements, reporting practices, and the quality of the green bond framework. Investor demand is therefore determined not only by the environmental purpose of the bond but also by the combination of green credibility and overall creditworthiness.
This is particularly relevant for sovereign issuers. A country with a stronger fiscal position is better able to maintain a regular and predictable issuance programme, provide more liquid benchmark bonds, and attract a broader base of institutional investors. A stronger fiscal balance may be interpreted as a signal of fiscal discipline and a lower probability that future green bond issues will be perceived as instruments intended to conceal fiscal pressure. Conversely, under a weaker fiscal position, a green bond issuance may be viewed primarily as additional public debt rather than as a credible component of a long-term sustainable-transition strategy.
Economic scale also remains relevant to market depth. Larger economies generally have a broader portfolio of eligible green public expenditure, more developed capital markets, larger borrowing programmes, and more established relationships with international investors. These factors facilitate not only initial market entry but also the subsequent accumulation of a substantial stock of green debt. Green debt market depth should therefore be understood as the outcome of the interaction between economic scale and fiscal credibility.
Accordingly, the present study assumes that the fiscal position is not necessarily a decisive prerequisite for initial market entry, but that it is an important determinant of subsequent market depth. Green bond markets develop more successfully where the green financing framework is supported by a stable debt-management policy, predictable budgetary governance, and sufficient economic scale. On this basis, the second hypothesis is formulated as follows:
H2. Green debt market depth is greater in countries with larger economic scale and stronger general government budget balances.
2.4. Environmental Taxation and Green Debt Instruments
Environmental taxes and green debt instruments constitute two distinct but interrelated mechanisms of green policy. Environmental taxes operate through price incentives: they increase the cost of activities that generate negative environmental externalities and encourage businesses and households to adopt lower-emission technologies, improve energy efficiency, and pursue more sustainable consumption patterns. This logic underpins the theory of environmental taxation and the debate concerning the so-called “double dividend”, according to which appropriately designed green taxes may simultaneously reduce pollution and improve the structure of public revenues (Goulder, 1995). Within the European Union, this function is reflected in the framework governing the taxation of energy products and electricity, as well as in the broader policy architecture of carbon pricing (Council of the European Union, 2003; Haites, 2018).
The empirical literature provides evidence that environmental taxation and carbon pricing can influence the behaviour of economic agents and reduce emissions. Andersson (2019) demonstrates that the Swedish carbon tax led to a substantial reduction in emissions from transport fuels, while Best et al. (2020) find that countries with carbon-pricing mechanisms experienced lower growth rates of fossil-fuel-related emissions than countries without such instruments. At the same time, Metcalf and Stock (2020) find no robust evidence that carbon taxes adversely affect GDP growth or employment. Martin et al. (2014) similarly demonstrate that the United Kingdom’s Climate Change Levy reduced energy intensity and electricity consumption in manufacturing without producing statistically significant adverse effects on employment, revenue, or plant exit.
Green bonds perform a different function. They do not directly alter the relative prices of polluting and environmentally sustainable activities but instead mobilise capital to finance predefined green investments. Whereas environmental taxation affects incentives, green bonds influence the availability, maturity structure, and visibility of financing. They are therefore particularly suitable for capital-intensive projects involving energy efficiency, renewable energy, clean transport, climate-change adaptation, and public green infrastructure (Sartzetakis, 2021). In this respect, green bonds constitute an instrument for financing the transition, whereas environmental taxation is an instrument for correcting economic incentives.
This distinction is important for the present study because it explains why the two instruments should not automatically be treated as substitutes. If environmental taxes and green bonds were functional substitutes, countries with a lower intensity of environmental taxation might be expected to compensate by developing deeper green debt markets. Conversely, countries with higher environmental taxes might be expected to have less need for green debt financing. Theoretically, however, such a relationship is not inevitable. Environmental taxation can generate both a price signal and public revenue, while green bonds can provide upfront financing for investments whose benefits materialise over a longer period.
Moreover, the two instruments may be complementary. Carbon or environmental pricing increases the relative return on low-carbon investment by making polluting alternatives more expensive. It may therefore strengthen the economic rationale of projects financed through green bonds. Campiglio (2016) emphasises that carbon pricing is important but may be insufficient in isolation when the financial system fails to direct adequate credit and capital towards low-carbon sectors. From this perspective, green debt financing may complement rather than replace fiscal incentives.
Direct evidence regarding the joint operation of these two instruments in the European Union is provided by Li et al. (2023), who examine the effects of green bonds and environmental taxes on energy efficiency across the 27 EU Member States. Their results indicate that green bonds accelerate improvements in energy efficiency, while environmental taxation also functions as a fiscal incentive encouraging energy-efficient behaviour. These findings support the view that green bonds and environmental taxes can operate simultaneously through different policy channels.
This distinction is particularly significant in the European context. Member States differ in the composition of their tax revenues, energy mixes, transport systems, industrial structures, and capacity to mobilise green finance. A country may have a relatively high share of environmental tax revenue because of the structure of its energy and transport taxes, but this does not necessarily imply that it has a developed green bond market. Conversely, a country with a deeper green debt market may use bonds to finance investment without this necessarily implying either lower or higher environmental tax intensity. The European Green Bond Regulation establishes rules concerning transparency and the use of proceeds, but it neither replaces tax policy nor determines the national structure of environmental taxation (European Parliament & Council of the European Union, 2023).
Accordingly, the present study assumes that environmental taxes and green debt are distinct but potentially compatible instruments. Environmental taxes influence behaviour through prices and fiscal incentives, whereas green debt instruments mobilise capital for green investment. The absence of a strong negative relationship between them would therefore indicate that Member States do not necessarily choose between taxation and green debt but may employ both instruments in parallel as part of a broader sustainable-transition strategy. On this basis, the third hypothesis is formulated as follows:
H3. Environmental taxation is not negatively associated with green debt market depth.
3. Materials and Methods
3.1. Data and Sample
The analysis covers all 27 EU Member States. The unit of observation is the country–year. Data on green debt securities are obtained from the European Central Bank’s Securities Issues Statistics, compiled from the Centralised Securities Database (CSEC dataset, extracted in June 2026). The dataset reports outstanding amounts of green debt securities by issuing sector at nominal value (European Central Bank, 2026).
The descriptive analysis uses monthly series covering the period from December 2020 to April 2026. The econometric analysis is based on annual year-end observations for the period 2021–2025, resulting in a balanced panel of 135 country–year observations.
The macroeconomic, fiscal, financial, and environmental variables are obtained from Eurostat. Government debt and the general government budget balance are drawn from the dataset Government deficit/surplus, debt and associated data (online data code: gov_10dd_edpt1; Eurostat, 2026d). The long-term interest rate is obtained from the EMU convergence criterion series—annual data (irt_lt_mcby_a; Eurostat, 2026b). Environmental tax revenue is taken from Environmental tax revenues (env_ac_tax; Eurostat, 2026c), while greenhouse gas emissions per capita are derived from Domestic net greenhouse gas emissions (sdg_13_10; Eurostat, 2026a). Gross domestic product is obtained from Gross domestic product at market prices (tec00001; Eurostat, 2026e).
All explanatory variables enter the models with a one-year lag. This choice reflects the temporal logic of issuance decisions, which generally respond to the macroeconomic and fiscal conditions prevailing before market entry or the expansion of outstanding green debt. Current market outcomes are therefore related to predetermined conditions, reducing the risk of simultaneity.
The lag structure is also consistent with Eurostat’s data-release calendar. At the time of the analysis, data on environmental tax revenue and greenhouse gas emissions for 2025 had not yet been published.
3.2. Variables
The present study considers market development along two dimensions: market entry and market depth.
Market entry indicates whether a country participates in the sovereign green bond market. It is measured using a binary indicator equal to one when the country has outstanding sovereign green debt in the respective year and zero otherwise. This variable is used as the dependent variable in the Probit model.
Market depth captures the relative size of the green debt market within the national economy. It is measured as the total outstanding stock of green debt securities issued by all resident sectors, expressed as a percentage of GDP. This variable is used as the dependent variable in the Tobit model. Distinguishing between the two dimensions makes it possible to separate the decision to participate in the market from the degree of market development following participation.
The explanatory variables encompass economic, fiscal, financial, and environmental characteristics. The natural logarithm of GDP captures economic scale. Government debt as a percentage of GDP and the general government budget balance as a percentage of GDP represent the fiscal position. The long-term interest rate captures financing conditions. Environmental tax revenue as a percentage of GDP measures the intensity of green fiscal policy. Greenhouse gas emissions per capita capture the environmental profile of the economy.
In addition, the share of the outstanding green debt stock covered by a second-party opinion (SPO) is used as a supplementary indicator. In the descriptive analysis, it serves as a measure of the institutional and verification quality of the market. In the robustness analysis, it is used to construct an alternative dependent variable.
Table 1 presents the descriptive statistics.
3.3. Empirical Strategy
The empirical strategy combines three mutually complementary methods.
3.3.1. Descriptive and Comparative Analysis
The descriptive analysis traces the development of the EU green debt market and its sectoral structure from December 2020 to April 2026. It also compares the depth of national markets at the end of 2025. The purpose is to demonstrate both the overall expansion of the market and the uneven participation of Member States. This provides the basis for distinguishing between market entry and market depth, on which the regression analysis is built.
3.3.2. Probit Model
The first dimension of market development is a country’s participation as a sovereign green issuer. It is examined using a Probit model that estimates the probability that country i has outstanding sovereign green debt in year t:
where X,ₜ₋₁ contains the explanatory variables lagged by one year and Φ denotes the standard normal cumulative distribution function. The results are reported as average marginal effects. Standard errors are clustered at the country level to account for potential serial correlation within individual countries. The number of clusters is 27.
Pr (Issuerit = 1) = Φ (β′Xi,t−1),
3.3.3. Tobit Model
The second dimension of market development is market depth, measured as the outstanding green debt stock as a percentage of GDP. This dependent variable is equal to zero for country–year observations with no green debt, which account for 16 of the 135 observations. A Tobit model is therefore employed:
where Xᵢ,ₜ₋₁ includes the explanatory variables lagged by one year and εᵢₜ is the random error term.
GreenStockit = max (0, γ′Xi,t−1+εit), εit∼N(0,σ2),
For nonlinear models of this type, conventional cluster-robust variance estimates may be unreliable when the number of clusters is moderate. Standard errors are therefore calculated using a non-parametric bootstrap with 500 replications. Entire countries, rather than individual observations, are resampled in each replication, thereby preserving the panel structure of the data.
The robustness of the results is assessed in three ways. First, the model is estimated with year fixed effects. Second, the three largest markets are excluded from the sample. Third, the green debt stock covered by a second-party opinion (SPO) is used as an alternative dependent variable.
4. Results
4.1. Expansion of the EU Green Bond Market
The EU green bond market expanded substantially over the period under review. Figure 1 presents the monthly development of outstanding green debt securities issued by EU-27 residents, disaggregated by institutional sector. At the end of 2020, the total stock amounted to slightly less than EUR 300 billion. By April 2026, it had reached approximately EUR 1.29 trillion—an increase of more than fourfold in just over five years. The trend is remarkably persistent, with no visible interruption arising from the 2022 energy crisis or the subsequent tightening of monetary policy.
The expansion encompasses all three issuing sectors. The general government segment increased from EUR 99 billion to EUR 458 billion, the outstanding stock issued by banks rose from EUR 96 billion to EUR 453 billion, and the non-financial corporate segment expanded somewhat more slowly, from EUR 102 billion to EUR 382 billion. Consequently, the market’s sectoral structure remained balanced throughout the period. At the end of the observation window, general government and banks each accounted for approximately 35% of the outstanding stock, while non-financial corporations represented slightly less than 30%. No single sector dominates the market, indicating that green debt financing has become established in both the public and private segments of the European capital market.
Market growth also outpaced economic growth. Based on year-end values, the outstanding green debt stock increased from 3.3% of EU-27 GDP in 2021 to 6.4% in 2025. Over the same period, the number of Member States with a positive green debt stock increased from 22 to 26.
Taken together, these trends show that green bonds are no longer a niche instrument. Within half a decade, they became an important segment of European sustainable finance, directing capital towards the green transition through sovereign, bank, and corporate balance sheets alike.
4.2. Cross-Country Differences in Market Development
The overall expansion documented in the preceding section conceals substantial differences among Member States. Figure 2 ranks the EU-27 countries according to their total outstanding green debt relative to GDP at the end of 2025. The range is wide, extending from 13.8% of GDP in Sweden and 12.3% in Denmark to virtually zero in Bulgaria and 0.1% in Malta. The market is also highly concentrated in absolute terms: the five largest issuing countries account for approximately three quarters of the total outstanding green debt stock in the EU.
Three broad groups can be distinguished. The first comprises mature markets, including the Nordic countries, the Netherlands, France, Austria, and Germany, which maintain an outstanding green debt stock exceeding 6% of GDP. The second and larger group consists of countries in an intermediate position, including Belgium, Italy, Spain, and Hungary, as well as most issuers from Central and Eastern Europe. In these countries, the green debt stock ranges from approximately 1% to 6% of GDP. The third group—Bulgaria, Malta, Croatia, Latvia, Slovenia, Cyprus, and Estonia—remains on the market periphery, with outstanding stocks below 1% of GDP.
Figure 2 also shows that countries with sovereign green bond issuance generally have deeper markets, although the relationship is not absolute. Finland has an outstanding green debt stock equivalent to 10% of GDP without having issued a single sovereign green bond, relying entirely on bank and corporate issuance. Conversely, Romania and Lithuania have already entered the sovereign segment, while the overall depth of their markets remains limited.
Importantly, these differences cannot be explained solely by the fiscal position. Sweden and Denmark combine low government debt with the deepest green markets in the Union. Bulgaria, however, has a similarly low debt level—approximately 30% of GDP—but no green debt market at all. The reverse comparison is equally revealing. Italy, with government debt close to 140% of GDP, is an active sovereign issuer and has a market above the EU median. Greece, by contrast, has a comparable debt burden but has not issued sovereign green debt.
This pattern indicates that fiscal space alone is neither a sufficient condition for market development nor an indispensable prerequisite. A multidimensional analysis is therefore required, simultaneously accounting for economic scale, the fiscal position, financing conditions, and green policy instruments.
4.3. Market Entry: Determinants of Sovereign Green Issuance
Table 2 reports the average marginal effects from the Probit model. The dependent variable indicates whether a Member State has outstanding sovereign green debt in the respective year. All explanatory variables are included with a one-year lag. Standard errors are clustered by country, and the model covers the full panel for 2021–2025.
The results lead to a clear conclusion. Entry into the sovereign green bond market is associated primarily with economic scale. The average marginal effect of log GDP is positive, substantial, and statistically significant. Other things being equal, a one-log-point difference in GDP is associated with an approximately 24-percentage-point higher probability of being a sovereign green issuer. By contrast, the fiscal variables have no statistically significant effect on market participation. Government debt, the budget balance, and the long-term interest rate are not significant at conventional levels, and the magnitudes of their effects are also limited. Environmental taxation is likewise unrelated to market entry. The only other variable approaching statistical significance is greenhouse gas emissions per capita, which have a weakly negative effect. This suggests that economies with lower emissions intensity may be somewhat more likely to issue sovereign green debt. Given its borderline significance, however, this result should be interpreted cautiously.
The economic interpretation is straightforward. Sovereign green issuance is neither simply a response to fiscal pressure nor a privilege reserved for countries with comfortable fiscal positions. Rather, it requires a minimum effective scale. A sufficiently large borrowing programme is needed to support a liquid green benchmark issue. Administrative capacity is also required to establish a green bond framework, develop a portfolio of eligible expenditure, and maintain a credible reporting and external-review mechanism. Smaller economies may therefore remain outside the sovereign segment not because they lack green financing needs, but because the fixed costs of market entry weigh more heavily on smaller borrowing programmes.
These results support H1: economic scale is positively associated with participation in the sovereign green bond market, whereas the current fiscal position has no statistically significant independent effect.
4.4. Market Depth: Fiscal Position and the Outstanding Green Debt Stock
Table 3 presents the Tobit model estimates. The dependent variable is the total outstanding green debt stock as a percentage of GDP. The model accounts for 16 country–year observations with no green debt, for which the dependent variable equals zero. All explanatory variables are included with a one-year lag. Standard errors are calculated using a clustered bootstrap.
Economic scale remains important for market depth. The coefficient on log GDP is positive and statistically significant, indicating that larger economies maintain deeper green debt markets even when market size is measured relative to GDP. The key difference from the market-entry model concerns the fiscal position. In the Probit model, the budget balance had no statistically significant effect on market participation. In the Tobit model, however, it is positively and significantly associated with market depth. Other things being equal, a budget balance stronger by one percentage point of GDP is associated with an outstanding green debt stock approximately 0.4 percentage points of GDP higher. The level of government debt and the long-term interest rate remain statistically insignificant, as do environmental taxes and greenhouse gas emissions per capita.
The contrast between Table 2 and Table 3 represents the article’s central empirical result. The fiscal position explains very little about whether a country enters the green debt market, but it matters for how deep that market becomes. This result is consistent with the view that green debt investors do not assess the environmental purpose of the instrument in isolation; they also evaluate the issuer’s capacity to maintain a credible debt policy. Countries with stronger budgetary positions can sustain larger and more regular green issuance programmes, provide liquid benchmark issues, and offer the fiscal credibility that anchors demand for their green instruments. Green market depth therefore appears to be built upon fiscal stability rather than to serve as a substitute for it—this is the principal link between green bond market development and fiscal sustainability.
These results support H2: economic scale and the general government budget balance are positively and statistically significantly associated with green debt market depth.
4.5. Environmental Taxes and Green Debt: No Evidence of Substitution
If green bonds served as a fiscal substitute for environmental taxation, countries with lower environmental tax revenues would be expected to compensate through deeper green debt markets. A negative and statistically significant relationship between the two instruments should therefore be observed. The results do not support this substitution proposition. Environmental tax revenues are insignificant in both the market-entry model (Table 2) and the market-depth model (Table 3). Table 4 examines this result using alternative specifications of the market-depth model. The first specification includes year fixed effects. The second excludes the three largest markets—Germany, France, and the Netherlands. The third uses the green debt stock covered by a second-party opinion (SPO) as the dependent variable.
The comparison across the columns of Table 4 is informative. The coefficients on economic scale and the budget balance remain stable in all four specifications. By contrast, the coefficient on environmental taxes changes in magnitude and remains statistically insignificant in every case. No robust relationship between environmental taxation and green debt is therefore identified in either direction. Countries with low environmental tax revenues do not compensate through deeper green debt markets, while countries with higher environmental tax revenues do not systematically display lower market depth.
The findings provide no evidence that environmental taxes and green debt operate as substitutes, which is consistent with their use as distinct and potentially parallel green policy instruments. They perform different functions: environmental taxes correct incentives and influence the behaviour of economic agents, whereas green bonds mobilise capital to finance green investment. Member States do not appear to compensate for lower environmental tax revenues by developing deeper green debt markets, and green debt market development proceeds largely independently of the intensity of environmental taxation.
Accordingly, H3 is not rejected: environmental taxation is not significantly negatively associated with green debt market depth.
4.6. Credibility and Robustness of the Results
The high share of the outstanding green debt stock covered by a second-party opinion is an important indicator of market quality. On average, this share exceeds 90% over the period (Table 1). This demonstrates that the market is developing not only quantitatively but also institutionally, with stronger standards of credibility, transparency, and external verification.
The main results remain stable across the alternative specifications presented in Table 4. This supports the conclusion that the identified relationships are not driven by a particular modelling choice. More specifically, the effect of economic scale, the positive role of the budget balance, and the absence of evidence of substitution between environmental taxes and green debt all remain robust.
5. Discussion
5.1. Market Scale as a Barrier to Entry
The dominant role of economic scale in the market-entry model indicates that participation in the sovereign green bond market is not merely an expression of political will or climate ambition. It depends on structural characteristics of the debt market that accumulate over time: the size of the economy, the depth of the government securities market, liquidity, an established investor base, and institutional debt-management capacity. This finding is consistent with the literature on bond market development, according to which economic scale, institutional factors, and the investor base are systematically associated with the depth and currency composition of government bond markets (Claessens et al., 2007; Burger et al., 2012).
For sovereign green bonds, these general market conditions carry additional weight. A green issue must be sufficiently large to be recognisable and liquid for institutional investors, while also fitting within the country’s overall debt strategy. Larger economies can more readily integrate a green benchmark issue into their regular issuance calendar without disrupting the maturity structure or liquidity management. In smaller countries, a comparable issue may represent a disproportionate share of the annual financing programme, increasing the risk that it remains a one-off transaction rather than part of a consistent market strategy.
Fixed market-entry costs constitute an important part of this mechanism. Before entering the market, a sovereign issuer must establish a green bond framework, identify eligible expenditure, develop internal procedures for tracking proceeds, prepare pre-issuance information for investors, and arrange subsequent allocation and impact reporting. The European Green Bond Standard further institutionalises this logic through requirements concerning transparency, Taxonomy alignment, and external review (European Parliament & Council of the European Union, 2023). These requirements strengthen confidence but impose a higher relative cost on smaller issuers.
Market scale should therefore not be understood solely as the size of GDP. It reflects broader market infrastructure: the capacity for regular issuance, the availability of a sufficiently large portfolio of eligible green expenditure, the ability to maintain liquidity, and the capacity to communicate with international investors. Evidence for the EU provided by Dan and Tiron-Tudor (2021) shows that green bond issuance is associated with countries’ macroeconomic, financial, and governance characteristics, while Tolliver et al. (2020) emphasise the role of institutional quality, capital markets, and climate commitments in green bond market growth.
The importance of confidence further reinforces the barrier facing smaller issuers. Investors assess green bonds not only according to their environmental purpose but also according to information quality, issuer characteristics, and the presence of external verification. Bachelet et al. (2019) show that green bond premia and liquidity depend on issuer type and third-party verification, while Fatica et al. (2021) find that pricing advantages vary across issuer groups and are associated with the quality of market participation. For smaller sovereign issuers, market entry therefore requires not only green projects but also an infrastructure of trust.
The European Union provides a common regulatory framework, but it does not fully eliminate national differences. The Capital Markets Union action plan emphasises the need for a more integrated single capital market capable of facilitating the mobilisation of private funds for sustainable investment (European Commission, 2020). Nevertheless, the practical capacity to use capital markets continues to differ among Member States. Common standards reduce information fragmentation but do not eliminate differences in scale, liquidity, administrative resources, and project readiness.
The absence of smaller Member States from the sovereign green bond market should therefore not automatically be interpreted as a lack of environmental ambition. It may reflect issuance economics and the relatively higher costs of preparation, certification, reporting, and communication. Some countries may finance green investment through European funds, bank intermediation, corporate issuance, or conventional government debt without creating a separate sovereign green bond programme. This distinction is important because it prevents market presence from being mechanically equated with climate ambition.
The policy implication is that equal access to green debt financing requires more than harmonised standards. Instruments are needed to reduce the fixed costs faced by smaller issuers: technical assistance for preparing green bond frameworks, standardised reporting templates, common methodologies for identifying eligible expenditure, support for external verification, and better coordination among budget authorities, debt-management offices, and institutions responsible for planning green investment. Solutions may also involve common European platforms, supranational channels, or the pooling of project portfolios when an individual issue is too small to be liquid.
In this respect, the findings for H1 point to a more nuanced understanding of market entry. It is not simply a binary choice between issuing and not issuing, but the outcome of accumulated structural preconditions. Economic scale acts as a summary indicator of these conditions. It facilitates entry by reducing the relative burden of fixed costs, increasing the likelihood of a liquid issue, and supporting investor confidence. The next analytical question is different: once a country has entered the market, what determines the depth and sustainability of its green debt market? It is at this stage that fiscal credibility assumes a more central role.
5.2. Green Bonds and Fiscal Sustainability
The contrast between market entry and market depth is one of the most important findings of this study. Whereas participation in the sovereign green bond market is determined primarily by economic scale, the deepening of the green debt market is associated with a stronger budgetary position. Fiscal sustainability therefore appears to function less as an entry condition for initial issuance and more as a factor that enables the market to develop after entry. The findings thus clarify the relationship between green debt financing and fiscal policy: green bonds are not an alternative to fiscal discipline, but an instrument that operates more convincingly in the presence of fiscal credibility.
This interpretation is consistent with the classical understanding of fiscal sustainability. Bohn (1998) evaluates sustainable fiscal policy through a government’s capacity to respond to rising debt by improving the primary balance. From this perspective, the budget balance is not merely an accounting outcome for a particular year but a signal of the government’s ability to maintain predictable debt dynamics. For the green bond market, this signal is particularly important because investors purchase a debt instrument, not merely an environmental objective. The green label may therefore enhance issuer visibility and attract sustainability-oriented investors, but it does not remove the assessment of credit risk.
The sovereign-risk literature confirms that markets respond to fiscal fundamentals, particularly when uncertainty increases. Schuknecht et al. (2009) show that government risk premia are sensitive to the fiscal position and institutional environment. Arghyrou and Kontonikas (2012), Beirne and Fratzscher (2013), and De Grauwe and Ji (2013) further emphasise that the market pricing of sovereign risk in the euro area is influenced not only by debt and budget indicators but also by expectations, liquidity, and contagion risk. This is important for interpreting the present results: even when an issue has a clearly defined green purpose, investors remain sensitive to the issuer’s overall credibility.
For green bonds, this relationship is reinforced by the need for regularity and trust. A deep market cannot be built through a single issuance. It requires a recurring issuance programme, sufficient instrument volumes, secondary-market liquidity, high-quality reporting on the use of proceeds, and a clear link between green expenditure and budget planning. Countries with stronger budget balances have a greater capacity to sustain such programmes because they can combine climate investment with a more predictable debt trajectory. Conversely, under fiscal pressure, a green issue may be perceived as additional debt rather than as a sustainably integrated component of a long-term transition strategy.
The reformed European economic governance framework confirms this logic. Regulation (EU) 2024/1263 emphasises medium-term fiscal-structural plans, sustainable public finances, and the combination of fiscal adjustment with reforms and investment (European Parliament & Council of the European Union, 2024). In this context, green bonds can provide a useful instrument for financing climate and environmental priorities, but only when they are compatible with the medium-term budgetary trajectory. They should not be treated as an off-budget or parallel channel for circumventing fiscal constraints, but as part of a broader sustainable public-finance strategy.
This distinction is also important because of the growing link between climate risks and sovereign creditworthiness. Beirne et al. (2021) show that climate vulnerability may increase sovereign borrowing costs, while Klusak et al. (2023) find that climate change may affect sovereign credit ratings. From this perspective, green bonds have the potential to finance investment that reduces future climate and fiscal risks. This potential is realised, however, only when issuance is linked to genuine projects, credible reporting, and a sustainable fiscal framework. Otherwise, green debt may increase gross indebtedness without materially improving the sustainability of public finances.
The legal and financial literature also cautions against an excessively optimistic interpretation of sustainable debt instruments. Lupo-Pasini (2022) stresses that contractual mechanisms alone cannot resolve the public-governance and fiscal-sustainability challenges associated with sovereign debt. Bolton et al. (2022) situate the relationship between environmental protection and sovereign debt within the broader context of debt distress and the need for institutional solutions. These arguments support the conclusion that green bonds should not be regarded as an automatic mechanism of fiscal relief. They may improve the quality and targeting of financing, but they do not remove the need for credible debt policy.
From a policy perspective, the results imply that the development of deeper green debt markets requires a combination of sustainable finance and fiscal responsibility. Governments should not expect the green label alone to deliver lower financing costs or a permanently broader investor base. A more realistic strategy is to establish enduring green-finance frameworks compatible with medium-term budget planning, ensure transparency regarding eligible expenditure, and maintain confidence through regular allocation and impact reporting. Within such a framework, green bonds can support a fiscally sustainable green transition, but they cannot substitute for fiscal sustainability.
The principal conclusion from H2 is therefore that green debt market depth is built upon pre-existing fiscal credibility. Green bonds can broaden the public-finance toolkit, make climate investment more visible, and improve communication with investors, but their effectiveness depends on the government’s overall capacity to manage its debt sustainably. This explains why markets deepen not necessarily where fiscal pressure is greatest, but where the budgetary position and institutional confidence already provide a foundation for sustainable issuance.
5.3. Environmental Taxes and Green Debt: Distinct Policy Functions and No Evidence of Substitution
The findings concerning H3 indicate that environmental taxation is not significantly negatively associated with green debt market depth. This absence of a robust statistical relationship should not be interpreted as evidence that the two instruments are interchangeable. Rather, it is consistent with their different functional logics: environmental taxation affects relative prices and the behaviour of economic agents, whereas green bonds provide earmarked financing for investments that often require substantial upfront capital and generate impacts over a long horizon.
This finding is consistent with the policy-mix literature. Flanagan et al. (2011) argue that different policies should not be examined in isolation, but through the interactions, interdependencies, and potential tensions among them. Rogge and Reichardt (2016) develop this logic in the context of sustainability transitions, emphasising the need to combine instruments, processes, and policy characteristics, including consistency, coherence, and credibility. From this perspective, the absence of a simple linear relationship between environmental taxes and green debt is to be expected: the two instruments form part of a broader policy mix rather than alternative channels for achieving the same objective.
The theoretical argument is further strengthened by the dual nature of market failures in the green transition. Jaffe et al. (2005) show that environmental externalities interact with market failures related to innovation and the diffusion of new technologies. A price signal alone is therefore rarely sufficient. Environmental taxes can correct some negative externalities, but they do not automatically guarantee adequate financing, technological readiness, or project capacity. Green bonds can address precisely this investment dimension of the transition.
Models of directed technological change point in the same direction. Acemoglu et al. (2012) show that optimal climate policy is not limited to carbon taxation but also includes measures that direct innovation towards clean technologies. Popp (2002) provides empirical evidence that energy prices can stimulate innovation in energy efficiency. These findings support the interpretation that environmental taxes are important for creating incentives, while the investment implementation of the transition requires additional financial instruments.
Green bonds constitute precisely such an instrument. They do not directly change price incentives, but they can translate policy and technological priorities into concrete investment portfolios. They are therefore particularly relevant to projects whose social benefits are high but whose returns are long term or partly external to the individual investor. In this respect, green bonds need not compete with environmental taxes; instead, they may help finance the investment response to the incentives created by environmental taxation.
The complementarity argument is also supported by research on the limitations of stand-alone carbon pricing. Bertram et al. (2015) show that climate objectives may remain achievable through a combination of carbon prices, technology policies, and energy measures. Campiglio (2016) likewise emphasises that price-based instruments should be supported by financial and banking mechanisms that direct capital towards low-carbon activities. The present findings are consistent with the view that tax policy and capital financing operate through different channels, although the absence of a significant association does not itself prove complementarity.
This distinction is particularly important in the European context. Directive 2003/96/EC establishes a framework for the taxation of energy products and electricity, while Regulation (EU) 2023/2631 governs European Green Bonds and the requirements concerning disclosure, the use of proceeds, and external review. These constitute two different regulatory layers. The first concerns price signals and fiscal revenues, while the second concerns the transparency and credibility of sustainable debt financing. Their different institutional purposes explain why they do not automatically substitute for one another.
The practical implication is that Member States need not treat environmental taxation and green debt as mutually exclusive alternatives. A more effective approach may be to establish a coherent policy mix in which environmental taxes guide behaviour and generate part of the public resources required, while green bonds mobilise additional capital for projects involving energy, transport, buildings, adaptation, and public infrastructure. This is particularly important for countries with limited fiscal capacity, as tax revenues alone are unlikely to finance the full investment requirements of the transition.
At the same time, the parallel use of these instruments requires coordination. If environmental tax revenues are used without reference to strategic investment needs, while green bonds are issued without a clear link to budget planning, the two instruments may remain administratively separate, reducing their effectiveness. Policy should therefore integrate tax incentives, project selection, green budgeting, and debt strategy within a common framework for the sustainable transition.
The conclusion from H3 is therefore limited but policy-relevant. The analysis provides no evidence that environmental taxation substitutes for green debt market depth. This finding is consistent with the view that the two instruments serve different functions: the former create incentives and correct externalities, while the latter provide financing and visibility for green investment. An integrated policy mix may therefore use price, budgetary, and capital-market instruments coherently rather than treating them as competing alternatives.
5.4. Implications for Smaller and Peripheral EU Economies
The findings are particularly important for smaller and peripheral EU economies because they show that an absent or limited presence in the green bond market should not automatically be interpreted as a lack of environmental ambition or a sign of fiscal weakness. Some countries with limited market participation have relatively low government debt and comparatively stable budgetary indicators, yet have not developed an active sovereign green debt market. This confirms that barriers to entry are predominantly structural and institutional rather than exclusively fiscal.
The first group of barriers concerns economies of scale. Smaller countries generally have more limited annual borrowing programmes, narrower secondary markets for government securities, and a smaller institutional investor base. For such countries, a stand-alone sovereign green issue may be too small to be liquid or too large relative to the conventional borrowing programme. This creates a risk that the green bond remains a one-off instrument rather than the beginning of a predictable sovereign green financing curve.
The second group of barriers arises from administrative and project capacity. A green bond requires not only an issuance decision but also prior work to identify eligible expenditure, ensure Taxonomy alignment, track proceeds, arrange external review, and report subsequent impacts. The European Green Bond Standard increases market quality and credibility but also strengthens the need for institutional preparation (European Parliament & Council of the European Union, 2023). For smaller issuers, these requirements impose a higher relative cost because the fixed expenses associated with the framework, methodology, and verification are spread across a smaller volume of issuance.
The third barrier concerns the development of a project portfolio. Smaller and peripheral economies often have substantial investment needs in energy efficiency, transport, water infrastructure, climate-change adaptation, and public buildings, but these projects may be fragmented across different administrations, municipalities, and public enterprises. This makes it more difficult to assemble a sufficiently large, clearly defined, and verifiable portfolio of eligible green expenditure. The challenge therefore lies not only in the existence of investment needs but also in the capacity to convert them into a structured debt product.
In this context, national development banks and public investment banks can perform a key intermediary function. The literature regards them not only as instruments for correcting market failures, but also as institutions capable of creating and shaping markets, assuming early-stage risks, and mobilising private capital towards strategic objectives (Mazzucato & Penna, 2016). Geddes et al. (2018) show that state investment banks can support low-carbon finance through several roles, including risk reduction, project aggregation, the provision of long-term capital, and confidence building. The role of the European Investment Bank and national development banks as part of a broader European investment infrastructure is also relevant to the EU context (Mertens & Thiemann, 2019).
For smaller economies, the development of a green bond market may therefore begin not with sovereign issuance but with institutional preparation. The first step is to create an internal green-budgeting system and identify eligible expenditure. The second is to establish a project register linking budget programmes, capital expenditure, and expected environmental effects. The third is to prepare a standardised green bond framework that can be used by the government, public enterprises, municipalities, or national promotional institutions.
European instruments can reduce these barriers. Regulation (EU) 2021/240 established the Technical Support Instrument, which enables expertise to be provided to Member States for institutional, administrative, and structural reforms (European Parliament & Council of the European Union, 2021a). This makes it an appropriate channel for assisting smaller issuers in developing green-finance frameworks, project-selection methodologies, and reporting systems. The InvestEU Programme, established by Regulation (EU) 2021/523, uses an EU budget guarantee to support investment operations and mobilise additional public and private capital (European Parliament & Council of the European Union, 2021b). Regulation (EU) 2021/1058 on the European Regional Development Fund and the Cohesion Fund is important for less-developed regions because it links cohesion financing to investment objectives, including a greener, low-carbon Europe (European Parliament & Council of the European Union, 2021c).
These instruments do not replace the green bond market, but they can create the conditions for its development. Technical assistance can reduce market-entry costs, InvestEU can provide guarantee and advisory infrastructure, and cohesion funds can support the preparation of investment portfolios. Blended solutions are also possible, combining European funds, national development banks, and market financing within common project platforms. The small scale of individual projects can thus be overcome through aggregation and standardisation.
From a policy perspective, support for smaller and peripheral countries should not be limited to encouraging one-off green issues. More important is the creation of enduring infrastructure: green budgeting, administrative coordination between ministries of finance and sectoral authorities, project registers, standardised impact indicators, external-review procedures, and regular communication with investors. Without such infrastructure, a sovereign green bond may be highly visible but have only a limited systemic effect.
The principal implication for smaller and peripheral EU economies is therefore that market underdevelopment can be addressed by reducing fixed costs, building administrative capacity, and using European support mechanisms. If these conditions are created, the green debt market can become more inclusive and serve not only large and liquid economies but also countries where the investment needs of the green transition are substantial and market infrastructure is still developing.
6. Conclusion
This article examines the development of the green bond market in the EU-27 by distinguishing between entry into the sovereign green debt market and the depth of the green debt market as a whole. The results show that the market expanded rapidly. The outstanding stock increased more than fourfold between the end of 2020 and spring 2026, with growth encompassing sovereign, bank, and corporate issuers. Nevertheless, development remains highly uneven. A small group of Member States holds the majority of the outstanding stock, while several countries remain on the market periphery or entirely outside it.
The econometric results show that the two dimensions of market development are associated with different factors. Participation in the sovereign green bond market is associated primarily with economic scale, whereas the current fiscal position has no statistically significant independent effect on participation. Market depth, by contrast, is positively associated with both economic scale and a stronger general government budget balance. Green debt markets therefore appear to deepen where fiscal credibility already exists rather than serving as a substitute for it. Finally, environmental taxation is not significantly negatively associated with green debt market depth, providing no evidence of a substitution relationship and remaining consistent with the use of the two instruments as distinct and potentially parallel components of green policy.
These results indicate that the uneven development of the EU green bond market primarily reflects structural differences in scale and capacity. It cannot be explained solely by differences in fiscal discipline or environmental ambition. If the market is to support the green transition across the Union as a whole, policy should assist smaller issuers. Reducing the fixed costs of market entry and strengthening institutional capacity are particularly important. At the same time, sound public finances remain the foundation for the development of deep green debt markets.
The analysis has several limitations. First, the panel is short. The CSEC statistics begin at the end of 2020, limiting the econometric analysis to five annual observations per country and 135 observations in total; with 27 country clusters, estimates of borderline significance should be interpreted with appropriate caution. This limitation reflects the young age of the market rather than the research design and will diminish as additional data become available. Second, the estimates identify associations rather than causal effects. Lagging the explanatory variables by one year links market outcomes to predetermined conditions and reduces the risk of simultaneity, but it does not fully exclude the possibility that countries with stronger fiscal positions also differ in other respects. These characteristics may include institutional quality, the investor base, and policy credibility, which may likewise support the development of deeper green markets. Third, the analysis is conducted at the country level and focuses on market volumes. It does not examine individual issuance decisions or pricing. Future research can address these limitations as the market matures. Longer samples will permit more precise modelling of market entry and the persistence of market depth. Issue- and issuer-level data can reveal the mechanisms underlying the country-level patterns identified here. Extending the analysis to the pricing dimension would also be valuable. In particular, future research should examine whether fiscal credibility is reflected in a green premium (“greenium”). Such evidence would complement the volume-based findings presented in this article.
Author Contributions
Conceptualization, R.K.-H and V.G.; methodology, V.G.; software, V.G.; validation, R.K.-H and V.G.; formal analysis, V.G.; investigation, R.K.-H and V.G.; resources, V.G.; data curation, V.G.; writing—original draft preparation, R.K.-H and V.G..; writing—review and editing, R.K.-H and V.G.; visualization, R.K.-H and V.G.; supervision, R.K.-H and V.G.; project administration, R.K.-H.; funding acquisition, R.K.-H. All authors have read and agreed to the published version of the manuscript.
Funding
This research received no external funding.
Institutional Review Board Statement
Not applicable. The study is based exclusively on publicly available aggregate statistical data and does not involve human participants or animals.
Informed Consent Statement
Not applicable.
Data Availability Statement
This study is based exclusively on publicly available, third-party data, and no new data were cre-ated. Data on outstanding green debt securities were obtained from the European Central Bank’s CSDB-derived Securities Issues Statistics (CSEC dataset), available through the ECB Data Portal at https://data.ecb.europa.eu/data/datasets/csec/data-information (accessed on 20 June 2026). The macroeconomic, fiscal, financial, and environmental data were obtained from the publicly availa-ble Eurostat datasets under the online data codes gov_10dd_edpt1, irt_lt_mcby_a, env_ac_tax, sdg_13_10, and tec00001 (accessed on 20 June 2026). Full citations and persistent identifiers (DOIs) for all datasets are provided in the reference list (European Central Bank, 2026; Eurostat, 2026a–e). The processed panel dataset constructed by the authors is available from the authors upon reasonable request.
Conflicts of Interest
The authors declare no conflicts of interest.
References
- Acemoglu, D.; Aghion, P.; Bursztyn, L.; Hémous, D. The environment and directed technical change. American Economic Review 2012, 102(1), 131–166. [Google Scholar] [CrossRef] [PubMed]
- Andersson, J. J. Carbon taxes and CO₂ emissions: Sweden as a case study. American Economic Journal: Economic Policy 2019, 11(4), 1–30. [Google Scholar] [CrossRef]
- Arghyrou, M. G.; Kontonikas, A. The EMU sovereign-debt crisis: Fundamentals, expectations and contagion. Journal of International Financial Markets, Institutions and Money 2012, 22(4), 658–677. [Google Scholar] [CrossRef]
- Bachelet, M. J.; Becchetti, L.; Manfredonia, S. The green bonds premium puzzle: The role of issuer characteristics and third-party verification. Sustainability 2019, 11(4), 1098. [Google Scholar] [CrossRef]
- Beirne, J.; Fratzscher, M. The pricing of sovereign risk and contagion during the European sovereign debt crisis. Journal of International Money and Finance 2013, 34, 60–82. [Google Scholar] [CrossRef]
- Beirne, J.; Renzhi, N.; Volz, U. Feeling the heat: Climate risks and the cost of sovereign borrowing. International Review of Economics & Finance 2021, 76, 920–936. [Google Scholar] [CrossRef]
- Bertram, C.; Luderer, G.; Pietzcker, R. C.; Schmid, E.; Kriegler, E.; Edenhofer, O. Complementing carbon prices with technology policies to keep climate targets within reach. Nature Climate Change 2015, 5, 235–239. [Google Scholar] [CrossRef]
- Best, R.; Burke, P. J.; Jotzo, F. Carbon pricing efficacy: Cross-country evidence. Environmental and Resource Economics 2020, 77(1), 69–94. [Google Scholar] [CrossRef]
- Bohn, H. The behavior of U.S. public debt and deficits. The Quarterly Journal of Economics 1998, 113(3), 949–963. [Google Scholar] [CrossRef]
- Bolton, P.; Buchheit, L. C.; Weder di Mauro, B.; Panizza, U.; Gulati, M. Environmental protection and sovereign debt restructuring. Capital Markets Law Journal 2022, 17(3), 307–316. [Google Scholar] [CrossRef]
- Burger, J. D.; Warnock, F. E.; Warnock, V. C. Emerging local currency bond markets. Financial Analysts Journal 2012, 68(4), 73–93. [Google Scholar] [CrossRef]
- Campiglio, E. Beyond carbon pricing: The role of banking and monetary policy in financing the transition to a low-carbon economy. Ecological Economics 2016, 121, 220–230. [Google Scholar] [CrossRef]
- Checherita-Westphal, C.; Rother, P. The impact of high government debt on economic growth and its channels: An empirical investigation for the euro area. European Economic Review 2012, 56(7), 1392–1405. [Google Scholar] [CrossRef]
- Cheng, G.; Ehlers, T.; Packer, F.; Xiao, Y. Sovereign green bonds: A catalyst for sustainable debt market development? IMF Working Paper No. 2024/120; International Monetary Fund, 2024. [Google Scholar] [CrossRef]
- Claessens, S.; Klingebiel, D.; Schmukler, S. L. Government bonds in domestic and foreign currency: The role of institutional and macroeconomic factors. Review of International Economics 2007, 15(2), 370–413. [Google Scholar] [CrossRef]
- Climate Bonds Initiative. Sustainable debt global state of the market 2025 . 2026. Available online: https://www.climatebonds.net/files/documents/publications/Sustainable_Debt_2025_02B.pdf (accessed on 20 June 2026).
- Council of the European Union. Council Directive 2003/96/EC of 27 October 2003 restructuring the Community framework for the taxation of energy products and electricity. Official Journal of the European Union 2003, L 283, 51–70. Available online: https://eur-lex.europa.eu/eli/dir/2003/96/oj/eng (accessed on 20 June 2026).
- Dan, A.; Tiron-Tudor, A. The determinants of green bond issuance in the European Union. Journal of Risk and Financial Management 2021, 14(9), 446. [Google Scholar] [CrossRef]
- De Grauwe, P.; Ji, Y. Self-fulfilling crises in the Eurozone: An empirical test. Journal of International Money and Finance 2013, 34, 15–36. [Google Scholar] [CrossRef]
- European Central Bank. CSEC—CSDB-derived Securities Issues Statistics . [Data set]. ECB Data Portal. 2026. Available online: https://data.ecb.europa.eu/data/datasets/csec/data-information (accessed on 20 June 2026).
- European Commission. The European Green Deal . Communication COM(2019) 640 final. 2019. Available online: https://eur-lex.europa.eu/legal-content/EN/TXT/?uri=CELEX:52019DC0640 (accessed on 20 June 2026).
- European Commission. A Capital Markets Union for people and businesses—New action plan . Communication COM(2020) 590 final. 2020. Available online: https://eur-lex.europa.eu/legal-content/EN/TXT/?uri=CELEX:52020DC0590 (accessed on 20 June 2026).
- European Parliament; Council of the European Union. Regulation (EU) 2019/2088 of 27 November 2019 on sustainability-related disclosures in the financial services sector. Official Journal of the European Union 2019, L 317, 1–16. Available online: https://eur-lex.europa.eu/eli/reg/2019/2088/oj/eng (accessed on 20 June 2026).
- European Parliament; Council of the European Union. Regulation (EU) 2020/852 of 18 June 2020 on the establishment of a framework to facilitate sustainable investment and amending Regulation (EU) 2019/2088. Official Journal of the European Union 2020, L 198, 13–43. Available online: https://eur-lex.europa.eu/eli/reg/2020/852/oj/eng (accessed on 20 June 2026).
- European Parliament; Council of the European Union. Regulation (EU) 2021/240 of 10 February 2021 establishing a Technical Support Instrument. Official Journal of the European Union 2021a, L 57, 1–16. Available online: https://eur-lex.europa.eu/eli/reg/2021/240/oj/eng (accessed on 20 June 2026).
- European Parliament; Council of the European Union. Regulation (EU) 2021/523 of 24 March 2021 establishing the InvestEU Programme and amending Regulation (EU) 2015/1017. Official Journal of the European Union 2021b, L 107, 30–89. Available online: https://eur-lex.europa.eu/eli/reg/2021/523/oj/eng (accessed on 20 June 2026).
- European Parliament; Council of the European Union. Regulation (EU) 2021/1058 of 24 June 2021 on the European Regional Development Fund and on the Cohesion Fund. Official Journal of the European Union 2021c, L 231, 60–93. Available online: https://eur-lex.europa.eu/eli/reg/2021/1058/oj/eng (accessed on 20 June 2026).
- European Parliament; Council of the European Union. Regulation (EU) 2021/241 of 12 February 2021 establishing the Recovery and Resilience Facility. Official Journal of the European Union 2021d, L 57, 17–75. Available online: https://eur-lex.europa.eu/eli/reg/2021/241/oj/eng (accessed on 20 June 2026).
- European Parliament; Council of the European Union. Regulation (EU) 2023/2631 of 22 November 2023 on European Green Bonds and optional disclosures for bonds marketed as environmentally sustainable and for sustainability-linked bonds. Official Journal of the European Union, L 2023/2631. 2023. Available online: https://eur-lex.europa.eu/eli/reg/2023/2631/oj/eng (accessed on 20 June 2026).
- European Parliament; Council of the European Union. Regulation (EU) 2024/1263 of 29 April 2024 on the effective coordination of economic policies and on multilateral budgetary surveillance and repealing Council Regulation (EC) No 1466/97. Official Journal of the European Union, L 2024/1263. 2024. Available online: https://eur-lex.europa.eu/eli/reg/2024/1263/oj/eng (accessed on 20 June 2026).
- Eurostat. Domestic net greenhouse gas emissions . (online data code: sdg_13_10) [Data set]. accessed on. 2026a. (accessed on 20 June 2026). [CrossRef]
- Eurostat. EMU convergence criterion series—Annual data . (online data code: irt_lt_mcby_a) [Data set]. accessed on. 2026b. (accessed on 20 June 2026). [CrossRef]
- Eurostat. Environmental tax revenues . (online data code: env_ac_tax) [Data set]. accessed on. 2026c. (accessed on 20 June 2026). [CrossRef]
- Eurostat. Government deficit/surplus, debt and associated data . (online data code: gov_10dd_edpt1) [Data set]. accessed on. 2026d. (accessed on 20 June 2026). [CrossRef]
- Eurostat. Gross domestic product at market prices . (online data code: tec00001) [Data set]. accessed on. 2026e. (accessed on 20 June 2026). [CrossRef]
- Fatica, S.; Panzica, R.; Rancan, M. The pricing of green bonds: Are financial institutions special? Journal of Financial Stability 2021, 54, 100873. [Google Scholar] [CrossRef]
- Flammer, C. Corporate green bonds. Journal of Financial Economics 2021, 142(2), 499–516. [Google Scholar] [CrossRef]
- Flanagan, K.; Uyarra, E.; Laranja, M. Reconceptualising the policy mix for innovation. Research Policy 2011, 40(5), 702–713. [Google Scholar] [CrossRef]
- Geddes, A.; Schmidt, T. S.; Steffen, B. The multiple roles of state investment banks in low-carbon energy finance: An analysis of Australia, the UK and Germany. Energy Policy 2018, 115, 158–170. [Google Scholar] [CrossRef]
- Gianfrate, G.; Peri, M. The green advantage: Exploring the convenience of issuing green bonds. Journal of Cleaner Production 2019, 219, 127–135. [Google Scholar] [CrossRef]
- Goulder, L. H. Environmental taxation and the double dividend: A reader’s guide. International Tax and Public Finance 1995, 2(2), 157–183. [Google Scholar] [CrossRef]
- Hachenberg, B.; Schiereck, D. Are green bonds priced differently from conventional bonds? Journal of Asset Management 2018, 19(6), 371–383. [Google Scholar] [CrossRef]
- Haites, E. Carbon taxes and greenhouse gas emissions trading systems: What have we learned? Climate Policy 2018, 18(8), 955–966. [Google Scholar] [CrossRef]
- Hyun, S.; Park, D.; Tian, S. The price of going green: The role of greenness in green bond markets. Accounting & Finance 2020, 60(1), 73–95. [Google Scholar] [CrossRef]
- Jaffe, A. B.; Newell, R. G.; Stavins, R. N. A tale of two market failures: Technology and environmental policy. Ecological Economics 2005, 54(2–3), 164–174. [Google Scholar] [CrossRef]
- Klusak, P.; Agarwala, M.; Burke, M.; Kraemer, M.; Mohaddes, K. Rising temperatures, falling ratings: The effect of climate change on sovereign creditworthiness. Management Science 2023, 69(12), 7468–7491. [Google Scholar] [CrossRef]
- Li, Y.; Zhou, M.; Sun, H.; Liu, J. Assessment of environmental tax and green bonds impacts on energy efficiency in the European Union. Economic Change and Restructuring 2023, 56(2), 1063–1081. [Google Scholar] [CrossRef]
- Lupo-Pasini, F. Sustainable finance and sovereign debt: The illusion to govern by contract. Journal of International Economic Law 2022, 25(4), 680–698. [Google Scholar] [CrossRef]
- MacAskill, S.; Roca, E.; Liu, B.; Stewart, R. A.; Sahin, O. Is there a green premium in the green bond market? Systematic literature review revealing premium determinants. Journal of Cleaner Production 2021, 280, 124491. [Google Scholar] [CrossRef]
- Maltais, A.; Nykvist, B. Understanding the role of green bonds in advancing sustainability. Journal of Sustainable Finance & Investment 2021, 11(3), 233–252. [Google Scholar] [CrossRef]
- Martin, R.; de Preux, L. B.; Wagner, U. J. The impact of a carbon tax on manufacturing: Evidence from microdata. Journal of Public Economics 2014, 117, 1–14. [Google Scholar] [CrossRef]
- Mazzucato, M.; Penna, C. C. R. Beyond market failures: The market creating and shaping roles of state investment banks. Journal of Economic Policy Reform 2016, 19(4), 305–326. [Google Scholar] [CrossRef]
- Mertens, D.; Thiemann, M. Building a hidden investment state? The European Investment Bank, national development banks and European economic governance. Journal of European Public Policy 2019, 26(1), 23–43. [Google Scholar] [CrossRef]
- Metcalf, G. E.; Stock, J. H. Measuring the macroeconomic impact of carbon taxes. AEA Papers and Proceedings 2020, 110, 101–106. [Google Scholar] [CrossRef]
- Monk, A.; Perkins, R. What explains the emergence and diffusion of green bonds? Energy Policy 2020, 145, 111641. [Google Scholar] [CrossRef]
- Popp, D. Induced innovation and energy prices. American Economic Review 2002, 92(1), 160–180. [Google Scholar] [CrossRef]
- Rogge, K. S.; Reichardt, K. Policy mixes for sustainability transitions: An extended concept and framework for analysis. Research Policy 2016, 45(8), 1620–1635. [Google Scholar] [CrossRef]
- Sartzetakis, E. S. Green bonds as an instrument to finance low carbon transition. Economic Change and Restructuring 2021, 54(3), 755–779. [Google Scholar] [CrossRef]
- Schuknecht, L.; von Hagen, J.; Wolswijk, G. Government risk premiums in the bond market: EMU and Canada. European Journal of Political Economy 2009, 25(3), 371–384. [Google Scholar] [CrossRef]
- Tang, D. Y.; Zhang, Y. Do shareholders benefit from green bonds? Journal of Corporate Finance 2020, 61, 101427. [Google Scholar] [CrossRef]
- Tolliver, C.; Keeley, A. R.; Managi, S. Drivers of green bond market growth: The importance of Nationally Determined Contributions to the Paris Agreement and implications for sustainability. Journal of Cleaner Production 2020, 244, 118643. [Google Scholar] [CrossRef]
- Wulandari, F.; Schäfer, D.; Stephan, A.; Sun, C. The impact of liquidity risk on the yield spread of green bonds. Finance Research Letters 2018, 27, 53–59. [Google Scholar] [CrossRef]
- Zerbib, O. D. The effect of pro-environmental preferences on bond prices: Evidence from green bonds. Journal of Banking & Finance 2019, 98, 39–60. [Google Scholar] [CrossRef]
Figure 1.
Outstanding green debt securities in the EU-27 by issuing sector, EUR billion (face value).
Figure 1.
Outstanding green debt securities in the EU-27 by issuing sector, EUR billion (face value).
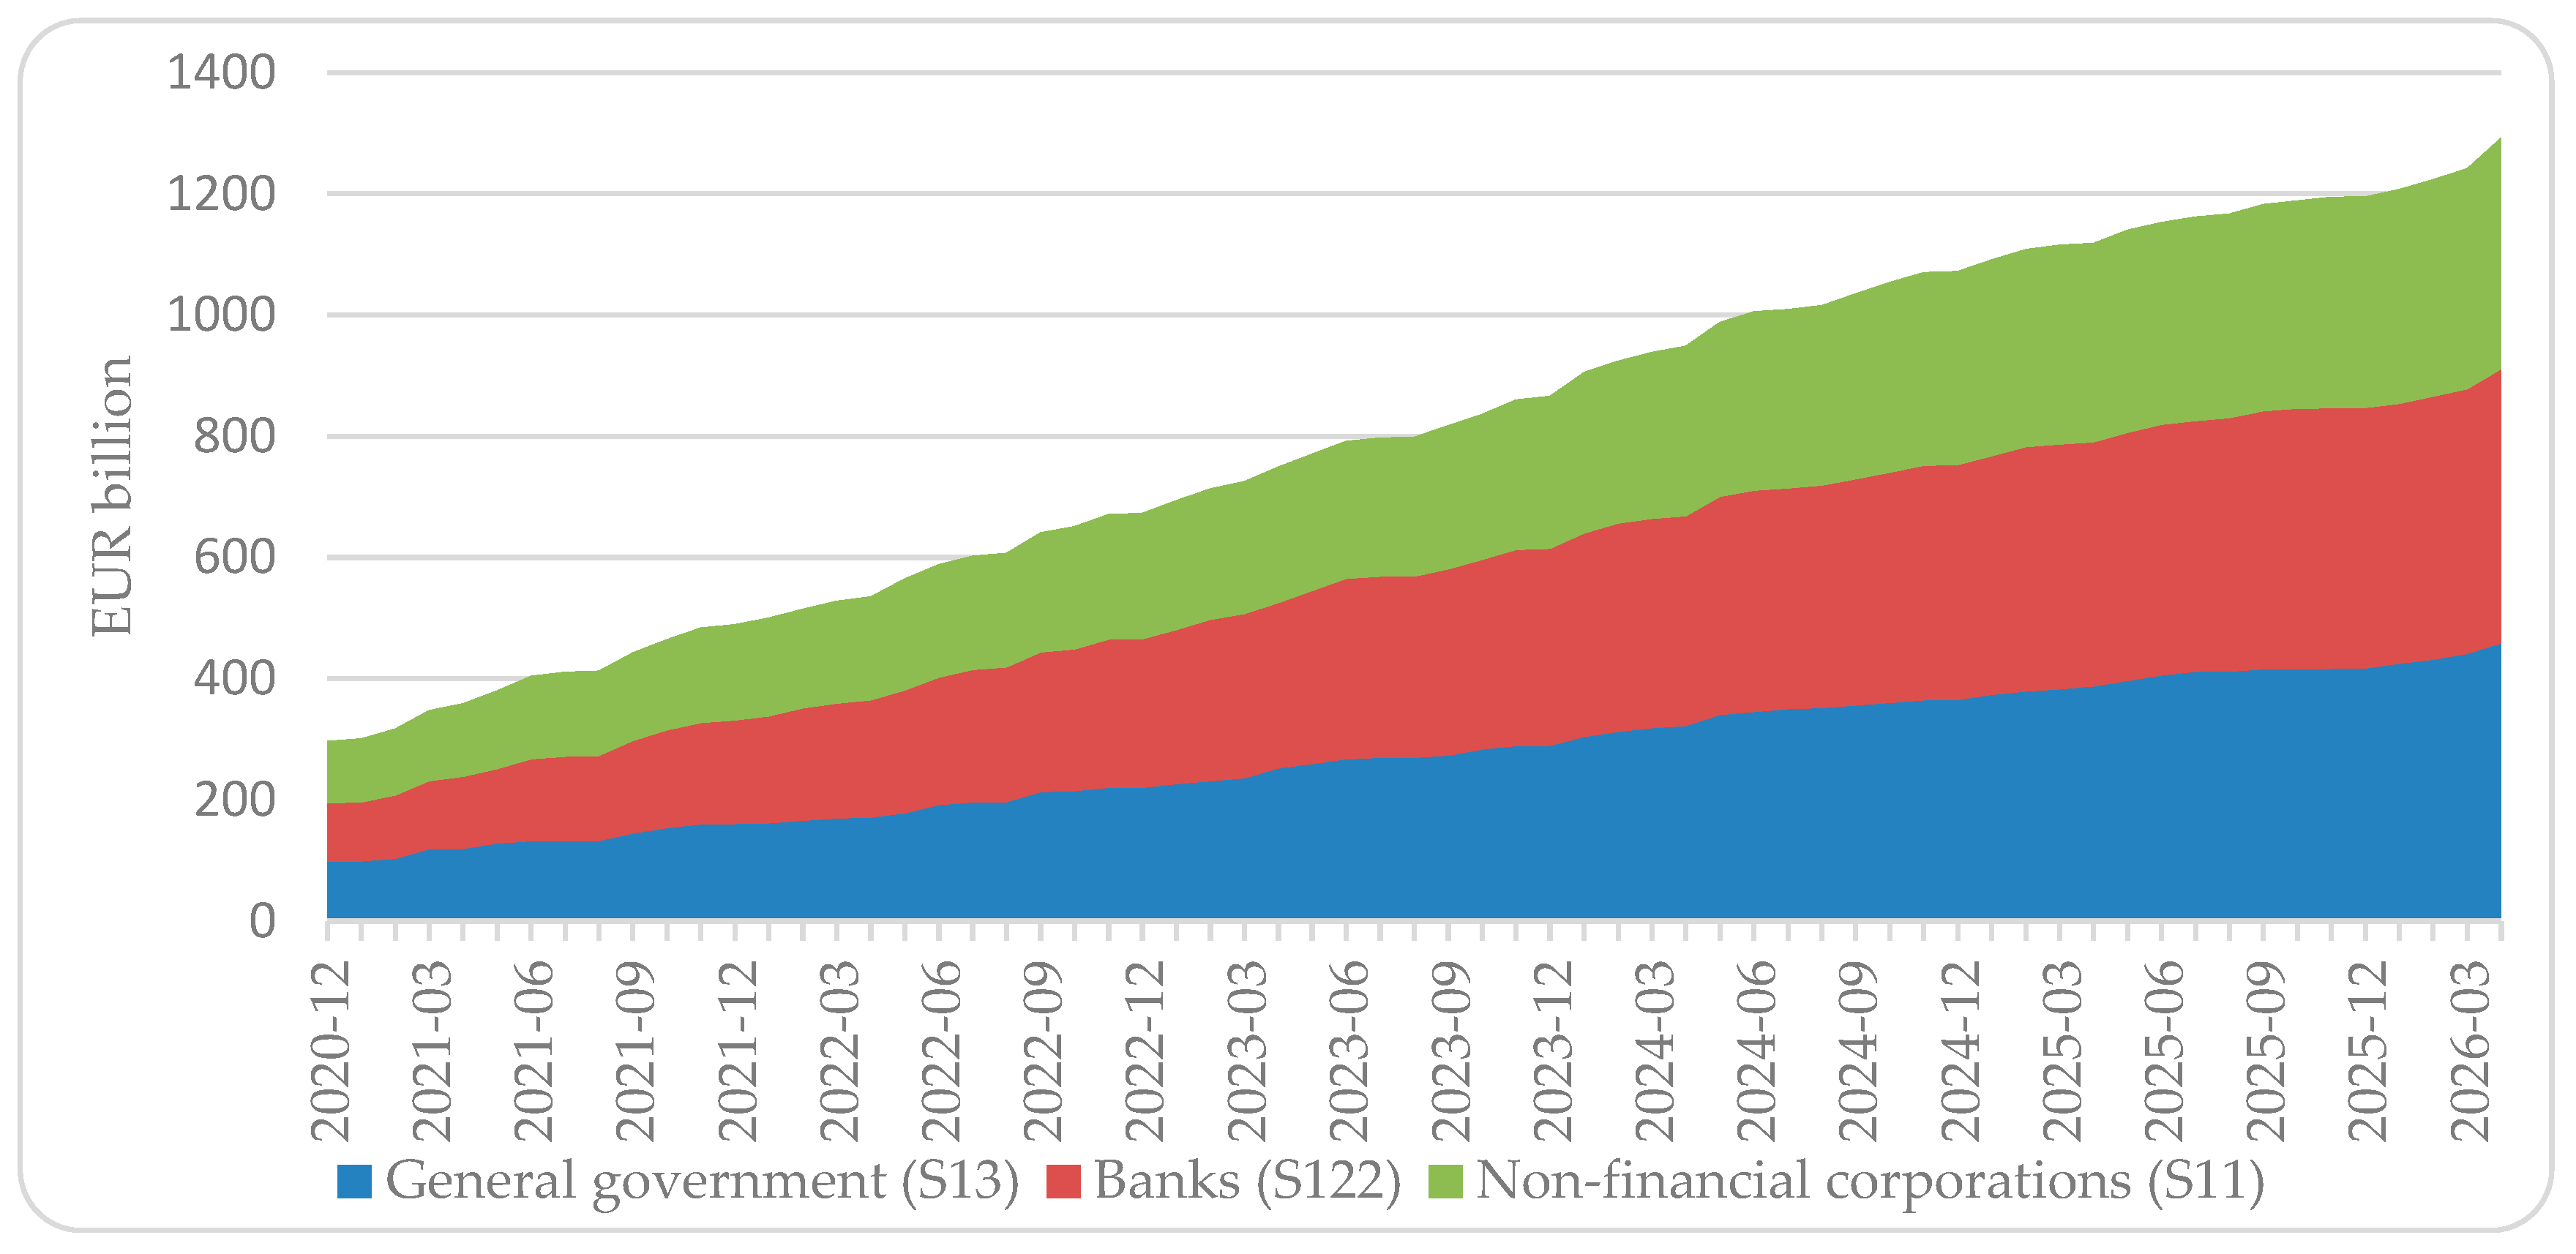
Figure 2.
Total green debt outstanding as % of GDP by member state, end-2025.
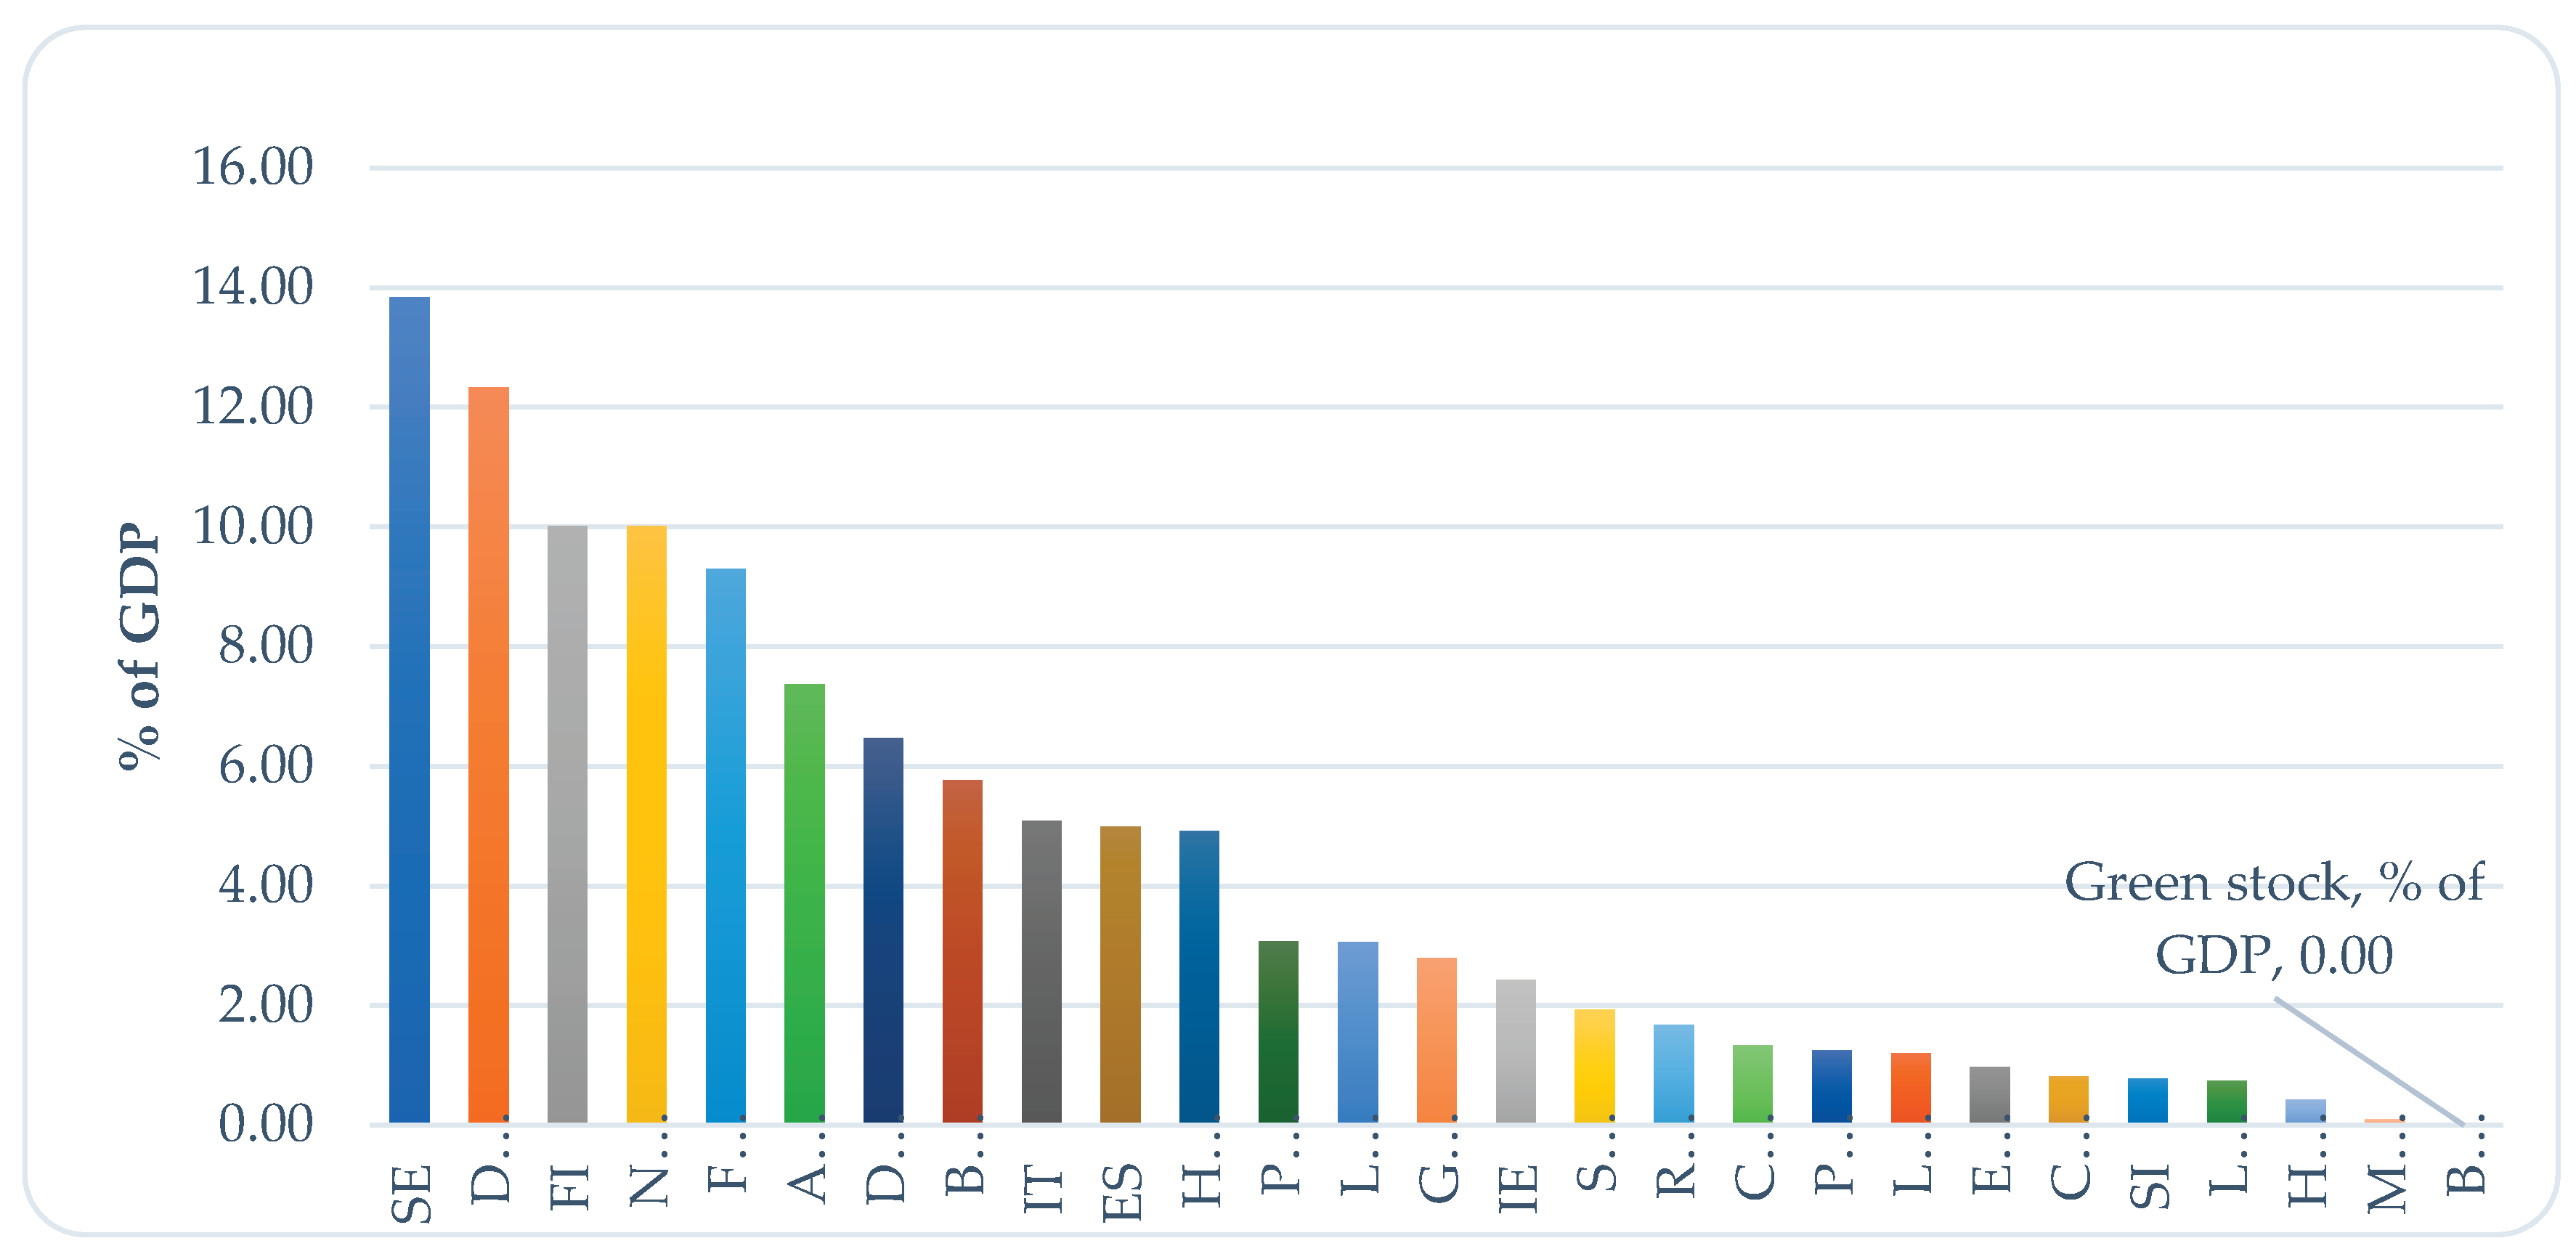

Table 1.
Descriptive statistics, 2021–2024.
| Variable | N | Mean | Std. dev. | Min | Median | Max |
| Green stock, % of GDP | 108 | 3.00 | 3.16 | 0.00 | 1.80 | 13.57 |
| ln GDP | 108 | 12.4 | 1.41 | 9.72 | 12.5 | 15.28 |
| SPO share, % | 93 | 91.15 | 18.11 | 0.00 | 96.50 | 100.00 |
| Government debt, % of GDP | 108 | 67.20 | 36.68 | 18.40 | 57.60 | 197.30 |
| Budget balance, % of GDP | 108 | -2.66 | 3.01 | -9.30 | -2.70 | 4.50 |
| Long-term interest rate, % | 108 | 2.57 | 1.80 | -0.37 | 2.77 | 7.57 |
| Environmental taxes, % of GDP | 108 | 2.33 | 0.79 | 0.85 | 2.19 | 5.62 |
| GHG emissions, t per capita | 108 | 7.42 | 2.09 | 3.80 | 7.10 | 14.90 |
Sources: ECB (CSEC); Eurostat (gov_10dd_edpt1, irt_lt_mcby_a, env_ac_tax, sdg_13_10, tec00001).
Table 2.
Probit estimates, dependent variable: sovereign green issuer (0/1), 2021–2025, n = 135.
| Variable (t−1) | AME | Cluster-robust SE | p-value |
| ln GDP | 0.243 | 0.026 | 0.000 |
| Government debt, % of GDP | -0.004 | 0.002 | 0.119 |
| Budget balance, % of GDP | -0.009 | 0.016 | 0.543 |
| Long-term interest rate, % | -0.033 | 0.025 | 0.190 |
| Environmental taxes, % of GDP | -0.056 | 0.063 | 0.370 |
| GHG emissions, t per capita | -0.053 | 0.031 | 0.086 |
Sources: own calculations.
Table 3.
Tobit estimates, dependent variable: total green stock, % of GDP, 2021–2025, n = 135 (16 censored).
Table 3.
Tobit estimates, dependent variable: total green stock, % of GDP, 2021–2025, n = 135 (16 censored).
| Variable (t−1) | Coefficient | Bootstrap SE | p-value |
| ln GDP | 1.730 | 0.423 | 0.000 |
| Government debt, % of GDP | -0.009 | 0.017 | 0.597 |
| Budget balance, % of GDP | 0.411 | 0.138 | 0.003 |
| Long-term interest rate, % | -0.197 | 0.174 | 0.258 |
| Environmental taxes, % of GDP | -0.532 | 0.658 | 0.419 |
| GHG emissions, t per capita | -0.448 | 0.310 | 0.148 |
| Constant | -11.330 | 4.418 | 0.010 |
Sources: own calculations.
Table 4.
Robustness of the intensive-margin results: selected Tobit coefficients.
| Specification | ln GDP | Budget balance | Environmental taxes | Government debt |
| Baseline (Table 3) | 1.730 | 0.411 | -0.532 | -0.009 |
| With year fixed effects | 1.692 | 0.320 | -0.411 | -0.011 |
| Excluding DE, FR, NL | 1.801 | 0.394 | -0.736 | -0.008 |
| Dependent: SPO-verified stock only | 1.711 | 0.386 | -0.371 | -0.009 |
Sources: own calculations.
Disclaimer/Publisher’s Note: The statements, opinions and data contained in all publications are solely those of the individual author(s) and contributor(s) and not of MDPI and/or the editor(s). MDPI and/or the editor(s) disclaim responsibility for any injury to people or property resulting from any ideas, methods, instructions or products referred to in the content. |
© 2026 by the authors. Licensee MDPI, Basel, Switzerland. This article is an open access article distributed under the terms and conditions of the Creative Commons Attribution (CC BY) license.
Copyright: This open access article is published under a Creative Commons CC BY 4.0 license, which permit the free download, distribution, and reuse, provided that the author and preprint are cited in any reuse.


