

Submitted:
22 June 2026
Posted:
26 June 2026
You are already at the latest version
Abstract
3D printed textile nets are fabric-like structures produced by printing a few layers of continuous, overlapping paths. These textiles can be fabricated with minimal post-processing and material waste on low-cost Fused Deposition Modeling (FDM) 3D printers. Parametric design tools for generating toolpaths can be used to create a variety of textile structures and path patterns; however, the ability to control color patterns and transitions is limited by the continuity of the printed paths. We propose using halftoning to incorporate graphics patterns into the printed nets by dynamically controlling the printed path thickness during printing. Our workflow takes a grayscale input image and translates it into a two-color halftone pattern and a segmented toolpath. Line thickness is controlled by varying extrusion amount and printing speed, resulting in a colored pattern that matches the input image. We demonstrate our concept with a series of printed textile samples and a wearable corset.
Keywords:
3D printing
; 3D printed textiles
; halftone
; textile and fashion design
1. Introduction
The world of fashion and textiles has embraced 3D printing technology as it gained more popularity and accessibility, using it to create complex works of wearable art as well as everyday apparel. Garments can be created by printing individual pieces that are then assembled by hand, or can be printed in their complete form, ready to wear. For example, in 2010, designer Iris Van Herpen [1] presented her first fully 3D printed couture dress. A few years later, Danit Peleg demonstrated how 3D printing technology can be used to produce customizable clothing on demand using flexible materials [2]. Additive manufacturing, and in particular Fused Deposition Modeling (FDM), is being used to provide fashion designers the ability to develop textiles and garments without the need for a textile factory, significantly shortening a lengthy process from ideation to fabrication, and allowing them to develop materials that cannot be produced in traditional methods. This advantage has also drawn in researchers in the field of Human Computer Interaction (HCI) to develop novel methods of producing smart textiles for interactive wearables embedded into existing textiles [3,4] and leveraging machine limitations to fabricate soft materials with new structures and mechanical behaviors [5].
Although a wide range of design typologies can be produced through additive manufacturing for garment creation, fine and lightweight textile nets exhibit particularly strong similarities to traditionally manufactured textiles. 3D printed textile nets are mesh fabric-like materials produced using FDM 3D printers using flexible filaments. These flexible filaments, typically Thermoplastic Polyurethane (TPU), are deposited in continuous, overlapping paths, forming a structure resembling a net. Such structures can exhibit mechanical properties comparable to those of conventional textiles, including flexibility, drape, and light weight. However, unlike traditional textiles, 3D printed textile nets can be enhanced with additional functional characteristics and customized for specific garments through parametric control over the material’s structure afforded by computational tools for toolpath generation.
Printed textile nets are currently being fabricated by both hobbyists and brands for fully functional garments, with companies like Nike recently presenting a highly breathable sports bra for athletes designed with a variable density net to maximize performance [6]. Brigitte Kock, designer of "Variable Seams," creates conceptual garments often made of printed textile nets that can be assembled by embedded joinery flaps without the need to sew or solder the pattern pieces. In an effort to give designers easier access to design their own garments with textile nets, companies Polymaker and Covestro have announced a collaboration to develop a designated slicer program to print textile nets with flexible materials, exemplifying the demand for a tailor-made workflow to fabricate printed fabric structures that are both attractive and functional for garments [7].
The mechanical behavior of textiles is greatly affected by their structure; therefore, slicer programs are often not utilized for fabrication, as they enable limited control over the printer toolpath. Instead, the toolpath is computationally generated using code. This code then directly creates a G-code file, which holds the instructions for the printer. Using toolpath manipulation, structural and surface characteristics of 3D printed textiles can be systematically tuned through a variety of design and fabrication strategies; however, control over color patterning remains significantly challenging. In FDM printing, mid-print color changes are particularly susceptible to cross-contamination and filament stringing, a challenge that is further intensified when using flexible materials. Although multicolor printing can be achieved using specialized equipment—such as commercially available color-changing or split-color filaments—control over the distribution of colors within the toolpath is limited, since the continuity of the path is disturbed,
Our goal is to develop a workflow to incorporate multicolored patterns into 3D-printed textile nets while adhering to several design guidelines. The first is preserving maximal toolpath continuity to maintain structural integrity and eliminate stringing. The second is achieving a relatively thin fabric with a drape similar to traditional textiles. The third guideline is decoupling the color pattern from the fabric structure, enabling the design of functional structures regardless of the color pattern. And finally, the workflow should be suitable for desktop FDM printers using commercially available flexible TPU filament, employing only one material swap, or none if using a printer with a dual extruder system.
In order to achieve these design guidelines, we turned to halftoning, a technique of reproducing images with smooth, variable tones. This technique is commonly used to translate an image into a dot pattern with varying size or spacing, enabling reproduction with a single color. Historically, this technique has been used mainly for print media; however, it is also used for other fabrication methods, such as knitting and weaving. Textile designers often use halftoning to translate images into various structures in a jacquard design with two colored yarns, each structure exposing the yarns to the fabric surface in different proportions, thereby creating tonal variation while maintaining the fabric’s structural integrity. Halftoning allows different designs to be produced on a single machine, requiring only a change in the digital input to switch designs. In 3D printing, halftoning has also been used to overcome material color limitations, such as printing 3D objects with shading and hue variation using a “hatching” method with two colors [8], while considering the limitations of layered printing [9]. Some 2D graphics software for hobbyists allows the creation of a halftone vector graphic from an image, which is then transformed into a 3D mesh that can be printed with a slicer [10]. However, these methods do not support the specific structural requirements necessary for 3D printing of textile nets.
Our workflow uses halftoning to incorporate color patterns and image reproduction into 3D printed textiles while maintaining their structural integrity. We use a standard FDM printer and off-the-shelf flexible filaments in two colors. The workflow enables dynamic control of the extrusion amount and printing speed to modulate the thickness of the printed path, thereby increasing the visual weight of one color relative to the other. We use a grayscale image as input to generate a net-shaped toolpath consisting of two overlapping layers. Then, we segment the toolpath and calculate a target thickness for each segment. Our algorithm assigns different extrusion and speed values for each segment (see Figure 1). The grid-like structure guarantees a stable printed material with continuous lines, much like a woven fabric consisting of warp and weft. This approach allows us to control color pattern, generate color transitions and reproduce images, regardless of the material structure. To demonstrate this workflow, we present several printed swatches with a variety of color patterns, and four textile-like swatches with the same pattern but constructed using different grid formations. These swatches have different mechanical properties to show that the printed textile can be detached from the color pattern. We also demonstrate a fully printed patterned corset, to show how our approach can be integrated into a wearable garment.
This work contributes to personal fabrication of textiles and garments by developing a method for calibrating printing parameters to achieve a target path thickness and presenting an end-to-end workflow for 3D printing highly detailed, multi-colored, patterned textile nets using FDM printers. To empower designers, researchers, and makers to generate expressive, textile-like structures, we contribute an online accessible parametric design tool for generating halftoned 3D printed textile nets. This tool can be used to create a variety of applications in fashion, wearable technology, and soft goods prototyping.
2. Related Work
2.1. 3D Printed Textiles
Printing textile-like materials in Additive Manufacturing (AM) has been explored in academic, commercial, and hobbyist settings using accessible printing technologies, such as FDM and Selective Laser Sintering (SLS). In the fashion industry, this approach has been utilized both for scalable production of shoes with Nike producing 3D printed shoe uppers [6], as well as in high fashion with Iris Van Herpen creating intricate 3D printed sculptural garments [11]. FDM technology in particular has been widely used in the development of printed textiles due to its low cost, simplicity, minimal post-processing and wide range of materials. By using more rigid materials to create interlocking components, chainmail structures can be printed and used as a flexible yet durable fabric [12]. Self forming structures have also been explored, opening up the possibility for garments that require minimal construction after fabrication [13]. While these approaches to creating printed textiles can create sculptural and highly durable wearables, research into mimicking traditional textiles structures has also been shown, with printed woven structures [14,15], as well as knitted and lace-like structures [16]. The structures produced have a measurable effect on the mechanical properties of the printed textile [17], indicating that precise control over the printing toolpath and parameters is a key aspect of fabricating functional 3D-printed textiles.
2.2. Direct Manipulation of Toolpath and Printing Parameters
3D printing is typically performed by slicing a 3D model using a designated software that translates the morphology into a G-code file that holds instructions for the printer. To increase the design space of 3D printed objects, researchers use computational tools to directly manipulate the toolpath and produce a custom G-code. Examples include texturing of models and surfaces [18,19,20,21], as well as expanding self-expression in the fabrication process [22,23,24].
In the case of printed textiles, direct G-code manipulation has been used to overcome challenges in the fabrication process and allow for specific mechanical and aesthetic qualities that can only be achieved by directly controlling the toolpath and printing parameters. The toolpath direction has been shown to be a key parameter in controlling printed self-forming structures [25], as well as a significant factor in printed object strength [26]. Controlling printing parameters such as feed speed, retraction, and extrusion amount can be utilized to create quasi-woven fabrics, such as in "DefeXtiles" which takes advantage of under extrusion to create both highly flexible textiles and incorporate images into the printed fabric [5]. Toolpath manipulation is also used to more accurately recreate the mechanical qualities of traditionally made textiles, such as 3D-printed spacer fabrics, a technique for producing meta-materials analogous to knitted spacer fabrics, by leveraging bridging and stringing [27].
2.3. Multicolor FDM Printing
FDM printing produces printed objects in a layer-based deposition, with the extruder nozzle depositing a single filament that gradually builds the structure. This creates a challenge for printing different colors in a single printed object, as transitioning between colors mid-print can produce artifacts and, particularly in the case of printed textiles, harm the structural integrity of the printed material. Previous work addresses this issue by machine modifications, such as a printer head that dyes filament with markers prior to extrusion [28] as well as a “multi-in-one-out” extruder that mixes colors in a controlled gradient [29], but these techniques are not widely accessible and have limited filament compatibility. Another strategy is programming color changes directly into a custom printed filament that can then be used to print an object with predetermined color placement [30,31], yet this approach has a tendency for pollution from residual colors in the single nozzle, and includes a lengthy process of producing custom filament that must be printed perfectly, without any common errors such as nozzle jamming. Creating a method of "cleaning" the printer nozzle between color changes has been proven beneficial in reducing artifacts in multi-color printing using several extruders, both in research [32], as well as in some commercial printers, yet this approach creates material waste. While these methods make strides towards achieving successful multicolored printing on FDM printers, they do not address the specific requirements of printed textiles in terms of structural and material requirements.
3. Methodology
Our workflow enables dynamic modulation of printed path thickness to generate halftoned graphic patterns. In FDM printing, the path thickness is affected by several factors. The first is the nozzle diameter. In this work, we employ a standard 0.4 mm nozzle mounted on a Prusa XL five-toolhead printer, with only two of the extruders active throughout the experiments. Another parameter is the nozzle position in the Z-direction relative to the build plate or previously deposited layers. The cross-section of the first printed layer is typically flattened due to compression against the build surface as the material exits the nozzle, whereas subsequent layers exhibit a more rounded cross-section as the extruded material can flow and settle more freely. We set the nozzle–build plate distance to 0.2 mm for the first layer and to 0.4 mm for the second layer. The remaining two parameters are feed speed and extrusion amount, both actively controlled in this work. These parameters are inherently linked, and synchronized manipulation of both is necessary to achieve the full range of achievable line-path thicknesses. Specifically, lower feed speeds combined with higher extrusion rates produce thicker lines, while higher feed speeds with minimal extrusion result in finer lines. This relationship is limited by the mechanical constraints of the extrusion system: delivering too much material at high feed rates increases internal nozzle pressure. When printing with flexible filaments, this increased back-pressure can cause filament buckling or extrusion jams. Therefore, a carefully balanced strategy for setting the feed speed and extrusion is essential. We control the extrusion amount by dividing the length of each segment by a factor called the E-factor to determine the extrusion value in the G-code. A higher E-factor decreases the line thickness because the resulting extrusion value becomes smaller, while a lower E-factor leads to a thicker line. Initial exploratory experiments showed that a feed rate between 750 and 2550 mm/min is suitable for producing a wide range of printable path thicknesses; feed rates outside this range caused only minimal changes in line thickness. Similarly, the E-factor was limited to a range of 5 to 23, as values outside this range did not significantly affect thickness variations. Lower values of either parameter were found to be impractical because they caused unstable extrusion, with increased back-pressure, filament buckling, and eventual nozzle jamming. From these initial tests, we defined the range of achievable line thicknesses, which serves as a baseline for calculating the target thicknesses described in the next section. For all samples, we use off-the-shelf TPU filament with a shore hardness of 95A. The algorithm and user interface are implemented in Grasshopper for Rhino 8, and also in an accessible browser-based design tool that is available for use in this paper’s supplementary materials.
3.1. Calculating Path Thickness Based on Image Sampling
Our workflow starts with a grayscale image and a flat-surface geometry, positioned on the coordinate systems and dimensions within the printer platform. Based on the user input, the surface is divided into sub-surfaces, where each sub-surface functions as a pixel in the generated pattern. Two lines are generated by connecting the middle points of each pair of opposing edges of the subsurface. These lines will construct the first and second layer toolpaths when printed consecutively.
The middle point of the subsurface area is used to sample the brightness at the closest point to the input image. The sampled brightness value (a number between 0 and 1) is used to determine the thickness of each line segment by remapping the value’s range to the range of the obtainable line thickness measured by our initial experiment. The mapping of the second layer is done for the inverse brightness value (one minus the sample value). Since each sub-surface is a pixel, the division of the main surface determines the printed net spacing and the sampling resolution of the input image. In the Grasshopper user interface, this subdivision is controlled parametrically via sliders, allowing users to interactively adjust sampling resolution and printed spacing.
In our fabrication process, we print each layer in a different color. The result is that one color is always displayed on top, masking part of the first layer’s path, and reducing the visual weight of the first layer compared to the second. To re-balance the visual weight in order to match the sample image brightness values, we incorporate a compensation calculation to determine the final target path thicknesses.
Figure 2 illustrates a single subsurface pixel-cell in the target surface. The two perpendicular paths are generated by connecting the midpoint of opposite edges and adding thickness. The path thickness is defined by p1 (the first layer) and p2. The length of each line is marked as L1 and L2 for the first and second layer, respectively. Based on equations 1 and 2, we calculate the visible areas A1 and A2 of the paths for both the first and second layers. Our approach for compensating the masked area is based on equalizing the visible area in the maximal and the minimal brightness cases (sampled brightness is 0 and 1) when A1is minimal, A2 should be maximal, and vice versa. To calculate the maximum possible area of A1, we use the maximum value of P1 (from the initial experiment), with the minimum value of P2. We can then use the maximum value of A1as the maximum value of A2 (since they should be equal) and determine the maximum value of P2. The minimal thickness of P2 is determined using the initial printing experiment. It should be the minimum possible thickness while preserving the fabric’s structural integrity. The maximum thickness of P1 is also derived from that experiment: it should be the thickest possible that the printer can produce.
Based on that, we simulate the textile pattern by using a Grasshopper line preview component and assigning the mapped value of each pixel cell (see Figure 3 ).
3.2. Calibration of G-Code Print Parameters for Target Line Thicknesses
The goal of this phase is to obtain the printing parameters required to achieve the target thicknesses that were calculated in the previous phase. The initial code test revealed discontinuities in the resulting line thickness, indicating that the linear assignment of parameters was insufficient to achieve consistent fabrication results. To address this, we conducted a calibration experiment to establish a quantitative relationship between the printing parameters and the resulting line thickness.
To characterize the combined effects of print speed and E-factor under different deposition conditions, we conducted a systematic calibration experiment. Since a line printed directly on the build surface behaves differently from a line deposited on top of a previous layer, we tested two configurations: in the first, lines were printed using black filament directly onto A4 paper; in the second, identical lines were printed onto A4 paper pre-filled with perpendicular lines printed in white filament, such that the tested lines constituted a second-layer deposition relative to an underlying filament pattern.
For each printed sheet, five groups of straight, parallel lines were generated at a fixed print speed while varying the E-factor within each group. Each group consisted of ten lines printed with E-factors of 5, 7, 9, 11, 13, 15, 17, 19, 21, and 23. This procedure was repeated at five print speeds (750, 1200, 1650, 2100, and 2550 mm/min). On each sheet, the first group was treated as a control to account for transient start-up artifacts commonly observed at the beginning of a print; only the remaining four groups were included in the analysis.
Line thickness was quantified by scanning each sheet and extracting measurements at three locations along every printed line. Measurements were automated using a Python-based image-processing pipeline, which sampled the scan by projecting three probe lines perpendicular to the printed lines. At each intersection, the local line thickness was computed, averaged per line, and subsequently aggregated across lines sharing the same E-factor within a given sheet. This measurement procedure was applied identically for both deposition configurations.
The resulting line-thickness measurements were embedded into a continuous interpolation map spanning the explored print-speed and E-factor parameter space (Figure 4). This interpolation map forms the basis for subsequent parameter-selection strategies used for the pattern generation. For the complete raw dataset, see Appendix A.
3.3. Optimization of Print Parameters for Efficient Deposition
Because both feed rate and E-factor influence line thickness, multiple parameter combinations can yield identical thickness values. To address this ambiguity, we evaluated two parameter-selection strategies defined on the calibrated interpolation map. The first strategy prioritizes higher feed-rate values to minimize fabrication time (see Figure 4). The second strategy selects intermediate parameter values, accounting for the printer’s tendency to jam under abrupt parameter transitions, such as rapid changes from high to low feed rates or from high to low E-factors.
To assess the effectiveness of these parameter-selection strategies, we fabricated the 20 target thickness values three times on A4 sheets and measured the resulting lines using the same Python-based image-processing pipeline described previously. Each fabrication corresponded to a different strategy: the speed-prioritized strategy, the mean-range strategy, and a baseline linear mapping strategy in which printing parameters were mapped linearly to the target values without reference to the calibrated interpolation map. Measured line thickness was compared to the target thickness values to quantify accuracy across strategies (see Figure 5). For the complete raw dataset, see Appendix B.
In addition to the line-based evaluation, three halftoned samples were fabricated from the same source image using the linear mapping strategy and the two proposed parameter-selection strategies. These samples were used to assess the impact of parameter selection on the image’s overall appearance (see Figure 6).
3.4. Examining Image Encoding Across Different Grid Structures
To examine whether the image-encoding workflow is independent of the underlying toolpath geometry, we applied the same image to multiple substrate grid structures while keeping all image-mapping and parameter-selection settings constant. The same source image, thickness range and mean-range parameter-selection strategy were used across all samples.
Four alternative base line arrangements were generated: (1) an orthogonal grid in which each intersection formed a right-angle “plus” configuration, (2) a diagonal “X” grid composed of alternating obtuse and acute crossing angles, (3) an angular chevron-pattern grid, and (4) a curvilinear grid composed of continuous curves rather than straight line segments. In all cases, the image was mapped onto the surface and translated into a two-layer toolpath (Figure 7).
By varying only the toolpath topology while holding the image content and parameter mapping fixed, this experiment isolates the effect of grid geometry on the resulting printed textile. The fabricated samples were subsequently used for visual inspection and manual mechanical evaluation.
Once the final samples fabricated were examined both structurally and visually, a web-based interface was created for producing dual color textile nets using the code, in which the user can upload a source image, control the different parameters of the image appearance and textile structure, and download a G-code file for printing on either a single or multi head printer. Users can control image parameters such as brightness and contrast, as well as the line spacing on each layer, and simultaneously preview their effect on the final printed lines and overall structure.
4. Results
4.1. Calibration of Printing Parameters
Analysis of interpolation maps revealed a clear and consistent relationship between feed rate, E-factor, and the resulting line thickness (Figure 4). Although both parameters influence the thickness of the deposited line, their effects differ substantially in character. In particular, variations in the E-factor exhibited a distinctly nonlinear response: linear mapping of the E-factor prior to thickness calibration resulted in systematic inaccuracies and a bias toward producing a wider range of thinner lines. We attribute this behavior to the nature of the E-factor. The extrusion value is obtained by dividing the printed line length by the E-factor, resulting in non-uniform, exponential step changes rather than moderate ones.
Despite local point-wise deviations, the overall trends in line-thickness behavior were highly consistent across both printed layers. The measured data showed smooth, monotonic variation in thickness as a function of the parameters, indicating stable and predictable system behavior within the explored range. Notably, data points were more densely clustered in the lower regions of the parameter space, reflecting higher sensitivity and finer thickness resolution at lower feed-rate and E-factor values.
While extending the parameter ranges toward higher feed rates and E-factors is technically feasible, the data indicates diminishing sensitivity in these regions. Achieving a noticeable change in line thickness at higher values would require increasingly larger parameter increments, reducing practical controllability. These observations motivated the preference for calibrated, interpolation-based parameter selection and informed the evaluation of alternative parameter-selection strategies described in the following sections.
4.2. Optimization of Print Parameters for Efficient Deposition
The comparison of measured line thickness to the target thickness values demonstrates that both calibration-based parameter-selection strategies achieve high accuracy. As shown in the comparative plot, the mean-range strategy yields the highest and most consistent performance (Figure 5). The speed-prioritized strategy also achieves relatively high accuracy, indicating that prioritizing fabrication speed does not inherently compromise thickness control. In contrast, the baseline linear mapping strategy performs substantially worse, with accuracy values spanning a much wider range. This degradation confirms that linear parameter mapping without reference to the calibrated interpolation map fails to account for the nonlinear response of the E-factor and leads to unreliable thickness control.
Despite its relatively high accuracy, the speed-prioritized strategy exhibited reduced process stability. Multiple print attempts were required before a complete and measurable sample could be produced, with the print failing three times prior to successful completion. These failures predominantly occurred during abrupt transitions from high to lower feed rates combined with significant reductions in E-factor, highlighting the sensitivity of the system to aggressive parameter jumps. By comparison, the mean-range strategy was reliably completed without observed print interruptions, indicating superior robustness alongside higher accuracy.
Together, these results reveal a clear trade-off between fabrication speed and process stability. While both calibrated strategies outperform the linear mapping, in terms of accuracy, the mean-range strategy provides the most reliable balance between thickness fidelity and robust print execution.
Figure 6 depicts a visual comparison between the three halftoned samples generated using linear, mean-range, and speed-prioritized parameter-selection strategies. The mean-range strategy produces the most accurate reproduction of the source image, exhibiting higher apparent resolution, clearer detail, and improved tonal continuity. The linear strategy also yields an image that remains faithful to the original content, but with reduced resolution and loss of fine details, resulting in lower overall visual fidelity. In contrast, the speed-prioritized strategy failed to consistently produce a complete and stable print after multiple attempts. Moreover, the abrupt parameter transitions associated with this strategy appear to negatively affect image accuracy: regions with strong local contrast exhibit visible deviations, leading to an output that differs substantially from the mean-range result. This outcome contrasts with the relatively high thickness accuracy observed for the speed-prioritized strategy in the line-based calibration tests, indicating that local parameter stability plays a critical role in image-level halftoning performance beyond isolated line accuracy.
4.3. Applying Image to Different Structures
Figure 7 shows the comparison of four different grid types reproducing the same image. The visual appearance of the encoded image remained nearly identical across samples. In several structures, adjustments to line density were required relative to the original configuration, as the orientation of the base lines influenced the effective spatial density of the pattern. These adjustments resulted in only minor variations in perceived contrast and fine detail.
Despite these small differences, all samples maintained a high level of visual fidelity, with consistently high resolution and accurate reproduction of the source image. In contrast to the largely invariant visual outcome, the different grid structures exhibited different mechanical behaviors. Structures A and D produced comparatively stable textiles, whereas structures B and C demonstrated increased stretchability. This decoupling between visual encoding and mechanical behavior indicates that a wide range of textile-like mechanical properties can be achieved, enabling designers to apply different performative structures while preserving the visual appearance of their patterns.
4.4. Printed Swatches of Different Patterns
Utilizing the finalized workflow integrated with the mean-range strategy, a series of printed samples, each measuring 100 × 100 mm, was fabricated to evaluate the system’s performance across a broad spectrum of visual complexities (Figure 8). The fabrication process aimed to stress-test the system’s ability to reconcile two often-conflicting goals: high-fidelity edge definition and fluid tonal transitions.
The printed results demonstrate notable success in reproducing both. Source images containing varying grayscale values yielded samples that successfully achieved optical color mixing, creating the perception of new hues that were not originally present in the raw filaments. This effect was generated not through the physical blending of the materials, but via a fine, consistent layering of the base colors. Conversely, samples derived from strictly black-and-white source images exhibited sharp, highly accurate boundaries. These crisp transitions were maintained even down to a scale of mere millimeters, a significant achievement given the inherent logic of the method, which dictates that both filament colors are physically deposited at every single point across the sample. Ultimately, while this strategy excels at maintaining color integrity and generating optical gradients, the precise resolution of the geometric contours remains intrinsically linked to the pattern’s scale and the underlying logic of the surface division.
4.5. Case Study: Printed Patterned Corset
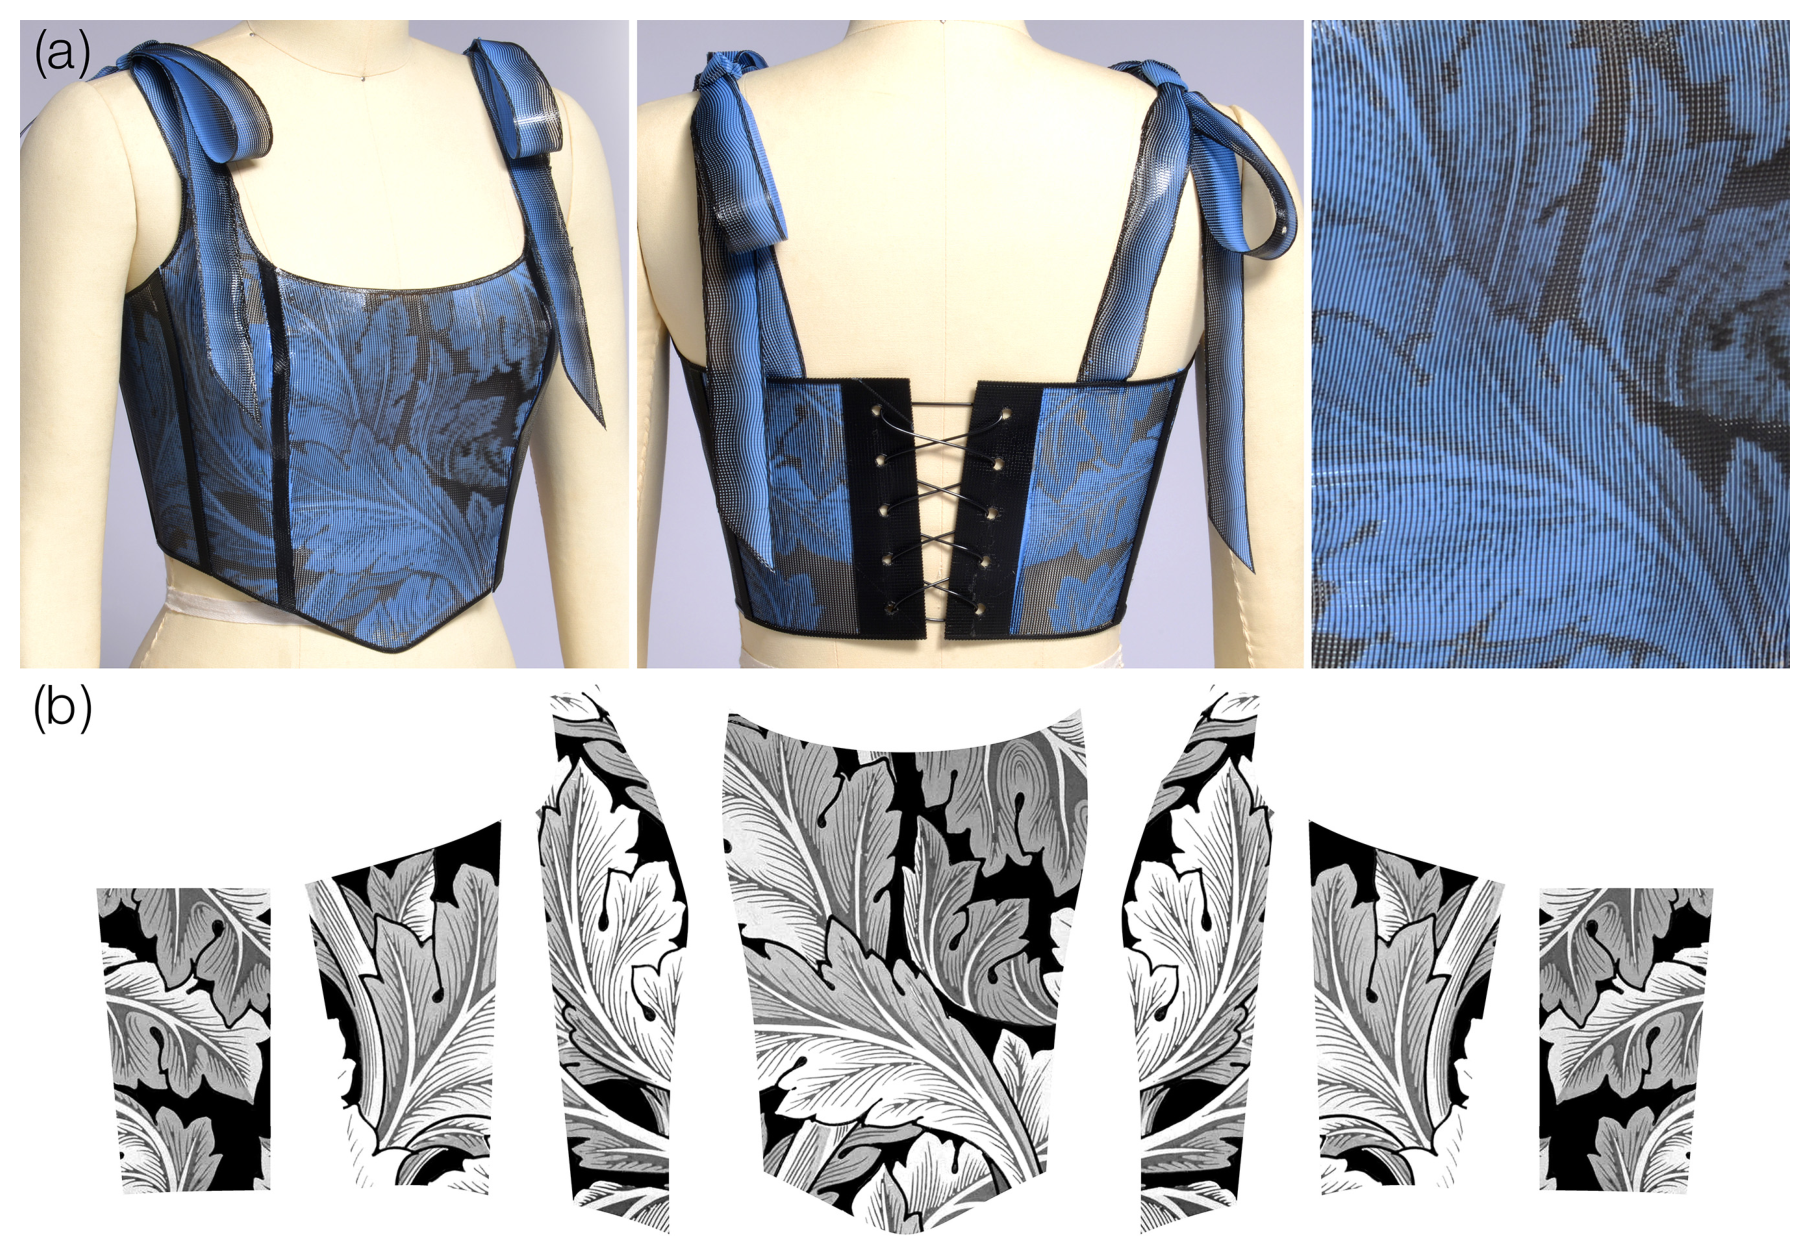
To demonstrate the complete workflow in a garment-scale application, a fully printed patterned corset was fabricated using our parametric tool. The corset pattern was inspired by Acanthus, a textile motif by designer William Morris, and was printed using two different colored TPU filaments (Figure 9). The garment consisted of eleven individual pattern pieces: seven pieces forming the bodice and four pieces forming the straps.
All pattern pieces were converted into closed vector curves in Rhino. The halftoning code was adapted to ensure correct toolpath generation within the boundaries of each pattern piece. Instead of deriving all pieces from a single large source image, individual grayscale graphics were prepared in Photoshop for each pattern piece. These images served as direct inputs to the halftoning workflow, enabling mirrored and piece-specific image placement analogous to textile pattern cutting, rather than digitally “cutting” shapes from a continuous image.
Different underlying grid structures were applied to distinct garment regions. The bodice pieces were generated using an orthogonal grid, while the straps employed a curvilinear grid to better accommodate their geometry and expected deformation. Additional functional features, including contour reinforcement along the edges, as well as localized layers for boning and lacing, were modeled directly in Rhino and integrated into the final G-code alongside the halftoned toolpaths.
All corset components were joined through localized thermal fusion of the seams, resulting in a fully mono-material garment. Because the pattern pieces were printed directly to the shape rather than cut from a larger sheet, the fabrication process did not produce material waste.
5. Discussion and Limitations
This research demonstrates a method for fabricating 3D-printed textile nets with dual color patterns and graphics by leveraging halftoning on the printed paths. While halftoning using lines is sometimes considered hatching, in our case, we use segmented lines with a fixed frequency as a grid of pixels, applying a different visual weight to each pixel, thus generating tonal variations, which are associated with halftoning.
By maintaining a stable underlying grid structure and encoding images through calibrated line-thickness variation, we achieve complex and expressive color patterns and transitions. Our method relies only on dynamic modulation of printing parameters, does not require any hardware modification, and utilizes standard FDM 3D printers.
Beyond visual encoding, the results highlight the capacity to tune textile-like mechanical behavior through toolpath design alone. Applying the same image to different grid topologies produced nearly identical visual outcomes, while yielding markedly different mechanical responses. In particular, diagonal and chevron-based grids exhibited increased elasticity at lower surface divisions, whereas orthogonal and curvilinear grids remained comparatively stable. This behavior mirrors established principles in traditional textile manufacturing, where yarn orientation, weave pattern, and stitch geometry determine mechanical performance independently of surface patterning. The observed trade-off between visual resolution and mechanical compliance further reinforces this analogy: reducing surface divisions slightly lowers image contrast, similar to decreasing pixel resolution in 2D graphics, while simultaneously producing lighter, more flexible textiles. This relationship is comparable to variations in gauge in knitted jacquard fabrics or thread count in woven textiles.
At the system level, the work reveals a fundamental balance between fabrication efficiency, parameter stability, and output fidelity. While aggressive parameter changes can achieve accurate line thickness in isolated tests, image-scale printing exposes the sensitivity of flexible filament extrusion to abrupt transitions in speed and extrusion rate. This underscores the importance of smooth, interpolation-based parameter selection when scaling from controlled calibration experiments to complex patterned artifacts. Taken together, the results position this workflow as a digitally driven textile fabrication method that bridges image processing, parametric design, and additive manufacturing, offering a pathway toward customizable, mono-material, and waste-free printed garments with tunable visual and mechanical properties.
The proposed workflow is subject to several limitations that constrain its current scope and applicability. First, the system is tightly coupled to the specific FDM printer and flexible filament used in this study. The parameter mapping is calibrated to the particular printer configuration, and applying the workflow to a different printer, extrusion system, or nozzle geometry would require an additional line-calibration experiment.
Second, visual resolution and mechanical behavior are inherently linked to the surface subdivision density. Increasing subdivision improves image fidelity but lengthens the print time and material usage, while decreasing subdivision enhances flexibility and reduces weight at the expense of contrast and fine detail. This trade-off imposes practical limits on scalability and requires case-specific balancing depending on the intended application.
Finally, the current implementation is limited to two filament colors, which restricts the achievable tonal range and color complexity of printed images. While grayscale halftoning is well supported, extending the approach to multi-color or full-color imagery would require additional strategies for color mixing, layering, or coordination among multiple toolheads. Future work will focus on visual color mixing through toolpath manipulation to achieve richer visual expression and broaden the system’s applicability to decorative and expressive textile design.
6. Conclusions
In this work, we propose a method for printing dual-colored textiles while maintaining material functionality and cohesion, enabling the encoding of any pattern or image into a variety of structures. This contributes to the enrichment of the CAD process of 3D printing textiles and soft wearables in a highly accessible way, without the need for prior knowledge of G-code manipulation or image processing and using standard FDM printers and filaments.
Furthermore, our line mapping results, which show that uncalibrated linear parameter mapping is insufficient for reliable thickness control and that a mean-range value strategy provides the most reliable results of a printed toolpath, contribute to any 3D printing application wherein printed line thickness accuracy is crucial. In the field of image reproduction in FDM 3D printing, we show that our calibration-driven approach significantly improves visual fidelity and thickness accuracy compared to linear parameter mappings, while maintaining the stable underlying grid structure. Image resolution and tonal balance are directly controlled through grid density and parameter selection, allowing visual complexity to be tuned independently of the fabrication process.
The workflow was further validated through a garment-scale case study, demonstrating its applicability to soft wearables and complex patterned artifacts. The corset was fabricated in separate pieces without creating waste by applying the workflow directly into the pattern piece boundaries and using localized thermal joining for an adhesive-free assembly. The workflow allows both for placement patterns to be made and for a larger source image to be cropped to the pattern boundary, mimicking the traditional patterned textile design process without any material waste or cutting.
To further enhance the accessibility of the system, a browser-based design tool was developed, eliminating the requirement for prior knowledge of G-code manipulation or proficiency in advanced software such as Grasshopper. By democratizing the workflow for a broader range of end-users, this work positions standard FDM 3D printers as viable platforms for digitally driven, sustainable, and customizable textile design, bridging image processing, parametric modeling, and additive manufacturing within a single, accessible design framework.
Appendix A. Calibration of G-Code Print Parameters for Target Line Thicknesses Raw Data
This appendix presents the collection of visual samples and raw measurement data for the line width experiments detailed in Section 3.2. Figure A1 displays the printed test to calibrate print parameters against the target line width. The resulting mean measurements for both the first and second layers are summarized in Table A1 and Table A2, respectively.
Figure A1.
Experimental setup evaluating line width across five print speeds (750–2550 mm/min) and incremental E-values (5–23, odd only).
Figure A1.
Experimental setup evaluating line width across five print speeds (750–2550 mm/min) and incremental E-values (5–23, odd only).
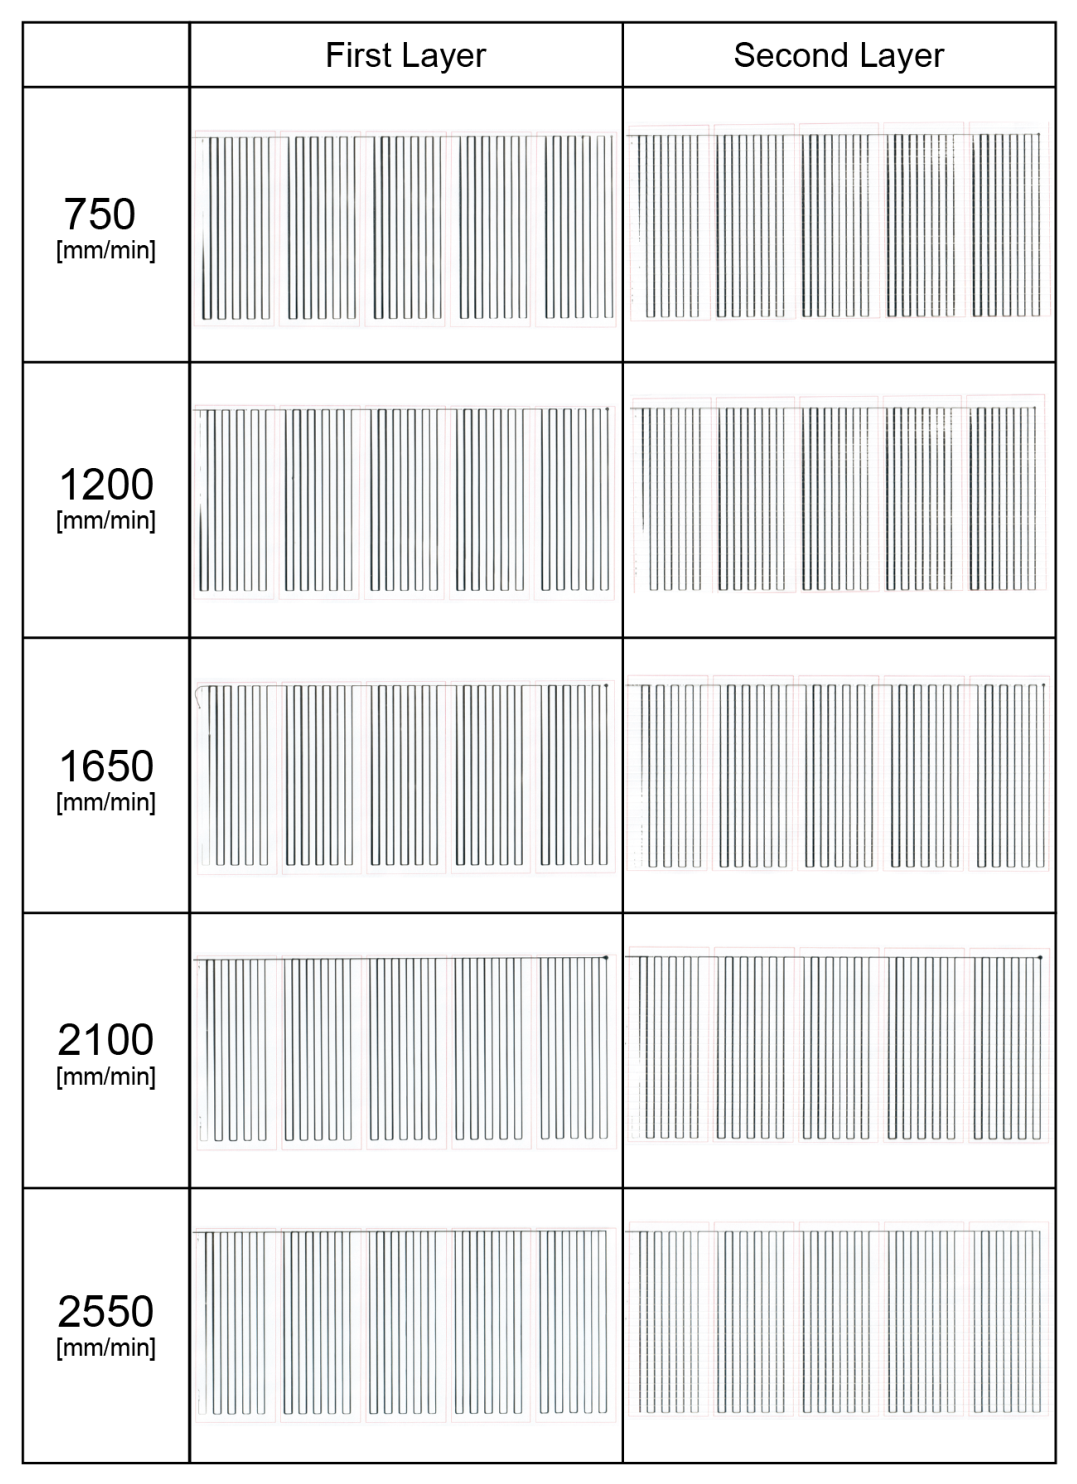

Table A1.
Measured mean line widths [mm] for the first-layer prints shown in Figure A1. This dataset is visualized in Figure 4.
| E-Factor | Feed Rate 750 | Feed Rate 1200 | Feed Rate 1650 | Feed Rate 2100 | Feed Rate 2550 |
| 23 | 0.45 | 0.45 | 0.44 | 0.44 | 0.44 |
| 21 | 0.48 | 0.48 | 0.47 | 0.47 | 0.47 |
| 19 | 0.52 | 0.51 | 0.51 | 0.5 | 0.5 |
| 17 | 0.56 | 0.56 | 0.55 | 0.55 | 0.54 |
| 15 | 0.62 | 0.61 | 0.61 | 0.6 | 0.6 |
| 13 | 0.7 | 0.7 | 0.69 | 0.68 | 0.68 |
| 11 | 0.78 | 0.78 | 0.77 | 0.76 | 0.76 |
| 9 | 0.92 | 0.91 | 0.9 | 0.89 | 0.88 |
| 7 | 1.1 | 1.09 | 1.08 | 1.06 | 1.05 |
| 5 | 1.25 | 1.24 | 1.23 | 1.21 | 1.2 |
Table A2.
Measured mean line widths [mm] for the second-layer prints shown in Figure A1. This dataset is visualized in Figure 4.
| E-Factor | Feed Rate 750 | Feed Rate 1200 | Feed Rate 1650 | Feed Rate 2100 | Feed Rate 2550 |
| 23 | 0.43 | 0.42 | 0.42 | 0.41 | 0.41 |
| 21 | 0.48 | 0.48 | 0.47 | 0.46 | 0.46 |
| 19 | 0.53 | 0.52 | 0.52 | 0.52 | 0.51 |
| 17 | 0.58 | 0.58 | 0.57 | 0.56 | 0.56 |
| 15 | 0.63 | 0.63 | 0.63 | 0.61 | 0.61 |
| 13 | 0.67 | 0.67 | 0.66 | 0.66 | 0.66 |
| 11 | 0.72 | 0.71 | 0.7 | 0.7 | 0.69 |
| 9 | 0.78 | 0.77 | 0.76 | 0.75 | 0.75 |
| 7 | 0.87 | 0.86 | 0.85 | 0.83 | 0.82 |
| 5 | 1.05 | 1.03 | 1 | 0.98 | 0.95 |
Appendix B. Optimization of Print Parameters for Efficient Deposition
This appendix provides the visual documentation and raw measurement data for the experiments detailed in Section 3.3. Table A3 through Table A6 tabulate the printing parameters—covering both mid-range and high-speed configurations—required to achieve the 20 target line widths for both the first and second layers. Figure A2 illustrates the experimental setup used to evaluate the interpolation accuracy discussed in Figure 4, employing three distinct printing strategies. The corresponding raw measurement data for these samples is presented in Table A7.
Table A3.
20 target width values with corresponding mean print parameters for first layer print.
| Target Width [mm] | Feed Rate [mm/min] | E-Value |
| 0.46 | 2550 | 23 |
| 0.50 | 2356.234344 | 21.06234344 |
| 0.54 | 2113.063723 | 18.63063723 |
| 0.58 | 1936.215614 | 16.86215614 |
| 0.63 | 1722.064777 | 14.72064777 |
| 0.67 | 1593.208573 | 13.43208573 |
| 0.71 | 1484.989462 | 12.34989462 |
| 0.75 | 1389.080025 | 11.39080025 |
| 0.80 | 1301.419351 | 10.51419351 |
| 0.84 | 1234.544328 | 9.845443281 |
| 0.88 | 1167.861279 | 9.178612791 |
| 0.92 | 1114.271456 | 8.642714564 |
| 0.96 | 1052.573718 | 8.025737181 |
| 1.01 | 989.6455264 | 7.396455264 |
| 1.05 | 933.8859448 | 6.838859448 |
| 1.09 | 890.3330122 | 6.403330122 |
| 1.13 | 854.9738378 | 6.049738378 |
| 1.18 | 819.9825585 | 5.699825585 |
| 1.22 | 784.9912793 | 5.349912793 |
| 1.26 | 750 | 5 |
Table A4.
20 target width values with corresponding mean print parameters for second layer print.
| Target Width [mm] | Feed Rate [mm/min] | E-Value |
| 0.43 | 2550 | 23 |
| 0.47 | 2411.60803 | 21.6160803 |
| 0.50 | 2302.13561 | 20.5213561 |
| 0.54 | 2195.64297 | 19.4564297 |
| 0.57 | 2031.60104 | 17.8160104 |
| 0.61 | 1748.61603 | 14.9861603 |
| 0.64 | 1637.57803 | 13.8757803 |
| 0.68 | 1468.39892 | 12.1839892 |
| 0.71 | 1276.61163 | 10.2661163 |
| 0.75 | 1192.67776 | 9.42677757 |
| 0.78 | 1122.37453 | 8.72374532 |
| 0.82 | 1061.6807 | 8.11680696 |
| 0.85 | 1006.57343 | 7.56573427 |
| 0.89 | 958.577805 | 7.08577805 |
| 0.92 | 918.696388 | 6.68696388 |
| 0.96 | 880.778425 | 6.30778425 |
| 0.99 | 845.215222 | 5.95215222 |
| 1.03 | 812.411674 | 5.62411674 |
| 1.06 | 780.898447 | 5.30898447 |
| 1.10 | 750 | 5 |
Table A5.
20 target width values with corresponding high-speed print parameters for first layer print.
Table A5.
20 target width values with corresponding high-speed print parameters for first layer print.
| Target Width [mm] | Feed Rate [mm/min] | E-Value |
| 0.4 | 2550 | 23 |
| 0.48 | 2550 | 19.58 |
| 0.51 | 2550 | 16.9 |
| 0.56 | 2550 | 14.76 |
| 0.63 | 2550 | 13.02 |
| 0.69 | 2550 | 11.58 |
| 0.75 | 2550 | 10.38 |
| 0.8 | 2550 | 9.37 |
| 0.88 | 2550 | 8.5 |
| 1 | 2550 | 7.75 |
| 1 | 2550 | 7.1 |
| 1.05 | 2550 | 6.53 |
| 1.07 | 2550 | 6.03 |
| 1.15 | 2550 | 5.2 |
| 1.24 | 2550 | 5 |
| 1.25 | 2189 | 5 |
| 1.35 | 1280 | 5 |
| 1.35 | 1280 | 5 |
| 1.35 | 1280 | 5 |
| 1.35 | 1280 | 5 |
Table A6.
20 target width values with corresponding high-speed print parameters for second layer print.
Table A6.
20 target width values with corresponding high-speed print parameters for second layer print.
| Target Width [mm] | Feed Rate [mm/min] | E-Value |
| 0.43 | 2550 | 23 |
| 0.47 | 2550 | 21.1474445 |
| 0.50 | 2550 | 19.9277919 |
| 0.54 | 2550 | 18.7940793 |
| 0.57 | 2550 | 17.323376 |
| 0.61 | 2550 | 14.6947783 |
| 0.64 | 2550 | 12.971174 |
| 0.68 | 2550 | 11.1225321 |
| 0.71 | 2550 | 9.71143981 |
| 0.75 | 2550 | 8.83177702 |
| 0.78 | 2550 | 8.16779439 |
| 0.82 | 2550 | 7.56315532 |
| 0.85 | 2550 | 6.95098115 |
| 0.89 | 2550 | 6.28352839 |
| 0.92 | 2550 | 5.55803304 |
| 0.96 | 2016.81514 | 5.00103305 |
| 0.99 | 1479.62138 | 5.00546823 |
| 1.03 | 1094.76615 | 5.00732932 |
| 1.06 | 902.33853 | 5.00154282 |
| 1.10 | 750 | 5 |
Figure A2.
Experimental setup designed to evaluate the fidelity of print parameters by comparing actual versus target line widths.
Figure A2.
Experimental setup designed to evaluate the fidelity of print parameters by comparing actual versus target line widths.
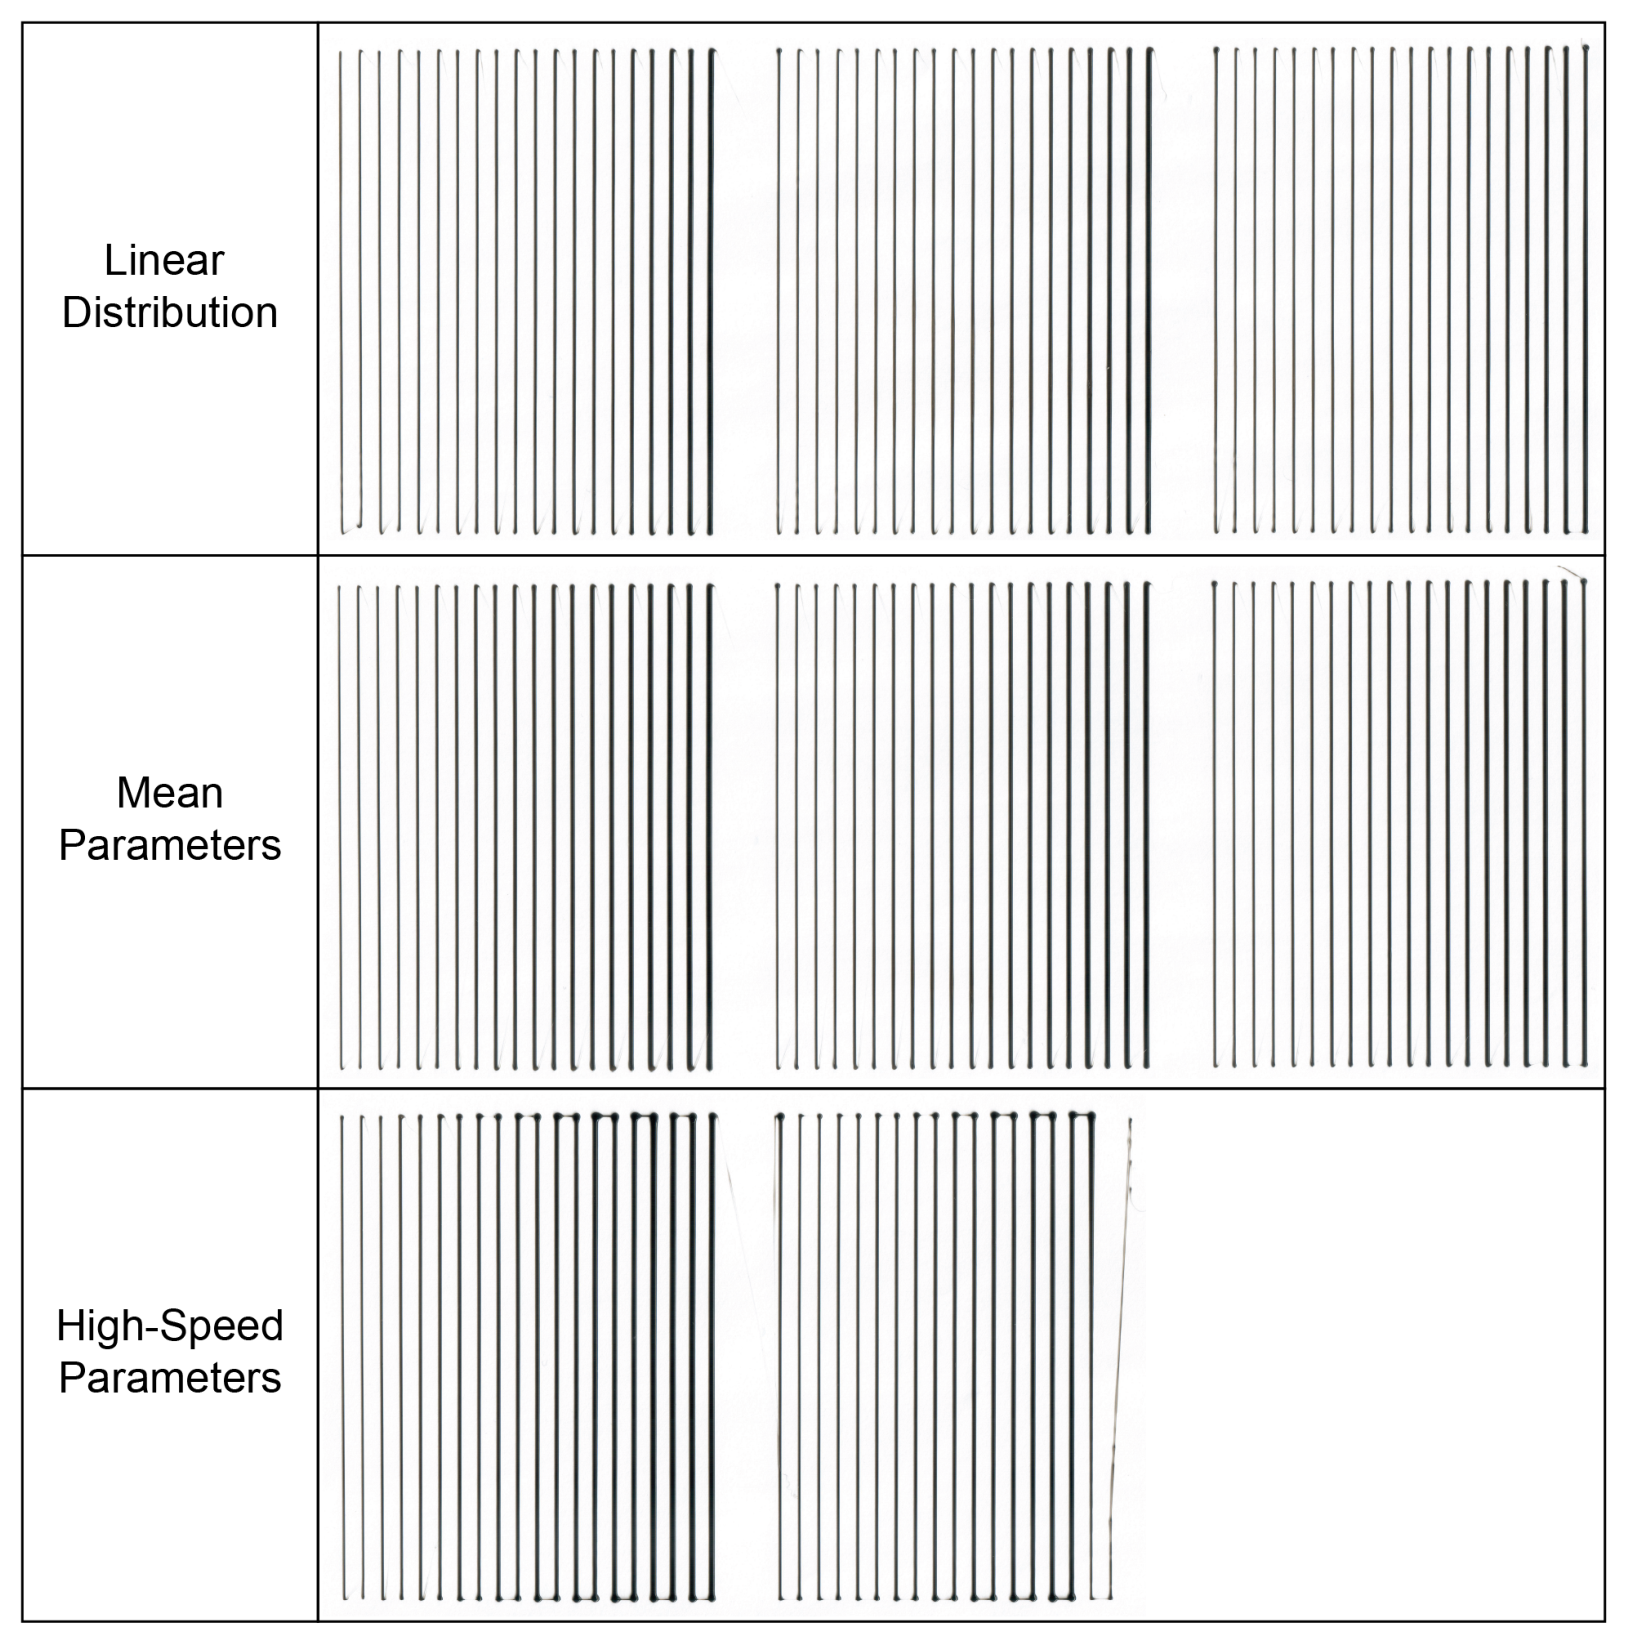
Table A7.
Data points from Figure 5.
Table A7.
Data points from Figure 5.
| High-Speed Parameters | Mean Parameters | Linear Distribution | Target Thickness |
| 0.4567 | 0.4504 | 0.41615 | 0.462 |
| 0.48405 | 0.49935 | 0.41625 | 0.504294737 |
| 0.50845 | 0.5386 | 0.4208 | 0.546589474 |
| 0.5692 | 0.572 | 0.42245 | 0.588884211 |
| 0.62235 | 0.6324 | 0.4249 | 0.631178947 |
| 0.6898 | 0.67045 | 0.42675 | 0.673473684 |
| 0.73015 | 0.71825 | 0.42765 | 0.715768421 |
| 0.746 | 0.7616 | 0.43025 | 0.758063158 |
| 0.828 | 0.8097 | 0.4312 | 0.800357895 |
| 0.8519 | 0.84485 | 0.4389 | 0.842652632 |
| 0.88205 | 0.885 | 0.4604 | 0.884947368 |
| 0.91765 | 0.94165 | 0.46865 | 0.927242105 |
| 0.939705 | 0.9664 | 0.49965 | 0.969536842 |
| 0.95815 | 1.02487 | 0.5253 | 1.011831579 |
| 0.98985 | 1.05369 | 0.5929 | 1.054126316 |
| 1.0565 | 1.11085 | 0.6316 | 1.096421053 |
| 1.1471 | 1.117 | 0.6688 | 1.138715789 |
| 1.19745 | 1.16415 | 0.87895 | 1.181010526 |
| 1.20635 | 1.20115 | 1.05115 | 1.223305263 |
| 1.2682 | 1.2593 | 1.2414 | 1.2656 |
References
- van Herpen, I. The Maison of Iris van Herpen | About. [PubMed]
- Peleg, D. Danit Peleg - 3D Printed Fashion Lab, 2025. [CrossRef] [PubMed]
- Rivera, M.L.; Moukperian, M.; Ashbrook, D.; Mankoff, J.; Hudson, S.E. Stretching the Bounds of 3d Printing with Embedded Textiles. In Proceedings of the Proceedings of the 2017 CHI Conference on Human Factors in Computing Systems, Denver Colorado USA, 2017; pp. 497–508. [Google Scholar] [CrossRef]
- Muthukumarana, S.; Messerschmidt, M.A.; Matthies, D.J.; Steimle, J.; Scholl, P.M.; Nanayakkara, S. ClothTiles: A Prototyping Platform to Fabricate Customized Actuators on Clothing using 3D Printing and Shape-Memory Alloys. In Proceedings of the Proceedings of the 2021 CHI Conference on Human Factors in Computing Systems, Yokohama Japan, 2021; pp. 1–12. [Google Scholar] [CrossRef]
- Forman, J.; Dogan, M.D.; Forsythe, H.; Ishii, H. DefeXtiles: 3D Printing Quasi-Woven Fabric via Under-Extrusion. In Proceedings of the Proceedings of the 33rd Annual ACM Symposium on User Interface Software and Technology, Virtual Event USA, 2020; pp. 1222–1233. [Google Scholar] [CrossRef]
- Nike. Nike Vaporfly Elite Flyprint: The Future of 3D, 2025.
- Polymaker. Polymaker and Covestro jointly release 3D printed fabric developing new areas of 3D printing applications. 2020. [Google Scholar]
- Kuipers, T.; Elkhuizen, W.; Verlinden, J.; Doubrovski, E. Hatching for 3D prints: Line-based halftoning for dual extrusion fused deposition modeling. Comput. Graph. 2018, 74, 23–32. [Google Scholar] [CrossRef]
- Reiner, T.; Carr, N.; Měch, R.; Št’ava, O.; Dachsbacher, C.; Miller, G. Dual-color mixing for fused deposition modeling printers. Comput. Graph. Forum 2014, 33, 479–486. [Google Scholar] [CrossRef]
- Autodesk. Halftone Image Creator | Fusion | Autodesk App Store. 2026. [Google Scholar] [PubMed]
- Manaia, J.P.; Cerejo, F.; Duarte, J. Revolutionising textile manufacturing: a comprehensive review on 3D and 4D printing technologies. Fash. Text. 2023, 10, 20. [Google Scholar] [CrossRef]
- Xiao, Y.Q.; Kan, C.W. Review on Development and Application of 3D-Printing Technology in Textile and Fashion Design. Coatings 2022, 12, 267. [Google Scholar] [CrossRef]
- Yingchun, Z.; Jing, S. Experimental research on 3D printing technology for fashion applications based on self-forming structures. J. Text. Eng. Fash. Technol. 2019, 5. [Google Scholar] [CrossRef]
- Takahashi, H.; Kim, J. 3D Printed Fabric: Techniques for Design and 3D Weaving Programmable Textiles. In Proceedings of the Proceedings of the 32nd Annual ACM Symposium on User Interface Software and Technology, New Orleans LA USA, 2019; pp. 43–51. [Google Scholar] [CrossRef]
- Li, Y.; Montes, J.; Thomaszewski, B.; Coros, S. Programmable Digital Weaves. IEEE Robot. Autom. Lett. 2022, 7, 2891–2896. [Google Scholar] [CrossRef]
- Melnikova, R.; Ehrmann, A.; Finsterbusch, K. 3D printing of textile-based structures by Fused Deposition Modelling (FDM) with different polymer materials. IOP Conf. Ser. Mater. Sci. Eng. 2014, 62, 012018. [Google Scholar] [CrossRef]
- Wong, Y.y.; Ho, C.p.; Kan, C.w. Performance of Fused Deposition Modeling 3D Printed Fabric with Different Structures. 3D Print. Addit. Manuf. 2025, 12, 365–372. [Google Scholar] [CrossRef] [PubMed]
- Yan, X.; Lu, L.; Sharf, A.; Yu, X.; Sun, Y. Man-made by Computer: On-the-Fly Fine Texture 3D Printing. In Proceedings of the Symposium on Computational Fabrication, Virtual Event USA, 2021; pp. 1–10. [Google Scholar] [CrossRef]
- Wang, G.; Ji, J.; Xu, Y.; Ren, L.; Wu, X.; Zheng, C.; Zhou, X.; Tang, X.; Feng, B.; Sun, L.; et al. X-Hair: 3D Printing Hair-like Structures with Multi-form, Multi-property and Multi-function. In Proceedings of the Proceedings of the 37th Annual ACM Symposium on User Interface Software and Technology, Pittsburgh PA USA, 2024; pp. 1–14. [Google Scholar] [CrossRef]
- Takahashi, H.; Miyashita, H. Expressive Fused Deposition Modeling by Controlling Extruder Height and Extrusion Amount. In Proceedings of the Proceedings of the 2017 CHI Conference on Human Factors in Computing Systems, Denver Colorado USA, 2017; pp. 5065–5074. [Google Scholar] [CrossRef]
- Takahashi, H.; Miyashita, H. Thickness Control Technique for Printing Tactile Sheets with Fused Deposition Modeling. In Proceedings of the Proceedings of the 29th Annual Symposium on User Interface Software and Technology, Tokyo Japan, 2016; pp. 51–53. [Google Scholar] [CrossRef]
- Subbaraman, B.; Peek, N. p5.fab: Direct Control of Digital Fabrication Machines from a Creative Coding Environment. In Proceedings of the Designing Interactive Systems Conference, Virtual Event Australia, 2022; pp. 1148–1161. [Google Scholar] [CrossRef]
- Kim, J.; Zheng, C.; Takahashi, H.; Gross, M.D.; Ashbrook, D.; Yeh, T. Compositional 3D printing: expanding & supporting workflows towards continuous fabrication. In Proceedings of the Proceedings of the 2nd ACM Symposium on Computational Fabrication, Cambridge Massachusetts, 2018; pp. 1–10. [Google Scholar] [CrossRef]
- Kaplan, D.; Ben Chen, M.; Sterman, Y. ConTextural: A Toolpath-Based Texture Editing Tool for Extrusion 3D Printers. In Proceedings of the Proceedings of the 2025 CHI Conference on Human Factors in Computing Systems, Yokohama Japan, 2025; pp. 1–16. [Google Scholar] [CrossRef]
- An, B.; Tao, Y.; Gu, J.; Cheng, T.; Chen, X.A.; Zhang, X.; Zhao, W.; Do, Y.; Takahashi, S.; Wu, H.Y.; et al. Thermorph: Democratizing 4D Printing of Self-Folding Materials and Interfaces. In Proceedings of the Proceedings of the 2018 CHI Conference on Human Factors in Computing Systems, Montreal QC Canada, 2018; pp. 1–12. [Google Scholar] [CrossRef]
- Syrlybayev, D.; Zharylkassyn, B.; Seisekulova, A.; Akhmetov, M.; Perveen, A.; Talamona, D. Optimisation of Strength Properties of FDM Printed Parts—A Critical Review. Polymers 2021, 13, 1587. [Google Scholar] [CrossRef] [PubMed]
- Halbrecht, A.; Kinsbursky, M.; Poranne, R.; Sterman, Y. 3D Printed Spacer Fabrics. Addit. Manuf. 2023, 65, 103436. [Google Scholar] [CrossRef]
- Littler, E.; Zhu, B.; Jarosz, W. Automated Filament Inking for Multi-color FFF 3D Printing. In Proceedings of the Proceedings of the 35th Annual ACM Symposium on User Interface Software and Technology, Bend OR USA, 2022; pp. 1–13. [Google Scholar] [CrossRef]
- Song, H.; Martínez, J.; Bedell, P.; Vennin, N.; Lefebvre, S. Colored Fused Filament Fabrication. ACM Trans. Graph. 2019, 38, 1–11. [Google Scholar] [CrossRef]
- Takahashi, H.; Punpongsanon, P.; Kim, J. Programmable Filament: Printed Filaments for Multi-material 3D Printing. In Proceedings of the Proceedings of the 33rd Annual ACM Symposium on User Interface Software and Technology, Virtual Event USA, 2020; pp. 1209–1221. [Google Scholar] [CrossRef]
- Yang, M.; Lv, X.g.; Liu, X.j.; Zhang, J.q. Research on color 3D printing based on color adherence. Rapid Prototyp. J. 2018, 24, 37–45. [Google Scholar] [CrossRef]
- Hergel, J.; Lefebvre, S. Clean color: Improving multi-filament 3D prints. Comput. Graph. Forum 2014, 33, 469–478. [Google Scholar] [CrossRef]
Figure 1.
Workflow overview for the fabrication of halftoned 3D printed textile nets.
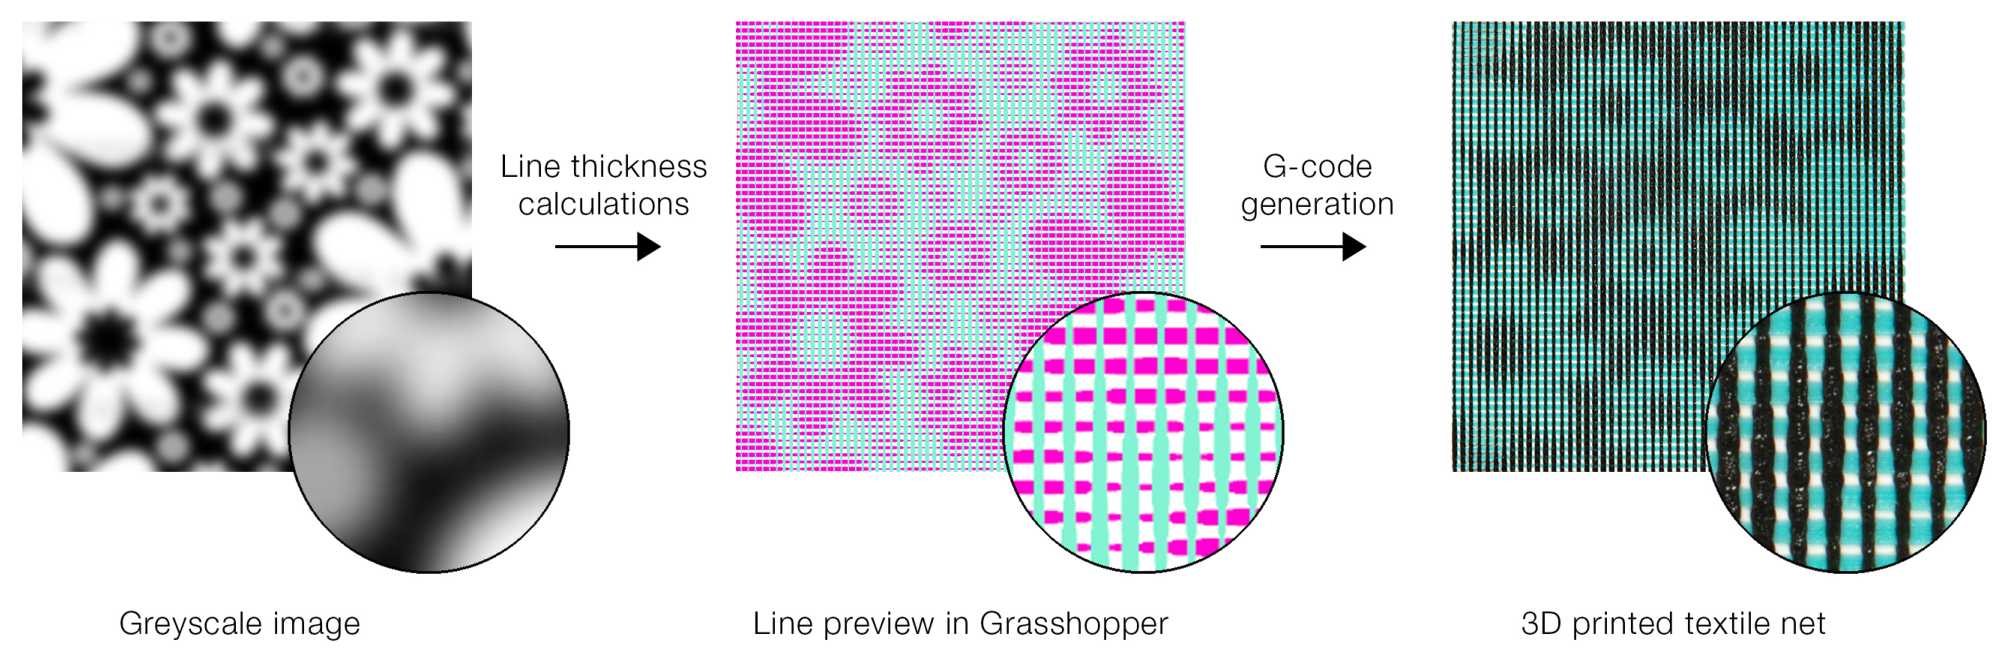
Figure 2.
Overlapping print lines affect the visual weight of the color in a given pixel cell.
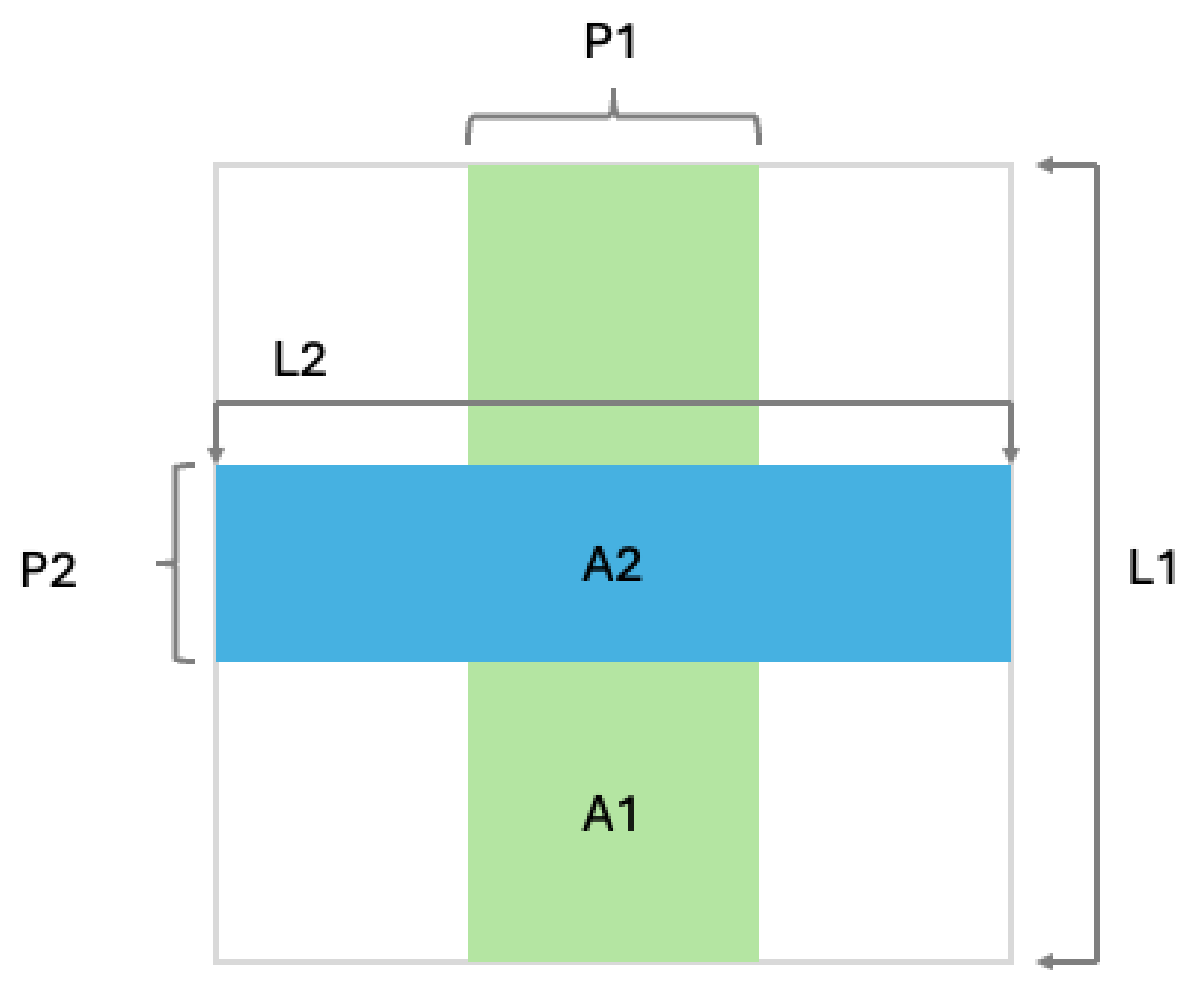
Figure 3.
Line preview in Grasshopper of the proportionally segmented printing lines, the leftmost being the full sample and the rightmost showing a close-up of a single pixel segment.
Figure 3.
Line preview in Grasshopper of the proportionally segmented printing lines, the leftmost being the full sample and the rightmost showing a close-up of a single pixel segment.
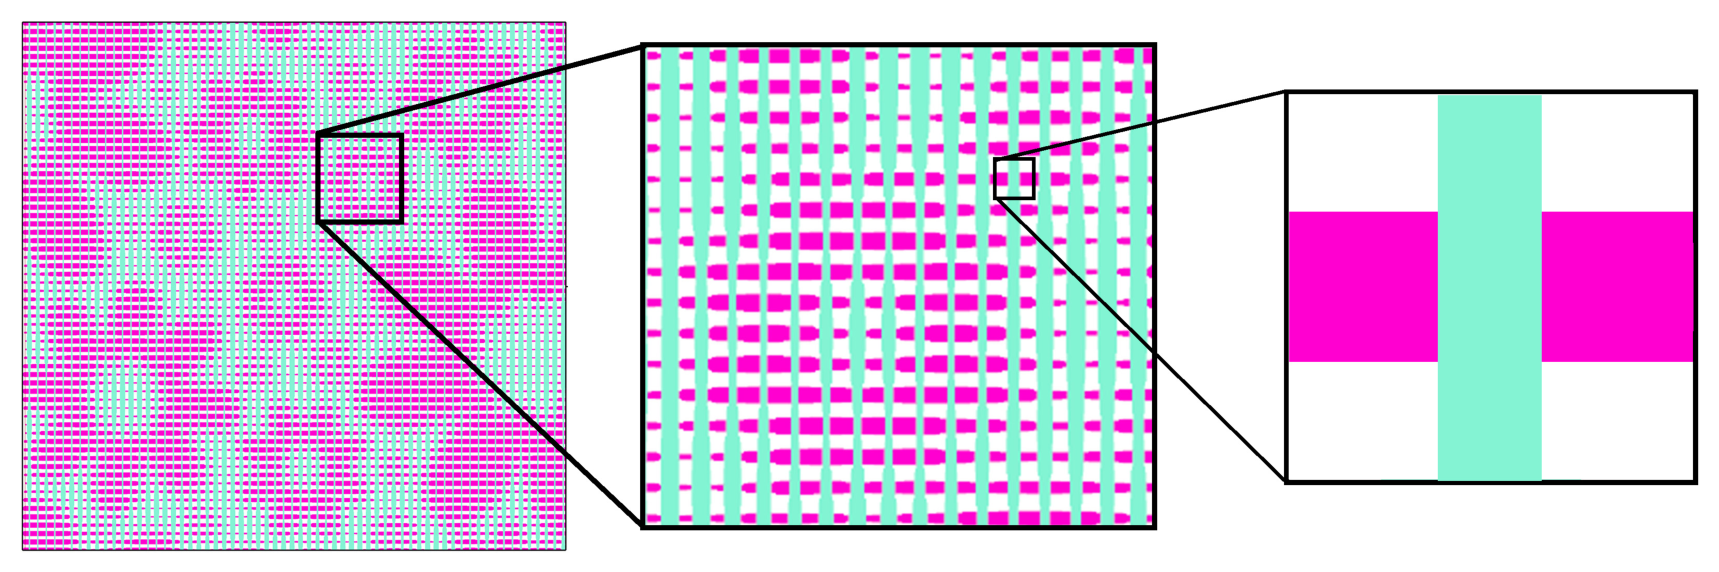
Figure 4.
Contour plots of data from the line thickness tests in the first layer and the second deposition.
Figure 4.
Contour plots of data from the line thickness tests in the first layer and the second deposition.
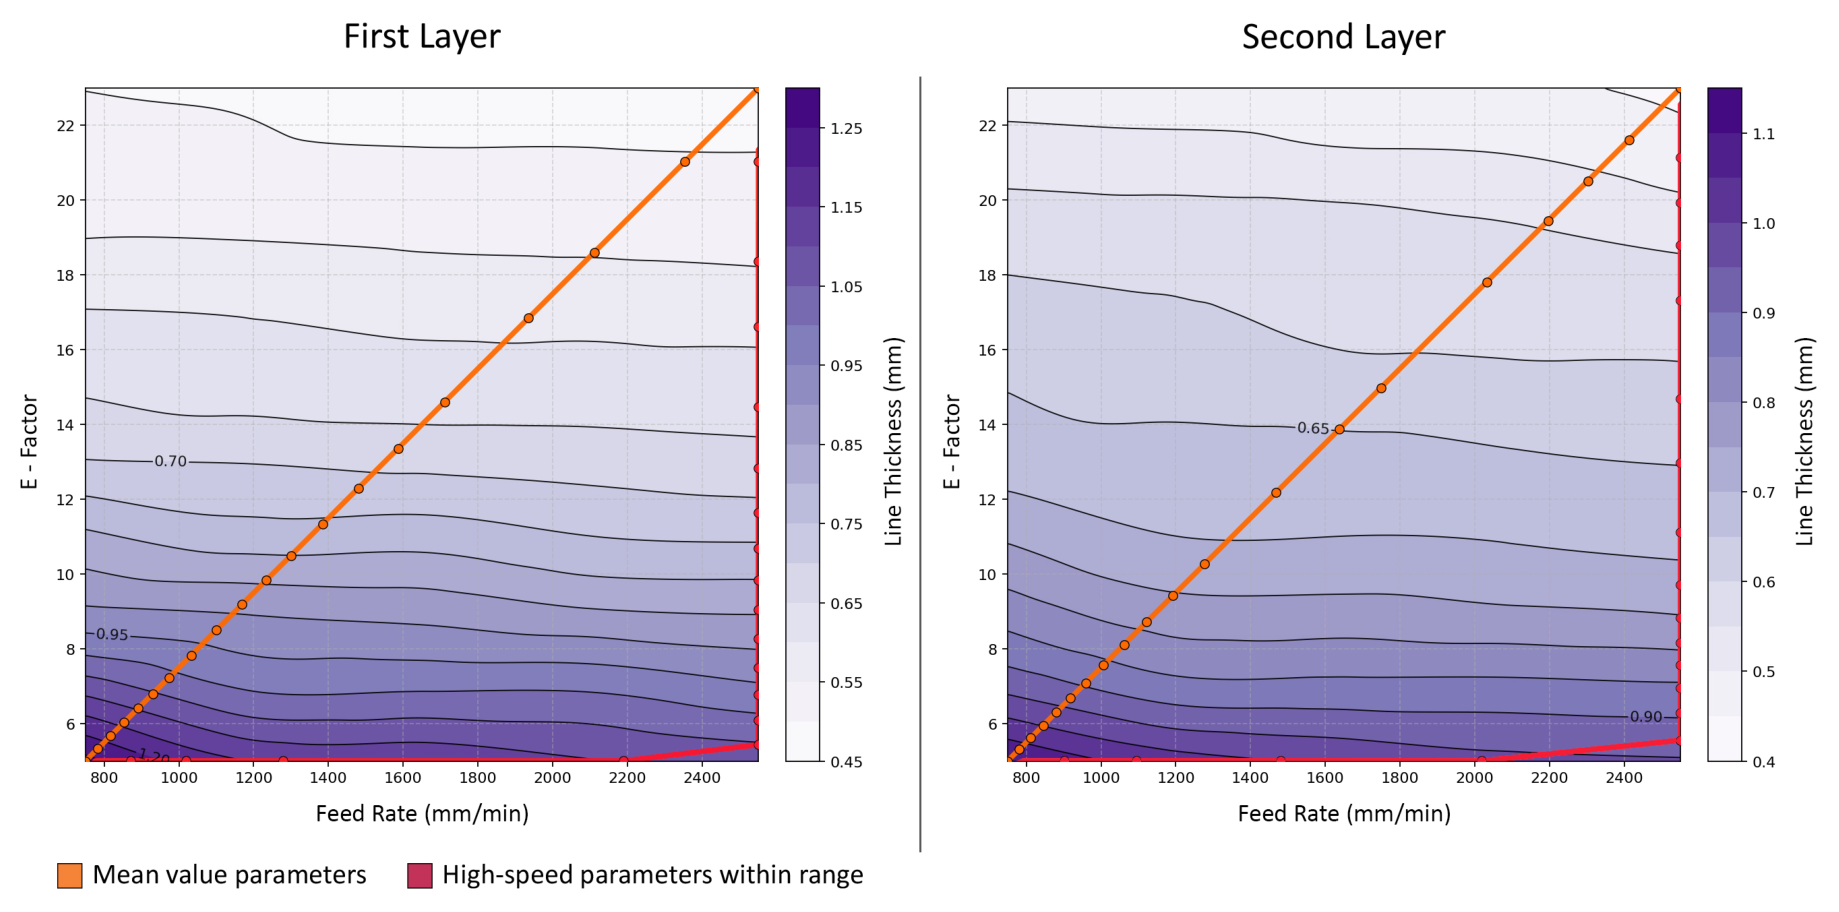
Figure 5.
Comparison between the target line thickness and the measured thickness obtained using three parameter-selection strategies. The graph presents the target thickness profile alongside the measured thickness resulting from linear parameter mapping (red), (2) mean parameter mapping (blue), and speed-prioritized mapping (green).
Figure 5.
Comparison between the target line thickness and the measured thickness obtained using three parameter-selection strategies. The graph presents the target thickness profile alongside the measured thickness resulting from linear parameter mapping (red), (2) mean parameter mapping (blue), and speed-prioritized mapping (green).
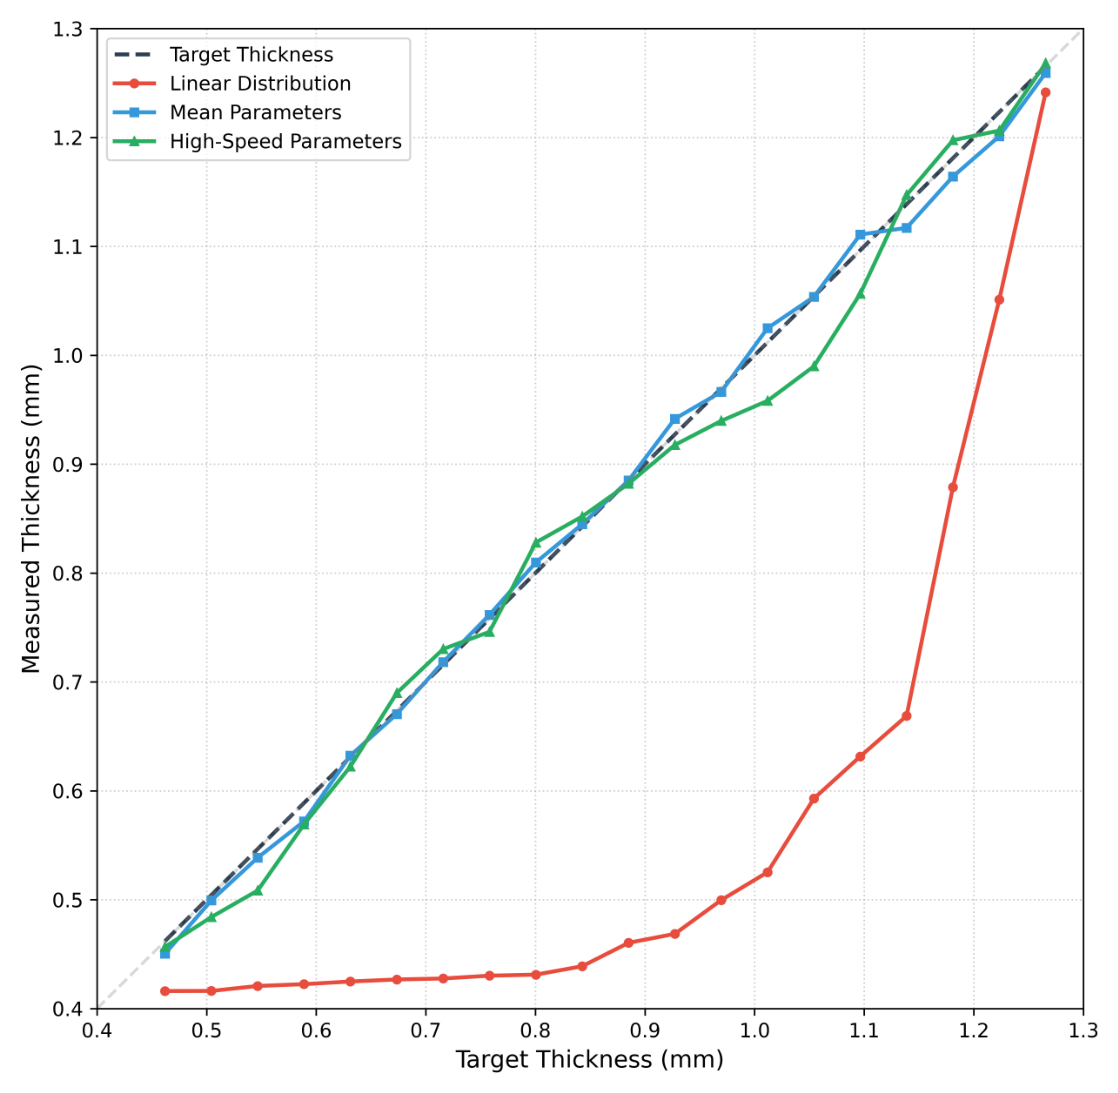
Figure 6.
(a) Greyscale source image, (b) Sample generated with the linear halftoning code, (c) Sample generated using the mean-range selection, (d) Sample generated with the speed optimized code.
Figure 6.
(a) Greyscale source image, (b) Sample generated with the linear halftoning code, (c) Sample generated using the mean-range selection, (d) Sample generated with the speed optimized code.
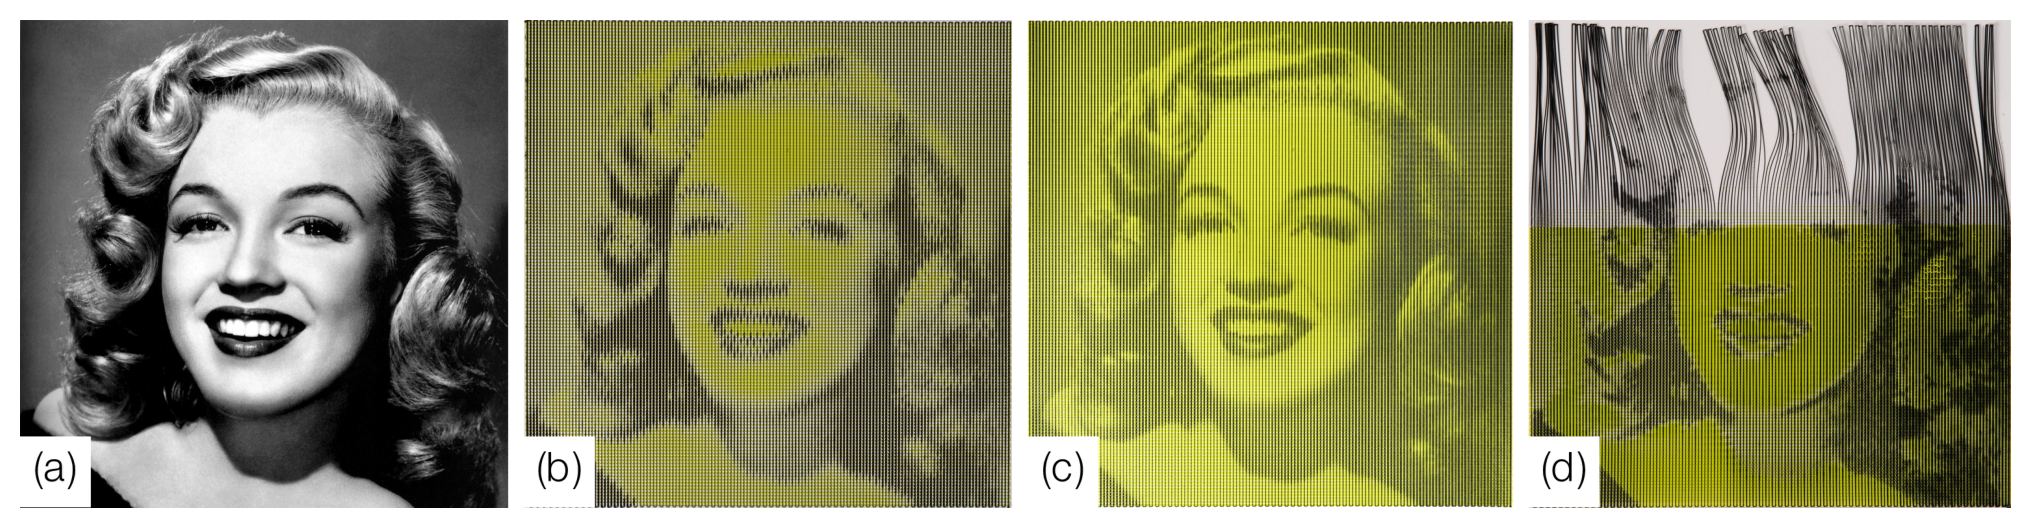
Figure 7.
Four different 250x250 mm printed textile structures with the same source image and colors: (a) Orthogonal grid, (b) Diagonal "x" grid, (c) A zig-zag chevron pattern grid (d) Curvilinear grid, (e) Diagonal grid sample being stretched.
Figure 7.
Four different 250x250 mm printed textile structures with the same source image and colors: (a) Orthogonal grid, (b) Diagonal "x" grid, (c) A zig-zag chevron pattern grid (d) Curvilinear grid, (e) Diagonal grid sample being stretched.
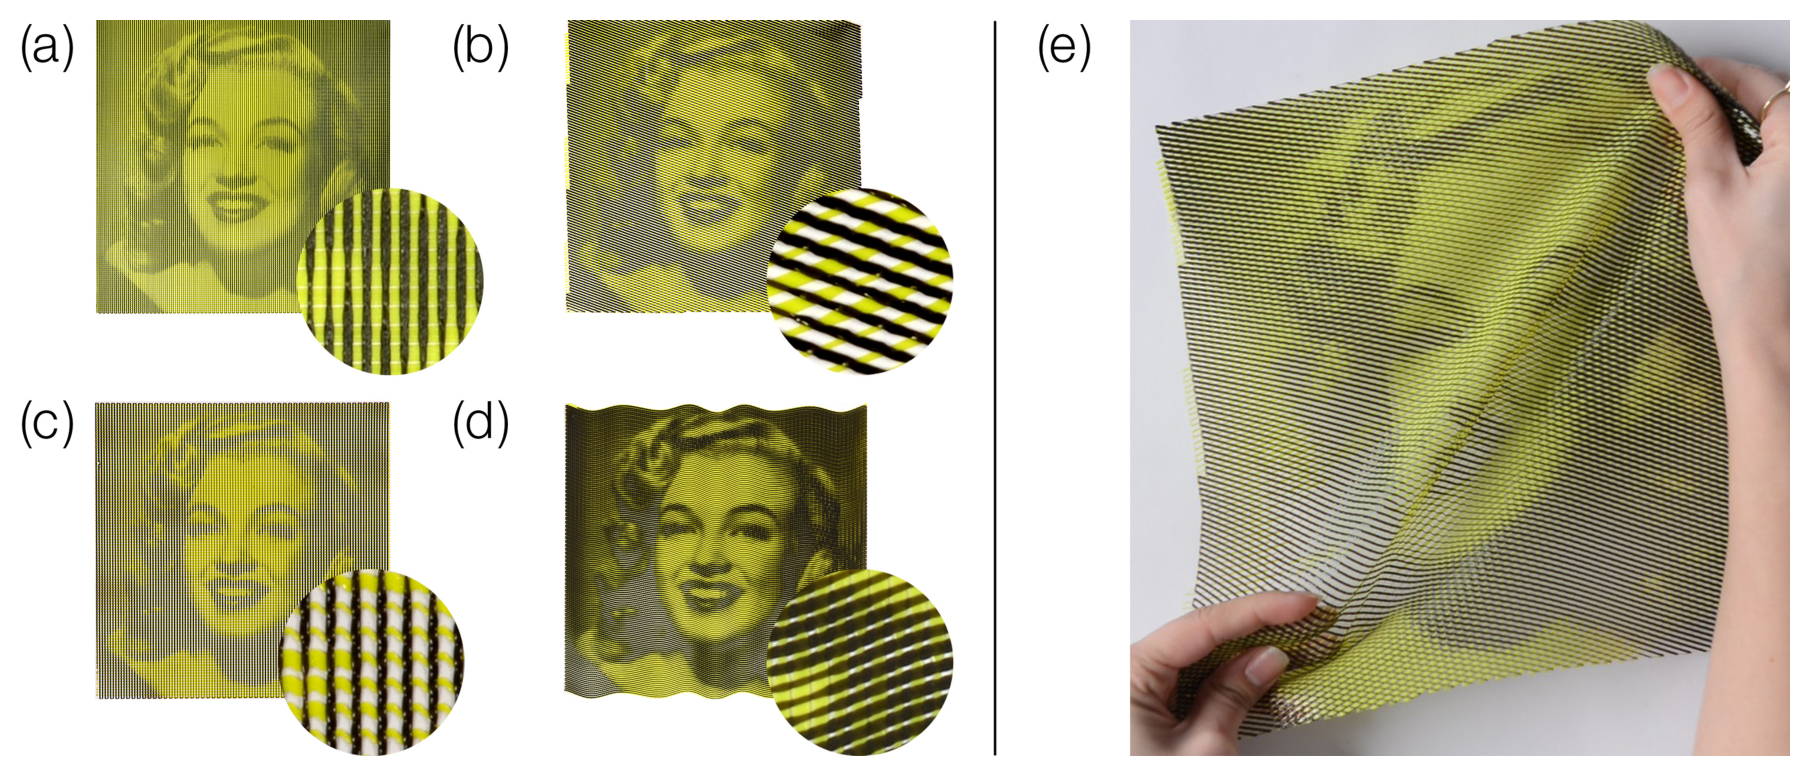
Figure 8.
100x100 mm printed samples with different patterns and colors using the final workflow.
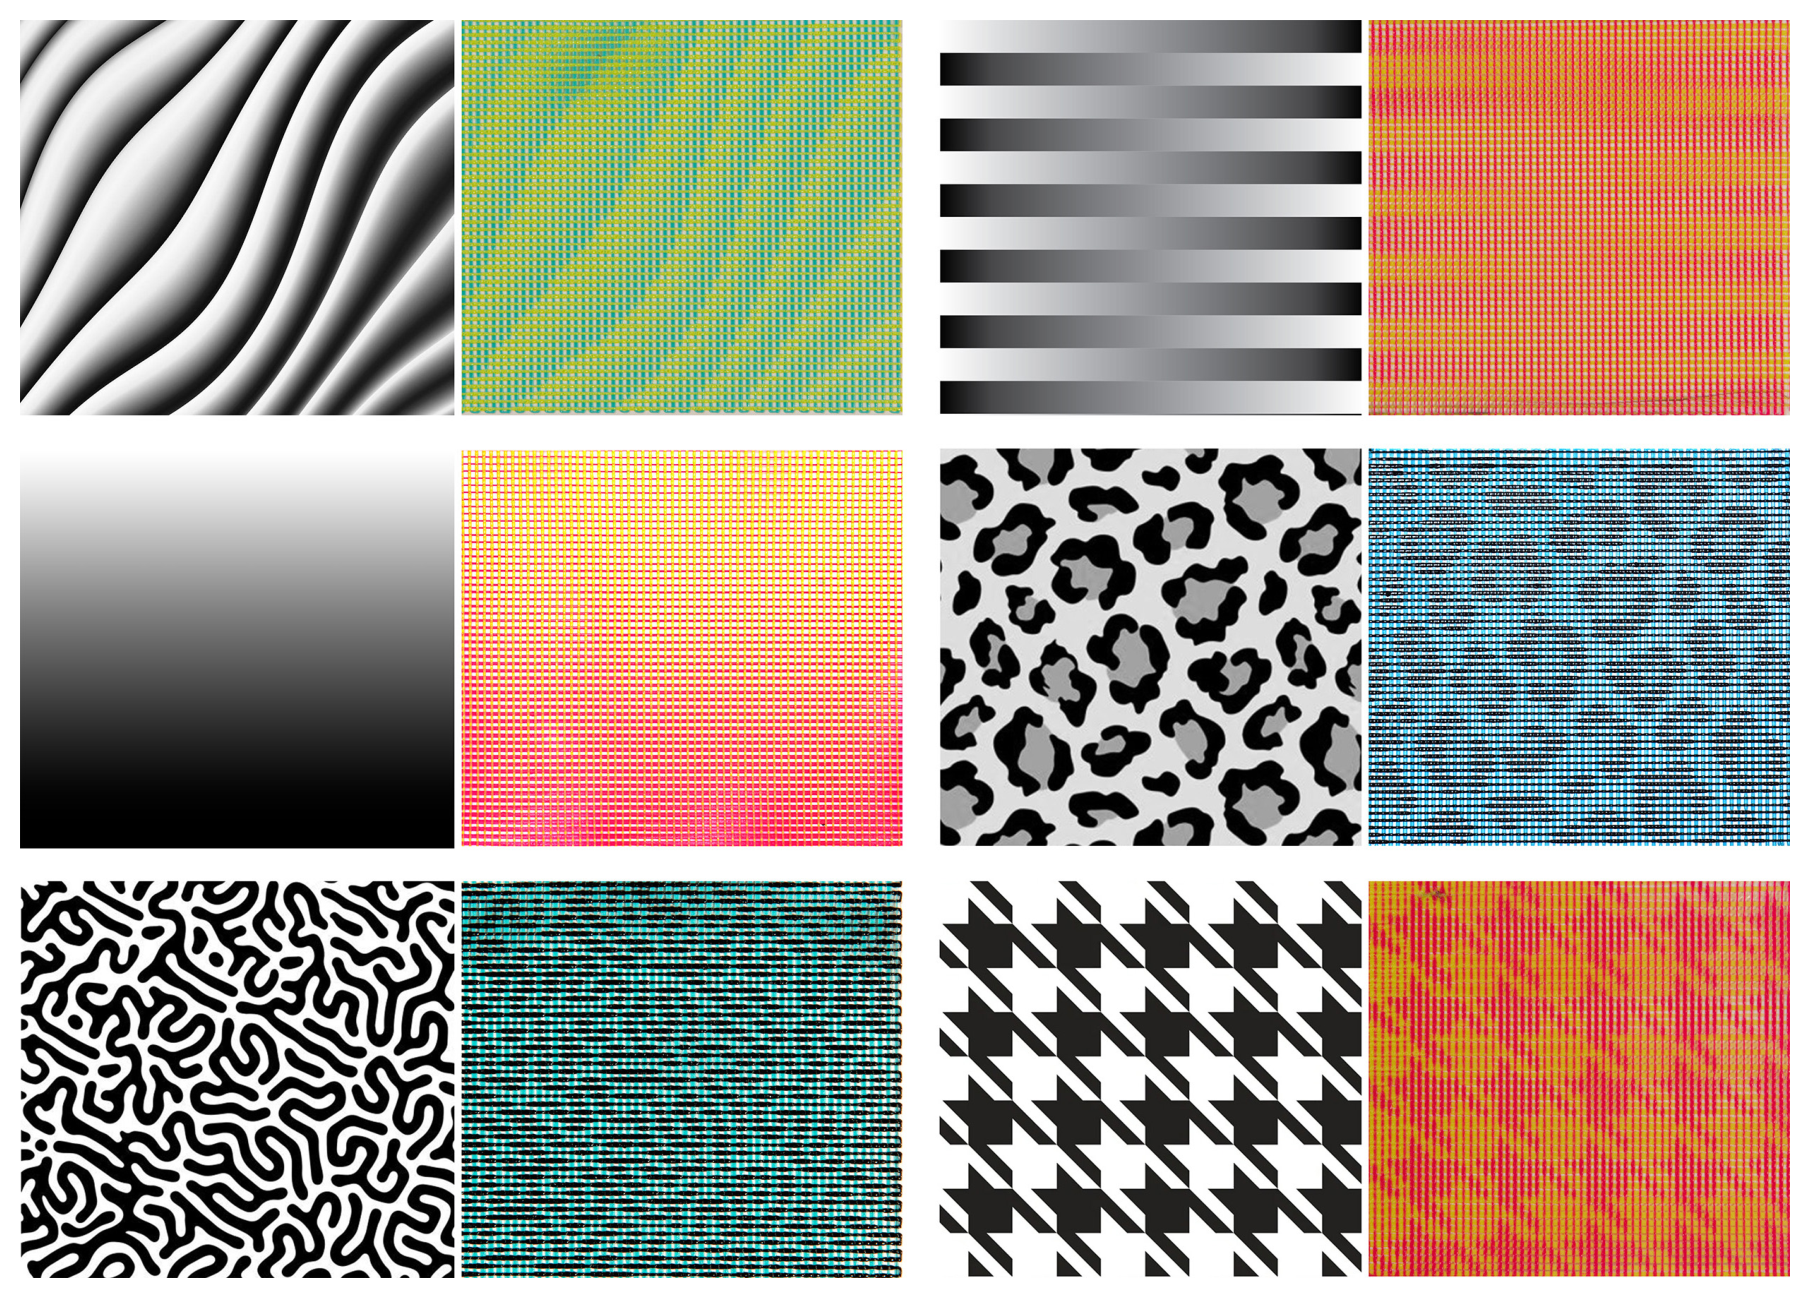
Figure 9.
(a) Printed corset with a patterned design fabricated using the final workflow, (b) Source graphics for the printed corset pattern pieces.
Figure 9.
(a) Printed corset with a patterned design fabricated using the final workflow, (b) Source graphics for the printed corset pattern pieces.
Disclaimer/Publisher’s Note: The statements, opinions and data contained in all publications are solely those of the individual author(s) and contributor(s) and not of MDPI and/or the editor(s). MDPI and/or the editor(s) disclaim responsibility for any injury to people or property resulting from any ideas, methods, instructions or products referred to in the content. |
© 2026 by the authors. Licensee MDPI, Basel, Switzerland. This article is an open access article distributed under the terms and conditions of the Creative Commons Attribution (CC BY) license (http://creativecommons.org/licenses/by/4.0/).
Copyright: This open access article is published under a Creative Commons CC BY 4.0 license, which permit the free download, distribution, and reuse, provided that the author and preprint are cited in any reuse.


