Submitted:
20 June 2026
Posted:
25 June 2026
You are already at the latest version
Abstract
This technical note presents a low-cost Internet of Things (IoT)-based prototype that combines real-time electrical monitoring, local visualization, cloud connectivity, and threshold-based demand response for electric power distribution education. The system integrates an ESP32 DevKit V1, a PZEM-004T V3.0 meter with a 100 A current-transformer clamp, a 16×2 I2C liquid-crystal display, a Waveshare 1.3-inch OLED display, a relay module, and a 12 V RGB fan representing a controllable non-critical load. Voltage, current, active power, and accumulated energy are read at the AC input and exchanged with a Blynk IoT dashboard through virtual datastreams. WiFiManager enables network provisioning without embedding the local Wi-Fi credentials in the firmware. In automatic mode, active power is compared with a remotely adjustable limit; an exceedance disconnects the fan, activates a short audible alarm, and reports a demand-response event. A recovery threshold equal to 70% of the selected limit provides hysteresis. During a 15 min laboratory stability observation, the prototype continuously reported valid measurements without abnormal heating, odor, acoustic noise, or communication interruption. A representative 14-reading serial-monitor snapshot yielded 213.6-214.4 V, 0.05 A, and 4.3-4.4 W, with mean values of 214.04 V and 4.37 W. The results support the prototype as an educational demonstrator rather than a utility-grade meter; calibration against a reference instrument and longer data logging remain necessary for metrological claims.
Keywords:
smart grid
; Internet of Things
; ESP32
; PZEM-004T
; demand response
; energy monitoring
; load control
; Blynk
1. Introduction
Electric power distribution is evolving from passive, one-way delivery toward observable and controllable infrastructures supported by sensing, communication, and automated decision-making. Smart-grid concepts connect electrical measurements to information systems so that operators and users can identify changing demand and respond to operating constraints [1,2,3]. At the customer and laboratory level, this transition can be demonstrated with low-cost embedded controllers, compact energy meters, and Internet-connected interfaces.
Demand response describes deliberate changes in electricity consumption in response to grid conditions, prices, or control requests. Depending on the program, loads may be shifted, curtailed, or temporarily disconnected. Research has shown that IoT-enabled buildings and residential loads can contribute flexibility and reduce peak demand when measurement and control are coordinated [4,5,6,7]. Nevertheless, full-scale demand-response platforms can be difficult to reproduce in an undergraduate laboratory because of cost, safety, and infrastructure requirements.
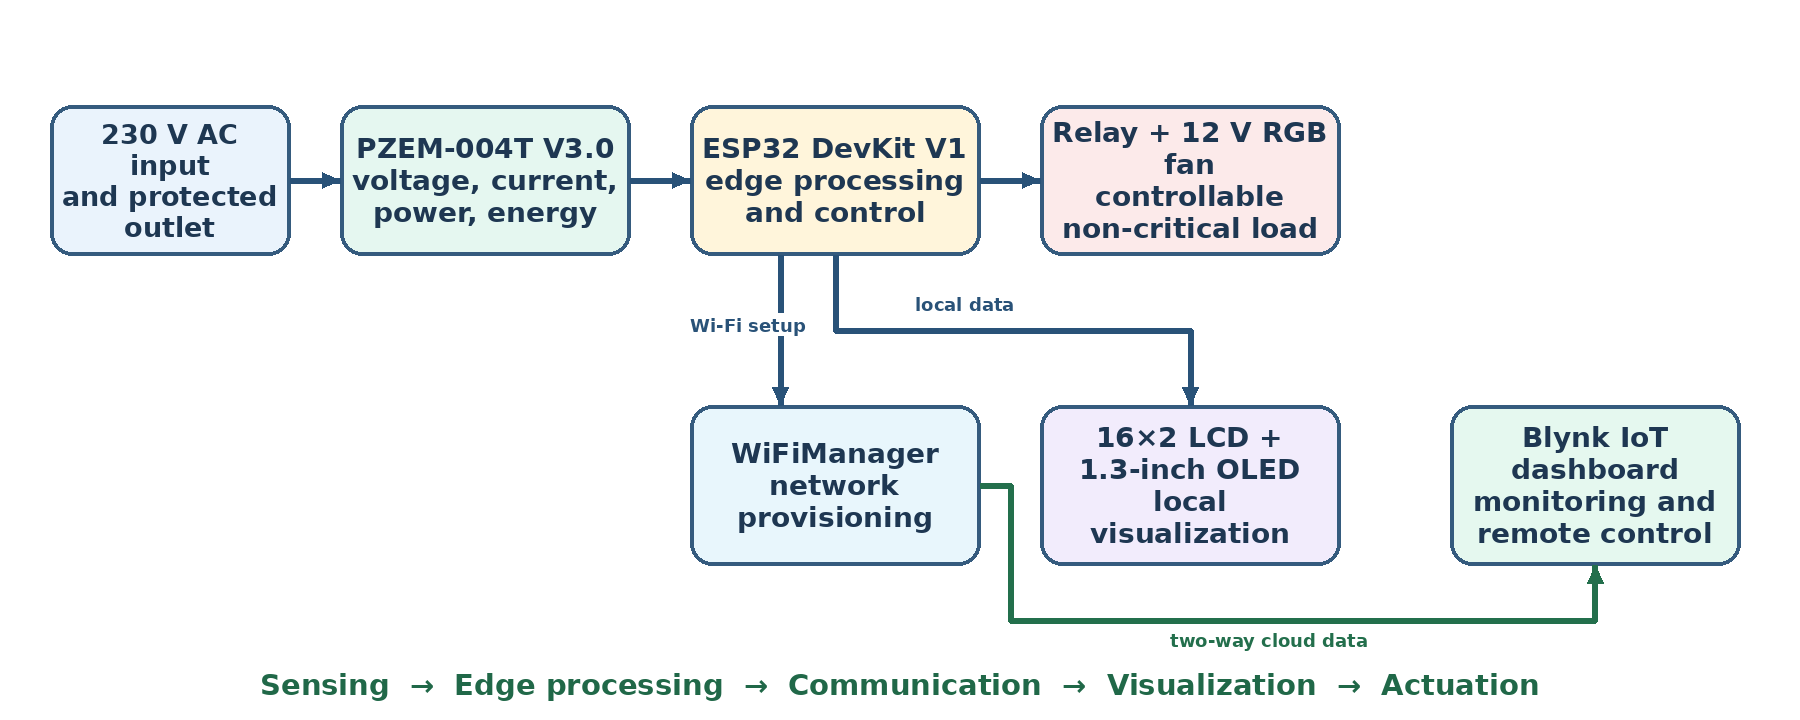
Figure 1.
Graphical abstract and functional architecture of the proposed monitoring and demand-response prototype.
Figure 1.
Graphical abstract and functional architecture of the proposed monitoring and demand-response prototype.

The objective of this work is therefore educational and architectural: to implement a compact prototype that observes the grid-facing demand of a small load, publishes the measurements to local and cloud interfaces, and performs a physical load-shedding action when a configurable active-power threshold is exceeded. The controlled 12 V fan does not represent a utility-scale load; it represents a non-critical appliance such as ventilation, auxiliary cooling, or another deferrable end-use device. The contribution is the integration of measurement, edge control, Wi-Fi provisioning, two local displays, a cloud dashboard, a physical AUTO/MANUAL override, and relay actuation in a single reproducible platform.
The manuscript reports the implemented architecture and a preliminary laboratory validation based on an actual serial-monitor measurement snapshot and a 15 min stability observation. The term preliminary is used deliberately because the experiment did not include calibration against a certified reference meter or a long-duration synchronized data logger.
2. Materials and Methods
2.1. System Architecture
The prototype is organized into five layers: (i) a protected AC input and measurement layer, (ii) a low-voltage supply layer, (iii) an edge-processing layer, (iv) local and cloud user-interface layers, and (v) a controllable load layer. The PZEM-004T measures the AC input supplying the 12 V adapter; consequently, the reported active power includes the adapter losses and the downstream fan load. This grid-facing measurement is appropriate for a demand-monitoring demonstrator because it captures the power drawn from the outlet rather than only the DC fan power.
The 100 A PZEM model uses an external current-transformer clamp. The clamp surrounds only the line conductor so that load current is measured without routing both line and neutral through the same magnetic core. The mains-side assembly uses insulated conductors, WAGO 221 connectors, a fuse and holder, grounded wiring, and physical separation from the low-voltage electronics. Mains construction and verification must be undertaken only by a competent person and with the system disconnected from the supply.
2.2. Hardware Implementation

Table 1.
Principal hardware components and their implemented functions.
| Component | Function in the prototype |
| ESP32 DevKit V1 | Main controller; UART acquisition; local display control; Wi-Fi and Blynk communication; relay logic. |
| PZEM-004T V3.0, 100 A CT model | AC voltage, current, active-power, and energy measurement. |
| 16×2 I2C LCD | Concise local indication of mode, fan state, power, and demand-response status. |
| Waveshare 1.3-inch OLED | Multi-page local panel for electrical data, connectivity, system status, and warning screens. |
| Two-channel 5 V relay module | Active-LOW switching of the 12 V RGB fan representing a non-critical load. |
| 12 V RGB PC fan and 12 V/1 A adapter | Demonstration load and its DC supply. |
| LM2596 buck converter | Regulated low-voltage supply for the controller and peripherals. |
| Active buzzer, green LED, AUTO/MANUAL switch | Audible warning, normal-state indication, and physical manual override. |
| Fuse, holder, WAGO 221 connectors, grounded outlet and enclosure | Electrical protection, serviceable connections, strain relief, and segregation of mains wiring. |
Figure 2.
Representative project photographs: (a) PZEM-004T V3.0 energy meter, (b) Waveshare 1.3-inch OLED, and (c) 12 V RGB fan used as the controllable non-critical load.
Figure 2.
Representative project photographs: (a) PZEM-004T V3.0 energy meter, (b) Waveshare 1.3-inch OLED, and (c) 12 V RGB fan used as the controllable non-critical load.

2.3. Embedded Software and Local Interfaces
The firmware was developed for the ESP32 using the Arduino framework in PlatformIO. The controller reads the PZEM through hardware UART, updates the LCD and OLED using timer-based tasks, and controls the relay as an active-LOW output. The LCD provides a deliberately simple two-line interface, while the OLED rotates among a main electrical page, an energy and limit page, a Wi-Fi page, and a system-status page. A dedicated warning page replaces the normal pages whenever demand response is active.
WiFiManager provides a captive configuration portal named SmartGrid-Setup. On first use, the operator connects to this temporary access point, selects the local network, and enters its password. The credentials are then stored by the ESP32, eliminating the need to hard-code the local Wi-Fi name and password in the firmware. The Blynk device authentication token remains device-specific and must be treated as a secret.
2.4. Blynk IoT Dashboard
Blynk datastreams are used as bidirectional software channels between the embedded device and the web/mobile dashboard [10,11]. The device publishes measurement and state values, while dashboard widgets transmit manual commands and the selected power limit. The configured mapping is summarized in Table 2 and Figure 3.
2.5. Demand-Response and Hysteresis Logic
The controller supports AUTO and MANUAL modes. Physical MANUAL mode or remote MANUAL mode disables automatic shedding and applies the dashboard fan command. In AUTO mode, valid PZEM data are compared with the adjustable Power Limit. If active power exceeds the limit, the relay disconnects the fan, the buzzer produces a short pulse, and both local and cloud interfaces report an active demand-response event. A recovery threshold is calculated as 0.70 × Power Limit. When power falls below this lower value, the fan can be reconnected and the event is cleared. The separation between trip and recovery thresholds reduces repeated switching near a single boundary.
The default firmware limit is 10 W. For functional trip verification, the dashboard limit can be temporarily set below the observed operating power. This makes the test reproducible without adding an unsafe or unnecessarily large load. The test setting is not presented as a grid protection threshold; it is solely a laboratory demonstration parameter.
Figure 4.
Embedded monitoring, manual override, trip, and hysteresis-based recovery logic.

2.6. Experimental Procedure and Data Integrity
The completed prototype was powered from the modified grounded outlet, with the ESP32 connected to a computer for serial observation. The PZEM values were monitored at 115200 baud. The system was operated for approximately 15 min while checking for communication loss, abnormal heating, odor, arcing, unusual acoustic noise, or unstable measurements. None of these conditions was reported during the observation.
A representative serial-monitor photograph captured 14 consecutive displayed readings. The values were manually transcribed into Supplementary Data S1. Because the screenshot does not contain timestamps and does not represent the complete 15 min run, the resulting statistics are explicitly treated as a short stability snapshot rather than a full time-series experiment. No values were synthesized to create additional operating profiles. Functional verification of the LCD, OLED, Blynk datastreams, AUTO/MANUAL selection, buzzer, relay, and remote controls was performed qualitatively.
3. Results
3.1. Electrical Measurement Snapshot
All 14 visible records contained valid numerical values; no NaN or communication-error output was present. Voltage ranged from 213.6 to 214.4 V and active power ranged from 4.3 to 4.4 W. The displayed current remained 0.05 A at the available two-decimal resolution, and the energy field remained 0.00 kWh because of the short displayed interval and low load. Table 3 summarizes the transcribed values.
Figure 5.
Actual serial-monitor evidence and plots derived only from the 14 visible readings in the captured snapshot.
Figure 5.
Actual serial-monitor evidence and plots derived only from the 14 visible readings in the captured snapshot.

3.2. Local and Cloud Interface Operation
The LCD and OLED were operated simultaneously but served different functions. The LCD presented immediate operating information such as AUTO/MANUAL mode, fan state, power, and demand-response warnings. The OLED provided a denser rotating interface with electrical measurements, the selected limit, Wi-Fi signal information, Blynk connectivity, PZEM status, and a dedicated warning page. This separation avoided duplicating the same interface on both displays.
The Blynk dashboard successfully supported all configured datastreams: voltage, current, power, energy, fan status, mode status, demand-response status, remote manual mode, manual fan command, power limit, and PZEM status. The cloud interface therefore provided both telemetry and command paths rather than read-only monitoring.
A representative summary of the implemented local LCD page, multi-page OLED interface, and cloud dashboard arrangement is illustrated in Figure 6. The figure is intended as a visual overview of the available operator information and remote control points.
3.3. Demand-Response Functional Verification
With the system in AUTO mode, a dashboard limit lower than the observed operating power triggered the control routine. The relay disconnected the fan, the buzzer generated a short audible indication, and the local and Blynk interfaces reported the event. Returning to MANUAL mode allowed the user to override automatic shedding and command the fan through the dashboard. The result verifies the complete sensing-to-actuation path at prototype scale. Because the current dataset does not include a synchronized relay-state time series, switching latency and repeatability are not reported numerically.
4. Discussion
The prototype demonstrates the essential smart-grid sequence of sensing, edge processing, two-way communication, user feedback, and actuation. Its principal educational value is that every stage is observable: electrical quantities appear on local displays and in the cloud, the power limit can be changed remotely, and the physical load responds to the embedded decision. This is consistent with the role of IoT-enabled loads in demand-side flexibility described in the literature [4,5,6,7].
The measured voltage range was stable within the displayed snapshot, while active power varied by only 0.1 W. These observations support basic functional stability but should not be interpreted as an accuracy certification. The PZEM module, wiring, adapter, and serial display resolution all contribute uncertainty. A future metrological evaluation should compare simultaneous PZEM and reference-meter measurements over several load types and power factors.
The hysteresis design improves the control logic compared with a single threshold, but the 70% recovery ratio is a design choice rather than an optimized value. In a practical demand-response application, trip and recovery values should account for load priorities, minimum off-times, user comfort, dynamic tariffs, and feeder constraints. Likewise, cybersecurity, credential management, loss-of-communication behavior, and fail-safe relay states require more rigorous treatment before any real deployment.
The available evidence has additional limitations. The quantitative dataset is a 14-reading screenshot rather than a timestamped logger export; only one low-power adapter-fan arrangement was assessed; and no full enclosure photograph or certified calibration record was available during manuscript preparation. These limitations are disclosed to prevent the technical note from overstating its experimental scope.
5. Conclusions
A complete low-cost IoT smart-grid monitoring and demand-response demonstrator was implemented with an ESP32, PZEM-004T, LCD, OLED, Blynk dashboard, WiFiManager provisioning, a relay, and a 12 V fan load. The device provided real-time local and remote visibility of electrical quantities and system state, supported physical and remote manual override, and performed threshold-based load shedding with a hysteresis recovery boundary. A 15 min stability observation produced continuous valid output without reported abnormal behavior, and the visible serial snapshot showed 213.6-214.4 V and 4.3-4.4 W. The prototype is suitable for teaching energy digitalization and introductory demand response. Longer timestamped data collection, reference-meter calibration, controlled multi-load experiments, and a formal cybersecurity assessment are required before stronger performance claims or field use.
Supplementary Materials
The following supporting information can be downloaded at the website of this paper posted on Preprints.org.
Author Contributions
Conceptualization, İ.O.Ö., I.Y.Y., B.N.Ü., E.A. and M.B.; methodology, İ.O.Ö., I.Y.Y., B.N.Ü. and E.A.; software, İ.O.Ö.; validation, İ.O.Ö., I.Y.Y., B.N.Ü. and E.A.; investigation, İ.O.Ö., I.Y.Y., B.N.Ü. and E.A.; resources, İ.O.Ö., I.Y.Y., B.N.Ü. and E.A.; data curation, İ.O.Ö.; writing - original draft preparation, İ.O.Ö., I.Y.Y., B.N.Ü. and E.A.; writing - review and editing, M.B.; visualization, İ.O.Ö., I.Y.Y., B.N.Ü. and E.A.; supervision, M.B. All authors have read and agreed to the submitted version of the manuscript.
Funding
This research received no external funding.
Institutional Review Board Statement
Not applicable. The study did not involve humans or animals.
Informed Consent Statement
Not applicable.
Data Availability Statement
Supplementary Data S1 contains the 14 values transcribed from the representative serial-monitor screenshot used for the descriptive statistics in this technical note. The source screenshot is retained by the authors. Additional firmware, configuration information, and project records can be made available by the corresponding author upon reasonable request, subject to course and institutional restrictions.
Acknowledgments
The authors acknowledge the laboratory and course environment in which the prototype was developed and tested.
Conflicts of Interest
The authors declare no conflict of interest.
Declaration on AI-Assisted Tools: AI-assisted tools were used solely for language refinement, manuscript organization, and formatting support. The authors reviewed and approved all technical descriptions, measurements, analyses, interpretations, and the final manuscript. AI tools were not used to generate experimental measurements.
Abbreviations
| AC | Alternating current |
| CT | Current transformer |
| DC | Direct current |
| DR | Demand response |
| ESP32 | Espressif 32-bit microcontroller platform |
| IoT | Internet of Things |
| LCD | Liquid-crystal display |
| OLED | Organic light-emitting diode |
| PZEM | Peacefair AC energy-meter family |
| UART | Universal asynchronous receiver-transmitter |
References
- Atzori, L.; Iera, A.; Morabito, G. The Internet of Things: A Survey. Comput. Netw. 2010, 54, 2787–2805. [Google Scholar] [CrossRef]
- Fang, X.; Misra, S.; Xue, G.; Yang, D. Smart Grid - The New and Improved Power Grid: A Survey. IEEE Commun. Surv. Tutor. 2012, 14, 944–980. [Google Scholar] [CrossRef]
- Gungor, V.C.; Sahin, D.; Kocak, T.; Ergut, S.; Buccella, C.; Cecati, C.; Hancke, G.P. Smart Grid Technologies: Communication Technologies and Standards. IEEE Trans. Ind. Inform. 2011, 7, 529–539. [Google Scholar] [CrossRef]
- Arias, L.A.; Rivas, E.; Santamaria, F.; Hernandez, V. A Review and Analysis of Trends Related to Demand Response. Energies 2018, 11, 1617. [Google Scholar] [CrossRef]
- Vahid-Ghavidel, M.; Javadi, M.S.; Gough, M.; Santos, S.F.; Shafie-Khah, M.; Catalão, J.P.S. Demand Response Programs in Multi-Energy Systems: A Review. Energies 2020, 13, 4332. [Google Scholar] [CrossRef]
- Alharbi, W. Integrating Internet-of-Things-Based Houses into Demand Response Programs in Smart Grid. Energies 2023, 16, 3699. [Google Scholar] [CrossRef]
- Basit, A.; Liu, S. IoT-Based Automation of Dynamic Demand Response. Hardware 2026, 4, 3. [Google Scholar] [CrossRef]
- Espressif Systems. ESP32-WROOM-32 Datasheet; Espressif Systems: Shanghai, China. Available online: https://www.espressif.com/ (accessed on 20 June 2026).
- Peacefair. PZEM-004T V3.0 AC Communication Module: User Manual and Technical Notes. Manuf. Doc.
- Blynk, Inc. Datastreams. Blynk Documentation. Available online: https://docs.blynk.io/en/blynk.console/templates/datastreams (accessed on 20 June 2026).
- Blynk, Inc. Virtual Pins. Blynk Documentation. Available online: https://docs.blynk.io/en/blynk-library-firmware-api/virtual-pins (accessed on 20 June 2026).
Figure 3.
Bidirectional Blynk datastream map for telemetry, status, and remote commands.

Figure 6.
Representative overview of the local LCD, OLED, and Blynk-based cloud interfaces implemented in the prototype.
Figure 6.
Representative overview of the local LCD, OLED, and Blynk-based cloud interfaces implemented in the prototype.

Table 2.
Blynk virtual datastream configuration.
| Virtual pin | Datastream | Direction | Type / unit |
| V0 | Voltage | Device → cloud | Double, V |
| V1 | Current | Device → cloud | Double, A |
| V2 | Active power | Device → cloud | Double, W |
| V3 | Energy | Device → cloud | Double, kWh |
| V4 | Fan status | Device → cloud | Integer, 0/1 |
| V5 | Mode status | Device → cloud | String |
| V6 | Demand-response status | Device → cloud | Integer, 0/1 |
| V7 | Remote manual mode | Cloud → device | Integer, 0/1 |
| V8 | Manual fan command | Cloud → device | Integer, 0/1 |
| V9 | Power limit | Cloud → device | Double, W |
| V10 | PZEM status | Device → cloud | String |
Table 3.
Descriptive statistics for the 14 readings visible in the serial-monitor snapshot. *The displayed resolution prevents inference of smaller variation.
Table 3.
Descriptive statistics for the 14 readings visible in the serial-monitor snapshot. *The displayed resolution prevents inference of smaller variation.
| Variable | n | Minimum | Mean | Maximum | Population SD |
| Voltage (V) | 14 | 213.60 | 214.04 | 214.40 | 0.27 |
| Current (A) | 14 | 0.05 | 0.05 | 0.05 | 0.00* |
| Active power (W) | 14 | 4.30 | 4.37 | 4.40 | 0.05 |
| Energy (kWh) | 14 | 0.00 | 0.00 | 0.00 | 0.00* |
Disclaimer/Publisher’s Note: The statements, opinions and data contained in all publications are solely those of the individual author(s) and contributor(s) and not of MDPI and/or the editor(s). MDPI and/or the editor(s) disclaim responsibility for any injury to people or property resulting from any ideas, methods, instructions or products referred to in the content. |
© 2026 by the authors. Licensee MDPI, Basel, Switzerland. This article is an open access article distributed under the terms and conditions of the Creative Commons Attribution (CC BY) license.
Copyright: This open access article is published under a Creative Commons CC BY 4.0 license, which permit the free download, distribution, and reuse, provided that the author and preprint are cited in any reuse.


