

Submitted:
19 June 2026
Posted:
25 June 2026
You are already at the latest version
Abstract
During acute coronary occlusion, ischemia is a major determinant of the cell response to subsequent reperfusion and is the major precursor of the typical “ischemia-reperfusion injury” (IRI). Therefore, elucidating the full IRI process primarily relies on a good understanding of ischemia-induced alterations.
Ischemic arrhythmias frequently arise during the acute phase of a myocardial infarction (MI) and originate in the terminal arborizations of the cardiac conduction system. These ventricular arrhythmias are triggered by abnormal Ca2+-dependent depolarisations (DADs) of Purkinje cells (Pcells) due to increased spontaneous Ca2+ release by the sarcoplasmic reticulum (SR). This early alteration of the conduction tissue is also likely to provide a substrate for IRI-related arrhythmogenicity. Recent evidence associates the ischemic phase of the MI with a significant increase in SERCA2 pump expression in Pcells, suggesting that enhanced SR-Ca2+ release results from an augmentation of Ca²⁺ sequestration by the SR in those cells. We examined this hypothesis by assessing the impact of ischemia on the dynamics of SR Ca²⁺ uptake in live Pcells by high-resolution confocal microscopy in a classical canine model of LAD coronary ligation.
Pcells from five normal hearts were compared with cells from five hearts 48 Hrs after coronary occlusion. Purkinje-specific Ca2+ events, namely peripheral Ca²⁺ wavelets (Wlets) and central cell-wide waves (CWWs), were analysed to assess the regional SR Ca²⁺ transport of Pcells. A total of 83 normal and 126 MI Wlets, along with 10 normal and 30 MI CWWs, were analysed to compare the peripheral and central SR-Ca2+-transports of Pcells between normal and ischemic hearts.
48 hours following the onset of ischemia, individual SR Ca²⁺ release sites exhibited a 60% increase in Ca²⁺ spark firing rate. However, the site density remained unchanged, indicating an acceleration of intra-SR Ca²⁺ cycling rather than direct alteration of the SR Ca²⁺ release channels. While central CWWs remained unchanged, a 37% acceleration of resting Ca²⁺ restoration was readily visible in peripheral Wlets, consistent with enhanced SR Ca²⁺ uptake at the cell periphery. Computational modelling reproduced these findings when Ca2+ uptake rate was numerically increased by 35%, confirming that augmented SERCA activity is sufficient to explain the pro-arrhythmic SR-Ca2+ release of Pcells after MI.
Our findings confirm that the augmentation of Ca2+ pump density in the periphery of Pcells is associated with an increase in the SR-Ca2+ uptake, explaining the arrhythmogenicity of Purkinje fibres in ischemic heart. This ischemia-mediated pro-arrhythmic remodelling of intracellular Ca2+ handling in the conduction system is also likely to contribute to triggered activity during subsequent reperfusion.
Keywords:
Purkinje cell
; SR-Ca2+-uptake
; Ca2+ arrhythmogenicity
; Purkinje-mediated arrhythmia
; SERCA
; myocardial infarction
1. Introduction
During coronary occlusion, myocardial ischemia is frequently associated with ventricular tachycardias (VTs), electrical storms, fibrillations (VFs), and sudden cardiac arrests. Although reperfusion limits the infarct size and greatly contributes to cardiac muscle survival, the risk of triggered arrhythmias persists and is a life-threatening component of the Ischemia-Reperfusion injury (IRI). An effective anti-arrhythmic strategy during reperfusion therapies requires a good understanding of the origins of early arrhythmogenesis during the ischemic attack.
Mapping and ablation techniques [1,2] showed that ischemic ventricular tachyarrhythmias (VTs and VFs) arise from ectopic activity in the conduction (His-Purkinje) system [3,4]. Abnormal Ca2+ handling of cardiac Purkinje cells (Pcells) has been implicated in this pro-arrhythmic signalling [5,6,7,8,9]. In heart cells, including Pcells, large spontaneous Ca2+ waves can depolarise the cell membrane by activating Ca2+-dependent currents such as INa-Ca and occasionally trigger full action potentials [5,6,10,11,12,13]. Spontaneous Ca2+ waves are initiated by the local release of Ca2+ by the sarcoplasmic reticulum (SR) and propagate in the cell and cell-to-cell through Ca2+ diffusion and “Ca2+-induced Ca2+-release” (CICR) process [14]. The spontaneous SR-Ca2+ release in cardiac cells is often referred to as “SR-Ca2+ leak”. In Pcells, the probability for large electrogenic Ca2+ waves increases with the incidence and amplitude of smaller spontaneous Ca2+ transients, namely Ca2+ sparks and Ca2+ wavelets [15]. A consistent intensification of small and large spontaneous Ca2+ transients has been reported in Pcells of the dog heart within two days after the ligature of the LAD coronary artery [16,17,18]. This confirms the direct relation between increased SR-Ca2+ release in cells of the conduction system and lethal tachyarrhythmias in ischemic hearts [6,8,19].
Despite addressing the origin and unpredictability of ischemic arrhythmias and likely providing a determinant of IRI arrhythmogenicity, the fundamental cause of increased SR-Ca2+ release in Pcells remains unknown.
In the inherited rhythm disorders such as arrhythmogenic right ventricular cardiomyopathy (ARVC) and catecholaminergic polymorphic ventricular tachycardia (CPVT), pro-arrhythmic increase in SR-Ca2+ release was attributed to aberrant ryanodine receptor (RyR) in ventricular myocytes [20,21,22] Deficient RyR has become the standard interpretation of an abnormal “SR-Ca2+ leak” in heart cells and was logically proposed to be the source of abnormal SR-Ca2+ release in Purkinje fibres after MI [18]. Nevertheless, a significant increase in the SR-Ca2+ ATPase expression was recently reported in Pcells of dog, sheep, pig, and human hearts after MI [23], introducing the idea that SR-Ca2+ uptake is enhanced in those cells. As supported by computational modelling [15,24] and proposed in [25]), a larger Ca2+ uptake due to the elevation of the Ca2+ ATPase (SERCA2) activity can increase the rate of Ca2+ recycling by the SR and potentiate the SR-Ca2+ leak. Here, we verified the hypothesis that increased SERCA expression recently reported at the periphery of Pcells of ischemic hearts [23] is an ischemia-induced molecular alteration directly associated with an increase in SR-Ca2+ uptake. To do so, we analysed the impact of ischemia on the regional Ca2+ dynamics of live Pcells.
A strong regionalisation has been previously evidenced in the Ca2+ mobilisation of Pcells owing to -i- the absence of transverse tubules and -ii- a differential expression of SR-Ca2+ release channels in the central and peripheral sub-cellular regions [15,26]. This specificity mediates a complex “centripetal” Ca2+ mobilisation upon electric stimulation, involving consecutive SR-Ca2+ releases from the periphery to the center of Pcells [24]. In unstimulated conditions, the same compartmentalisation of Ca2+ release channels generates region-specific spontaneous Ca2+ events, namely wavelets (Wlets), small and rapid waves propagating over short distances at the periphery, and large cell-wide waves (CWWs), travelling longitudinally by diffusion and CICR in the cell centre. We capitalized on the time course of these typical spontaneous Ca2+-transients to document the SR-Ca2+ uptake function in the different Ca2+ release regions of living Pcells in canine heart with 48 hours MI. To focus on the specific cellular response to ischemia, we elected to use a model of permanent coronary occlusion ligation with no reperfusion. A Purkinje-specific model of intracellular Ca2+ mobilisation [15,24] was used to confirm that an increase in SR-Ca2+ uptake function reproduces the alterations of peripheral Ca2+ dynamics detected experimentally in live Pcells after MI.
2. Methods
2.1. Model of Myocardial Infarction and Cell/Tissue Preparation
Acute myocardial ischemia was induced in healthy adult mongrel dogs (12-15 kg, 1-2 years old and of either sex from Marshall Farm, USA) by the permanent ligation of the left anterior descending (LAD) coronary artery [27,28]. The hearts were explanted 48 hours after the ligation. Free-running Purkinje strands were dissected from the sub-endocardial region of the left ventricle (LV). The method of Pcell isolation was modified from [28,29] and previously described in [23]. Briefly, upon incubation of Purkinje strands with collagenase (Type II, Worthington) at 37oC, pH 6.7 for 30-40 min, the cells were mechanically dispersed with the same medium with no collagenase, then filtered and finally re-suspended in HEPES-buffered medium with 2mM Ca2+ and pH 7.3. The cells were used the same day for intracellular Ca2+ imaging. Normal (control) and “MI” Pcells were prepared from PFs of non-infarcted hearts and hearts with 48 hours MI. MI Pcells were isolated from PFs located in the subendocardial region of the left ventricular chamber, including the infarction zone.
2.2. Intracellular Ca2+ Imaging and Analysis of Spontaneous Ca2+ Transients
After isolation, Pcells were placed in a field-stimulated experimental chamber, and perfused with 2mM Ca2+ standard HEPES solution (Tyrode) at 37oC (pH 7.3) for 5 min. The cells were successively incubated with 5 µM Fluo4-AM (ThermoFisher Scientific, USA), rinsed, and left in the dark for 10 min. The cells were paced at low frequency (0.1Hz) to uniformly activate the intracellular Ca2+ cycling throughout the cells in the preparation. A Fluo-4-loaded Pcell was selected in each preparation (1 cell/preparation) based on a positive response to stimulation (cell shortening) and criteria initially defined in [28]. Ca2+ dependent fluorescence of Fluo-4 was captured by line scanning confocal microscopy (LSCM) at 333 scans/sec for quantitative analysis or 2-dimensional spinning disk confocal microscopy (2DCM) at 30 frames per second (fps) for qualitative assessments as described elsewhere [15,18,30,31]. The relative free-Ca2+ concentration ([Ca2+]) was given by the pixel-to-pixel ratio F/Fo, where F and Fo were the instantaneous fluorescence intensity and basal fluorescence intensity, respectively. Image processing and Ca2+ transient analyses used custom IDL programs (L3Harris Geospatial Solutions, Inc. USA) and modules of the open-source NIH software Image J. Individual spontaneous Ca2+ transients were analysed as described in Figure 1.
2.3. Modelling of Ca2+-Transients.
To assist the interpretation of data from live cells, we used a computational model previously developed to predict the intracellular Ca2+ mobilisation in cardiac Purkinje fibres (15, 24).
The modelling principles are summarised in Figure 2.
2.4. Statistics
We considered that Pcells isolated from 5 normal hearts were representative of a non-ischemic (normal) cellular environment, and cells from 5 hearts with MI were representative of cell-population in typical hypoxic/ischemic conditions. In Table 1, the time course parameters of Ca2+ transients were measured from individual waves and averaged for normal and MI cell groups. The data were expressed as mean ± SD and compared by unpaired t-test and multi-parametric variance analysis.
2.5. Institutional Review Board Statemen
The study was conducted in accordance with the Declaration of Helsinki, and the protocol was approved by the Ethics Committee of Memorial University (21-02-BS, 18-03-BS) on 2025-02-25 and 2022-01-13.
3. Results
3.1. Alteration of Individual Ca2+ Release Sites in Pcells After MI.
Purkinje fibers (Figure 3A.b) were dissected from normal ventricles and from ventricles with 48 hours of ischemic MI (Figure 3A.a). We compared the activity of individual Ca2+ release sites between normal and MI Pcells by measuring the spark firing rate of each site identified as active along 25-50 µm linescans positioned randomly within the cells (Figure 3A.c; Figure 3B.a.) Consistent with the upper shift of the overall spark rate versus pCa relationship reported earlier in canine Pcells after MI [18], we found that, on average, the individual Ca2+ release sites fired sparks at 60% larger frequency in MI Pcells (1.5 ± 1.0 spark counts/site/s, n=24 cells from N=4 hearts with 1 scan sequence per cell) compared with normal Pcells (0.9 ± 0.5 spark counts/site/s, n=28 cells from N=5 hearts with 1 scan sequence per cell, P<0.01); Figure 3B.b). No difference in the number of active sites per scan was detected between the 2 groups [ 3.12 ± 0.96 (Norm; n= 28 cells) versus 3.54 ± 0.98 counts/scan/cell (MI; n=24 cells; P= 0.112)]; Figure 3B.c.
3.2. Region-Specific Alterations of Propagating Ca2+ Transients
As previously reported (15, 30), two different types of spontaneous Ca2+ waves were observed in Pcells: local small amplitude Ca2+ waves (Wlets), propagating on short distances at the cell periphery (Figure 4A), and large amplitude cell-wide waves (CWWs), spanning the full width and propagating in the longitudinal direction of Pcells (Figure 4B).
As reported in Table 1, the Wlets exhibited 53% larger amplitude and 23% decrease in their total duration due to a 25% shortening of the Ca2+ decay phase after MI. Figure 4A and Figure 4D show that fitting a one-phase exponential function through the decline of Ca2+ reveals a significant 37% reduction of the time constant (τ) of the Ca2+ decay of Wlets. This change in τ was not related to the larger transient amplitude (amp) since the same observation was made after normalization to maximal amplitude (see panel c inset in Figure 4A). Also, after MI, we found that Wlets propagated at 22% lower velocity compared to normal Wlets (Table 1), ruling out the propagation from the causes of shorter transient.
At 2 mM Ca2+ and 35oC, CWWs were seen at a very low rate (approximately one wave every 4-6 seconds) in the core of both normal and MI Pcells. The analysis of the wave time course and propagation as illustrated in Figure 1, revealed no alteration in the duration, amplitude and/or velocity of CWWs after MI (Table 1). Fitting the decline of Ca2+ of CWWs through the same model of exponential decay used for Wlet transients showed no difference in the time constant (τ) between normal and MI Pcells after MI (Figure 4B, Figure 4D). Interestingly, staining representative Pcells of ischemic hearts with the same SERCA2 antibody used previously in [23] showed an identical increase in the SR-Ca2+ pump expression over the peripheral region (Figure 4C), where Wlets display here the acceleration of their Ca2+ decay.
3.3. Predicted Impact of Increased SR-Ca2+-Uptake on SR-Ca2+-Release
Unlike CWWs, Wlets exhibited a significant decrease in t, revealing a consistent acceleration of the Ca2+ decay phase after MI. As discussed further in our report, this acceleration is likely to reflect an increased rate of SR-Ca2+ uptake in the cell periphery. Nevertheless, as reported in Table 1, the Wlets exhibited a simultaneous increase in amplitude and a decrease in propagation velocity. To examine whether these alterations were compatible with the local increase in SR-Ca2+ uptake, we used a computational model initially developed to mimic the typical Ca2+ mobilisation of Pcells (15, 24). As illustrated in Figure 5A, we first verified that the model could faithfully reproduce the time courses of normal and MI Wlets shown in Figure 4. As reported on graphs of Figure 5A, the calculations also indicated that switching from normal to MI transient would simultaneously reduce the propagation velocity by 27% (from 258 to 186 µm/s). In Figure 4B, the model predicted the impact of increasing SR-Ca2+ uptake on the Ca2+ release (“Ca2+ pulse”) function and the transient time course of peripheral Ca2+ transients. The maximal Ca2+-uptake rate (Umax) used in the simulation of normal Ca2+ transient of Figure 5A.a, was incrementally increased until the Ca2+ uptake rate-Ca2+ relationship matched that required to reproduce the MI transient of Figure 5A.b. The other parameters of the Uptake rate-Ca2+ relationship, namely the Hill coefficient (NHill) and EC50, were kept constant during the test. Figure 5B shows that each Umax increment was accompanied by a simultaneous rise in the amplitude of the Ca2+-release pulse and transient amplitude of Wlets. A 35% augmentation of Umax reproduced the MI Wlet time course. No alteration of other model input parameters, such as diffusion coefficient, Ca2+-release threshold, etc., was necessary for the successful simulation.
4. Discussion
4.1. Spontaneous Ca2+ Events to Probe the Regional Ca2+ Dynamics of Pcells
Our current study focused on spontaneous rather than electrically evoked Ca2+ transients. In Pcells of large mammalian species, different Ca2+ release channels are expressed in distinct concentric layers of the SR [15]. In response to electric stimulation, this regionalisation of SR Ca2+ release generates a complex centripetal Ca2+ mobilisation [24], whereby the evoked Ca2+ transient arises under the sarcolemma and propagates to the center by a CICR-diffusion-CICR process. During centripetal propagation, the Ca2+ transient overlaps with successive layers of Ca2+ release, making it difficult to delineate and characterise regional Ca2+ dynamics under stimulated conditions. In contrast, under unstimulated conditions, the Ca2+ release channels open spontaneously and generate Ca2+ transients specific to each region (15, 30), namely, Wlets at the cell periphery and CWWs in the core. Computational studies demonstrated that combinations of SR-Ca2+ release, Ca2+ diffusion, and Ca2+ uptake can reproduce the Ca2+ transients of Pcells (15, 24), which, conversely, can be dissected to document the individual cellular functions. Here, we analysed the Wlets and CWWs to “probe” the Ca2+ uptake function and examine whether Pcells exhibit a change in the peripheral region after MI as it was recently hypothesised from increased regional SERCA density [23].
4.2. Acceleration of SR-Ca2+ Recycling: A Cause of Larger Ca2+ Leak in Pcells After MI
An upward shift in the relationship between the incidence of Ca2+ sparks and Ca2+ concentration (pCa) has been reported in dog Pcells after MI [18]. This finding clearly indicated an augmentation of spontaneous SR-Ca2+ release in those cells, which could explain the (Ca2+-mediated) arrhythmogenicity of Purkinje fibres in ischemic hearts [8]. This larger spontaneous Ca2+ release was first interpreted by an elevation in the sensitivity of SR-Ca2+ release channels to Ca2+ [18], possibly due to a decrease in the luminal Ca2+ release threshold [20]. Nevertheless, an increase in the Ca2+ sensitivity is expected to activate more abundant SR-Ca2+ channels for the same SR-Ca2+ level. Here, we found no change in the recruitment of active Ca2+ release sites. In addition, contrasting the ubiquitous RyR2 channel of ventricular myocytes, three different forms of SR-Ca2+ release channel (RyR2, RyR3, InP3R1) are expressed in distinct regions of Pcells (15, 30). Though not completely excluded, a simultaneous alteration of the three channels within 48 hours is less likely. Alternatively, an acceleration of Ca2+ recycling by the SR is expected to increase the opening frequency of a constant number of SR-Ca2+ channels, without altering channel Ca2+ sensitivity. Our spark analysis supports this explanation, which is also consistent with [25]
4.3. Increased SR-Ca2+ Uptake and Faster SR-Ca2+ Recycling After MI
Two conditions can increase the circulation rate of free-Ca2+ in the SR compartment and accelerate the Ca2+ cycling by the SR: the reduction of Ca2+ buffering by the reticular proteins, such as CASQ2 [33] and the augmentation of SR-Ca2+-uptake [34]. It was previously shown in canine Pcells that the caffeine-induced Ca2+ transient was unchanged after MI [18]. This indicates that, at steady state, the releasable amount of Ca2+ in the SR is not affected after MI, thereby excluding Ca2+ buffering as a cause of faster SR-Ca2+ cycling and, conversely, supporting the implication of SR-Ca2+ uptake.
4.4. Peripheral Location of SR-Ca2+ Uptake Elevation
A recent study revealed that the density of SR-Ca2+ ATPases (SERCA2) is consistently increased at the edge of Pcells; this was verified in dog, sheep, pig and human ischemic hearts, supporting the translational interest of our findings [23]. The faster Ca2+ decay of Wlets observed in our current study indicates a peripheral augmentation of SR-Ca2+ uptake, matching the larger expression of SR-Ca2+ pumps in this region. In contrast, the absence of modification in the decay of CWWs seems to exclude an alteration of SR-Ca2+ uptake in the core of Pcells, where, supportively, no change in the density of Ca2+ pumps was detected [23]. We conclude that ischemic conditions in the heart selectively affect the Ca2+ handling at the periphery of Pcells, i.e. in the region whereby small Ca2+ events have been shown to trigger the large depolarising CWWs [15].
4.5. Increase in Peripheral SR-Ca2+ Uptake in Pcells: A Primary Consequence of Ischemic Conditions
Our current conclusion that peripheral SR-Ca2+ uptake is increased after MI is based on the faster Ca2+ decline of Wlet transient. However, this alteration was accompanied by a 50% increase in the amplitude and a 22% decrease in the propagation velocity of Wlets, raising the question of whether these Ca2+ changes are secondary to the increase in SR-Ca2+ uptake or primary consequences of other anomalies in Pcells. Our numerical model predicted that a 35% increase in the rate of Ca2+ uptake can reproduce the change of normal into MI Wlet transients, and this switch would be associated with a reduction in the Wlet velocity, comparable to that seen in live Pcells after MI (Table 1). As described in [25], mechanistically, a stronger Ca2+ pumping is anticipated to slow down the process of CICR-diffusion-CICR responsible for the progression of the wave front and, therefore, could explain the slower propagation of Wlets after MI. The large increase in the Wlet transient amplitude was also predicted when the rate of Ca2+ uptake was enhanced in the model. This predicted larger amplitude was in agreement with the augmentation of the Ca2+ pulse shown in FIGURE 5, indicating that the rise in the amount of Ca2+ released from the SR is a direct consequence of increased Ca2+ re-pumping in the SR.
4.6. Nature and Impact of Larger SR-Ca2+ Uptake at the Cell Periphery
Our analysis of Wlets reveals a selective increase in the SR-Ca2+ uptake at the periphery of Pcells in the ischemic heart. An augmentation of SERCA2 expression in this region, as reported recently under identical conditions [23], can explain this functional Ca2+ alteration at the periphery.
It is logical to anticipate that additional expression of Ca2+ pumps will potentiate the overall SR-Ca2+ uptake function and increase the rate of electrogenic spontaneous SR-Ca2+ releases in Pcells. Nevertheless, besides the density, the nature of the Ca2+ pumps may also contribute to the alteration of SR-Ca2+ uptake at the Pcell periphery after MI. SERCA2a sub-isoform represents more than 95% of SR-Ca2+ pumps in mammalian heart cells (35, 36), and is produced by pre-mRNA splicing of the SERCA2 gene ATP2a2 (36, 37). The splicing process is tissue-specific, generating the SERCA2a sub-isoform in the heart and SERCA2b in virtually all other non-cardiac tissues [37]. Importantly, predominant SERCA2b expression at the cell periphery has been reported in other tissues such as smooth muscle of the pulmonary artery [38], and SERCA2b transcript has been found to increase by 180% in Purkinje fibres of pig heart with 48 hours of ischemic MI [23]. We propose that the increased SR-Ca2+ uptake evidenced in our current study is directly associated with the expression of the ubiquitous SERCA2b pump at the periphery of Pcells after MI.
4.7. Limitations
Our imaging protocol prioritised the cell survival and spatiotemporal resolution of individual transients, notably by using the line-scanning technique, which limits the laser illumination duration and intensity on cells and maximises the sampling rate of Ca2+ variations. This procedure did not permit us to evaluate the frequency of low-incidence electrogenic CWWs and did not, therefore, confirm the Ca2+ arrhythmogenicity of Pcells in our current study. Similarly, the confocality did not permit measuring the Wlets frequency due to the extreme localisation, random occurrence and short life span of these events. Nonetheless, an increase in the rate of depolarising CWWs associated with an augmentation of small peripheral events has been previously demonstrated in the same model of Purkinje fibres (6, 16, 17). Because our highly focused present study is the logical extension of those observations, a re-validation of the Ca2+ arrhythmogenicity of Pcells in our canine model of ischemia was not necessary
4.8. Conclusion
In the dog model of coronary occlusion, the myocardial ischemia is accompanied by an acceleration of SR-Ca2+ uptake in the periphery of Pcells. This regional Ca2+ alteration could be correlated with the expression of the SERCA2b pump in the same region and may provide the molecular basis of the Purkinje arrhythmogenicity in the heart with ischemic MI. Ca2+ overload, a known component of reperfusion injury, may accentuate the effect of increased SR Ca2+ uptake on pro-arrhythmic SR Ca2+ release and promote further triggered activity, at least, in the His-Purkinje system.
References
- Haïssaguerre, M.; Shoda, M.; Jaïs, P.; Nogami, A.; Shah, D.C.; Kautzner, J.; Arentz, T.; Kalushe, D.; Lamaison, D.; Griffith, M.; Cruz, F.; De Paola, A.; Gaïta, F.; Hocini, M.; Garrigue, S.; Macle, L.; Weerasooriya, R.; Clémenty, J. Haïssaguerre M, Shoda M, Jaïs P, Nogami A, Shah DC, Kautzner J, Arentz T, Kalushe D, Lamaison D, Griffith M, Cruz F, De Paola A, Gaïta F, Hocini M, Garrigue S, Macle L, Weerasooriya R, Clémenty J. Mapping and ablation of idiopathic ventricular fibrillation. Circulation 106: 962–967, 2002. [CrossRef]
- Szumowski, L.; Sanders, P.; Walczak, F.; Hocini, M.; Jaïs, P.; Kepski, R.; Szufladowicz, E.; Urbanek, P.; Derejko, P.; Bodalski, R.; Haïssaguerre, M. Szumowski L, Sanders P, Walczak F, Hocini M, Jaïs P, Kepski R, Szufladowicz E, Urbanek P, Derejko P, Bodalski R, Haïssaguerre M. Mapping and ablation of polymorphic ventricular tachycardia after myocardial infarction. J Am Coll Cardiol 44: 1700–1706, 2004. [CrossRef]
- Haïssaguerre, M.; Shah, D.C.; Jaïs, P.; Shoda, M.; Kautzner, J.; Arentz, T.; Kalushe, D.; Kadish, A.; Griffith, M.; Gaïta, F.; Yamane, T.; Garrigue, S.; Hocini, M.; Clémenty, J. Haïssaguerre M, Shah DC, Jaïs P, Shoda M, Kautzner J, Arentz T, Kalushe D, Kadish A, Griffith M, Gaïta F, Yamane T, Garrigue S, Hocini M, Clémenty J. Role of Purkinje conducting system in triggering of idiopathic ventricular fibrillation. Lancet 359: 677–678, 2002. [CrossRef]
- Nogami, A. Nogami A. Purkinje-related Arrhythmias. J Arrhythmia 27: 6–27, 2011. [CrossRef]
- Boyden, P.A.; Pu, J.; Pinto, J.; Ter Keurs, H.E.D.J. Boyden PA, Pu J, Pinto J, Ter Keurs HEDJ. Ca2+ transients and Ca2+ waves in purkinje cells: Role in action potential initiation. Circ Res 86: 448–455, 2000. [CrossRef]
- Ter Keurs, H.E.D.J.; Boyden, P.A. Ter Keurs HEDJ, Boyden PA. Calcium and arrhythmogenesis. Physiol Rev 87: 457–506, 2007. [CrossRef]
- Shiferaw, Y.; Aistrup, G.L.; Wasserstrom, J.A. Shiferaw Y, Aistrup GL, Wasserstrom JA. Intracellular Ca2+ waves, afterdepolarizations, and triggered arrhythmias. Cardiovasc Res 95: 265–268, 2012. [CrossRef]
- Haissaguerre, M.; Vigmond, E.; Stuyvers, B.; Hocini, M.; Bernus, O. Haissaguerre M, Vigmond E, Stuyvers B, Hocini M, Bernus O. Ventricular arrhythmias and the His-Purkinje system. Nat Rev Cardiol 13: 155–166, 2016. [CrossRef]
- Kistamás, K.; Veress, R.; Horváth, B.; Bányász, T.; Nánási, P.P.; Eisner, D.A. Kistamás K, Veress R, Horváth B, Bányász T, Nánási PP, Eisner DA. Calcium Handling Defects and Cardiac Arrhythmia Syndromes. Front. Pharmacol. 11: 2020.
- Eisner, D.A.; Lederer, W.J. Eisner DA, Lederer WJ. Na-Ca exchange: Stoichiometry and electrogenicity. Am J Physiol - Cell Physiol 17: C189–C202, 1985. [CrossRef]
- Stuyvers, B.D.; Boyden, P.A.; Ter Keurs, H.E.D. Stuyvers BD, Boyden PA, Ter Keurs HED. Calcium waves: Physiological relevance in cardiac function. Circ Res 86: 1016–1018, 2000. [CrossRef]
- Capogrossi, M.C.; Houser, S.R.; Bahinski, A.; Lakatta, E.G. Capogrossi MC, Houser SR, Bahinski A, Lakatta EG. Synchronous Occurrence of Spontaneous Localized Calcium Release From the Sarcoplasmic Reticulum Generates Action Potentials in Rat Cardiac Ventricular Myocytes at Normal Resting Membrane Potential. Circ Res 61: 498–503, 1987.
- Schlotthauer, K.; Bers, D.M. Schlotthauer K, Bers DM. Sarcoplasmic reticulum Ca2+ release causes myocyte depolarization. Circ Res 87: 774–780, 2000. [CrossRef]
- Backx, P.H.; De Tombe, P.P.; Van Deen, J.H.K.; Mulder, B.J.M.; Ter Keurs, H.E.D.J. Backx PH, De Tombe PP, Van Deen JHK, Mulder BJM, Ter Keurs HEDJ. A model of propagating calcium-induced calcium release mediated by calcium diffusion. J Gen Physiol 93: 963–977, 1989. [CrossRef]
- Stuyvers, B.D.; Dun, W.; Matkovich, S.; Sorrentino, V.; Boyden, P.A.; Ter Keurs, H.E.D.J. Stuyvers BD, Dun W, Matkovich S, Sorrentino V, Boyden PA, Ter Keurs HEDJ. Ca2+ sparks and waves in canine Purkinje cells: A triple layered system of Ca2+ activation. Circ Res 97: 35–43, 2005. [CrossRef]
- Boyden, P.A.; Barbhaiya, C.; Lee, T.; Ter Keurs, H.E.D.J. Boyden PA, Barbhaiya C, Lee T, Ter Keurs HEDJ. Nonuniform Ca 2+ transients in arrhythmogenic Purkinje cells that survive in the infarcted canine heart. Cardiovasc Res 57: 681–693, 2003.
- Hirose, M.; Stuyvers, B.D.; Dun, W.; Ter Keurs, H.E.; Boyden, P.A. Hirose M, Stuyvers BD, Dun W, Ter Keurs HE, Boyden PA. Increased Spontaneous Ca2+ Release in Arrhythmogenic Purkinje Cells from Infarcted Canine Heart is Due to a Lowered Threshold of Ca2+ Release Channels. In: Circulation, 114, Suppl.58. 2006, p. 9–10.
- Hirose, M.; Stuyvers, B.; Dun, W.; ter Keurs, H.E.D.J.; Boyden, P.A.P. Hirose M, Stuyvers B, Dun W, ter Keurs HEDJ, Boyden PAP. Function of Ca2+ release channels in Purkinje cells that survive in the infarcted canine heart: a mechanism for triggered Purkinje ectopy. Circ Arrhythm Electrophysiol 1: 387–395, 2008. [CrossRef]
- Houser, S.R. Houser SR. When does spontaneous sarcoplasmic reticulum Ca2+ release cause a triggered arrhythmia? Cellular versus tissue requirements. Circ Res 87: 725–727, 2000. [CrossRef]
- Chen, W.; Wang, R.; Chen, B.; Zhong, X.; Kong, H.; Bai, Y.; Zhou, Q.; Xie, C.; Zhang, J.; Guo, A.; Tian, X.; Jones, P.P.; O’Mara, M.L.; Liu, Y.; Mi, T.; Zhang, L.; Bolstad, J.; Semeniuk, L.; Cheng, H.; Zhang, J.; Chen, J.; Tieleman, D.P.; Gillis, A.M.; Duff, H.J.; Fill, M.; Song, L.S.; Chen, S.R.W. Chen W, Wang R, Chen B, Zhong X, Kong H, Bai Y, Zhou Q, Xie C, Zhang J, Guo A, Tian X, Jones PP, O’Mara ML, Liu Y, Mi T, Zhang L, Bolstad J, Semeniuk L, Cheng H, Zhang J, Chen J, Tieleman DP, Gillis AM, Duff HJ, Fill M, Song LS, Chen SRW. The ryanodine receptor store-sensing gate controls Ca 2+ waves and Ca2+-triggered arrhythmias. Nat Med 20: 184–192, 2014. [CrossRef]
- Priori, S.G.; Chen, S.R.W. Priori SG, Chen SRW. Inherited dysfunction of sarcoplasmic reticulum Ca2+ handling and arrhythmogenesis. Circ Res 108: 871–883, 2011. [CrossRef]
- Tiso, N.; Stephan, D.A.; Nava, A.; Bagattin, A.; Devaney, J.M.; Stanchi, F.; Larderet, G.; Brahmbhatt, B.; Brown, K.; Bauce, B.; Muriago, M.; Basso, C.; Thiene, G.; Danieli, G.A.; Rampazzo, A. Tiso N, Stephan DA, Nava A, Bagattin A, Devaney JM, Stanchi F, Larderet G, Brahmbhatt B, Brown K, Bauce B, Muriago M, Basso C, Thiene G, Danieli GA, Rampazzo A. Identification of mutations in the cardiac ryanodine receptor gene in families affected with arrhythmogenic right ventricular cardiomyopathy type 2 (ARVD2). Hum Mol Genet 10: 189–194, 2001. [CrossRef]
- Stuyvers, B.D.; Guo, Y.; Dun, W.; Boyden, P.A.; Amin, R.; Wiede, L.; Doré, J.; Hopkinson, Z.; ter Keurs, H.E.D.J.; Haissaguerre, M.; Hocini, M.; Brette, F.; Bernus, O.; Chaigne, S.; Quesson, B.; Vigmond, E. Stuyvers BD, Guo Y, Dun W, Boyden PA, Amin R, Wiede L, Doré J, Hopkinson Z, ter Keurs HEDJ, Haissaguerre M, Hocini M, Brette F, Bernus O, Chaigne S, Quesson B, Vigmond E. Remodeling of sarcoplasmic reticulum Ca2+ uptake in cardiac Purkinje cells after ischemic myocardial infarction in various large mammalian species and humans. Am J Physiol - Cell Physiol 330: C252–C264, 2026. [CrossRef]
- Haq, K.T.; Daniels, R.E.; Miller, L.S.; Miura, M.; ter Keurs, H.E.D.J.; Bungay, S.D.; Stuyvers, B.D. Haq KT, Daniels RE, Miller LS, Miura M, ter Keurs HEDJ, Bungay SD, Stuyvers BD. Evoked centripetal Ca2+ mobilization in cardiac Purkinje cells: Insight from a model of three Ca2+ release regions. J Physiol 591: 4301–4319, 2013. [CrossRef]
- Sato, D.; Uchinoumi, H.; Bers, D.M. Sato D, Uchinoumi H, Bers DM. Increasing SERCA function promotes initiation of calcium sparks and breakup of calcium waves. J Physiol 599: 3267–3278, 2021. doi: DOI:10.1113/jp281579.
- Stuyvers, B.D. Stuyvers BD. Calcium arrhythmogenicity of Purkinje fibers: importance of the animal model. Front Physiol 16, 2025. [CrossRef]
- Harris, A.S. Harris AS. Delayed development of ventricular ectopic rhythms following experimental coronary occlusion. Circulation 1: 1318–1328, 1950. [CrossRef]
- Boyden, P.A.; Albala, A.; Dresdner, K.P. Boyden PA, Albala A, Dresdner KP. Electrophysiology and ultrastructure of canine subendocardial Purkinje cells isolated from control and 24-hour infarcted hearts. Circ Res 65: 955–970, 1989. [CrossRef]
- Sheets, M.F.; January, C.T.; Fozzard, H.A. Sheets MF, January CT, Fozzard HA. Isolation and characterization of single canine cardiac Purkinje cells. Circ Res 53: 544–548, 1983. [CrossRef]
- Daniels, R.E.; Haq, K.T.; Miller, L.S.; Chia, E.W.; Miura, M.; Sorrentino, V.; McGuire, J.J.; Stuyvers, B.D. Daniels RE, Haq KT, Miller LS, Chia EW, Miura M, Sorrentino V, McGuire JJ, Stuyvers BD. Cardiac expression of ryanodine receptor subtype 3; a strategic component in the intracellular Ca2 + release system of Purkinje fibers in large mammalian heart. J Mol Cell Cardiol 104: 31–42, 2017. [CrossRef]
- Hirose, M.; Stuyvers, B.; Dun, W.; ter Keurs, H.; Boyden, P.A. Hirose M, Stuyvers B, Dun W, ter Keurs H, Boyden PA. Wide long lasting perinuclear Ca2+ release events generated by an interaction between ryanodine and IP3 receptors in canine Purkinje cells. J Mol Cell Cardiol 45: 176–184, 2008. [CrossRef]
- Haq, K.T. Haq KT. Intracellular Ca2+ cycling of cardiac Purkinje fibers : new insights from computational modelling. Faculty of Medicine. Memorial University of Newfoundland: 2016.
- Prins, D.; Michalak, M. Prins D, Michalak M. Organellar calcium buffers. Cold Spring Harb Perspect Biol 3: 1–16, 2011. [CrossRef]
- Eisner, D.A.; Caldwell, J.L.; Kistamás, K.; Trafford, A.W. Eisner DA, Caldwell JL, Kistamás K, Trafford AW. Calcium and Excitation-Contraction Coupling in the Heart. Circ Res 121: 181–195, 2017. [CrossRef]
- Vangheluwe, P.; Schuermans, M.; Raeymaekers, L.; Wuytack, F. Vangheluwe P, Schuermans M, Raeymaekers L, Wuytack F. Tight interplay between the Ca2+ affinity of the cardiac SERCA2 Ca2+ pump and the SERCA2 expression level. Cell Calcium 42: 281–289, 2007. [CrossRef]
- Dally, S.; Corvazier, E.; Bredoux, R.; Bobe, R.; Enouf, J. Dally S, Corvazier E, Bredoux R, Bobe R, Enouf J. Multiple and diverse coexpression, location, and regulation of additional SERCA2 and SERCA3 isoforms in nonfailing and failing human heart. J Mol Cell Cardiol 48: 633–644, 2010. [CrossRef]
- Periasamy, M.; Kalyanasundaram, A. Periasamy M, Kalyanasundaram A. SERCA pump isoforms: Their role in calcium transport and disease. Muscle and Nerve 35: 430–442, 2007. [CrossRef]
- Clark, J.H.; Kinnear, N.P.; Kalujnaia, S.; Cramb, G.; Fleischer, S.; Jeyakumar, L.H.; Wuytack, F.; Evans, A.M. Clark JH, Kinnear NP, Kalujnaia S, Cramb G, Fleischer S, Jeyakumar LH, Wuytack F, Evans AM. Identification of functionally segregated sarcoplasmic reticulum calcium stores in pulmonary arterial smooth muscle. J Biol Chem 285: 13542–13549, 2010. [CrossRef]
Figure 1.
High-resolution confocal microscopy and analysis of spontaneous Ca2+ transients in dog Purkinje cells. A: wavelet transients were captured by fluorescence laser scanning confocal microscopy (LSCM) at a scanning rate of 350 Hz along 25-50 µm distances. As reported previously, wavelets propagated exclusively at the periphery of Pcells in the “SubSL compartment” (15, 30). For clarity, a scan example (blue line) of the peripheral region is represented on a representative 2D (spinning disk) confocal snapshot of a propagating wavelet in A.a. 250 successive scans of the same region (3ms/scan) were arranged into the scan-line image shown in A.c. The time course of the transient shown in A.b was measured at half the distance of the wave’s overall propagation along the a-b segment represented in A.c. A linear regression through maximal scan values verifies the linearity of the propagation (A.c) and consistency of transient amplitude (A.d) during the propagation; see c-d linear regression curve in A.c; data points are the maximal values measured in the scans. Transients with amplitude fluctuation > 5% during the propagation were rejected. Parameters listed in panel A.d were measured as indicated in A.b and A.d: Trise [1] was the time of rising phase at half-maximal amplitude of the time course measured in a-b and expressed in ms; Tdecay [2] was the decay duration at the half-maximal amplitude of the time course measured in a-b and was expressed in ms; Amp [6] was the maximal amplitude of the time course and was expressed in Fluo-4 fluorescence F/Fo ratio units (see methods); basal level [5] was the resting level of Ca2+ measured during the overall propagation during the scan and was measured in F/Fo ratio units; maximal amplitude [6] was the maximal amplitude detected during the overall propagation during the scan and was expressed in F/Fo ratio units. A custom module of IDL software automatically generated data of A.b-d from raw scan line images shown in A.c. B: CWW transient parameters were measured using the method described for wavelet transients in A. Scans were positioned in the centre of the cells to capture the exact central kinetics of the Ca2+ variation. For clarity, an example of a central scan was superimposed on a 2D confocal snapshot of a representative CWW propagation along the cell in B.a.
Figure 1.
High-resolution confocal microscopy and analysis of spontaneous Ca2+ transients in dog Purkinje cells. A: wavelet transients were captured by fluorescence laser scanning confocal microscopy (LSCM) at a scanning rate of 350 Hz along 25-50 µm distances. As reported previously, wavelets propagated exclusively at the periphery of Pcells in the “SubSL compartment” (15, 30). For clarity, a scan example (blue line) of the peripheral region is represented on a representative 2D (spinning disk) confocal snapshot of a propagating wavelet in A.a. 250 successive scans of the same region (3ms/scan) were arranged into the scan-line image shown in A.c. The time course of the transient shown in A.b was measured at half the distance of the wave’s overall propagation along the a-b segment represented in A.c. A linear regression through maximal scan values verifies the linearity of the propagation (A.c) and consistency of transient amplitude (A.d) during the propagation; see c-d linear regression curve in A.c; data points are the maximal values measured in the scans. Transients with amplitude fluctuation > 5% during the propagation were rejected. Parameters listed in panel A.d were measured as indicated in A.b and A.d: Trise [1] was the time of rising phase at half-maximal amplitude of the time course measured in a-b and expressed in ms; Tdecay [2] was the decay duration at the half-maximal amplitude of the time course measured in a-b and was expressed in ms; Amp [6] was the maximal amplitude of the time course and was expressed in Fluo-4 fluorescence F/Fo ratio units (see methods); basal level [5] was the resting level of Ca2+ measured during the overall propagation during the scan and was measured in F/Fo ratio units; maximal amplitude [6] was the maximal amplitude detected during the overall propagation during the scan and was expressed in F/Fo ratio units. A custom module of IDL software automatically generated data of A.b-d from raw scan line images shown in A.c. B: CWW transient parameters were measured using the method described for wavelet transients in A. Scans were positioned in the centre of the cells to capture the exact central kinetics of the Ca2+ variation. For clarity, an example of a central scan was superimposed on a 2D confocal snapshot of a representative CWW propagation along the cell in B.a.
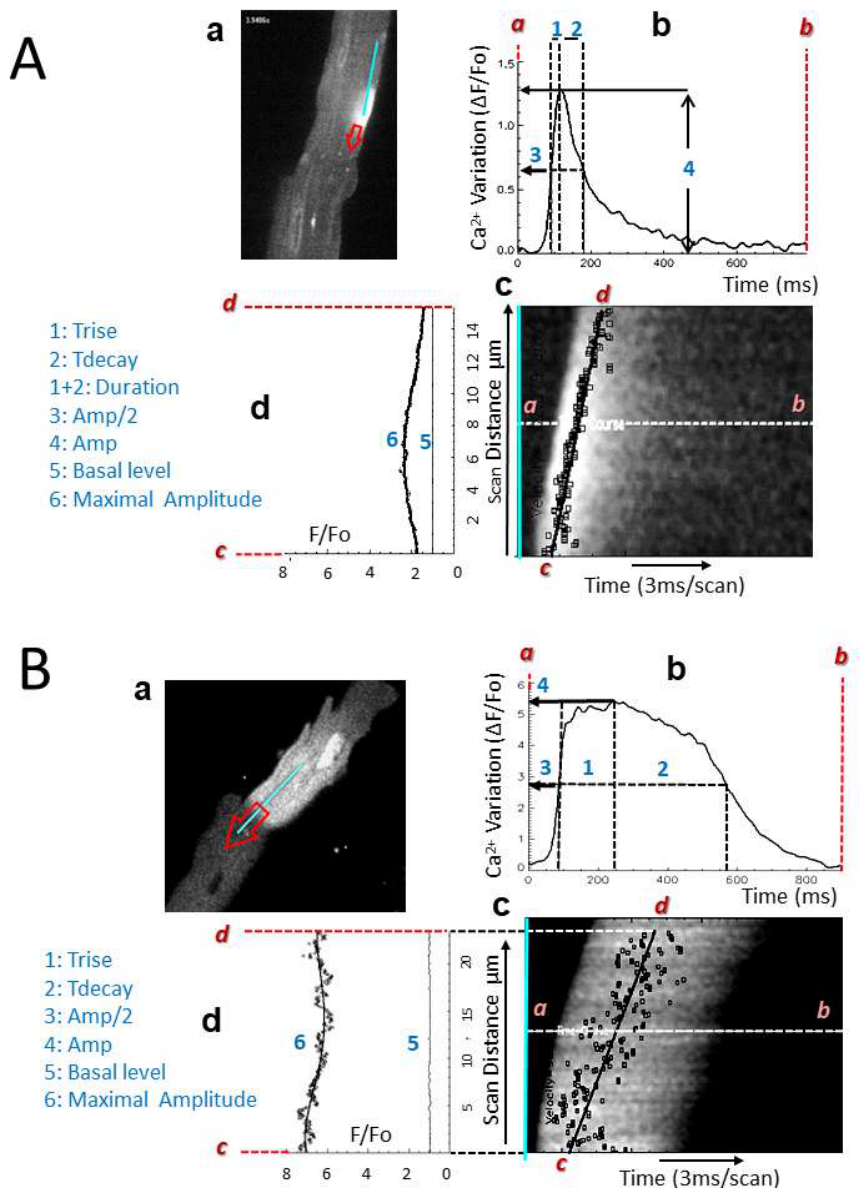
Figure 2.
Modeling Principles. A one-dimensional diffusion model equation (A) was initially built on a combination of Ca2+ release, Ca2+ uptake, Ca2+ diffusion, and Ca2+ interaction with principal cellular ligands [15]. The model assumes an array of elements (nodes) that release Ca2+, and the propagation of free Ca2+ from node to node is dictated by diffusion (B) and interaction with cellular ligands (C). CICR activates adjacent Ca2+ release nodes. we assumed a pulse-shaped Ca2+ release flux (R) with exponential rise and fall (D). Opening of the Ca2+ channel was spontaneous or triggered by CICR when nodal [Ca2+] exceeded a variable threshold (Thr). Ca2+ release through open channels was assumed to exhibit a decay inversely proportional to [Ca2+]i near the channel. For simplification, we only considered the binding of free-Ca2+ with ATP, Fluo-4, calmodulin (CaM), and troponin C (TnC) (C). The ligand concentrations (Ligand) and rate constants (k) were adjusted to experimental temperature, assuming a Q10 of 2. We assumed that [Mg2+]i was constant (1 mM) and that ATP only binds Ca2+ and Mg2+. Ca2+ uptake nodes surrounded each Ca2+ release node and were located mid-distance between release nodes to mimic the location of Ca2+ pumps in the longitudinal SR. Ca2+ uptake flux (U) was assumed to follow Hill kinetics. Parameters of Ca2+ uptake by the SR were measured from cardiac myocytes in the laboratory. Cytosolic [Ca2+]i at rest was assumed to be 70 nM and the calculation begins with the buffers in equilibrium, using a physical diffusion coefficient D for Ca2+ (in water) of 3.0⋅10-6 cm2⋅s-1. The integration interval was 10-7 s. A more recent system of differential equations was developed from the same principles and was used for the numerical data of Figure 5. The calculations are detailed in (24, 32) and Matlab codes are available at https://www.mun.ca/medicine/media/production/medicine/documents/Model_code.pdf
Figure 2.
Modeling Principles. A one-dimensional diffusion model equation (A) was initially built on a combination of Ca2+ release, Ca2+ uptake, Ca2+ diffusion, and Ca2+ interaction with principal cellular ligands [15]. The model assumes an array of elements (nodes) that release Ca2+, and the propagation of free Ca2+ from node to node is dictated by diffusion (B) and interaction with cellular ligands (C). CICR activates adjacent Ca2+ release nodes. we assumed a pulse-shaped Ca2+ release flux (R) with exponential rise and fall (D). Opening of the Ca2+ channel was spontaneous or triggered by CICR when nodal [Ca2+] exceeded a variable threshold (Thr). Ca2+ release through open channels was assumed to exhibit a decay inversely proportional to [Ca2+]i near the channel. For simplification, we only considered the binding of free-Ca2+ with ATP, Fluo-4, calmodulin (CaM), and troponin C (TnC) (C). The ligand concentrations (Ligand) and rate constants (k) were adjusted to experimental temperature, assuming a Q10 of 2. We assumed that [Mg2+]i was constant (1 mM) and that ATP only binds Ca2+ and Mg2+. Ca2+ uptake nodes surrounded each Ca2+ release node and were located mid-distance between release nodes to mimic the location of Ca2+ pumps in the longitudinal SR. Ca2+ uptake flux (U) was assumed to follow Hill kinetics. Parameters of Ca2+ uptake by the SR were measured from cardiac myocytes in the laboratory. Cytosolic [Ca2+]i at rest was assumed to be 70 nM and the calculation begins with the buffers in equilibrium, using a physical diffusion coefficient D for Ca2+ (in water) of 3.0⋅10-6 cm2⋅s-1. The integration interval was 10-7 s. A more recent system of differential equations was developed from the same principles and was used for the numerical data of Figure 5. The calculations are detailed in (24, 32) and Matlab codes are available at https://www.mun.ca/medicine/media/production/medicine/documents/Model_code.pdf
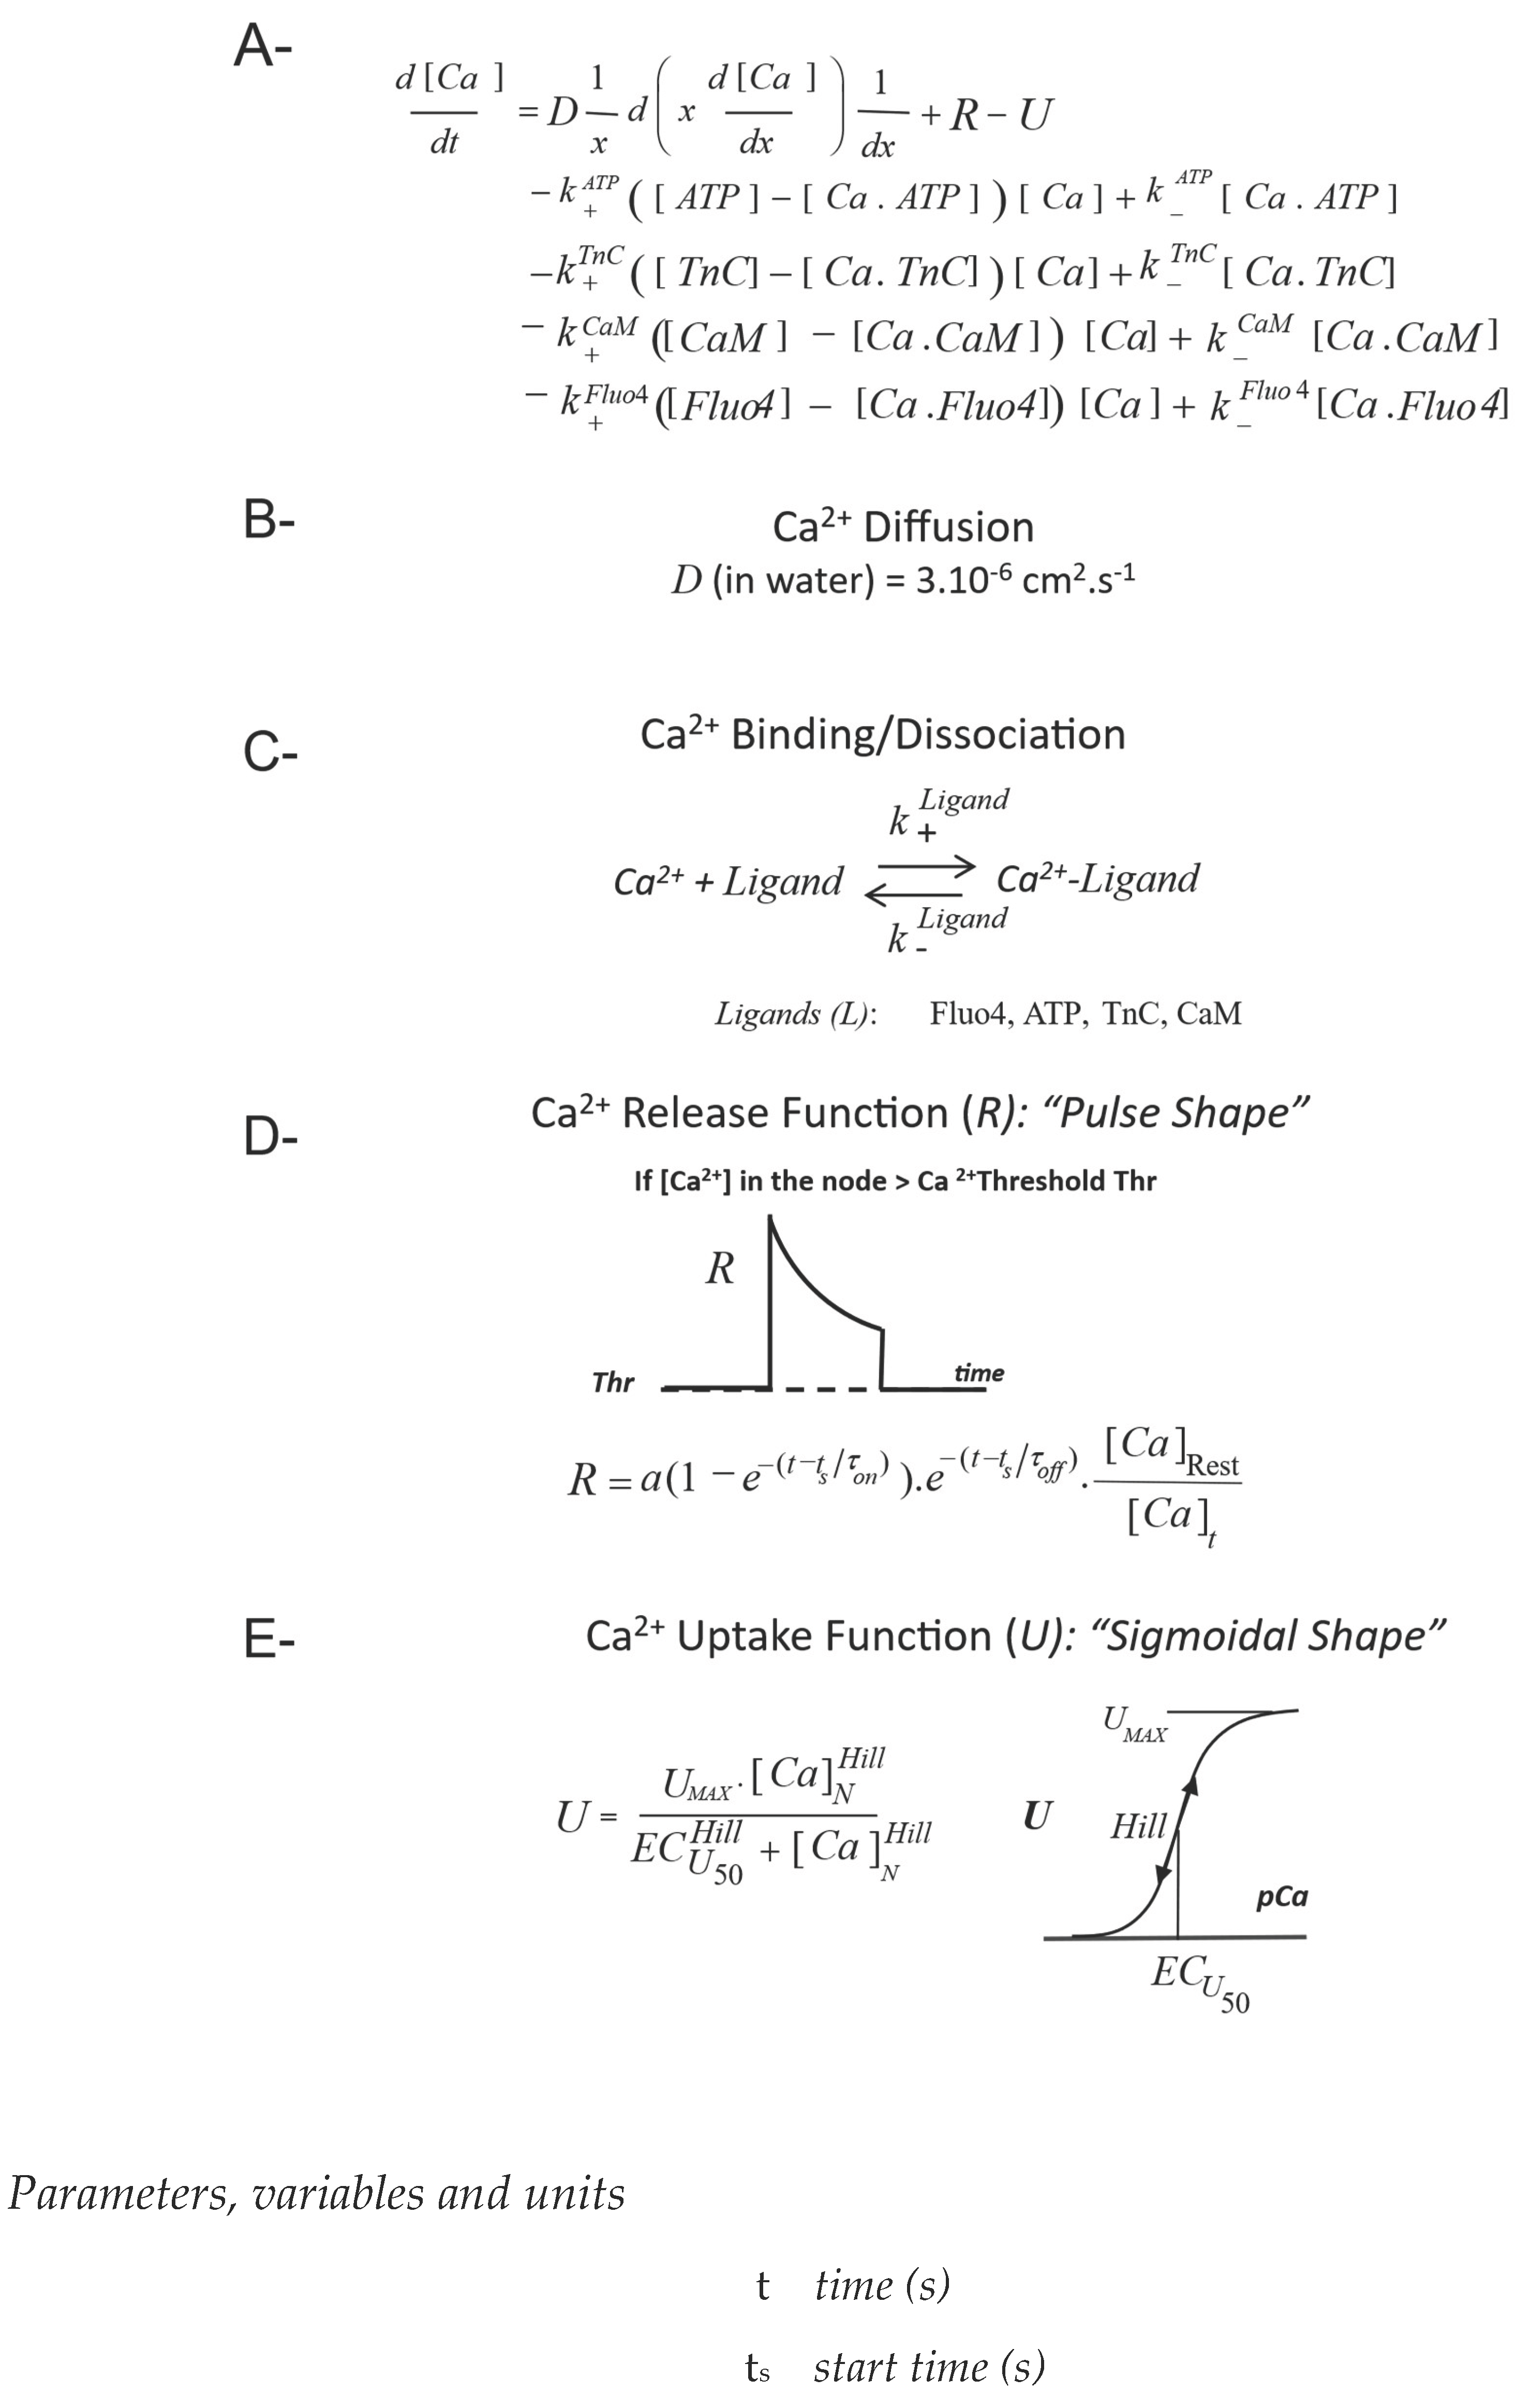
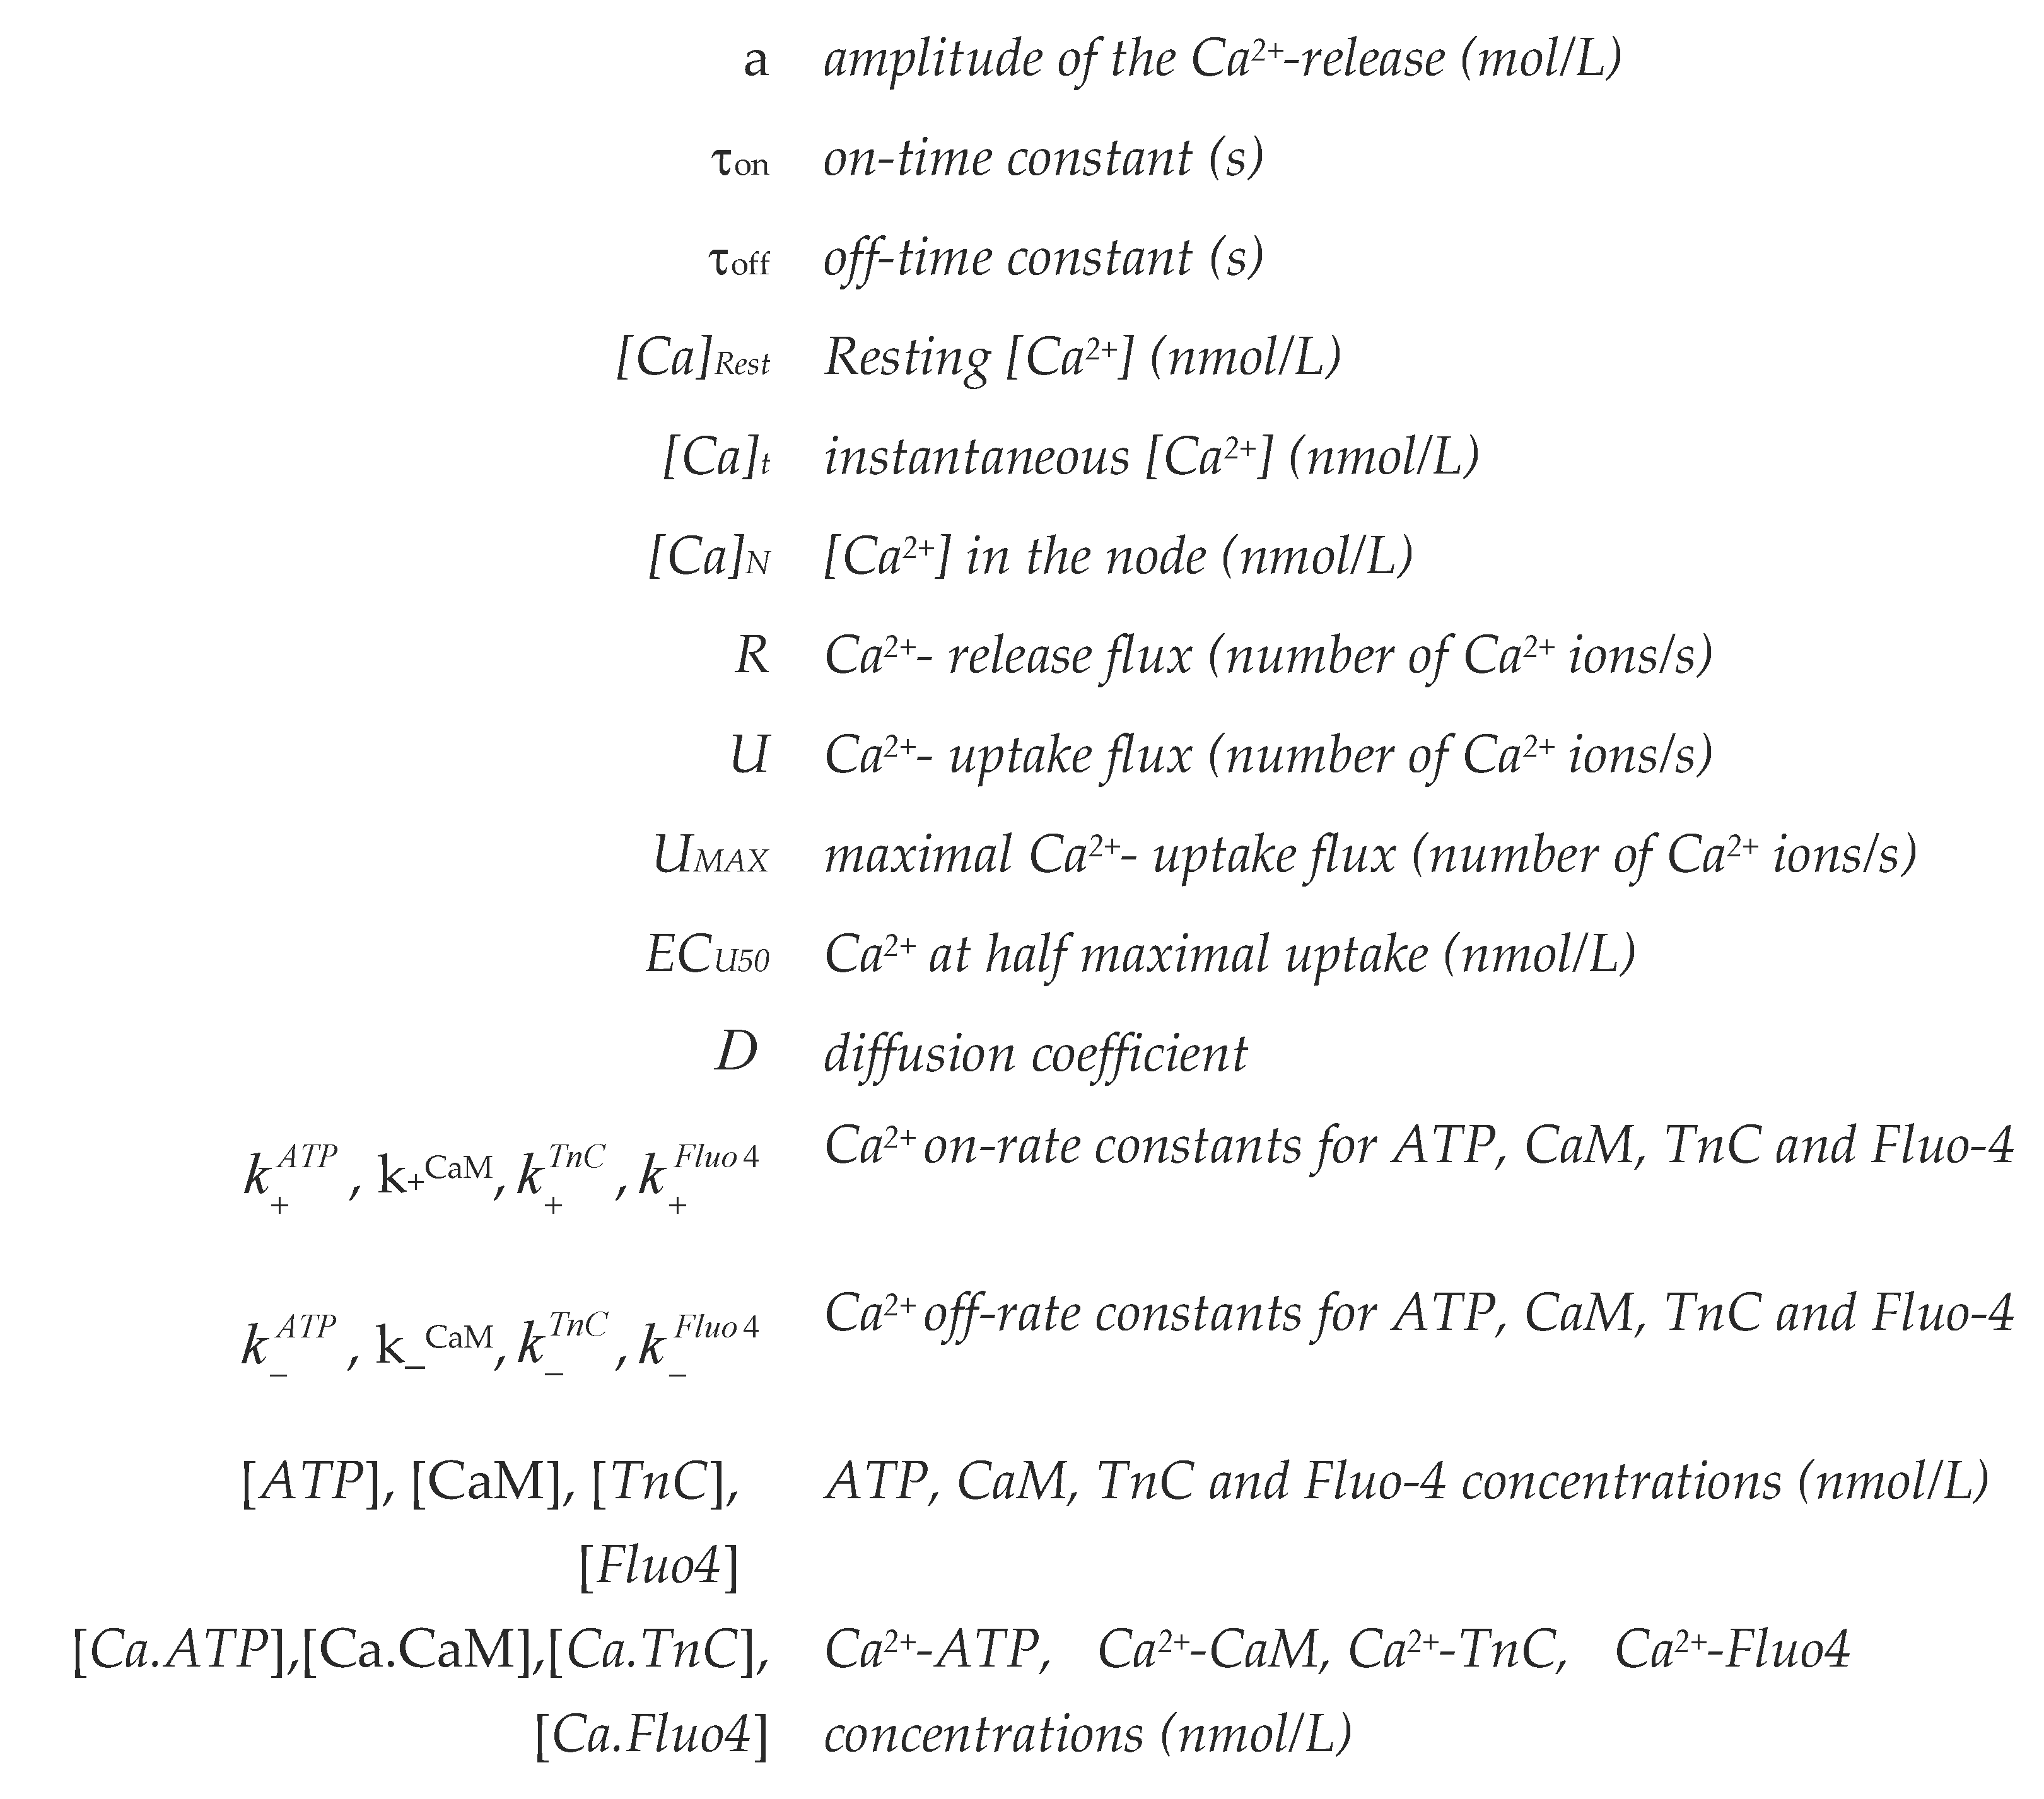
Figure 3.
Ca2+ spark activity of individual Ca2+ release sites in Pcells of canine heart with acute ischemic MI. A: Pcells were isolated from the left ventricle of dog normal hearts and hearts with 48 hours MI (a). The permanent LAD coronary occlusion induced a typical transmural MI within less than two days, with no evident sign yet of scar tissue (see yellow dashed line in a). At this stage, we postulated that the MI zone comprises myocardial cells undergoing typical acute ischemia. Pcells were isolated from endocardial free-running Purkinje strands (see dashed white circle in a and yellow arrows in b); c illustrates the capture of spark activity by 25 µm line scan (5ms/scan) positioned randomly in the cell; for clarity, a scanline is represented on the 2D confocal (spinning disk) image of a representative Fluo-4-loaded Pcell. B: consecutive scans were plotted as shown in a; spark firing rate (b) and density (c) of active Ca2+ release sites were measured as indicated in a; to limit the photobleaching, scanning was interrupted and cell illumination occulted for 5ms every 1.5s (300 scans). Firing rate (b) and number of sites (c) were typically captured by 7.5 sec scanning sequences as indicated in a and were compared between Pcells of normal hearts (Norm: n=28 cells from 5 normal hearts) and Pcells of hearts with MI (MI: n= 24 cells from 4 MI hearts). Data are expressed as mean ± SD; **: significant difference (P<0.01); ns: no difference.
Figure 3.
Ca2+ spark activity of individual Ca2+ release sites in Pcells of canine heart with acute ischemic MI. A: Pcells were isolated from the left ventricle of dog normal hearts and hearts with 48 hours MI (a). The permanent LAD coronary occlusion induced a typical transmural MI within less than two days, with no evident sign yet of scar tissue (see yellow dashed line in a). At this stage, we postulated that the MI zone comprises myocardial cells undergoing typical acute ischemia. Pcells were isolated from endocardial free-running Purkinje strands (see dashed white circle in a and yellow arrows in b); c illustrates the capture of spark activity by 25 µm line scan (5ms/scan) positioned randomly in the cell; for clarity, a scanline is represented on the 2D confocal (spinning disk) image of a representative Fluo-4-loaded Pcell. B: consecutive scans were plotted as shown in a; spark firing rate (b) and density (c) of active Ca2+ release sites were measured as indicated in a; to limit the photobleaching, scanning was interrupted and cell illumination occulted for 5ms every 1.5s (300 scans). Firing rate (b) and number of sites (c) were typically captured by 7.5 sec scanning sequences as indicated in a and were compared between Pcells of normal hearts (Norm: n=28 cells from 5 normal hearts) and Pcells of hearts with MI (MI: n= 24 cells from 4 MI hearts). Data are expressed as mean ± SD; **: significant difference (P<0.01); ns: no difference.
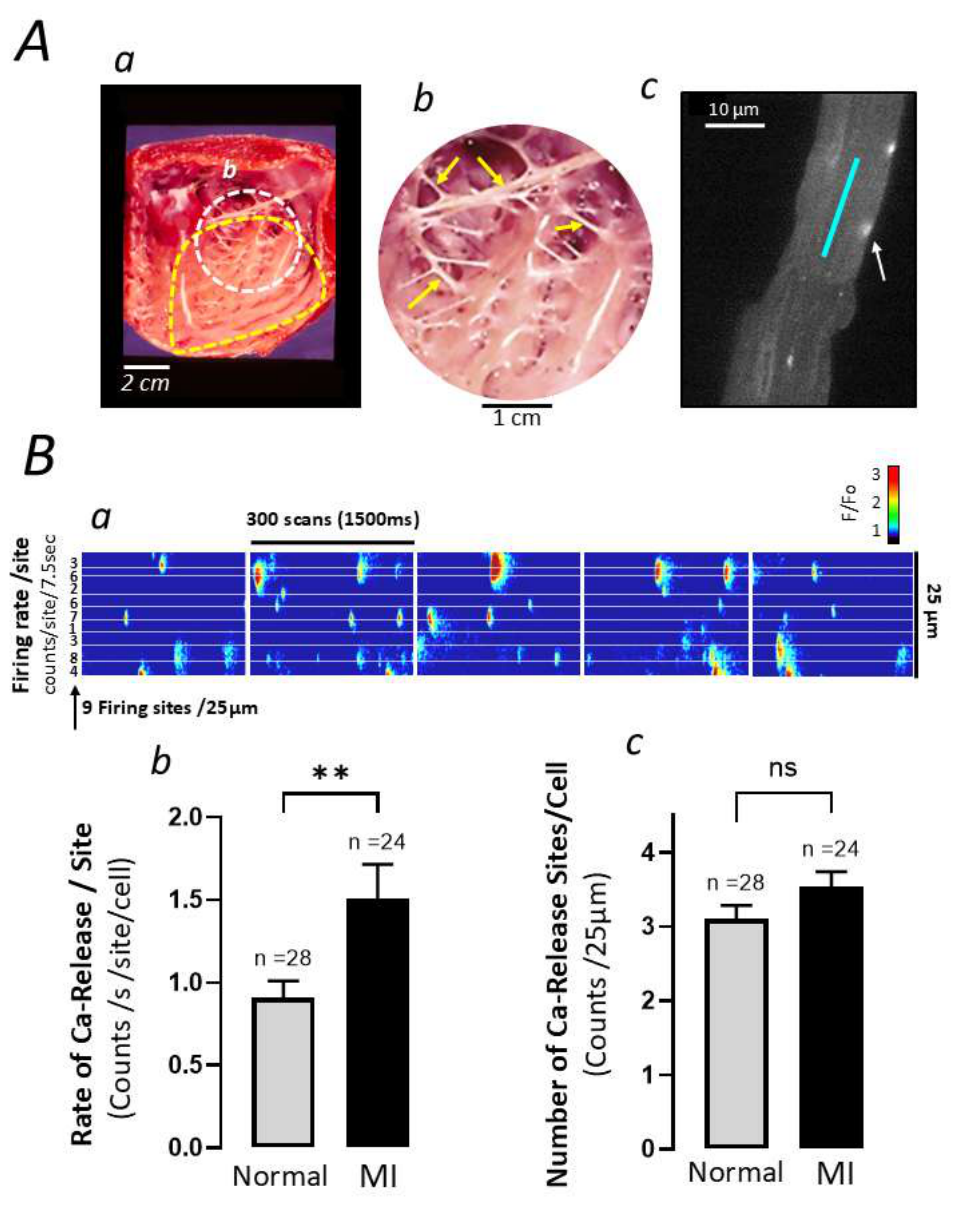
Figure 4.
Comparisons normal vs MI Pcells of peripheral (Wlets) and central (CWWs) Ca2+ removal. A: Typical Wlet transients were captured by 25 µm linescans positioned in the peripheral regions of Pcells as indicated (blue line) in the representative 2D confocal snapshot of panel a; the peripheral regions of the cell are underlined to emphasize the regionalization of Wlet occurrence; the time courses of 10 normal Wlets (from 6 cells) and 16 MI Wlets (from 6 cells) are displayed in panels bandc, respectively; the mean characteristics of the waves are reported in Table 1; after normalization to maximal Ca2+ concentration, the decay phase of each transient was isolated and represented in insets of b and c; The following one-phase exponential decay model was used to fit the data of each transient : [Ca2+]=(Y0 - P)*exp[-(1/t) *t] + P, where Y0 is the [Ca2+] value at t=0, P is the [Ca2+] value at infinite t, and t is the time constant of the decay expressed in ms and reflects the rate of the intracellular Ca2+ decline; the averaged τ (mean±SD) are reported on the graphs for each group. B: Individual CWWs were sampled by LSCM as indicated in the representative typical confocal snapshot of a, and analyzed as reported in Table 1. The time courses of 10 Normal and 12 MI CWWs were represented in b and c, respectively; the Ca2+ decay phases of the waves are displayed in the insets; same exponential model was used to estimate and compare the rates of Ca2+ decline (t) between normal and MI CWWs. C: the time constant t of the Ca2+ decay of Wlets and CWWs were compared between the normal and MI Pcells represented in panels b and c, respectively; **: significant difference (P<0.01; unpaired t-test), ns: no difference. D: Some cells were stained with the SERCA2 antibody used in [23]; as shown in 2D and 3D in a typical MI cell, the fluorescent staining revealed the same peripheral elevation of the Ca2+ pump density under the membrane (see yellow arrows); the cell boundary is underlined in yellow.
Figure 4.
Comparisons normal vs MI Pcells of peripheral (Wlets) and central (CWWs) Ca2+ removal. A: Typical Wlet transients were captured by 25 µm linescans positioned in the peripheral regions of Pcells as indicated (blue line) in the representative 2D confocal snapshot of panel a; the peripheral regions of the cell are underlined to emphasize the regionalization of Wlet occurrence; the time courses of 10 normal Wlets (from 6 cells) and 16 MI Wlets (from 6 cells) are displayed in panels bandc, respectively; the mean characteristics of the waves are reported in Table 1; after normalization to maximal Ca2+ concentration, the decay phase of each transient was isolated and represented in insets of b and c; The following one-phase exponential decay model was used to fit the data of each transient : [Ca2+]=(Y0 - P)*exp[-(1/t) *t] + P, where Y0 is the [Ca2+] value at t=0, P is the [Ca2+] value at infinite t, and t is the time constant of the decay expressed in ms and reflects the rate of the intracellular Ca2+ decline; the averaged τ (mean±SD) are reported on the graphs for each group. B: Individual CWWs were sampled by LSCM as indicated in the representative typical confocal snapshot of a, and analyzed as reported in Table 1. The time courses of 10 Normal and 12 MI CWWs were represented in b and c, respectively; the Ca2+ decay phases of the waves are displayed in the insets; same exponential model was used to estimate and compare the rates of Ca2+ decline (t) between normal and MI CWWs. C: the time constant t of the Ca2+ decay of Wlets and CWWs were compared between the normal and MI Pcells represented in panels b and c, respectively; **: significant difference (P<0.01; unpaired t-test), ns: no difference. D: Some cells were stained with the SERCA2 antibody used in [23]; as shown in 2D and 3D in a typical MI cell, the fluorescent staining revealed the same peripheral elevation of the Ca2+ pump density under the membrane (see yellow arrows); the cell boundary is underlined in yellow.
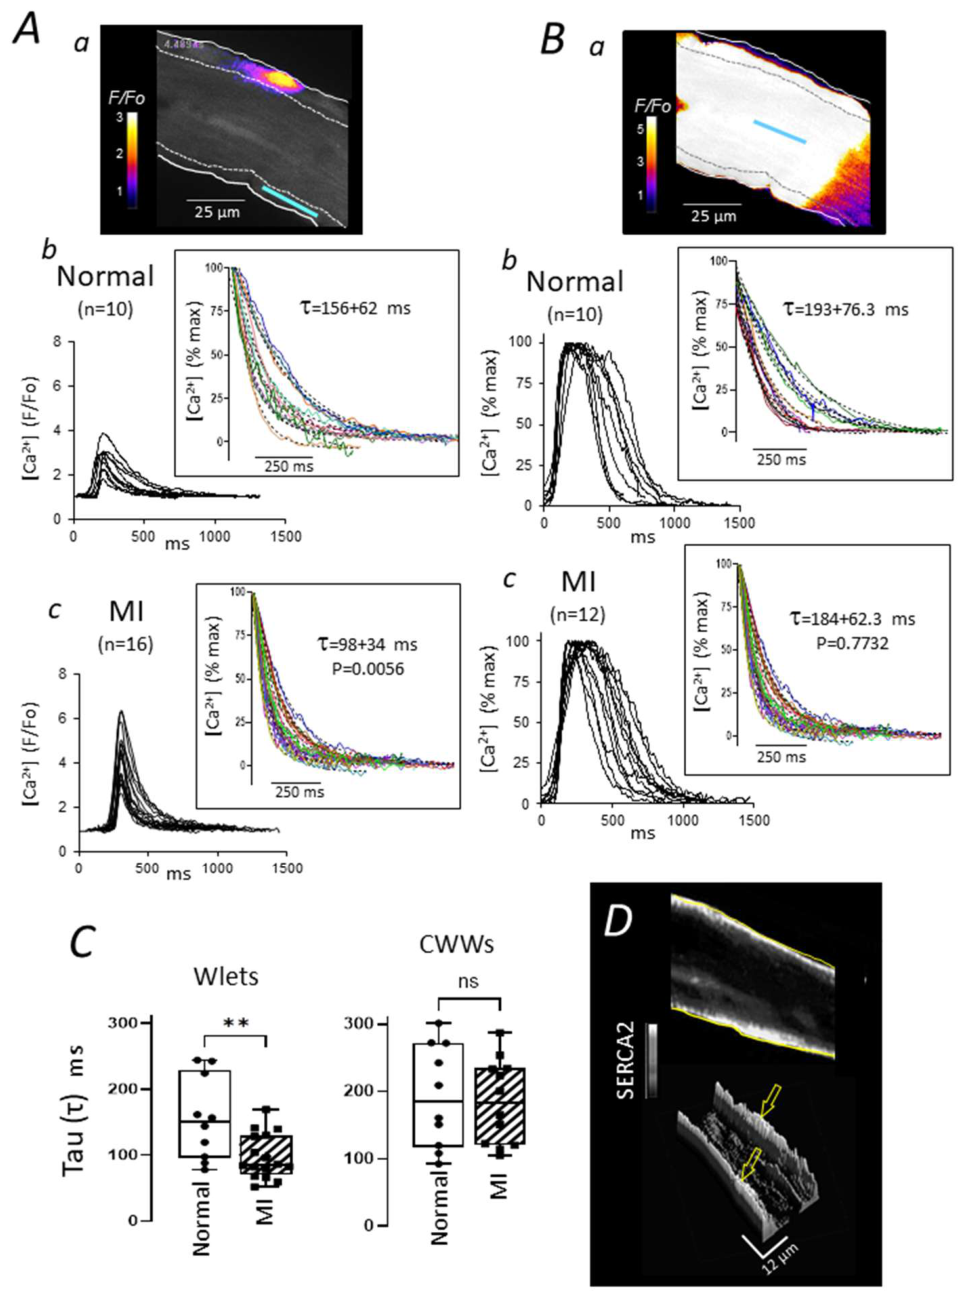
Figure 5.
Computational evidence of SR-Ca2+ uptake contribution to the alterations of peripheral Ca2+ dynamics in Pcells after MI. A: 10 and 17 representative Wlets were combined, respectively, to produce the averaged Ca2+ transients of normal (control) (a) and MI (b) Pcells. The Purkinje-specific model of Ca2+ mobilisation described in FIGURE 2 was used to replicate the normal and MI-averaged transients; predicted (dotted line) and experimental (plain line) curves were superimposed in A.a and A.b, and the accuracy of the predictions was estimated by linear regressions as indicated in the corresponding insets where 1 and 2 point at the rising and decay phases of the transients, respectively. B: the maximal Ca2+ uptake rate (Umax) was incrementally increased (B.a) in the numerical expression of normal Ca2+ transient shown in A.a; the simultaneous effects of Umax increments on Ca2+ release pulse function and overall Ca2+ transient were represented in B.b and B.c, respectively. As indicated in B.c, the complete switch from normal transient (blue trace) to MI transient (red trace) was achieved with ~35% increase of Umax (see B.a). Ca2+ variations are expressed as variations of F/Fo ratio from 1 ( F/Fo); one variation unit is equivalent to 100 nmol.L-1 of free Ca2+ [15].
F/Fo); one variation unit is equivalent to 100 nmol.L-1 of free Ca2+ [15].
Figure 5.
Computational evidence of SR-Ca2+ uptake contribution to the alterations of peripheral Ca2+ dynamics in Pcells after MI. A: 10 and 17 representative Wlets were combined, respectively, to produce the averaged Ca2+ transients of normal (control) (a) and MI (b) Pcells. The Purkinje-specific model of Ca2+ mobilisation described in FIGURE 2 was used to replicate the normal and MI-averaged transients; predicted (dotted line) and experimental (plain line) curves were superimposed in A.a and A.b, and the accuracy of the predictions was estimated by linear regressions as indicated in the corresponding insets where 1 and 2 point at the rising and decay phases of the transients, respectively. B: the maximal Ca2+ uptake rate (Umax) was incrementally increased (B.a) in the numerical expression of normal Ca2+ transient shown in A.a; the simultaneous effects of Umax increments on Ca2+ release pulse function and overall Ca2+ transient were represented in B.b and B.c, respectively. As indicated in B.c, the complete switch from normal transient (blue trace) to MI transient (red trace) was achieved with ~35% increase of Umax (see B.a). Ca2+ variations are expressed as variations of F/Fo ratio from 1 (F/Fo); one variation unit is equivalent to 100 nmol.L-1 of free Ca2+ [15].
F/Fo); one variation unit is equivalent to 100 nmol.L-1 of free Ca2+ [15].
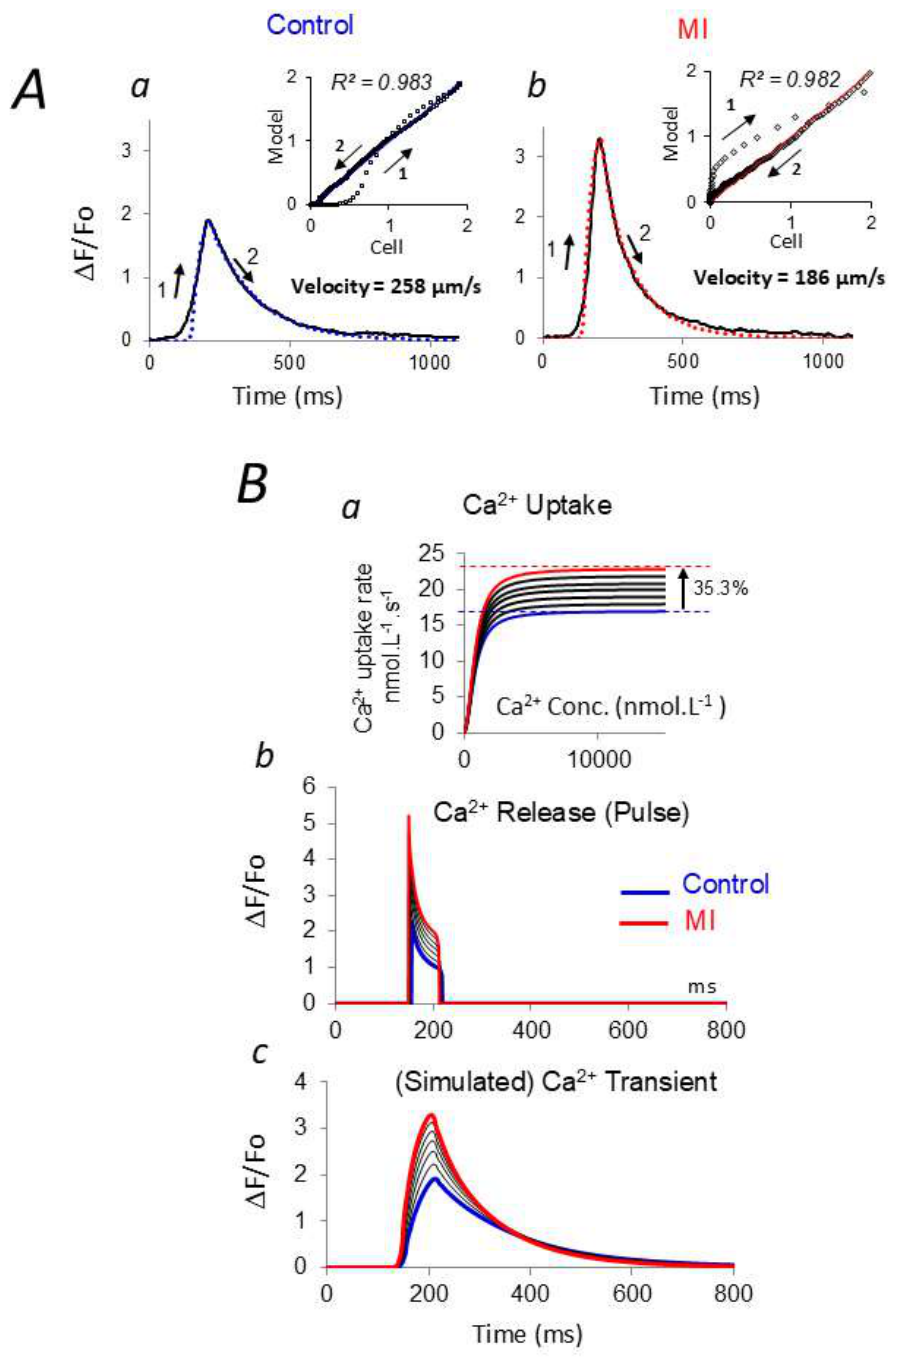

Table 1.
Comparison of Ca2+ waves between normal and post MI Pcells. Samples of Wlet and CWW were captured by LSCM from 15 Pcells isolated from 5 dog normal hearts and 10 Pcells from 5 hearts with 48Hrs coronary ligation. The time course parameters and velocity of Wlets and CWWs were averaged and compared between Normal and MI groups. Each parameter was expressed as the mean ± SD. The differences between MI and Normal conditions were considered significant when P < 0.01 (*) and P < 0.0001 (**). To facilitate the description and interpretation of the results, the significant differences were also expressed as a percentage of the control (normal) values; amp [4] is the mean amplitude of the transient expressed in Fluo-4 fluorescence variation unit DF/Fo; Trise [1] is the time of rising phase at half-maximal amplitude in ms; Tdecay [2] is the time of the exponential decay phase at half-maximal amplitude in ms; Duration (1+2) is the total duration at half-maximal amplitude in ms;.
Table 1.
Comparison of Ca2+ waves between normal and post MI Pcells. Samples of Wlet and CWW were captured by LSCM from 15 Pcells isolated from 5 dog normal hearts and 10 Pcells from 5 hearts with 48Hrs coronary ligation. The time course parameters and velocity of Wlets and CWWs were averaged and compared between Normal and MI groups. Each parameter was expressed as the mean ± SD. The differences between MI and Normal conditions were considered significant when P < 0.01 (*) and P < 0.0001 (**). To facilitate the description and interpretation of the results, the significant differences were also expressed as a percentage of the control (normal) values; amp [4] is the mean amplitude of the transient expressed in Fluo-4 fluorescence variation unit DF/Fo; Trise [1] is the time of rising phase at half-maximal amplitude in ms; Tdecay [2] is the time of the exponential decay phase at half-maximal amplitude in ms; Duration (1+2) is the total duration at half-maximal amplitude in ms;.
|
Amp 4 ΔF/Fo |
Velocity 6 µm/s |
Trise 1 ms |
Duration 1+2 ms |
Tdecay 2 ms |
||
| Wavelets |
Normal (N=5 hearts; 15 cells; n: nb of waves) (mean ± SD) |
1.19 ± 0.98 (n=83) |
237 ± 150 (n=79) |
48 ± 28 (n=83) |
154 ± 72 (n=83) |
106 ± 51 (n=83) |
|
MI (N=5 hearts; 10 cells; n: nb of waves) (mean ± SD) |
1.80 ± 1.14 ** (n=126) |
186 ± 90 * (n=124) |
38 ± 19 * (n=126) |
118 ± 49 ** (n=126) |
80 ± 36 ** (n=126) |
|
|
P (%Normal) |
<0.0001 (53%) |
0.007 (-22%) |
0.003 (-21%) |
<0.0001 (-23%) |
<0.0001 (-25%) |
|
| CWWs |
Normal (N=5 hearts; 15 cells; n: nb of waves) (mean ± SD) |
5.26 ± 2.49 (n=14) |
102.9 ± 50.7 (n=12) |
127.5 ± 82.4 (n=14) |
409.5 ± 167.0 (n=14) |
282.0 ± 144.8 (n=14) |
|
MI (N=5 hearts; 10 cells; n: nb of waves) (mean ± SD) |
4.197 ± 2.234 ns (n=30) |
135.4 ± 86.28 ns (n=28) |
103.3 ± 53.13 ns (n=30) |
317.1 ± 114.8 ns (n=30) |
213.8 ± 76.17 ns (n=30) |
|
| P | 0.931 | 0.993 | 0.998 | 0.406 | 0.739 |
Disclaimer/Publisher’s Note: The statements, opinions and data contained in all publications are solely those of the individual author(s) and contributor(s) and not of MDPI and/or the editor(s). MDPI and/or the editor(s) disclaim responsibility for any injury to people or property resulting from any ideas, methods, instructions or products referred to in the content. |
© 2026 by the authors. Licensee MDPI, Basel, Switzerland. This article is an open access article distributed under the terms and conditions of the Creative Commons Attribution (CC BY) license.
Copyright: This open access article is published under a Creative Commons CC BY 4.0 license, which permit the free download, distribution, and reuse, provided that the author and preprint are cited in any reuse.


