

Submitted:
24 June 2026
Posted:
25 June 2026
You are already at the latest version
Abstract
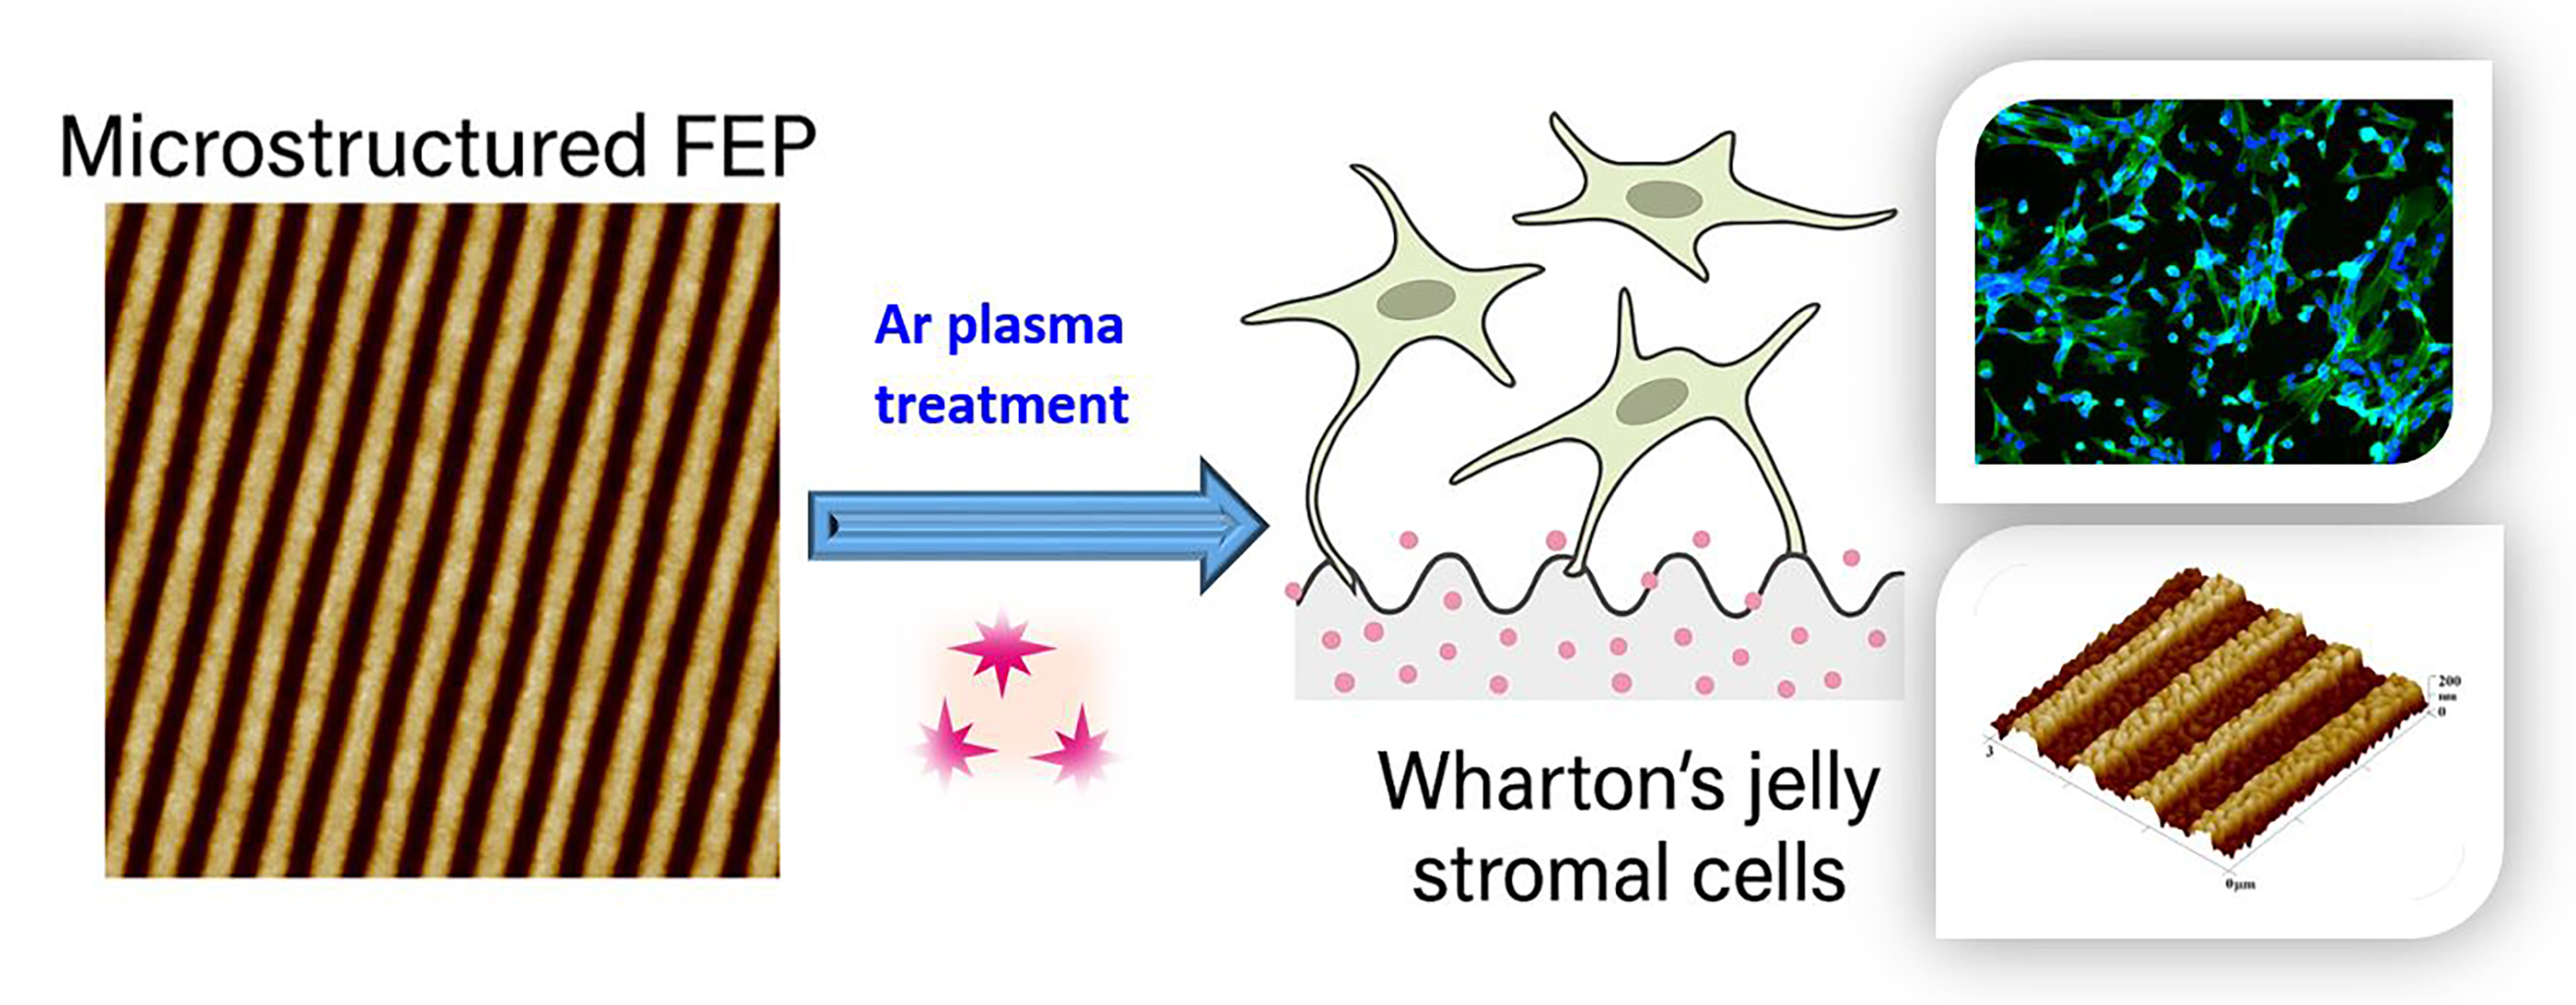
This study aims to construct patterns with defined shapes on perfluoro ethylene propylene (FEP) via a replication process that has potential applications in tissue engineering. Our focus was on creating ripple periodic submicron-scale structures and subsequently activating them with argon plasma. Plasma activation of the replicated pattern on FEP substrates proved to be an effective, easy-to-execute and cost-efficient treatment method. Structured and activated carriers were prepared to study targeted cell growth in terms of cell adhesion and proliferation. Furthermore, the carriers were used to influence cell shape and the direction of the cell growth based on the properties of the pattern, primarily its morphology and dimensions. The carriers were seeded with human Wharton´s jelly stromal cells and their metabolic activity and morphology were studied using a resazurin assay and fluorescence staining of the actin cytoskeleton and cell nuclei. We found that plasma treatment improves cell colonization of the material more effectively than patterning the material with submicron-scale grooves (approximately 500 nm wide). However, this patterning enhances the susceptibility of the material to plasma modification, as evidenced by the subsequent improvement in the cell colonization.
Keywords:
replication
; microstructure
; nanostructure
; polymer
; plasma activation
; surface morphology
; FEP
; cytocompatibility
; mesenchymal stem cells
1. Introduction
The area of nanostructured polymer film surfaces has significantly increased in importance during the last decades. The fabrication of nano-engineered surfaces with the aim of obtaining micro and nano-patterns [1] has been accomplished by several advanced techniques. Strategies for pattern construction can be generally divided into bottom-up and top-down approaches [2]. The first approach is based on the fact that structure formation is achieved by using small building blocks with a self-assembling effect. Typical examples of these materials include amphiphilic lipids, surfactants, block-copolymers, or colloidal particles. The second approach, called the bottom-up approach, is based on the idea that originally homogenous materials are shaped by means of techniques like lithography or sputtering [3]. The most frequently used approaches may also be divided as follows: techniques, such as moulding (hot embossing) (i), techniques based on nano/microimprinting or techniques based on laser ablation (ii), construction of nanopatterns with soft lithography (iii) and last but not least, (iv) simple laser scanning mostly used for periodic pattern construction in case of polymer surfaces, where the pattern, such as ripples or wrinkles, can be constructed due to surface instability and absorption of energy. Surface instabilities during pattern formation may lead to a pattern that is not strictly periodic and is described as wrinkles, or a wrinkle-like pattern, which can be prepared either by means of polymer casting, imprinting, or dewetting, or also in combination with other techniques, such as plasma exposure and consecutive heating.
Some of the approaches for the construction of surface-patterned polymers have been intensively studied over the past decade. The recent interest is based mostly on the possibility of preparing complex patterns as a result of self-organizing processes that are rather difficult in comparison with their fabrication by using traditional patterning techniques. As one of the most promising techniques to prepare patterned surfaces/interfaces by means of surface instabilities is the formation of wrinkle-like patterns [4,5,6]. The fabrication approaches that may be realized with the aim to induce wrinkle formation and the possibilities to precisely control surface roughness, morphology, alteration of period of the wrinkles and their height, as well as their functionality and their final morphology are intensively studied [2,6].
Surface instabilities in polymer films occur mostly when active interaction between the polymer interfaces is present. Instability can also be introduced in the “stable system” by application of external forces. It has been shown previously that the surface instability is generated as a consequence of the competition between destabilizing and stabilizing forces [7]. The present forces may be described as Van der Waals forces, steric interactions or electrostatic interactions; if external forces are applied on the system, surface tension or elastic strain are present [7]. The presence of such forces result basically into two different situations: (i) appearance of an unstable films as a consequence of the inherent dynamics, which may lead e.g. to dewetting [8,9], (ii) appearance of metastable films which become unstable under an external stimulus, e.g. temperature [10,11,12]. Instability for the latter one may be, for instance, thermal gradient, mechanical forces or external electrical field; typically, this type of instability (most frequently based on external heat stimulus) may lead to the formation of a wrinkle pattern. The surface instability results in an evolution of the film structure considering a “more optimal” situation in terms of surface energy. Therefore, an appropriate understanding and control of the parameters influencing the surface pattern on the basis of surface instability is a very simple, but interesting alternative for the construction of innovative new patterns on solid-state substrates with precise control of surface morphology [12].
As was stated above, several types of surface instabilities may be employed to create surface morphologies with variable dimensions or shapes. Dewetting, which may be described as the rupture of the film, forming random morphologies, is guided by the free energy of the system [8,13]. By this process, surfaces with random distribution of holes, multilayer structures or polygons were observed and the process may also be used for patterning polymeric materials using heterogeneous substrates [14]. Typically, this process can produce a large variety of surface patterns, for instance, 2D ordered arrays of polymer ring structures [15]. Considering other methods the most used are phase separation of polymer blends and block copolymers [16,17], template guided structuration [18], electrohydrodynamic patterning [19] or thermal-gradient induced surface patterning, where an externally imposed temperature gradient causes a surface rippling with a characteristic wavelength that finally leads to the film modification into different morphologies [20], temperature gradient driven instability produces replication patterns [21]. Surface wrinkles, creases or even folding are common instability phenomena found in polymer films [22,23]. This phenomenon is based either on mechanical stress (e.g. osmotic pressure, stretching) or on heating, where a rigid layer is deposited on top of a polymer film. If the applied stress is removed, it allows the film to relax and thus a wavy structure generally known as “wrinkles” is constructed. The use of these materials as templates for flexible electronics, in combination with detailed control of substrate wettability and/or adhesion of cells regarding is intensively studied. Such interfaces have already been employed in electronics, tissue engineering and cell growth control, and may serve as a basis for the construction of polymer-based substrates for the detection of chemicals or elements [24,25,26,27,28].
In this study, we applied patterning with wavy, wrinkle-like structures to perfluoroethylene propylene (FEP), a polymer similar to polytetrafluoroethylene (PTFE, Teflon®), but which can be more easily processed, welded and molded into complex shapes. Due to its excellent mechanical, thermal, optical, electrical, and chemical properties, FEP shows promise in a wide range of industrial and biomedical applications, including cell therapy and tissue engineering [29,30,31]. In this study, we explored this potential application with mesenchymal stem cells derived from Wharton’s jelly of the human umbilical cord.
2. Materials and Methods
2.1. Materials
Polymer polydimethylsiloxane (PDMS) in the form of elastomer kit Sylgard 184® with the base/curing agent ratio 10:1 was purchased from Sigma Aldrich (Merck, USA) and was used for the experiments. The commercially available compact disc-recordable (CD-R) (Verbatim, 700 MB) and digital versatile disc-recordable (DVD-R) (EMTEC, 4.7 GB) were purchased from the market. As primary substrate for hot embossing, we used perfluorethylenepropylene (FEP) polymer (the density of 2.15 g .cm−3, 50 μm thick foils) supplied by Goodfellow Ltd., Great Britain.
2.2. Plasma Treatment
Plasma treatment was performed by a diode Ar plasma discharge with the Balzers SCD 050 device. The gas purity used was 99.997% with the gas pressure of 10 Pa. Subsequent parameters of plasma discharge were: plasma power of 3 or 8 W, electrode distance set up to 60 mm. The surface activation with plasma was accomplished at room temperature (RT) in an interval of exposure times ranging from 0 to 240 s.
2.3. Replication
The patterned polycarbonate (PC) parts of commercially available DVD-R optical discs were used as initial masters. Small circles (50 mm in diameter) were cut out of the DVD-R, and the PC layers were separated. The DVD-R disc consists of two PC surfaces with a reflective layer and a dye layer in between them. The two PC layers can be manually separated along the cut edge by tweezers. The grooved PC layer was then immersed in methanol and sonicated for 30 min to remove excess reflective layer, dyes, and any dust particles. After repeated rinsing with distilled water and methanol, the DVD-R master mold was obtained.
2.3.1. Fabrication of PDMS Molds
PDMS was used to replicate the surface structure of DVD discs by the soft lithography (cast-molding) technique. The mixture of PDMS base and curing agent was thoroughly manually mixed in a weight ratio of 10:1 and then poured over PC master molds placed in Petri dishes. After subsequent degassing in a vacuum chamber for 1 h, the Petri dishes were thermally annealed in an oven heated at 80 °C for 2 h to complete cross-linking of the polymer. Once the thermoset was cured, the flexible negative mold was carefully peeled off of the PC master.
2.3.2. Hot Embossing
The preformed FEP film was placed on the PDMS mold and covered by an additional layer of Teflon foil. The mold was then placed in a specially crafted Dural clamp, compressed under high pressure, and the whole system was put in a Binder oven at 300 °C and thermally annealed for 30 minutes. Teflon foil was added as a protective layer, since it is able to withstand high temperatures and prevents sticking of the melted polymer to the metal clamp. After cooling in the air at the room temperature (25 °C), the clamp pressure was eased and the FEP film was manually peeled off the flexible mold. Temperatures are mentioned as intervals since the degree of crystallinity of this semi-crystalline thermoplastic determines its thermal properties.
2.4. Analytical Methods
2.4.1. Atomic Force Microscopy
Surface morphology and roughness of the pristine and treated films were examined by atomic force microscopy (AFM) using Dimension ICON (Bruker Corp., Billerica, MA, USA). The samples were analyzed in Scan-Assyst® mode using nitride lever SCANASYST-AIR with Si tip (spring constant of 0.4 N·m-1). NanoScope Analysis software was applied for data processing. Surface roughness (Ra) represents the arithmetic mean of the absolute values of the height deviations measured from the central plane.
2.4.2. Scanning Electron Microscopy and EDS Analysis
The morphology of the sample surfaces was also characterized using a FIB-SEM LYRA3 GMU scanning electron microscope (Tescan, Brno, Czech Republic). The acceleration voltage was set to 10 kV. The elemental composition was measured by energy-dispersive X-ray spectroscopy (EDS, analyzer X-ManN, 20 mm2 SDD detector, Oxford Instruments, United Kingdom), while the accelerating voltage for SEM-EDS analysis was set to 10 kV.
2.4.3. X-Ray Photoelectron Spectrometry
The elemental composition on the material surface was analyzed by X-ray photoelectron spectroscopy (XPS) using a spectrometer ESCAProbeP (Omicron Nanotechnology Ltd., Taunusstein, Germany). As a source, a monochromatic X-ray at an energy of 1486.7 eV was used. Atomic concentrations of the elements were determined from the individual peak areas using CasaXPS software.
2.4.4. Wettability
The wettability of the studied samples was determined by measurement of contact angles (CA, θ) using an Advex Instruments goniometer (Brno, Czech Republic) connected to the SEE System 7.1 program. Analysis of CA was performed at room temperature with 8 µL drops of distilled water (dyed with methyl violet) using a Transferpette® automatic pipette (Brand, Wertheim, Germany) at 6 different positions of 3 samples in parallel and perpendicular directions. Subsequently, the drops were photographed and evaluated by 3 marked points.
2.4.5. Zeta-Potential
Electrokinetic analysis, more specifically, zeta potential determination of the tested films, was conducted using the SurPASS Instrument (Anton Paar GmbH; Austria) by two methods (streaming current and streaming potential) and calculated using the Helmholtz–Smoluchowski [HS] equation. The samples were studied inside an adjustable gap cell with 0.001 mol.dm-3 KCl as an electrolyte at a constant pH of 6.7 at room temperature.
2.5. Cytocompatibility Evaluation
2.5.1. Cell Model and Culture Conditions
To evaluate material cytocompatibility, human Wharton’s jelly-derived mesenchymal stromal cells (hWJSCs), which were prepared according to our previously established protocols [32] and stored in liquid nitrogen, were used. Cryopreserved cells at passage 3 were thawed and seeded into a complete culture medium (CCM) consisting of alpha-minimal essential medium (αMEM; MEMA-RXA, Capricorn Scientific, Ebsdorfergrund, Germany, Cat. No. MEMA-RXA) + 5% pooled human platelet lysate (PL; Bioinova, Ltd., Prague, Czech Republic) + 10 μg/mL gentamicin (Sandoz, Holzkirchen, Germany) in a 75 cm2 culture flask (TPP Techno Plastic Products AG, Trasadingen, Switzerland) 3-5 days before the actual experiment at a density of 5 - 6 thousand cells per cm2. After reaching 80-90% confluence, cells were harvested using trypsin-ethylenediaminetetraacetic acid (trypsin-EDTA, Sigma-Aldrich, Merck, Darmstadt, Germany, Cat. No. T4174), counted and used for seeding onto FEP discs.
Human umbilical cords used for hWJSC derivation were obtained from the University Hospital in Pilsen (Czech Republic) from healthy newborns following spontaneous delivery. All umbilical cords were donated anonymously for research purposes with the written informed consent of the donors (mothers of newborns). The informed consents are stored at the University Hospital in Pilsen. All experiments involving human tissues or cells were approved by the Ethics Committee of the Institute of Physiology of the Czech Academy of Sciences in Prague on August 18, 2014, in accordance with the Public Health Act, as amended, No. 20/1996, § 26.
2.5.2. Cell Seeding
Before seeding, 2 cm diameter FEP discs were sterilized on both sides with 20 min of ultraviolet (UV) radiation (254 nm), transferred to a 12-well plate (TPP Techno Plastic Products AG, Trasadingen, Switzerland), and weighted down with glass rings of a diameter of 1.8 cm (Detesk Ltd., Železný Brod, Czech Republic) to anchor them to the bottom of the plastic wells. The tested discs consisted of 4 groups, namely i/ pristine unmodified FEP (pristine FEP), ii/ pristine FEP modified with plasma (FEP 8 W 240 s), iii/ FEP replicated with DVD pattern (FEP DVD) and iv/ FEP modified by both DVD replication and plasma exposure (FEP DVD 8 W 240 s). Each disc was seeded with 15,000 hWJSCs. Tissue culture plastic (polystyrene) was used as a control, seeded with the same number of hWJSCs and cultured under the same conditions as the tested groups. The cells were cultured at 37 °C in a humidified air atmosphere containing 5% CO2 with regular media changes twice a week. Samples were tested in duplicates.
2.5.3. Metabolic Activity of Cells
Metabolic activity and proliferation of hWJSCs adhered and grown on the tested material were assessed by a resazurin metabolic assay on days 1 and 3 of culture, as presented in our previous article [31]. Briefly, the samples were transferred to a new 12-well plate containing 2 mL of fresh CCM with 40 μM resazurin (Cat. No. R7017, Sigma-Aldrich, St. Louis, MO, USA) in each well and incubated at 37 °C in a humidified air atmosphere with 5% CO2 for 3.5 and 2 hours for the first and third day of measurement, respectively. Then, 150 μL of the solution was transferred to a 96-well plate, and the fluorescence (Ex/Em = 530/590) was measured on a SynergyTM HT Multi-Mode Microplate reader (BioTek, Santa Clara, CA, USA). The measured values were corrected for the background control (CCM with resazurin). Each experiment was performed in duplicate.
2.5.4. Fluorescent Labelling of Cells
To visualize hWJSCs on FEP discs, actin filaments (F-actin) in cells were stained with a phalloidin peptide conjugated to a fluorescent dye (Phalloidin-Atto 488; Cat. No. 49409, Sigma-Aldrich) on days 1 and 3 of culture according to a previously published protocol [33]. The cell nuclei were counterstained with bisBenzimide H33258 (Cat. No. 94403; Sigma-Aldrich). Images were acquired on the Mateo FL Microscope (Leica Microsystems, Wetzlar, Germany).
2.5.5. Statistical Analysis
Statistical analysis of the quantitative cell-related data was performed using GraphPad Prism version 10.4.1 (GraphPad Software, San Diego, CA, USA). Data are expressed as mean ± SD. One-way ANOVA followed by the Student–Newman–Keuls post hoc test was used. A p-value ≤ 0.05 was considered statistically significant.
3. Results and Discussion
3.1. Atomic Force Microscopy
One of the key phenomena influencing the cytocompatibility of a material and the growth of cells with partial or full alignment ability is the surface morphology [34,35,36,37]. Therefore, we focused on the construction of a submicron-grooved pattern from inert polymer perfluorethylene propylene (FEP). This polymer usually exhibits low cytocompatibility in its pristine state [38,39], but the additive plasma or laser treatment could substantially enhance its cytocompatibility. Based on our previous experiments involving the plasma treatment of either perfluorinated substrates [39] or polyolefins, the maximum applicable plasma power is 8 W. This combination was also used as the maximum activation power in our study, since higher plasma exposure power led to pronounced surface ablation of the polymeric material. Plasma-treated FEP samples have been described in detail in our previous studies [38,39]; therefore, these results will not be introduced explicitly in this paper.
The surface morphology of plasma-treated material is visible in Figure 1. Our first goal was to confirm the success of the replication process into FEP foil and the maintenance of a regular linear pattern, which would have the potential for cell guidance. This was fully confirmed, as it is visible from the 1st line of Figure 1. It is evident that the linear pattern was transferred into the FEP polymer successfully. A detailed image also confirmed the quality of the replication process, with a globular surface in detail, which will be discussed in the next paragraph. The plasma treatment with only 3 W could have a significant impact on the surface chemistry, but should not have a significant impact on the surface morphology. In our previous papers [38,39], we focused on studying the influence of FEP plasma treatment on the changes of surface morphology, chemistry and cytocompatibility. We also applied an additive honeycomb layer to increase FEP cytocompatibility [40,41]. According to the results of these papers, the short treatment with lower plasma power did not significantly affect the surface. Detailed surface morphology also confirms maintenance of ripple pattern with insignificant structural changes; only minor changes in effective surface roughness were observed when a detailed scan was performed.
We have further investigated the influence of plasma treatment on a regular FEP pattern prepared by the replication process. For clarity, we present only the results of higher-power plasma, i.e. 8 W. Figure 2 shows the surface morphology of such activated patterns for plasma exposure times of 120 and 240 seconds. Plasma treatment induced significant chemical changes to the FEP surface, which will be discussed in a later chapter. However, the primary morphological pattern remained periodic and linear with no disruption.
Examining the plasma-treated FEP with higher plasma power and higher exposure time (2nd line of Figure 2) in more detail reveals that the plasma activation significantly alters the detailed surface morphology. The wrinkle-like structure is superposed on the linear periodic surface submicron-scale pattern of the replicated FEP. In combination with significant chemistry changes, these are both significant factors for cell adhesion and growth, which will be discussed in the last chapter of this paper. Comparing the effective surface area of 3 x 3 m2 scans, we observe a notable increase from 9.5 m2 to 10.6 m2 for the combination of 8 W plasma and 120 s exposure time, and up to 12.1 m2 for 240 s exposure time. This corresponds to an increase in the effective surface area by more than 30%. The increase of effective surface area is accompanied by an increase in surface roughness, from approximately 25 to values over 30 nm.
The changes in surface morphology induced by plasma treatment are demonstrated in detail in Figure 3. As it is obvious, even though the linear structure is maintained after plasma treatment, a significant change is induced by this treatment. Higher plasma power and exposure time may result in a slight decrease in amplitude, as seen in the detailed images. Generally, these changes are induced by the ablation of the FEP polymer, as confirmed in our previous studies [38,39] and have a positive influence on filopodia attachment [42]. The cytocompatibility results will be presented further in this paper.
3.2. Scanning Electron Microscopy and Energy Dispersive Analysis
The surface morphology was also studied by scanning electron microscopy (SEM). Using the SEM technique, we also confirmed very easily the uniformity and possibility of large-scale replication. The surface morphology of plasma-treated FEP samples is shown in Figure 4 for samples treated with 3 W and exposure times of 40 and 120 s. The linear pattern is maintained, and the results confirm the uniformity of the pattern.
The surface morphology of plasma-treated samples is shown in Figure 5. The samples treated with plasma power of 8 W and exposure times of 40 s, 120 s and 240 s are introduced, and the different scanning areas are presented. The SEM scans confirmed the changes in surface morphology in detail, including the appearance of worm-like structures due to plasma exposure, especially for longer exposure times, while the periodic pattern was maintained. The results are in good accordance with the AFM results. As is obvious, with large exposure times, the surface ablation induced a more pronounced superposed worm-like structure. This formation is connected to a different ablation ratio of the amorphous and crystalline phases, as described in detail in our earlier study [38].
The same setup was also used for energy-dispersive analysis (EDS), which provides elemental analysis information. The aim was to study the differences in physicochemical properties, specifically the surface chemistry induced by plasma activation. Our primary focus was on comparing low and high plasma power (3 W vs. 8 W), followed by comparing different exposure times.
The comparison of different exposure times (from 20 to 240 s) with the aim of studying the change in oxygen concentration is shown in Figure 6. These EDS spectra clearly demonstrate that the plasma activation led to the incorporation of oxygen-containing groups onto plasma activated FEP; this effect has been described previously [38,39].
A very surprising results was revealed, especially for higher exposure times. We expected a continual increase in oxygen surface concentration; however, only a slight increase in oxygen concentration was detected, and in some cases, even a decrease was detected (3 W and 20 s vs. 40 s). This surprising fact can be explained by two key factors. The first factor is based on the principle of the argon plasma treatment, which only affects the very surface of the exposed polymer. Due to this fact the EDS technique, which allows us to acquire information from a significantly greater depth (up to hundreds on nanometers), detects the surface oxygen. However, compared to the remaining bulk material, which is unaffected by the Ar plasma, the percentage is small.
The second factor is based on the plasma exposure time. As the plasma not only activates the surface but also induces material removal due to the ablation, a decrease in oxygen concentration may occur when a higher exposure is applied. The exposure with plasma power of 8 W for different exposure times from 20 s to 240 s is introduced in Figure 7. It is obvious that the increase of exposure time is related to the increase of oxygen concentration; however, for maximum exposure time, there is not any significant change compared to 120 s. Also, when we compare different plasma powers, an increase in oxygen concentration is apparent, but it is not significant. Therefore we continued with a more specific type of surface elemental analysis, i.e. X-ray photoelectron spectroscopy (XPS), which provides information relevant to surface physicochemical changes from the very top of the surface.
3.3. X-Ray Photoelectron Spectroscopy
As suggested in the previous paragraph, the changes to the ripple replicated FEP pattern were predominantly induced on the top surface layer. Therefore, we analyzed the treated surfaces using XPS, a technique that allows us to obtain information from approximately the top ten atomic layers. The results of the oxygen and fluorine concentration analysis are presented in Figure 8.
As expected, the pristine FEP substrate, which was analyzed for comparison, did not exhibit any oxygen on the surface. A similar result could also be expected for pristine FEP, which was structured by the replication process (FEP DVD). However, as can be seen in Figure 8, after the replication process, the amount of oxygen is slightly increased up to 2.2 at. %. Since only a very thin surface layer was affected, the EDS did not reveal any significant amount for this sample; however, XPS did detect a change. Plasma treatment had a substantial effect on the grooved FEP substrate; even the shortest exposure time of 20 s significantly increased the atomic concentration up to 12 at. %. Not all of the studied samples are presented here, as we wanted to demonstrate the major differences between pristine FEP and the selected types of modification. Further increasing the plasma exposure time had no significant influence on the oxygen concentration; for 240 s and 8 W, we detected 13 at. % of oxygen. However, the morphology of the samples changed substantially, as shown in the chapter related to AFM analysis [43,44].
We have also measure d the wettability of the modified and replicated patterns. The value of contact angle of pristine FEP is 106°, it is a hydrofobic polymer, the value was determined also for the replicated pristine FEP with the pattern, we can conclude that the patterning of the linear structure did not led to any decrease of contact angle. The plasma treatment surprisingly did not affect the surface wettability of FEP as much as was determined in the previous cases for pristine FEP withour pattern [38,39], even a significant decrease was observed. The plasma treatment with 8 W and 20 s induced the dcrease of contact angle to 88° ± 3.4°. Further increase of plasma exposure time under same plasma power led to decrease of contact angle to 85° ± 2.9° for exposure time 40 s, 83.2° ± 4.0° for exposure time 80 s, 81.4° ± 4.2° for exposure time 120 s and 80.8° ± 7.4° for exposure time 240 s. It is evident, that further increase of exposure time led to a slight decrease in contact angle, the replicated pattern probably stabilized the surface contact angle.
3.4. Zeta-Potential
One of the key elements related to changes in surface chemistry is zeta-potential determination. Therefore, we analyzed the pristine and plasma-treated samples to determine their zeta-potential, as this is an important factor influencing cytocompatibility [45].
As shown in Figure 9, the synergistic effect of surface chemistry and morphology changes dramatically modified the zeta potential. Plasma exposure dramatically increased the zeta potential of both pristine and nanostructured FEP compared to pristine FEP and pristine FEP with a replicated submicron-scale pattern, making the surfaces more hydrophilic, which is consistent with the contact angle measurements mentioned above, and also an increased oxygen content revealed by XPS. There is minimal difference between replicated FEP subsequently treated with plasma and plasma-treated FEP with no replicated submicron-scale pattern, suggesting that the plasma exposure is homogeneous and affects the whole area of the pattern similarly. These findings further suggest that the surface morphology itself does not affect the zeta-potential.
3.5. Cytocompatibility
The interaction between polymer matrices and human cells determines the cytocompatibility of the material. For these tests, we have chosen the samples treated with 8 W plasma for 240 s on the basis of our previously acquired data regarding plasma modification of FEP and their interaction with cells [39]. Mesenchymal stromal cells (MSCs) derived from Wharton’s jelly of the human umbilical cord were selected as a model for evaluating the cytocompatibility of the investigated polymer matrices. In our previous study, we confirmed that hWJSCs have a high proliferative capacity, which they maintain into higher passages, and the average population doubling time is shorter than 24 hours [32]. Moreover, these cells are derived from the umbilical cord, which is usually discarded as waste material after delivery, and their collection is not burdened by ethical issues [46. Once frozen, these cells serve as a readily available source of MSCs. Interestingly, WJSCs are considered less mature than adult-derived MSCs, i.e., standing on the border between multipotency and pluripotency, expressing some pluripotency markers and having the potential to differentiate into various cell types [47]. Similarly, due to its favorable mechanical properties, thermal stability, chemical inertness, transparency and gas (oxygen) permeability, FEP is promising for a wide range of biomedical applications, including modern approaches to cell cultivation for diagnosis and cell therapy [29,30,48], microfluidics and organ-on-chip strategies [49], advanced microscopy and label-free imaging techniques [50], and stent coating [51]. Therefore, the combination of WJSCs and FEP shows great promise for versatile applications in tissue engineering.
However, in its pristine unmodified state, FEP is hydrophobic and rather bioinert, i.e. not promoting the adsorption of cell adhesion-mediating proteins (e.g., vitronectin and fibronectin) from cell culture media, at least in a geometrical conformation suitable for binding the cell adhesion receptors, and the subsequent cell adhesion and growth [30,52], for a review see [53]. Therefore, we attempted to increase its bioactivity through morphological and physicochemical surface modifications, such as surface patterning via DVD replication and/or plasma treatment. Our earlier studies [38,39,41], and studies by other authors [30,52] have proven that these types of surface modification, namely the creation of a honeycomb-like pattern on FEP and/or plasma modification of this polymer, are an efficient tool for enhancing the adhesion, growth and differentiation of various cell types, such as vascular endothelial cells [52], epidermal keratinocytes [39], adipose-derived mesenchymal stem cells, dermal fibroblasts [38], lung fibroblasts and osteoblast-like cells [41].
However, as evident from the plot in Figure 10, there was no statistically significant difference in the metabolic activity between cells cultured on pristine unmodified FEP and DVD-replicated FEP discs either 24 or 72 hours after cell plating. After 72 hours, the metabolic activity on DVD-replicated FEP discs even tended to be lower than that on pristine unmodified FEP, though this difference was not statistically significant. Meanwhile, the metabolic activity of cells on DVD-replicated FEP discs at both time points was significantly lower than that of the control cells grown on tissue culture polystyrene. This result was rather surprising because we had expected an increase in cell attachment, growth and alignment in the direction of the grooves on the material surface, as observed in our previous studies on microgrooved polydimethylsiloxane (PDMS) and nanogrooved polyether ether ketone (PEEK) and polyethylene naphthalate (PEN) [34,35]. However, in the case of PDMS, the surface pattern was activated by plasma and coated with collagen — a protein that promotes cell adhesion — and in the case of PEEK and PEN, the laser treatment used for patterning the surface increased its wettability. In our present study, however, FEP modified only by DVD replication remained hydrophobic, with minimum oxygen content and a low zeta potential, i.e., factors associated with a low attractiveness of a material for cell colonization (for a review, see [53]).
However, after plasma treatment, both pristine and DVD-replicated FEP became markedly more attractive for cell colonization. Cell metabolic activity on these substrates significantly increased, reaching similar levels to those on the control tissue culture polystyrene, i.e., another polymer treated by plasma (Figure 10). The difference between the pristine unmodified and plasma-treated samples became even more pronounced 72 hours after cell seeding. At this time point, the metabolic activity of cells on plasma-treated FEP discs was 54.4% higher than on pristine FEP, and on plasma-treated DVD-replicated FEP discs, the metabolic activity was even 100% higher than on corresponding DVD-replicated only discs. These results suggest that DVD replication made the FEP samples more susceptible to subsequent plasma modification, probably due to their larger effective surface area. One possible explanation is that the DVD replication produces submicron-scale irregularities, such as grooves and prominences approximately 0.5 µm wide, on the material surface. Since cells typically spread over tens of micrometers, micron- and submicron-scale irregularities could impede cell spreading [54], for a review, see [53]. Cell guidance by patterned materials could be improved by modulating the groove size from submicron to tens of micrometres, to better match the size of cells. Alternatively, the pattern could be further functionalized with cell adhesion-mediating proteins such as collagen [34], vitronectin and fibronectin [52], or adhesion oligopeptides derived from these proteins [55].
Metabolic activity was determined by a resazurin assay, and the data are presented as the mean relative fluorescence units (RFU) ± standard deviation for each sample. The resazurin assay is a method used to evaluate cell viability and cytotoxicity. It works by measuring the metabolic activity of cells, which is evaluated by measuring the conversion of the non-fluorescent dye resazurin into the fluorescent dye resorufin. This conversion is caused by mitochondrial enzymes in proliferating living cells. Therefore, the resulting fluorescence intensity is proportional to the number of viable cells [31,56].
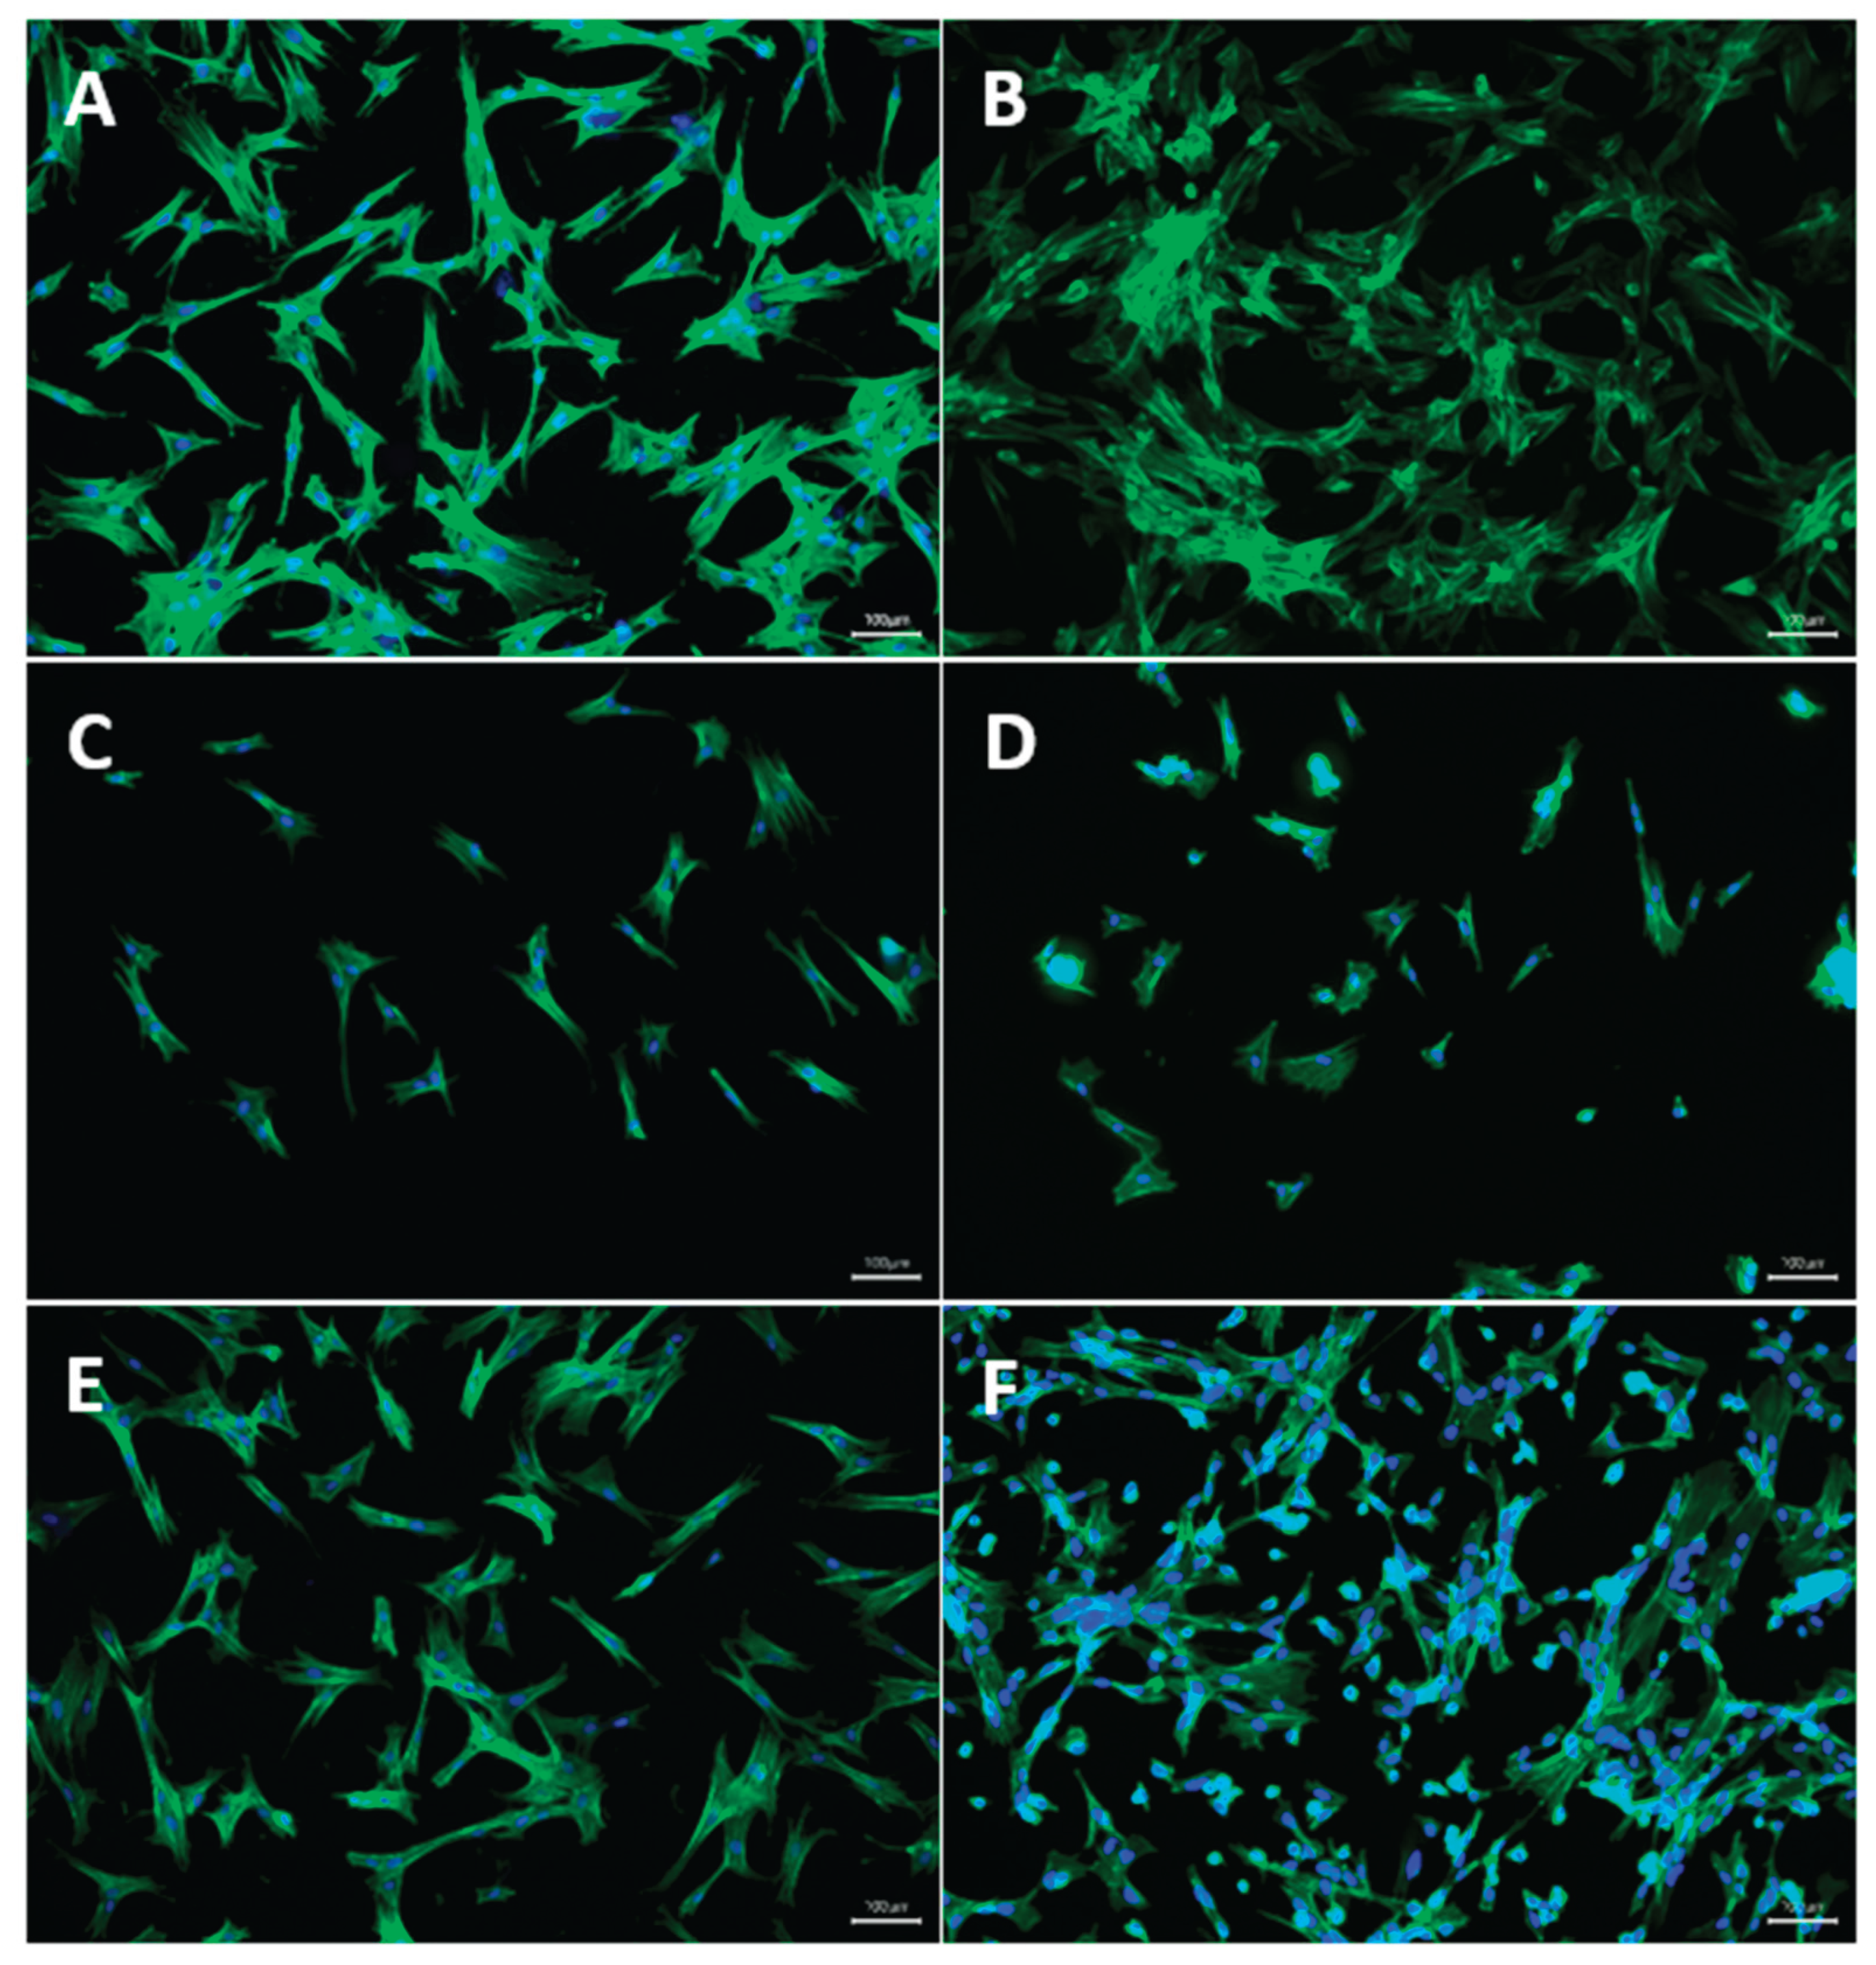
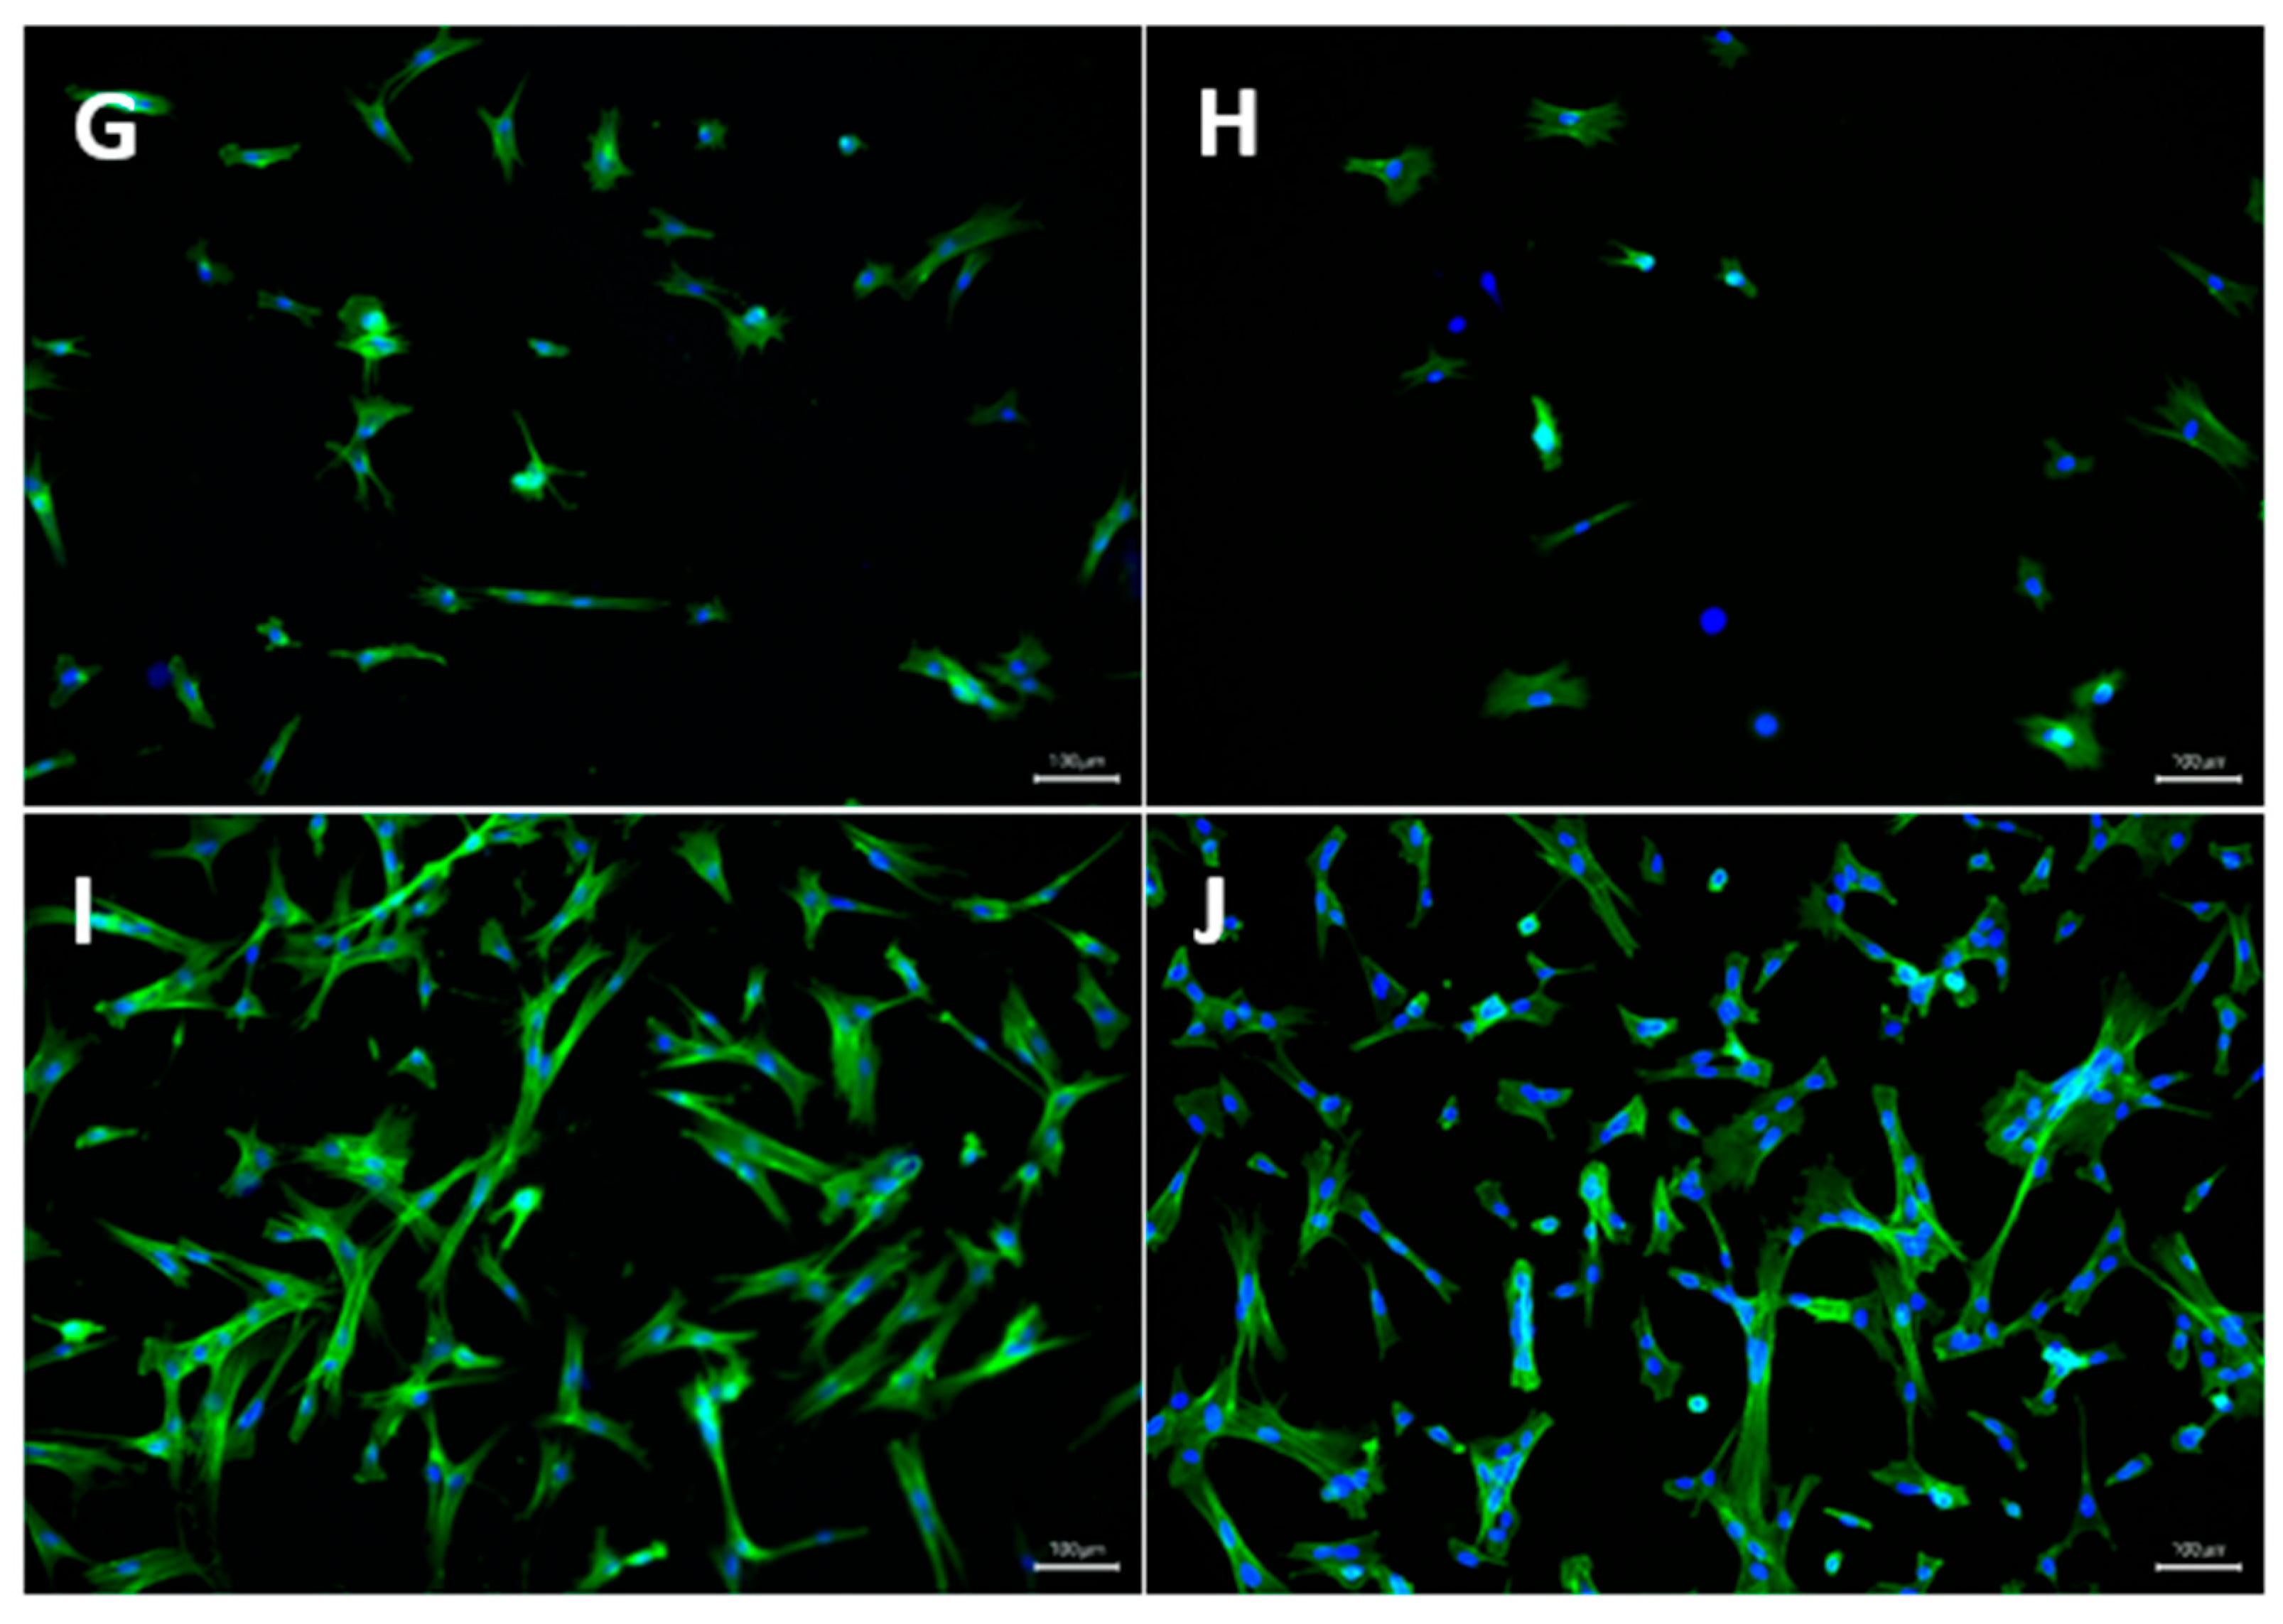
For further evaluation of the cells’ response to FEP samples, cell behavior (morphology and attachment to the tested substrates) was monitored using a fluorescence microscope (Figure 11). After the first day, elongated spindle-shaped cells with a morphology characteristic of MSCs could be observed in all tested and control samples. In all tested samples, the cells had a similar shape to those in the control group.
However, cells growing on plasma-untreated FEP discs (groups i and iii, i.e. without and with DVD-replication) were less spread out than cells growing on plasma-treated FEP discs (groups ii and iv) and on tissue culture polystyrene (ctrl). In addition, the cells in all groups were distributed randomly without any apparent directionality, i.e. alignment along the grooves. On both time points, an increase in cell density was observed on plasma-treated FEP discs compared to untreated FEP discs. These results are consistent with the results of cell metabolic activity and indicate that the plasma-treatment has a major positive effect on the cell performance rather than the DVD-replication.
4. Conclusions
We confirmed the success of the replication process into FEP foil, and the maintenance of a regular linear pattern; the linear pattern was transferred into FEP polymer successfully. The short treatment of lower plasma power did not affect the surface significantly, and the detailed surface morphology also confirmed the maintenance of the ripple pattern. The plasma treatment induced significant chemical changes on the replicated FEP surface; the wrinkle-like structure is superposed on the linear LIPSS-like pattern of replicated FEP, and the effective surface area was substantially enhanced. The changes in surface morphology of replicated and/or plasma-treated pattern was confirmed with SEM analysis. EDS analysis revealed that the plasma activation led to the incorporation of oxygen-containing groups onto plasma-activated FEP; however, this treatment affected only the very surface of exposed polymer. Plasma treatment has a substantial effect on the grooved FEP substrate, as detected with XPS analysis, and even for the shortest exposure time of 20 s, the atomic concentration is significantly increased, up to 12 at. %. The further increase of plasma exposure time did not have a significant influence on the oxygen concentration, and for 240 s and 8 W, we detected 13 at. % of oxygen, but the morphology of the samples is changed substantially, as was shown in the chapter related to AFM analysis. The synergistic effect of surface chemistry and morphology changes dramatically modified the zeta potential; the plasma exposure of both pristine and replicated FEP markedly increased the zeta potential of the surface compared to that of the pristine FEP and pristine FEP with replicated pattern, and the surface became more hydrophilic. Cultivation of human Wharton’s jelly mesenchymal stromal cells revealed that FEP samples modified by replication and/or plasma treatment supported cell adhesion, spreading, metabolic activity, and proliferation. This positive effect was mainly due to plasma modification; however, the replication patterning of the FEP surface increased its sensitivity to plasma treatment, as manifested by a more pronounced increase in cell metabolic activity on patterned plasma-modified surfaces.
Supplementary Materials
The following supporting information can be downloaded at the website of this paper posted on Preprints.org.
Author Contributions
Conceptualization, P.S. and I.V.; methodology, L.B and Z.K..; validation, N.S.K, P.S..; formal analysis, E.R., Š.P., V.Š; investigation, B.F., I.V., Š.P., Z.K., E.R. and P.S.; data curation, E.R., V.Š.; writing—original draft preparation, B.F. and P.S.; writing—review and editing, N.S.K., I.V., L.B.; supervision, P.S.; funding acquisition, N.S.K. and P.S. All authors have read and agreed to the published version of the manuscript.
Funding
This work was supported by the Project OP JAK ExRegMed, No CZ.02.01.01/00/22_008/0004562, of the Ministry of Education, Youth and Sports, which is co-funded by the European Union. This work was also supported by a grant from the Ministry of Health of the Czech Republic (No. NW26-09-00043). Further support was provided by the Czech Academy of Sciences (Praemium Academiae grant No. 2202). .
Institutional Review Board Statement
Human umbilical cords used for hWJSC derivation were obtained from the University Hospital in Pilsen (Czech Republic) from healthy newborns following spontaneous delivery. All umbilical cords were donated anonymously for research purposes with the written informed consent of the donors (mothers of newborns). The informed consents are stored at the University Hospital in Pilsen. All experiments involving human tissues or cells were approved by the Ethics Committee of the Institute of Physiology of the Czech Academy of Sciences in Prague on August 18, 2014, in accordance with the Public Health Act, as amended, No. 20/1996, § 26.
Informed Consent Statement
Informed consent was obtained from all subjects involved in the study.
Data Availability Statement
Data will be available upon request.
Conflicts of Interest
The authors declare no conflicts of interest.
References
- Kim, T.; Min, Ch.; Jung, M.; Lee, J.; Park, Ch.; Kang, S. Design methodology for nano-engineered surfaces to control adhesion: Application to the anti-adhesion of particles. Appl. Surf. Sci. 2016, 389, 889–893. [Google Scholar]
- Rodríguez-Hernández, J. Wrinkled interfaces: Taking advantage of surface instabilities to pattern polymer surfaces. Prog. Polym. Sci. 2015, 42, 1–41. [Google Scholar] [CrossRef]
- Gregorczyk, K.; Knez, M. Hybrid nanomaterials through molecular and atomic layer deposition: Top down, bottom up, and in-between approaches to new materials. Prog. Mater. Sci. 2016, 75, 1–37. [Google Scholar] [CrossRef]
- Schweikart; Horn, A.; A. Böker, A. Fery, Controlled Wrinkling as a Novel Method for the Fabrication of Patterned Surfaces. Adv. Polym. Sci. 2010, 227, 75–99. [Google Scholar]
- Lee, J. Su; Hong, H.; Park, S. J.; Lee, S. J.; Kim, D. S. A simple fabrication process for stepwise gradient wrinkle pattern with spatially-controlled wavelength based on sequential oxygen plasma treatment. Microelectron. Eng. 2017, 176, 101–105. [Google Scholar] [CrossRef]
- Juřík, P.; Slepička, P.; Nagyová, M.; Švorčík, V. Wrinkle pattern on PLLA induced by stress of polymer-metal bilayer. Surf. Coat. Technol. 2017, 311, 344–350. [Google Scholar] [CrossRef]
- Mukherjee, R.; Sharma, A.; Steiner, U. Surface instability and pattern formation in thin polymer films. In Generating micro- and nanopatterns on polymeric materials; del Campo, A., Arzt, E., Eds.; Wiley-VCH Verlag GmbH & Co. KGaA: Weinheim, 2011; pp. 217–65. [Google Scholar]
- P-Müller-Buschbaum; Bauer, E.; Wunnicke, O.; Stamm, M. The control of thin film morphology by the interplay of dewetting, phase separation and microphase separation. J. Phys. 2005, 17, S363. [Google Scholar] [CrossRef]
- Zhang, Z.X.; Wang, Z.; Xing, R.B.; Han, Y.C. Patterning thin polymer films by surface-directed dewetting and pattern transfer. Polymer 2003, 44, 3737–3743. [Google Scholar] [CrossRef]
- Schaffer, E.; Harkema, S.; Blossey, R.; Steiner, U. Temperature-gradient-induced instability in polymer films. Europhys. Lett. 2002, 60, 255–61. [Google Scholar]
- Schaffer, E.; Harkema, S.; Roerdink, M.; Blossey, R.; Steiner, U. Thermomechanical lithography: pattern replication using a temperature gradient driven instability. Adv. Mater. 2003, 15, 514–517. [Google Scholar] [CrossRef]
- McCormick, S. Materials science – exploiting wrinkle formation. Science 2007, 317, 605–606. [Google Scholar]
- Müller-Buschbaum, P. Dewetting and pattern formation in thin polymer films as investigated in real and reciprocal space. J. Phys. 2003, 15, 1549–1582. [Google Scholar] [CrossRef]
- Kargupta, K.; Sharma, A. Dewetting of thin films on periodic physically and chemically patterned surfaces. Langmuir 2002, 18, 1893–1903. [Google Scholar] [CrossRef]
- Lu, G.; Li, W.; Yao, J.M.; Zhang, G.; B. Yang, B.; Shen, J.C. Fabricating ordered two-dimensional arrays of polymer rings with submicrometer-sized features on patterned self-assembled mono-layers by dewetting. Adv. Mater. 2002, 14, 1049–1053. [Google Scholar]
- Ogawa, H.; Kanaya, T.; Nishida, K.; Matsuba, G. Phase separation and dewetting in polystyrene/poly(vinyl methyl ether) blend thin films in a wide thickness range. Polymer 2008, 49, 254–262. [Google Scholar]
- Li, X.; Han, Y.; An, L. Annealing effects on the surface morphologies of thin PS/PMMA blend films with different film thickness. Appl. Surf. Sci. 2004, 230, 115–124. [Google Scholar] [CrossRef]
- Park, J. W.; Cho, Y.H. Surface-induced morphologies in thin films of arod-coil diblock copolymer. Langmuir 2006, 22, 10898–10903. [Google Scholar] [PubMed]
- Wu, N.; Pease, L.F., III; Russel, W. B. Toward large-scale alignment of electrohydrodynamic patterning of thin polymer films. Adv. Funct. Mater. 2006, 16, 1992–1999. [Google Scholar]
- Schaffer, E.; Harkema, S.; Roerdink, M.; Blossey, R.; Steiner, U. Morphological instability of a confined polymer film in a thermal gradient. Macromolecules 2003, 36, 1645–1655. [Google Scholar] [CrossRef]
- Schaffer, E.; Harkema, S.; Roerdink, M.; Blossey, R.; Steiner, U. Thermomechanical lithography: pattern replication using a temperature gradient driven instability. Adv. Mater. 2003, 15, 514–517. [Google Scholar] [CrossRef]
- Schweikart, A. Fery, Controlled wrinkling as a novel method for the fabrication of patterned surfaces. Microchim. Acta 2009, 165, 249–263. [Google Scholar]
- Chen, C.M.; Yang, S. Wrinkling instabilities in polymer films and their applications. Polym. Int. 2012, 61, 1041–1047. [Google Scholar] [CrossRef]
- Deng, S.; Berry, V. Wrinkled, rippled and crumpled graphene: an overview of formation mechanism, electronic properties, and applications. Mater. Today 2016, 19, 197–212. [Google Scholar] [CrossRef]
- Schweikart; Pazos-Perez, N.; Alvarez-Puebla, R.A.; Fery, A. Controlling inter-nanoparticle coupling by wrinkle-assisted assembly. Soft. Matter. 2011, 7, 4093–4100. [Google Scholar]
- Pazos-Perez, N.; Ni, W.; Schweikart, A.; Alvarez-Puebla, R.A.; Fery, A.; Liz-Marzan, L.M. Highly uniform SERS substrates formed by wrinkle-confined drying of gold colloids. Chem. Sci. 2010, 1, 174–178. [Google Scholar] [CrossRef]
- Wu, H.; Kustra, S.; Gates, E.M.; Bettinger, C.J. Topographic substrates as strain relief features in stretchable organic thin film transistors. Org. Electron 2013, 14, 1636–1642. [Google Scholar] [CrossRef]
- Nakanishi, W.; Minami, K.; Shrestha, L. K.; Ji, Q.; Hill, J.P.; Ariga, K. Bioactive nanocarbon assemblies: Nanoarchitectonics and applications. Nano Today 2014, 9, 378–394. [Google Scholar] [CrossRef]
- Kamoshita, M.; Shirai, H.; Nakamura, H.; Kishimoto, T.; Hatanaka, Y.; Mashiko, D.; Esashika, K.; Yang, J.; Yamasaki, S.; Ogawa, T.; Kimura, H.; Ikawa, M. Development of the membrane ceiling method for in vitro spermatogenesis. Sci. Rep. 2025, 15, 625. [Google Scholar] [CrossRef] [PubMed]
- Ramachandran, B.; Sabbatier, G.; Bowden, O. M.; Campbell, K.; Fekete, N.; Girard-Lauriault, P. L.; Hoesli, C. A. Human mesenchymal stromal cell adhesion and expansion on fluoropolymer surfaces modified with oxygen and nitrogen-rich plasma polymers. Colloids Surf. B Biointerfaces 2024, 234, 113740. [Google Scholar] [CrossRef] [PubMed]
- Vackova; Vavrinova, E.; Musilkova, J.; Havlas, V.; Petrenko, Y. Hypothermic Storage of 3D Cultured Multipotent Mesenchymal Stromal Cells for Regenerative Medicine Applications. Polymers 2022, 14, 2553. [Google Scholar] [CrossRef] [PubMed]
- Petrenko, Y.; Vackova, I.; Kekulova, K.; Chudickova, M.; Koci, Z.; Turnovcova, K.; Kupcova Skalnikova, H.; Vodicka, P.; Kubinova, S. A Comparative Analysis of Multipotent Mesenchymal Stromal Cells derived from Different Sources, with a Focus on Neuroregenerative Potential. Sci. Rep. 2020, 10, 4290. [Google Scholar] [CrossRef] [PubMed]
- Neznalová, K.; Fajstavr, D.; Rimpelová, S.; Kasálková, N. Slepičková; Kolská, Z.; Švorčík, V.; Slepička, P. Honeycomb-patterned poly(L-lactic) acid on plasma-activated FEP as cell culture scaffold. Polym. Degrad. Stab. 2020, 181, 109370. [Google Scholar]
- Slepičková Kasálková, N.; Juřicová, V.; Fajstavr, D.; Frýdlová, B.; Rimpelová, S.; Švorčík, V.; Slepička, P. Plasma-Activated Polydimethylsiloxane Microstructured Pattern with Collagen for Improved Myoblast Cell Guidance. Int. J. Mol. Sci. 2024, 25, 2779–2796. [Google Scholar] [CrossRef] [PubMed]
- Slepičková Kasálková, N.; Juřicová, V.; Rimpelová, S.; Fajstavr, D.; Frýdlová, B.; Kolská, Z.; Švorčík, V.; Slepička, P. LIPSS pattern induced by polymer surface instability for myoblast cell guidance. Polym. Deg. Stab. 2024, 221, 110667. [Google Scholar] [CrossRef]
- Rebollar, E.; Frischauf, I.; Olbrich, M.; Peterbauer, T.; Hering, S.; Preiner, J.; Hinterdorfer, P.; Romanin, Ch.; Heitz, J. Proliferation of aligned mammalian cells on laser-nanostructured polystyrene. Biomaterials 2008, 29, 1796–1806. [Google Scholar] [CrossRef] [PubMed]
- Liu, S.; Yan, J.; Gao, M.; Yang, H. Research progress in the regulation of endothelial cells and smooth muscle cells using a micro–nanostructure. Biomed. Eng. OnLine 2025, 24 6. [Google Scholar]
- Peterková, L.; Rimpelová, S.; Křížová, I.; Slepička, P.; Slepičková Kasálková, N.; Švorčík, V.; Ruml, T. Biocompatibility of Ar plasma-treated fluorinated ethylene propylene: Adhesion and viability of human keratinocytes. Mater. Sci. Eng. C 2019, 100, 269–275. [Google Scholar] [CrossRef]
- Slepička, P.; Peterková, L.; Rimpelová, S.; Pinkner, A.; Kasálková, N. Slepičková; Kolská, Z.; Ruml, T.; Švorčík, V. Plasma activated perfluoroethylenepropylene for cytocompatibility enhancement. Polym. Deg. Stab. 2016, 130, 277–287. [Google Scholar] [CrossRef]
- Neznalová, K.; Sajdl, P.; Švorčík, V.; Slepička, P. Cellulose acetate honeycomb-like pattern created by improved phase separation. eXPRESS Polym. Lett. 2020, 14, 1078–1088. [Google Scholar] [CrossRef]
- Fajstavrová, K.; Rimpelová, S.; Fajstavr, D.; Švorčík, V.; Slepička, P. Cell Behavior of Primary Fibroblasts and Osteoblasts on Plasma-Treated Fluorinated Polymer Coated with Honeycomb Polystyrene. Materials 2021, 14, 889–908. [Google Scholar] [CrossRef] [PubMed]
- Slepicka, P.; Siegel, J.; Lyutakov, O.; Kasalkova, N. Slepickova; Kolska, Z.; Bacakova, L.; Svorcik, V. Polymer nanostructures for bioapplications induced by laser treatment. Biotechnol. Adv. 2018, 36, 839–855. [Google Scholar] [CrossRef] [PubMed]
- Vesel; Zaplotnik, R.; Mozetič, M.; Primc, G. Surface modification of PS polymer by oxygen-atom treatment from remote plasma: Initial kinetics of functional groups formation. Appl. Surf. Sci. 2021, 561, 150058. [Google Scholar] [CrossRef]
- Ghobeira, R.; Esbah Tabaei, P. S.; Nikiforov, A.; Morent, R.; De Geyter, N. Unraveling Exclusive In-Plasma Initiated Oxidation Processes Occurring at Polymeric Surfaces upon O2 Admixtures to Medium Pressure Ar and N2 DBD Treatments. Polymers 2023, 15, 2978. [Google Scholar] [CrossRef] [PubMed]
- Kolská, Z.; Řezníčková, A.; Nagyová, M.; Kasálková, N. Slepičková; Sajdl, P.; Slepička, P.; Švorčík, V. Plasma activated polymers grafted with cysteamine improving surfaces cytocompatibility. Polym. Degrad. Stab. 2014, 101, 1–9. [Google Scholar] [CrossRef]
- Rogulska; Vackova, I.; Prazak, S.; Turnovcova, K.; Kubinova, S.; Bacakova, L.; Jendelova, P.; Petrenko, Y. Storage conditions affect the composition of the lyophilized secretome of multipotent mesenchymal stromal cells. Sci. Rep. 2024, 14, 10243. [Google Scholar] [CrossRef] [PubMed]
- Garzon; Chato-Astrain, J.; Campos, F.; Fernandez-Valades, R.; Sanchez-Montesinos, I.; Campos, A.; Alaminos, M.; D’Souza, R. N.; Martin-Piedra, M. A. Expanded Differentiation Capability of Human Wharton’s Jelly Stem Cells Toward Pluripotency: A Systematic Review. Tissue Eng. Part B Rev. 2020, 26, 301–312. [Google Scholar] [PubMed]
- Kurlander, R. J.; Tawab, A.; Fan, Y.; Carter, C. S.; Read, E. J. A functional comparison of mature human dendritic cells prepared in fluorinated ethylene-propylene bags or polystyrene flasks. Transfusion 2006, 46, 1494–1504. [Google Scholar] [PubMed]
- Sticker, D.; Rothbauer, M.; Lechner, S.; Hehenberger, M. T.; Ertl, P. Multi-layered, membrane-integrated microfluidics based on replica molding of a thiol-ene epoxy thermoset for organ-on-a-chip applications. Lab Chip 2015, 15, 4542–4554. [Google Scholar] [PubMed]
- Samal, P.; Gubbins, E.; van Blitterswijk, C.; Truckenmüller, R.; Giselbrecht, S. Thin fluorinated polymer film microcavity arrays for 3D cell culture and label-free automated feature extraction. Biomater. Sci. 2021, 9, 7838–7850. [Google Scholar] [CrossRef] [PubMed]
- Hui, M. Krokidis, ePTFE/FEP stents for malignant biliary obstruction. BMJ Support Palliat. Care 2022, 12, e174–e177. [Google Scholar] [PubMed]
- Steele, J. G.; Johnson, G.; McFarland, C.; Dalton, B. A.; Gengenbach, T. R.; Chatelier, R. C.; Underwood, P. A.; Griesser, H. J. Roles of serum vitronectin and fibronectin in initial attachment of human vein endothelial cells and dermal fibroblasts on oxygen- and nitrogen-containing surfaces made by radiofrequency plasmas. J. Biomater. Sci. Polym. Ed. 1994, 6, 511–532. [Google Scholar] [PubMed]
- L. Bacakova, L.; Filova, E.; Parizek, M.; Ruml, T.; Svorcik, V. Modulation of cell adhesion, proliferation and differentiation on materials designed for body implants. Biotechnol. Adv. 2011, 29, 739–767. [Google Scholar] [CrossRef]
- Steinerova, M.; Matejka, R.; Stepanovska, J.; Filova, E.; Stankova, L.; Rysova, M.; Martinova, L.; Dragounova, H.; Domonkos, M.; Artemenko, A.; Babchenko, O.; Otahal, M.; Bacakova, L.; Kromka, A. Human osteoblast-like SAOS-2 cells on submicron-scale fibers coated with nanocrystalline diamond films. Mater. Sci. Eng. C Mater. Biol. Appl. 2021, 121, 111792. [Google Scholar] [PubMed]
- Tong, Y. W.; Shoichet, M. S. Enhancing the neuronal interaction on fluoropolymer surfaces with mixed peptides or spacer group linkers. Biomaterials 2001, 22, 1029–1034. [Google Scholar] [CrossRef] [PubMed]
- Petiti, J.; Revel, L.; Divieto, C. Standard Operating Procedure to Optimize Resazurin-Based Viability Assays. Biosensors 2024, 26, 156. [Google Scholar]
Figure 1.
AFM images of DVD-replicated pristine FEP (the 1st line) and plasma-modified FEP foil with 3 W power and a plasma exposure time of 20 s (the 2nd line) are introduced. Squares of 10×10 m2 (the 1st column) and 3×3 m2 (the 2nd column) are shown. Ra represents the average surface roughness in nm and S represents the effective surface area.
Figure 1.
AFM images of DVD-replicated pristine FEP (the 1st line) and plasma-modified FEP foil with 3 W power and a plasma exposure time of 20 s (the 2nd line) are introduced. Squares of 10×10 m2 (the 1st column) and 3×3 m2 (the 2nd column) are shown. Ra represents the average surface roughness in nm and S represents the effective surface area.
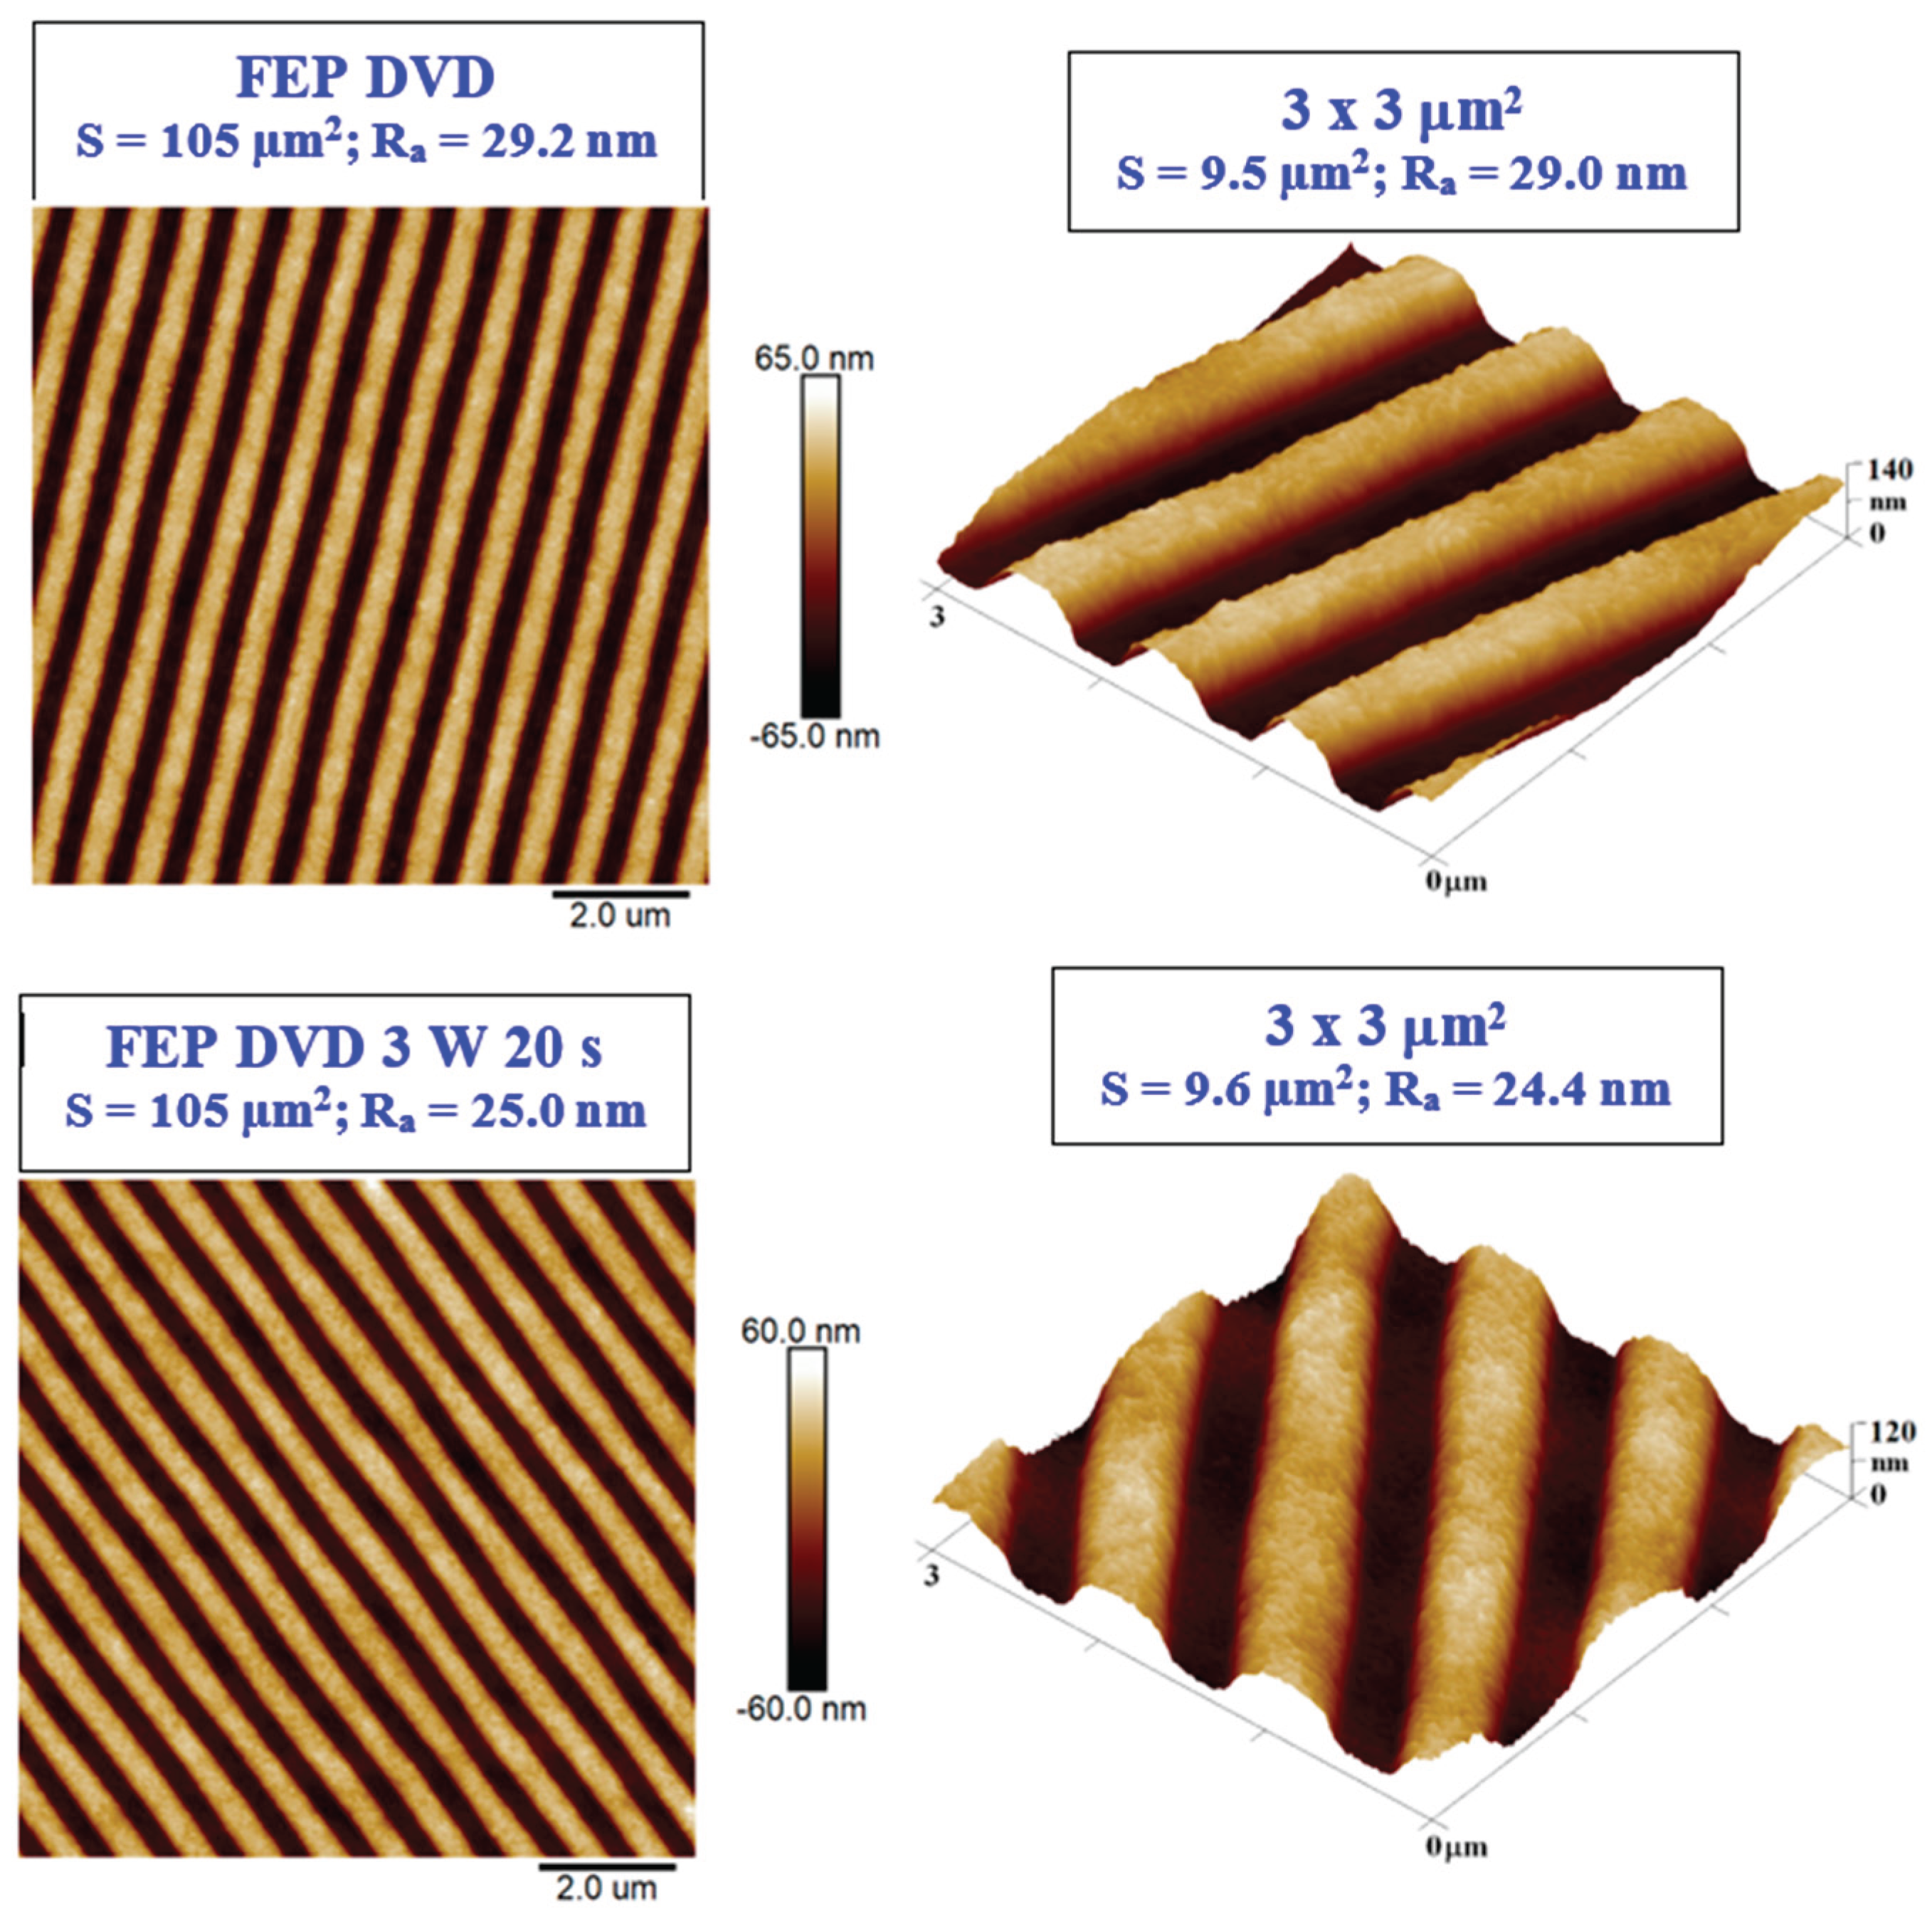
Figure 2.
AFM images of DVD-replicated and plasma-modified FEP foils with 8 W power and plasma exposure times of 120 s and 240 s are introduced. Squares of 10×10 m2 (the 1st column) and 3×3 m2 (the 2nd column) are shown. Ra represents the average surface roughness in nm and S represents the effective surface area.
Figure 2.
AFM images of DVD-replicated and plasma-modified FEP foils with 8 W power and plasma exposure times of 120 s and 240 s are introduced. Squares of 10×10 m2 (the 1st column) and 3×3 m2 (the 2nd column) are shown. Ra represents the average surface roughness in nm and S represents the effective surface area.
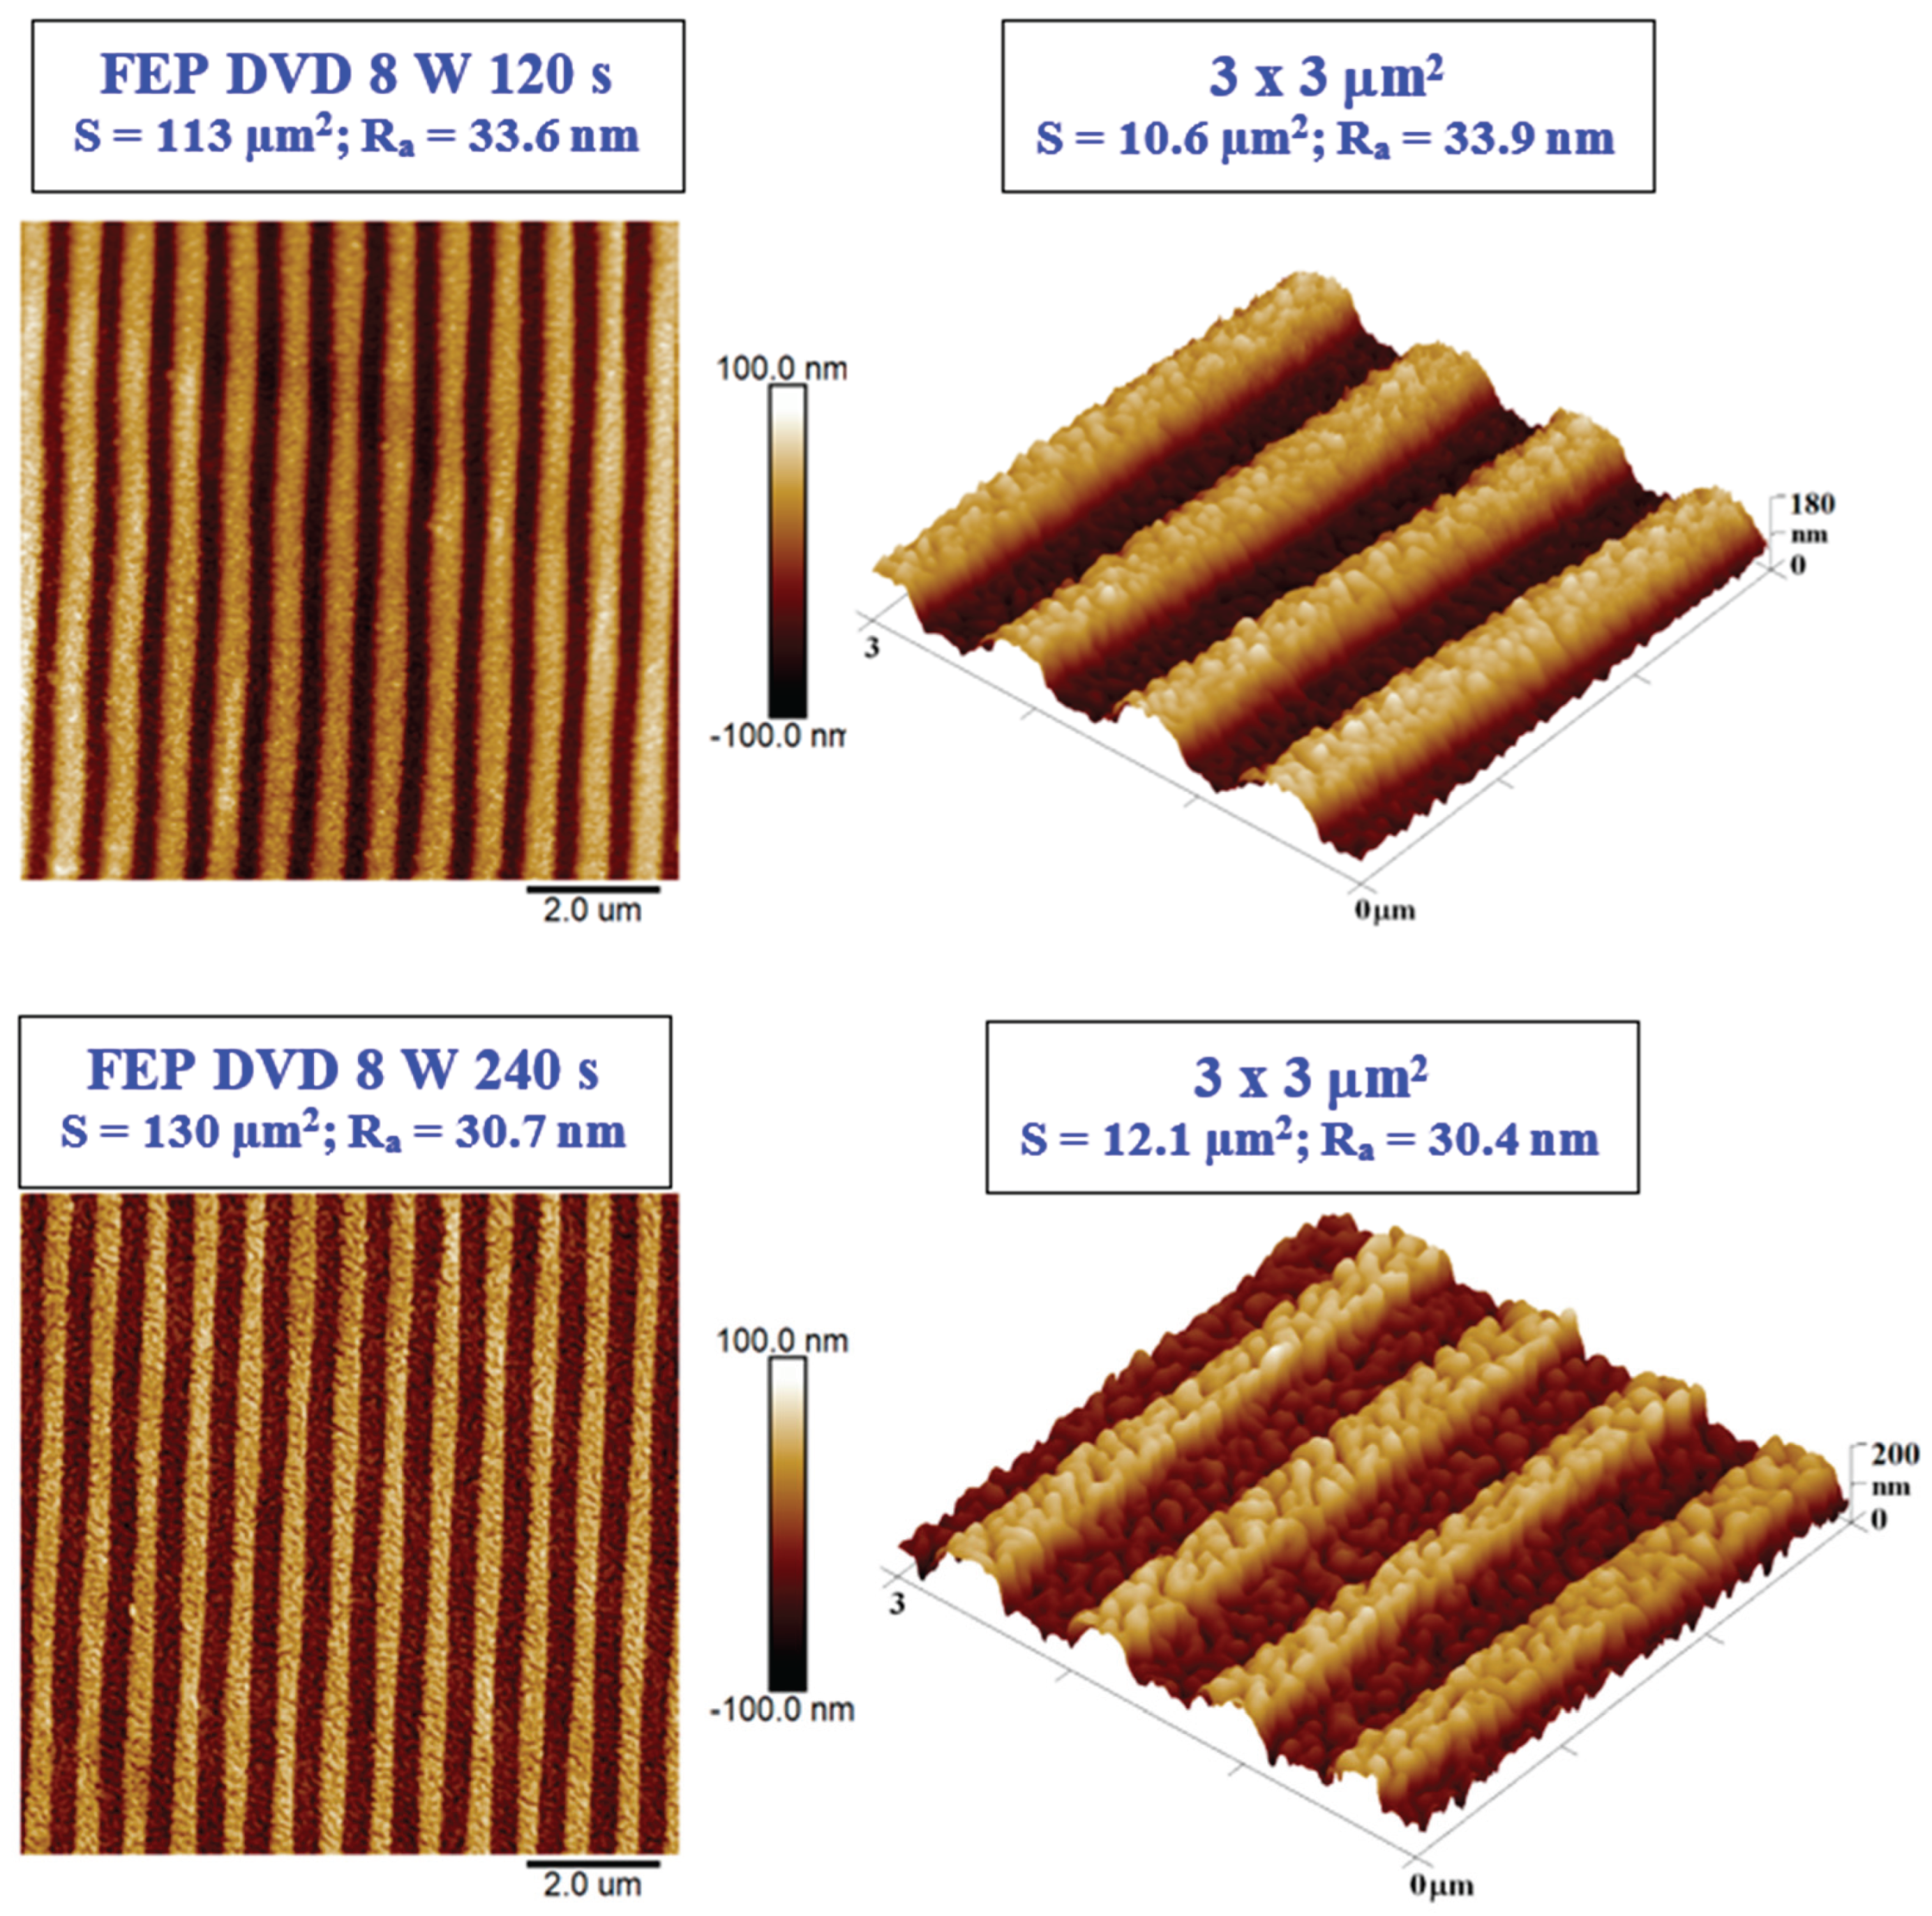
Figure 3.
Detailed AFM images of DVD-replicated pristine FEP, and plasma-modified replicated FEP foils with 3 W power (20 s and 120 s) and 8 W power (240 s) are introduced. Squares of 1×1 m2 are shown. Ra represents the average surface roughness in nm, S represents the effective surface area, and the number in % represents the difference between the basic planes.
Figure 3.
Detailed AFM images of DVD-replicated pristine FEP, and plasma-modified replicated FEP foils with 3 W power (20 s and 120 s) and 8 W power (240 s) are introduced. Squares of 1×1 m2 are shown. Ra represents the average surface roughness in nm, S represents the effective surface area, and the number in % represents the difference between the basic planes.
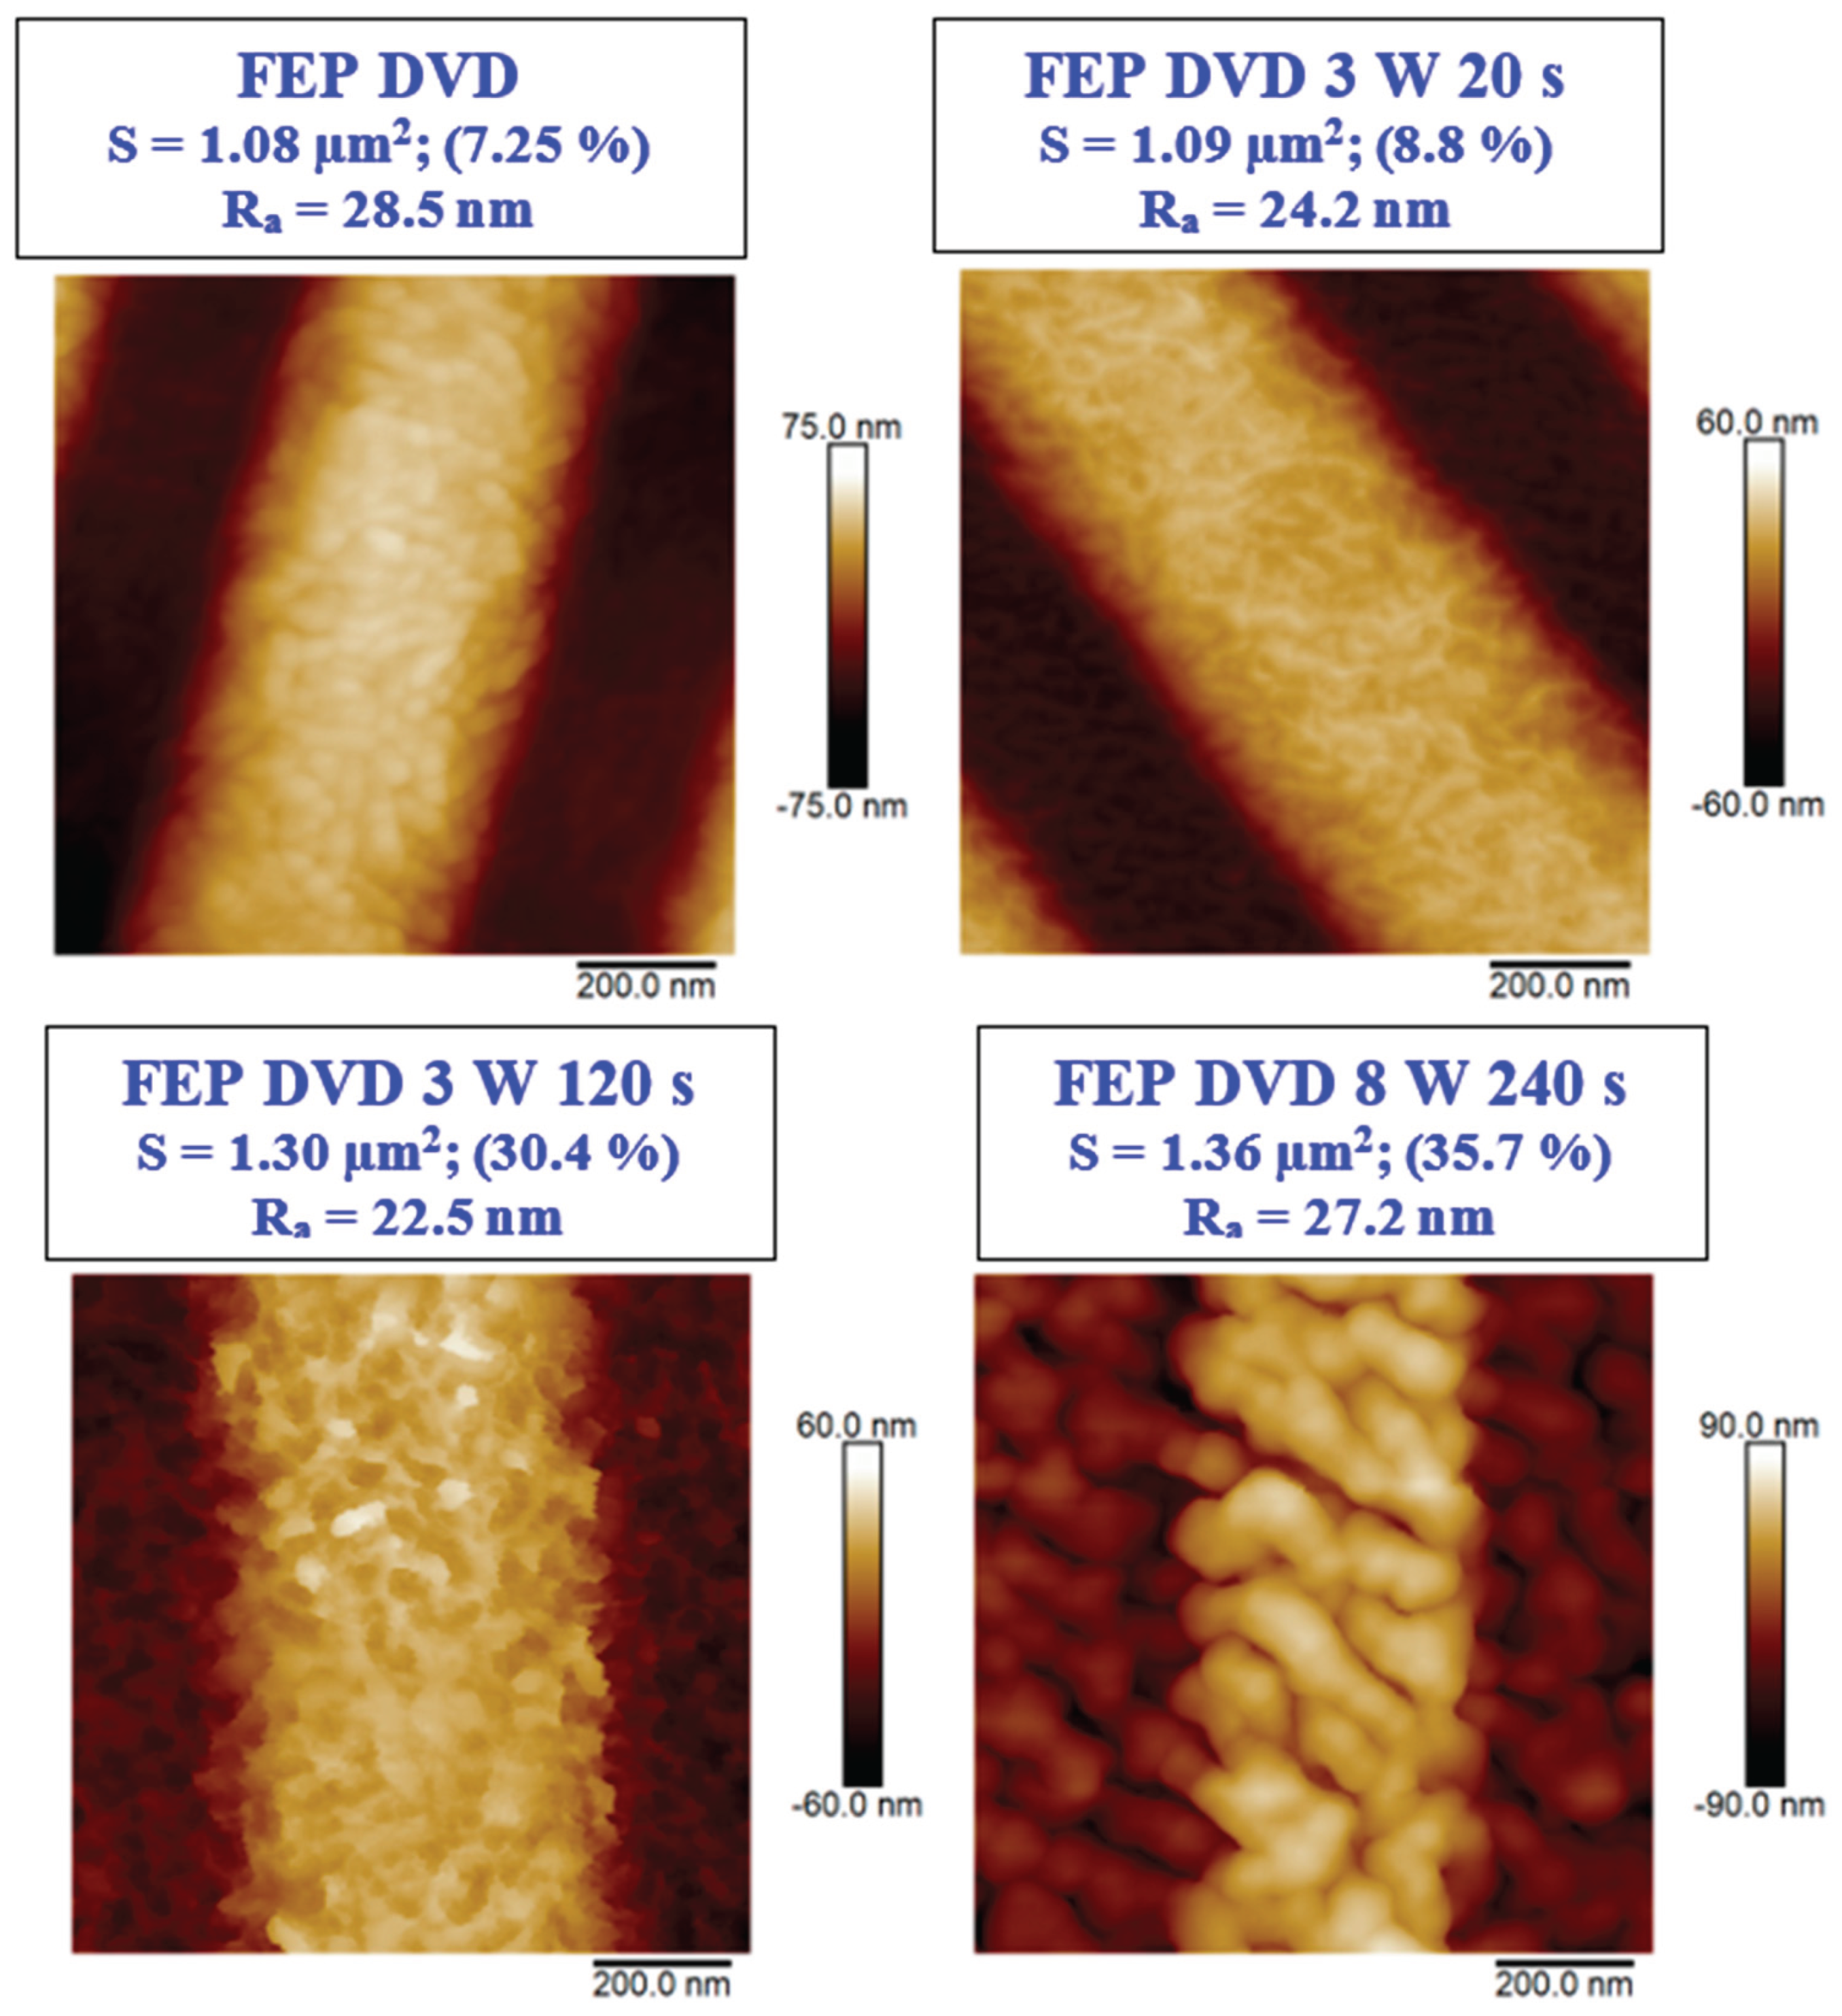
Figure 4.
SEM images of DVD-replicated and plasma-modified FEP foils with 3 W power and plasma exposure times of 40 s and 120 s were chosen. Squares of 30×30 m2 (the 1st column) 10×10 m2 (the 2nd column) and 3×3 m2 (the 3rd column) are shown.
Figure 4.
SEM images of DVD-replicated and plasma-modified FEP foils with 3 W power and plasma exposure times of 40 s and 120 s were chosen. Squares of 30×30 m2 (the 1st column) 10×10 m2 (the 2nd column) and 3×3 m2 (the 3rd column) are shown.
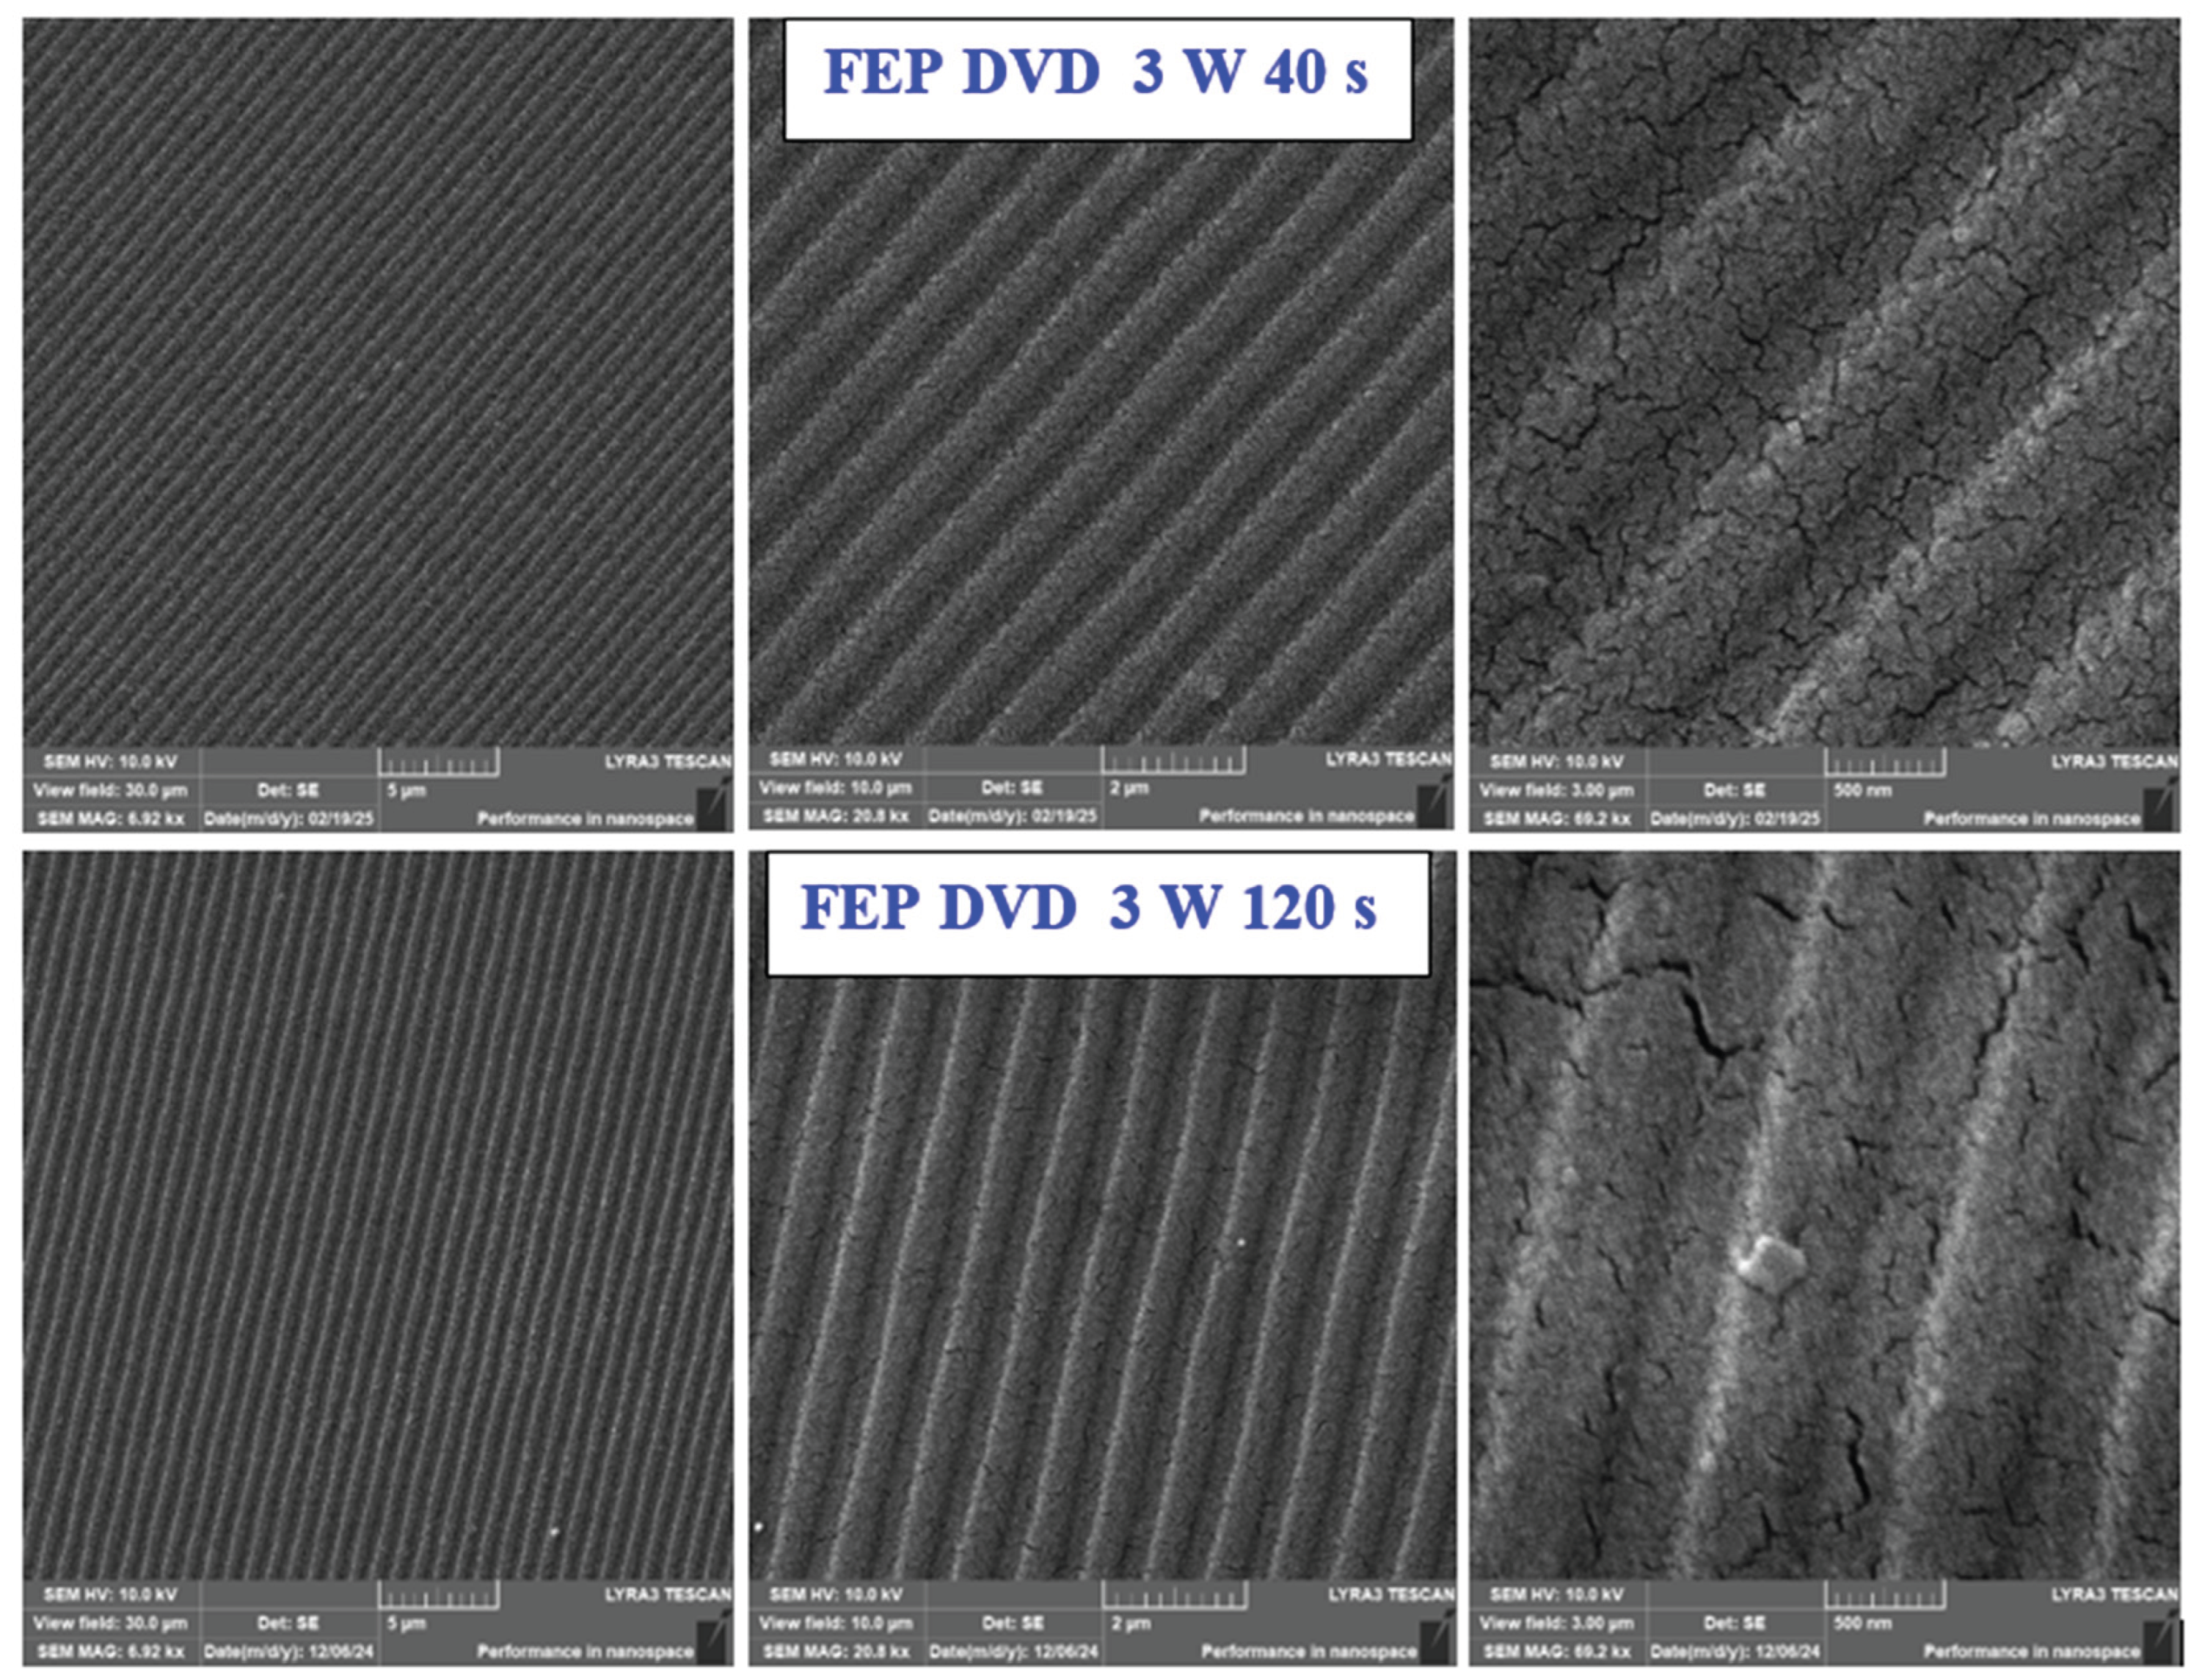
Figure 5.
SEM images of DVD-replicated and plasma-modified FEP foils with 8 W power and plasma exposure times of 40 s and 120 s were chosen. Squares of 30×30 m2 (the 1st column), 10×10 m2 (the 2nd column) and 3×3 m2 (the 3rd column) are shown.
Figure 5.
SEM images of DVD-replicated and plasma-modified FEP foils with 8 W power and plasma exposure times of 40 s and 120 s were chosen. Squares of 30×30 m2 (the 1st column), 10×10 m2 (the 2nd column) and 3×3 m2 (the 3rd column) are shown.
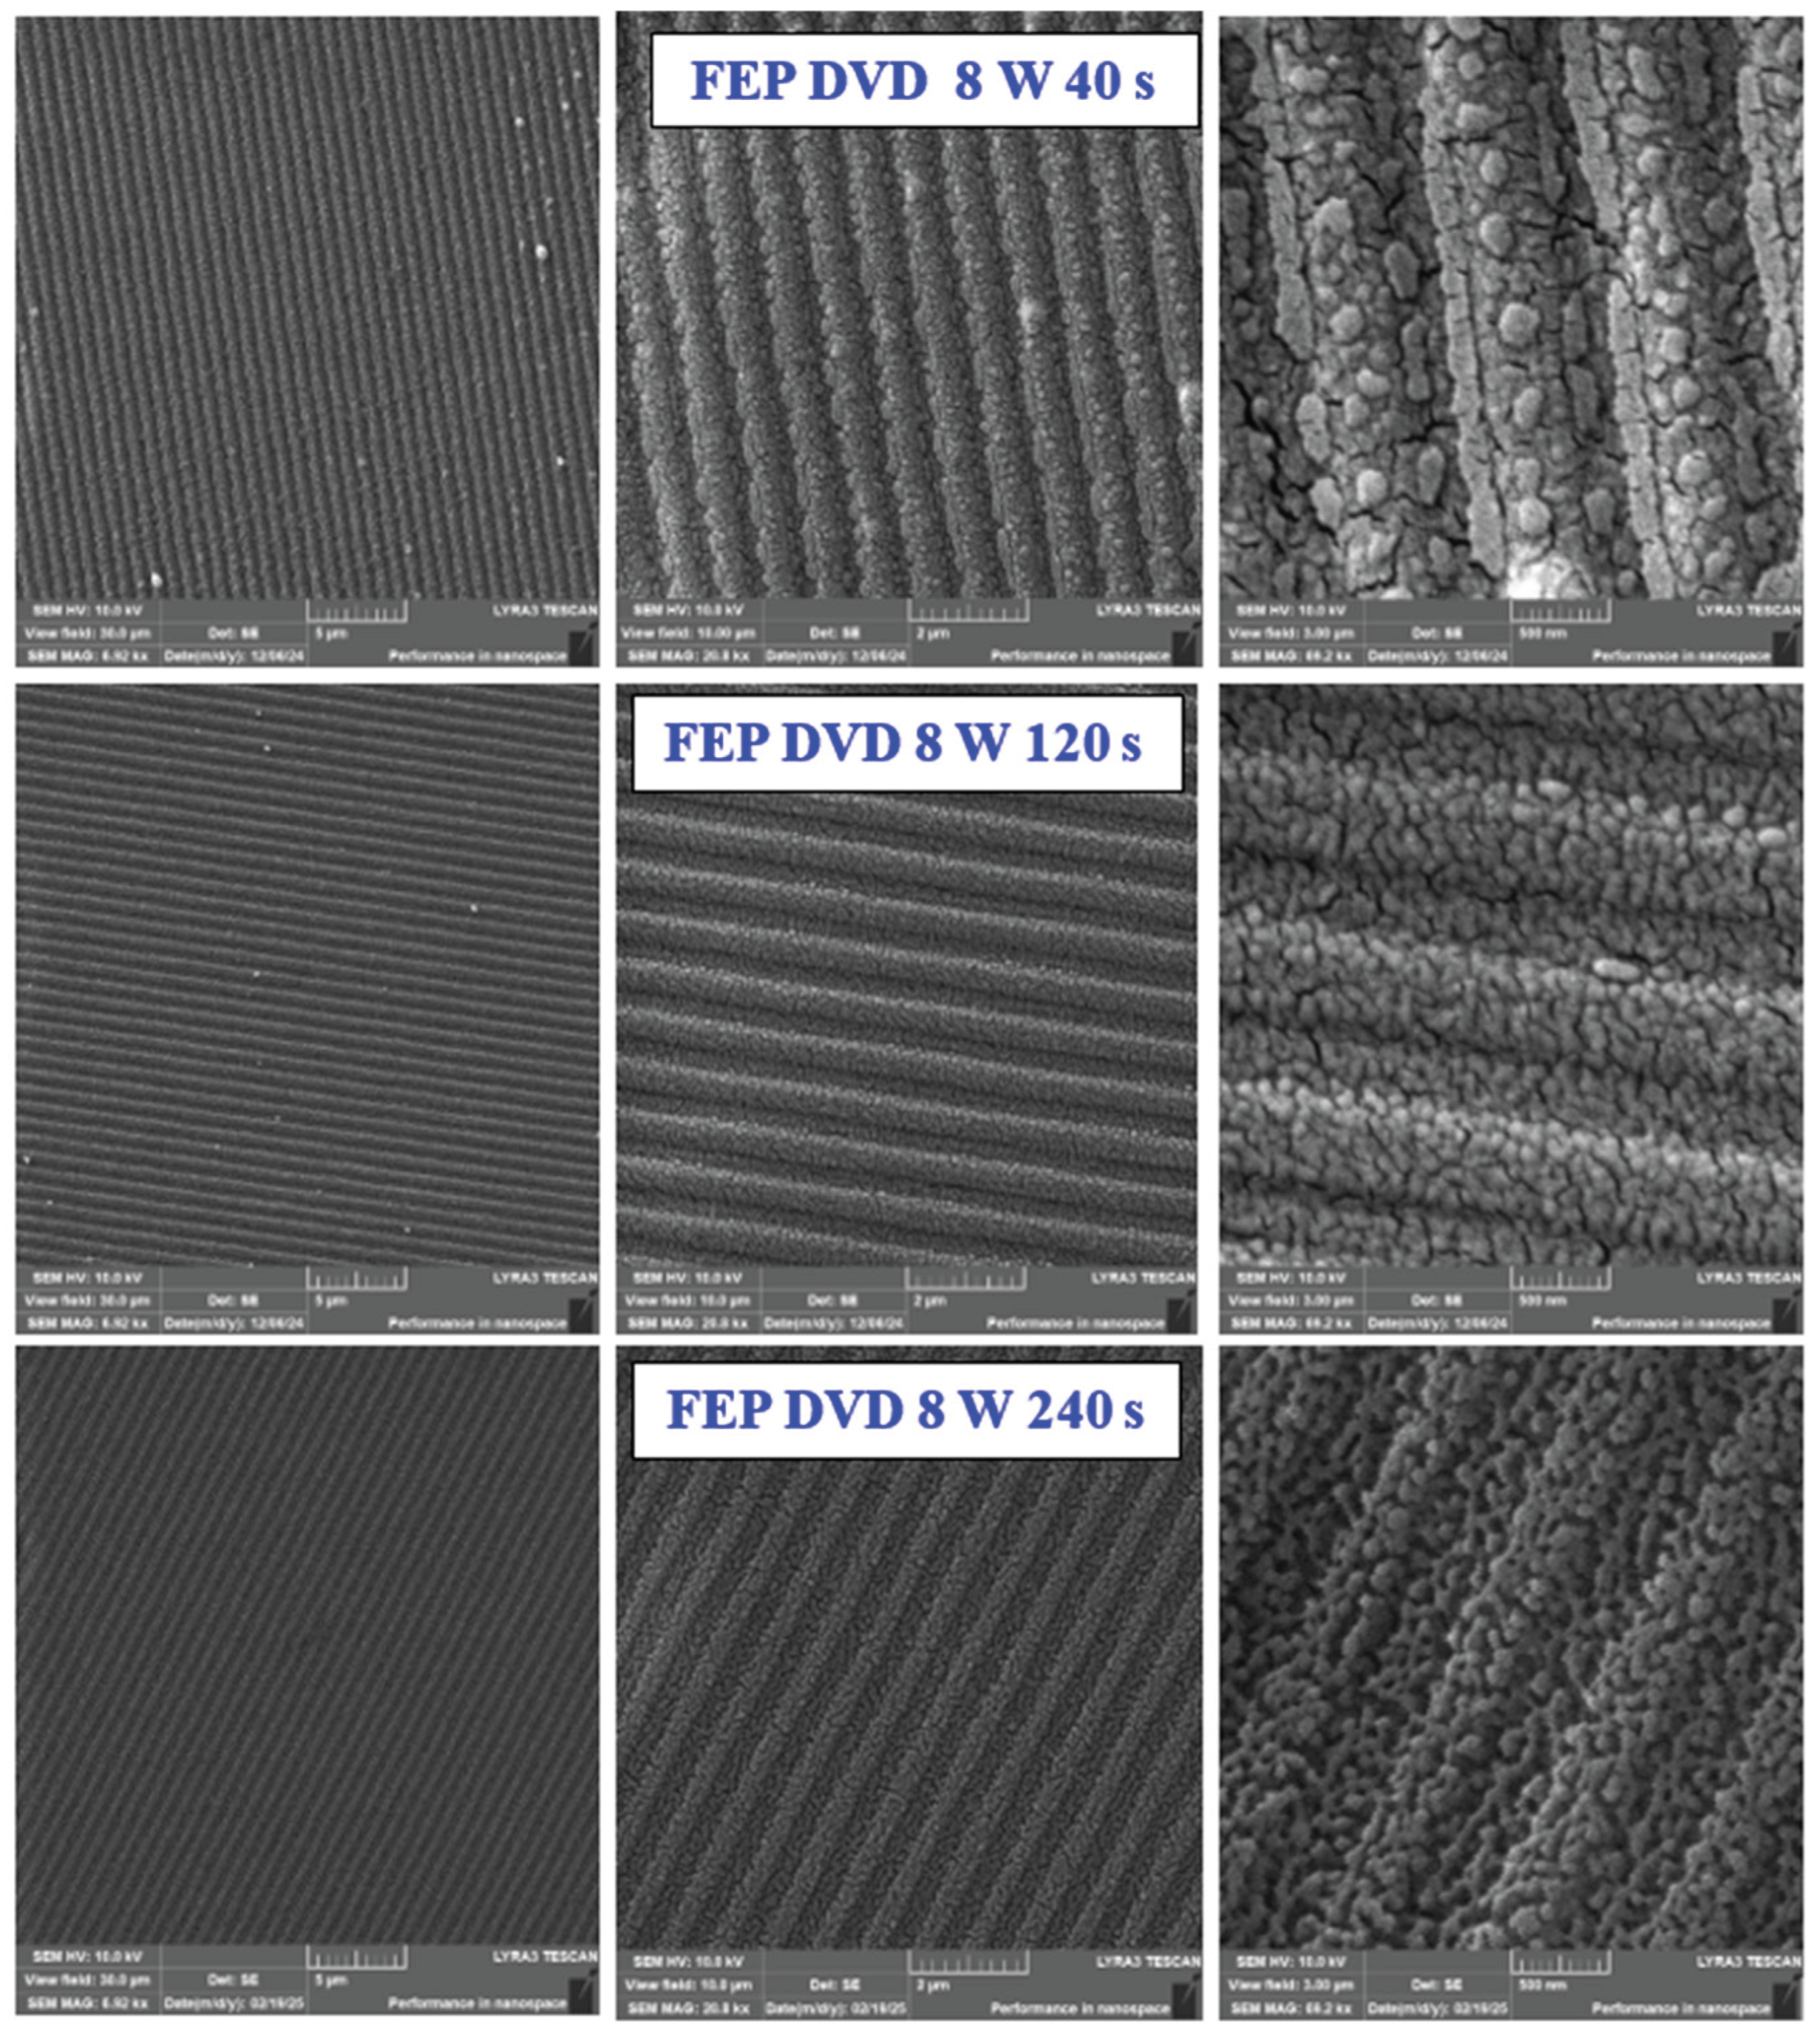
Figure 6.
EDS spectra of DVD-replicated and plasma-modified FEP foil with 3 W power and plasma exposure times ranging from 20 s to 240 s were chosen. Representative elemental concentrations of fluorine, carbon and oxygen are also introduced in wt. %.
Figure 6.
EDS spectra of DVD-replicated and plasma-modified FEP foil with 3 W power and plasma exposure times ranging from 20 s to 240 s were chosen. Representative elemental concentrations of fluorine, carbon and oxygen are also introduced in wt. %.
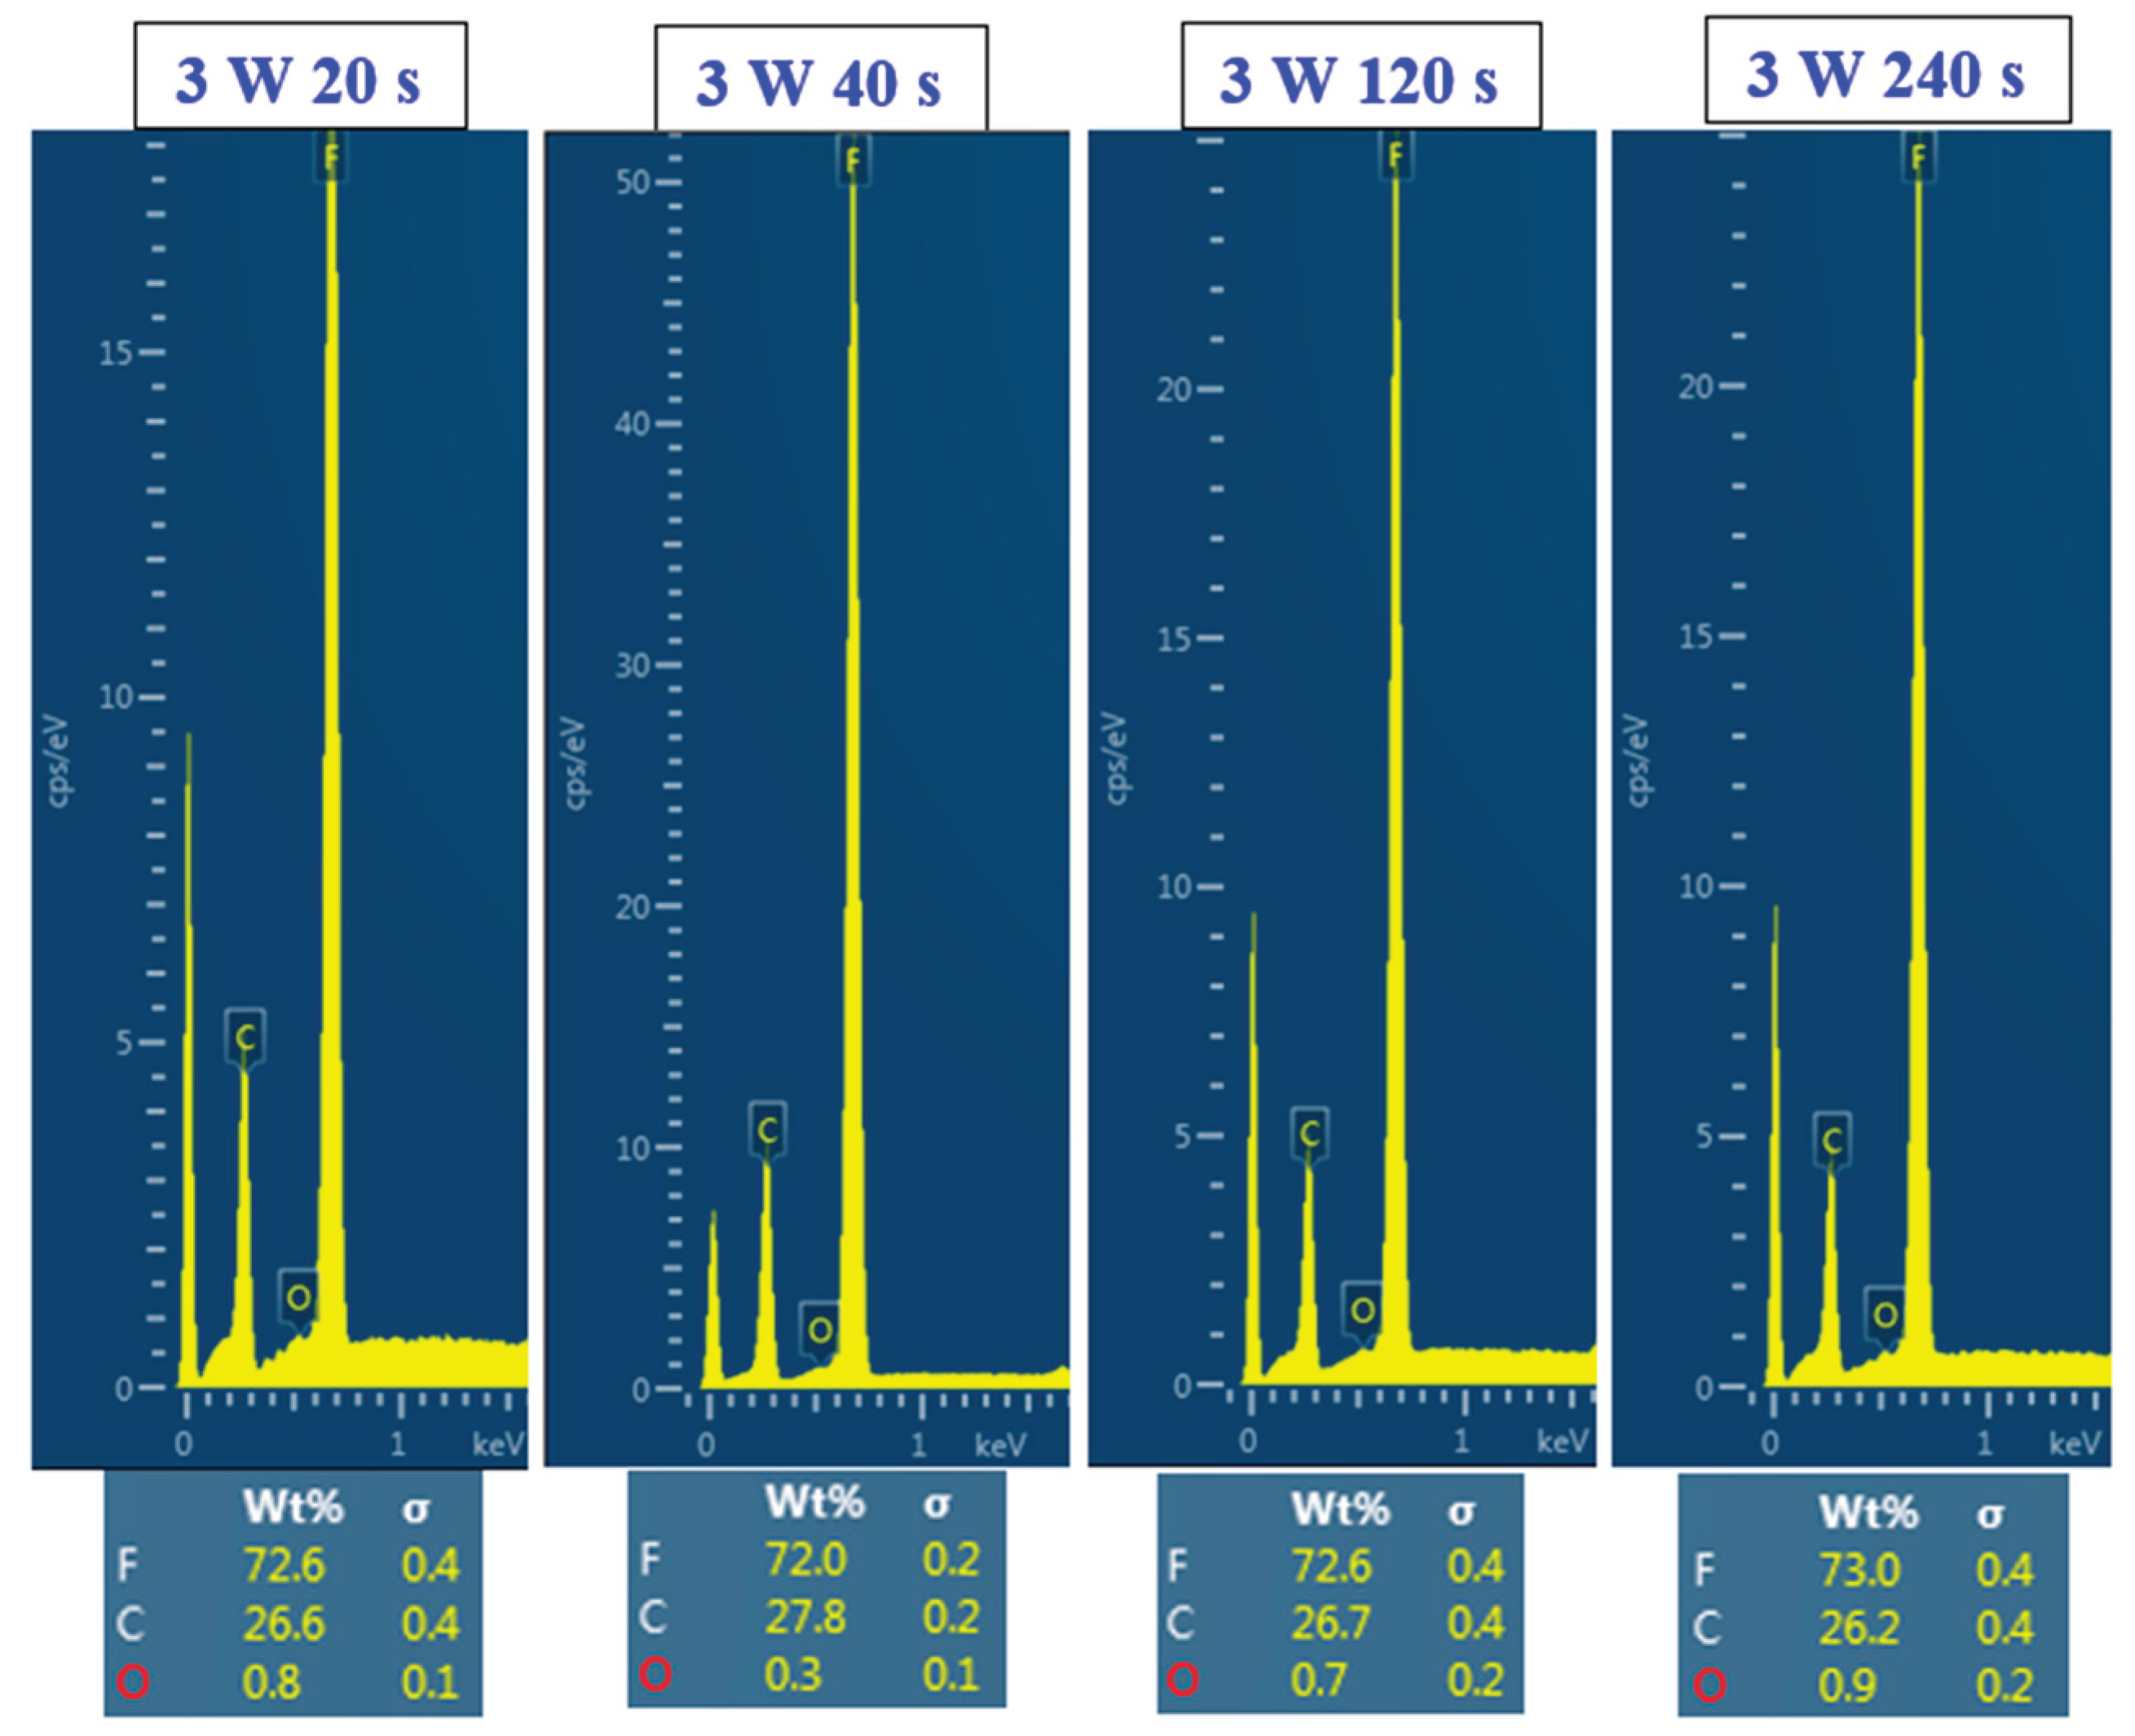
Figure 7.
EDS spectra of DVD-replicated and plasma-modified FEP foils with 8 W power and plasma exposure times ranging from 20 s to 240 s were chosen. Representative elemental concentrations of fluorine, carbon and oxygen are also introduced in wt. %.
Figure 7.
EDS spectra of DVD-replicated and plasma-modified FEP foils with 8 W power and plasma exposure times ranging from 20 s to 240 s were chosen. Representative elemental concentrations of fluorine, carbon and oxygen are also introduced in wt. %.
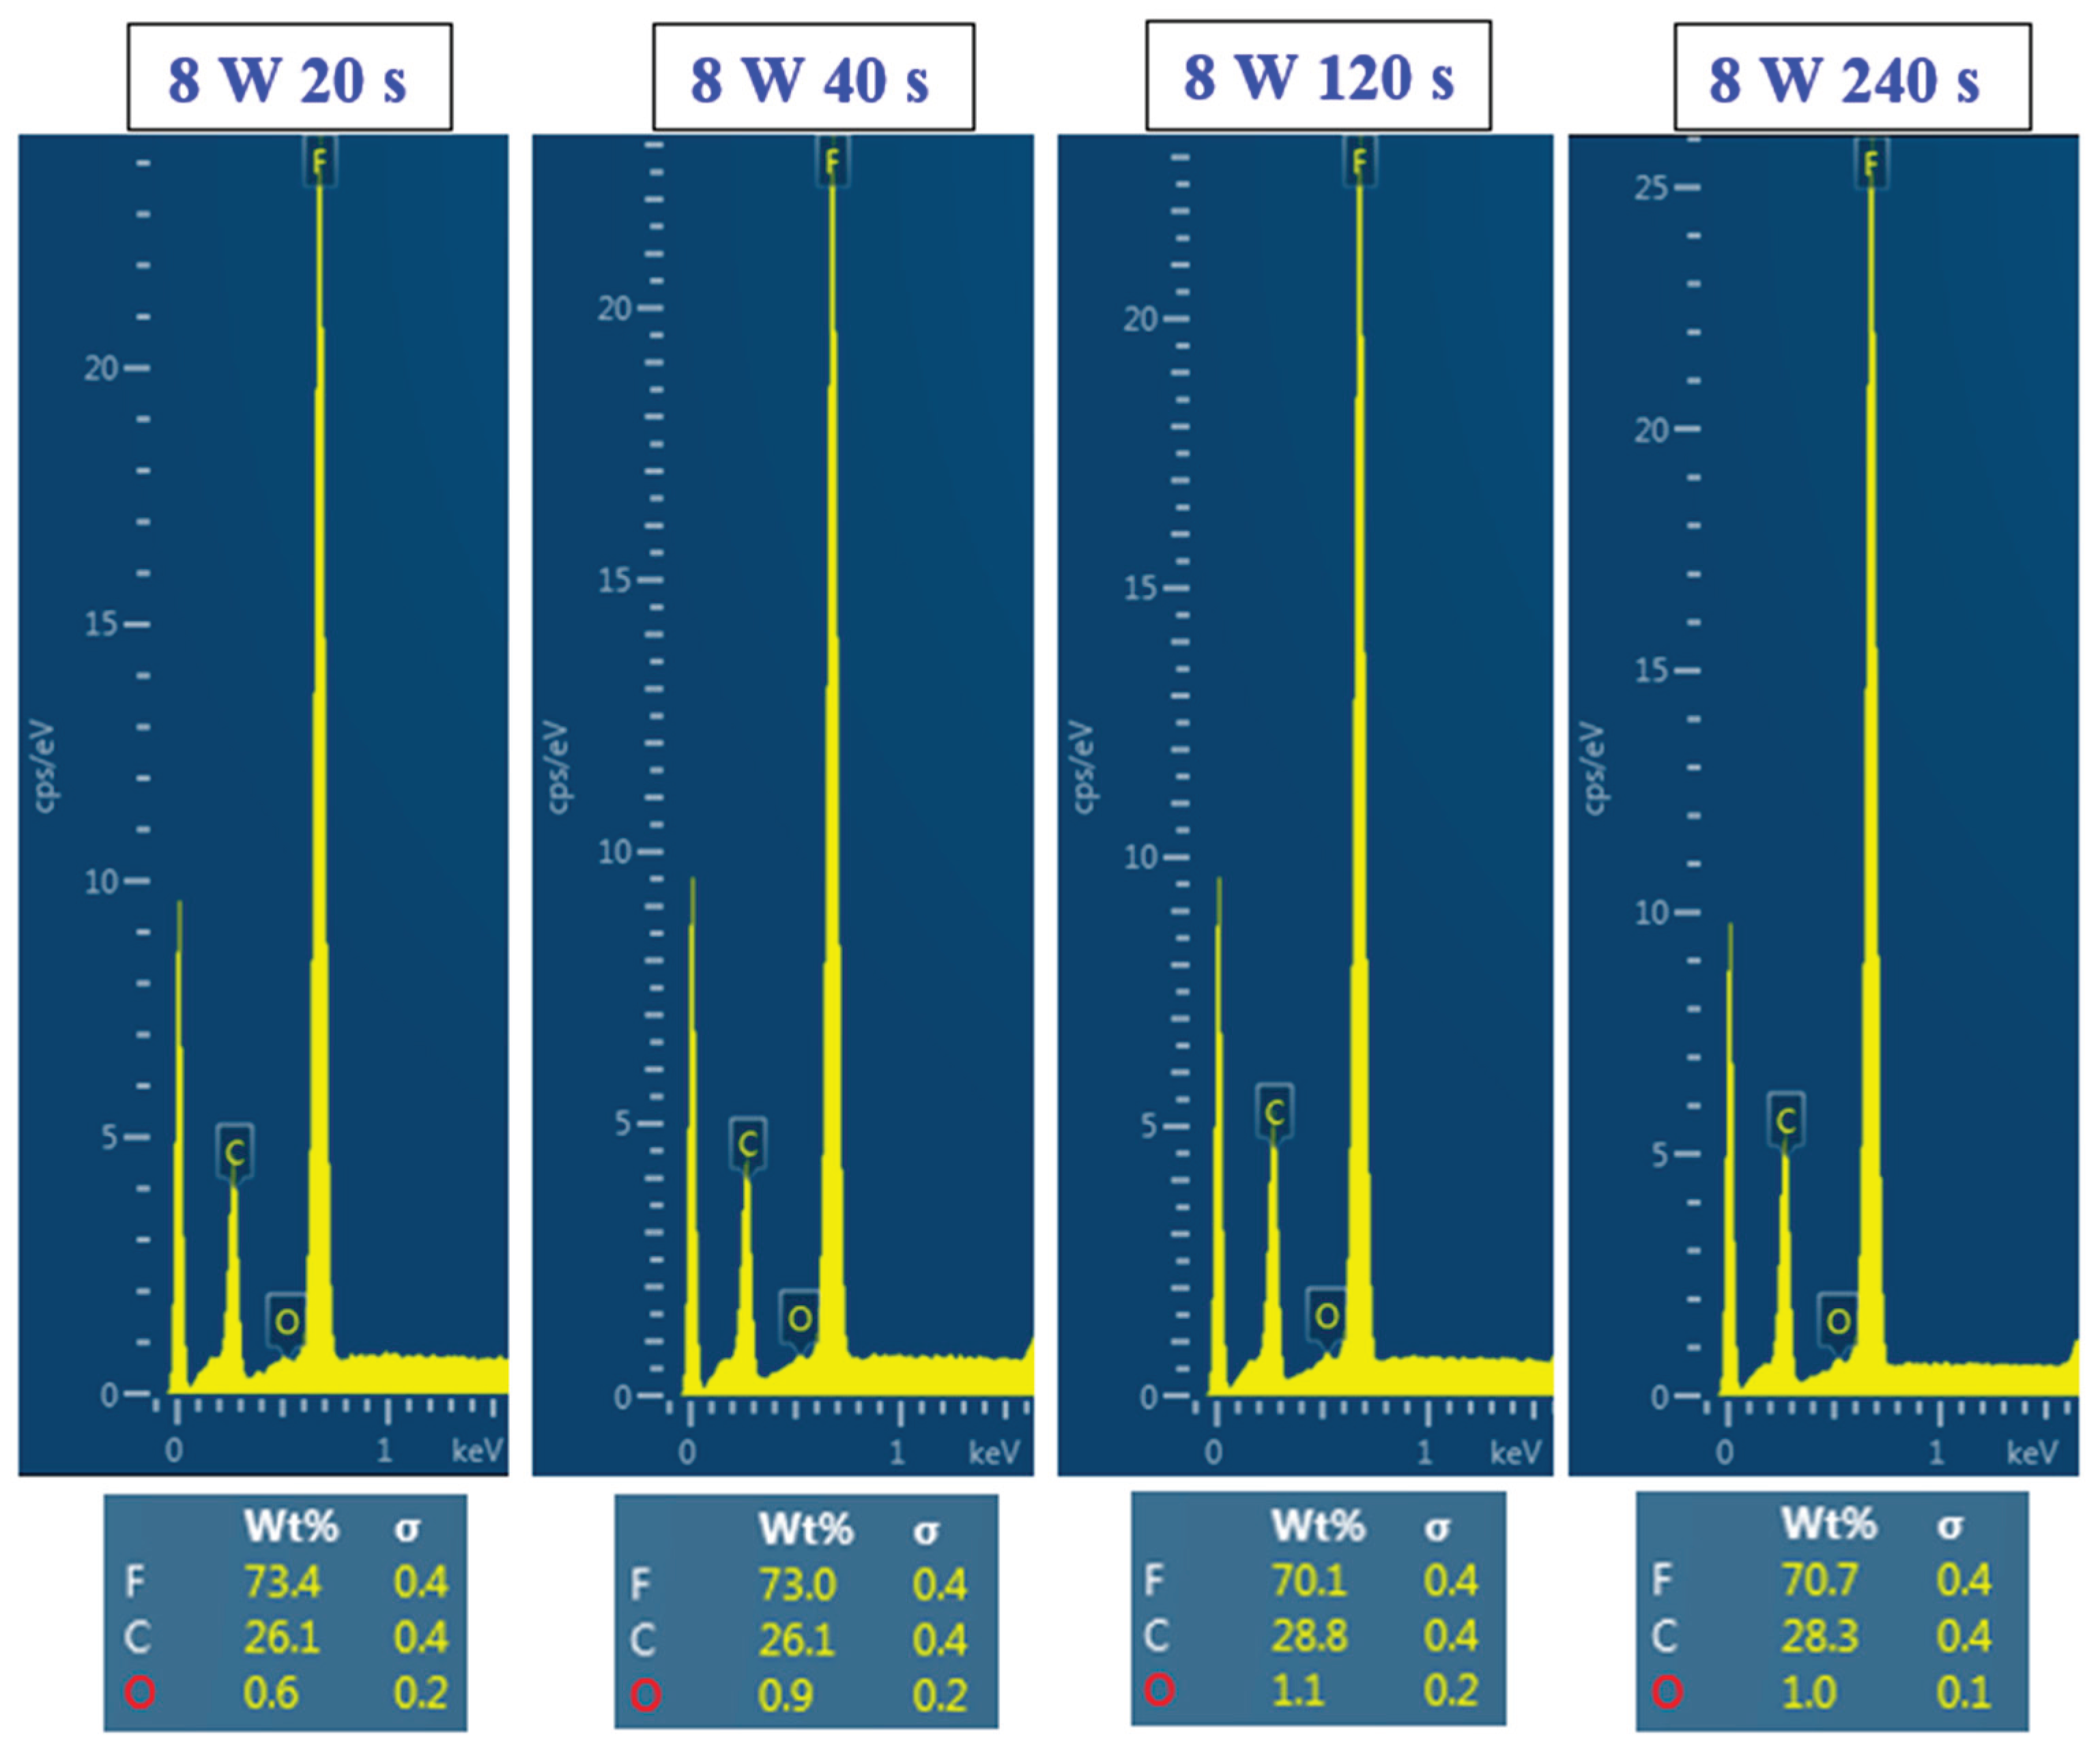
Figure 8.
Representative XPS spectrum of DVD-replicated and plasma-modified FEP foil with 8 W power and a plasma exposure time of 20 s. In the table, the oxygen and fluorine concentrations for pristine FEP, pristine FEP with replicated DVD pattern (FEP DVD), and this sample subsequently exposed to plasma power of 8 W and exposure times of 20 s and 240 s are introduced. Representative elemental concentrations of fluorine and oxygen are presented in at. %.
Figure 8.
Representative XPS spectrum of DVD-replicated and plasma-modified FEP foil with 8 W power and a plasma exposure time of 20 s. In the table, the oxygen and fluorine concentrations for pristine FEP, pristine FEP with replicated DVD pattern (FEP DVD), and this sample subsequently exposed to plasma power of 8 W and exposure times of 20 s and 240 s are introduced. Representative elemental concentrations of fluorine and oxygen are presented in at. %.
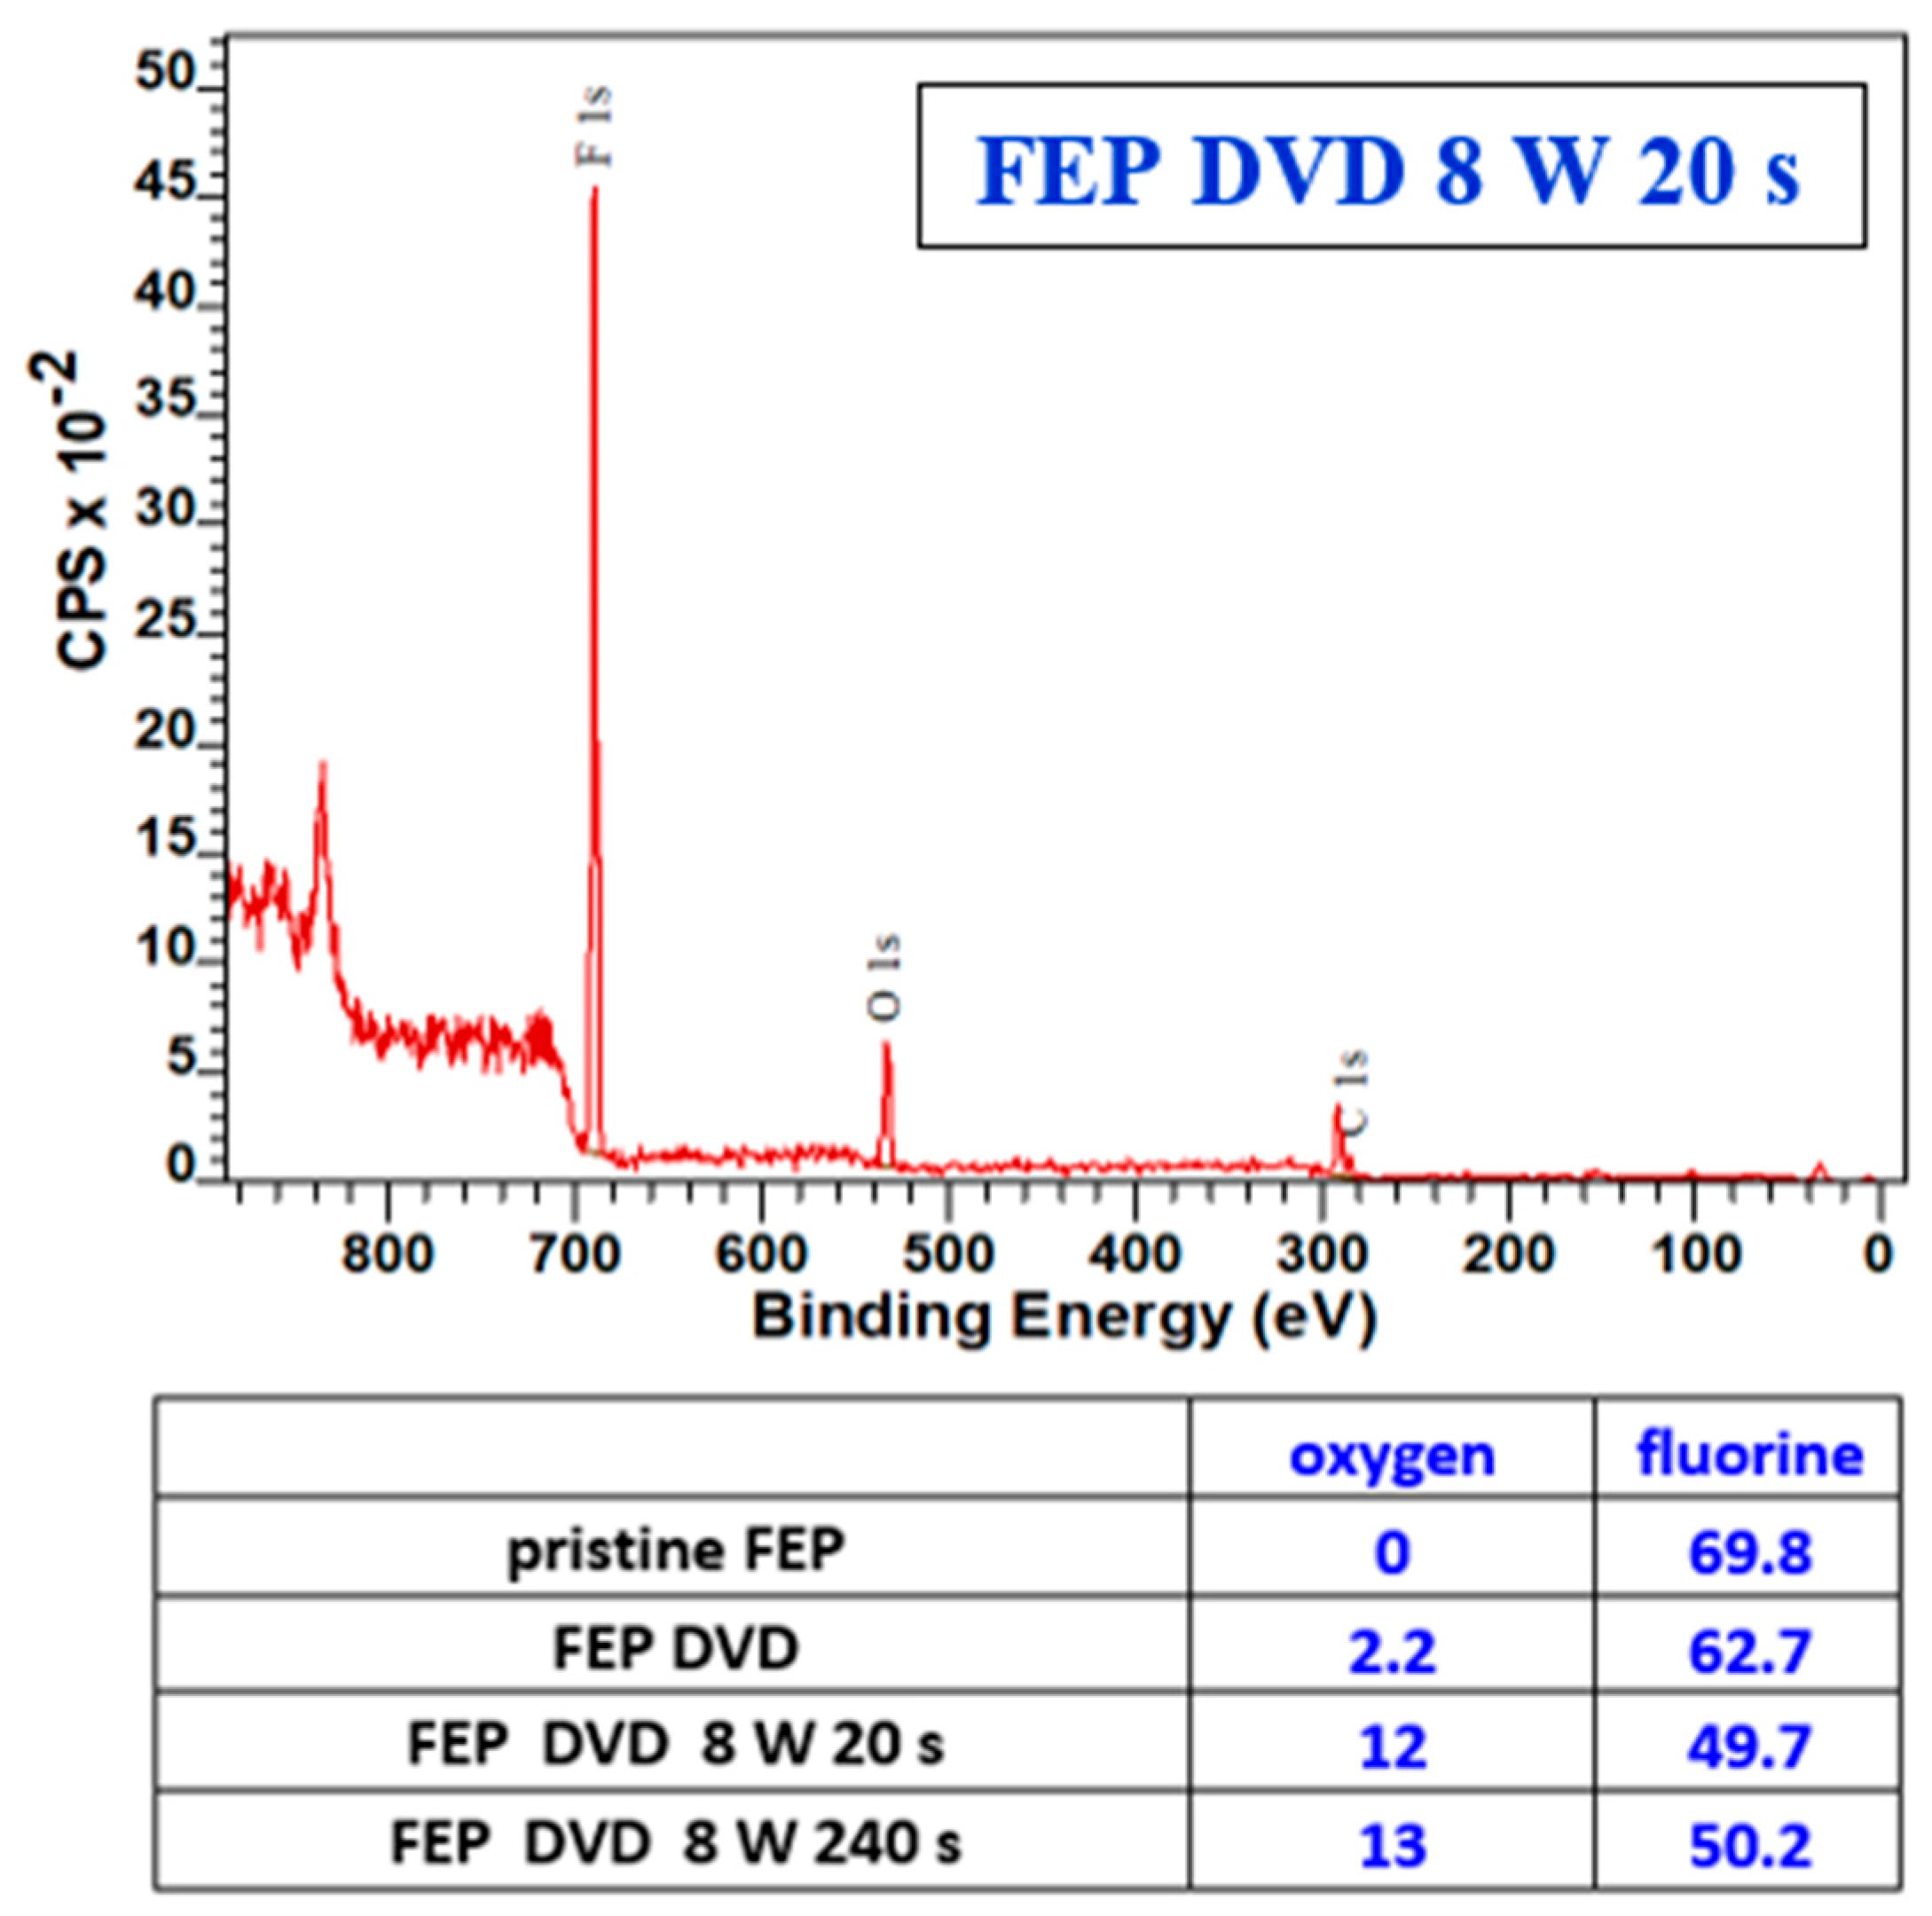
Figure 9.
Zeta-potential (method HS) of pristine FEP, pristine FEP with a replicated DVD pattern (FEP DVD), and this sample subsequently exposed to plasma power of 8 W for exposure times of 20 s and 240 s.
Figure 9.
Zeta-potential (method HS) of pristine FEP, pristine FEP with a replicated DVD pattern (FEP DVD), and this sample subsequently exposed to plasma power of 8 W for exposure times of 20 s and 240 s.
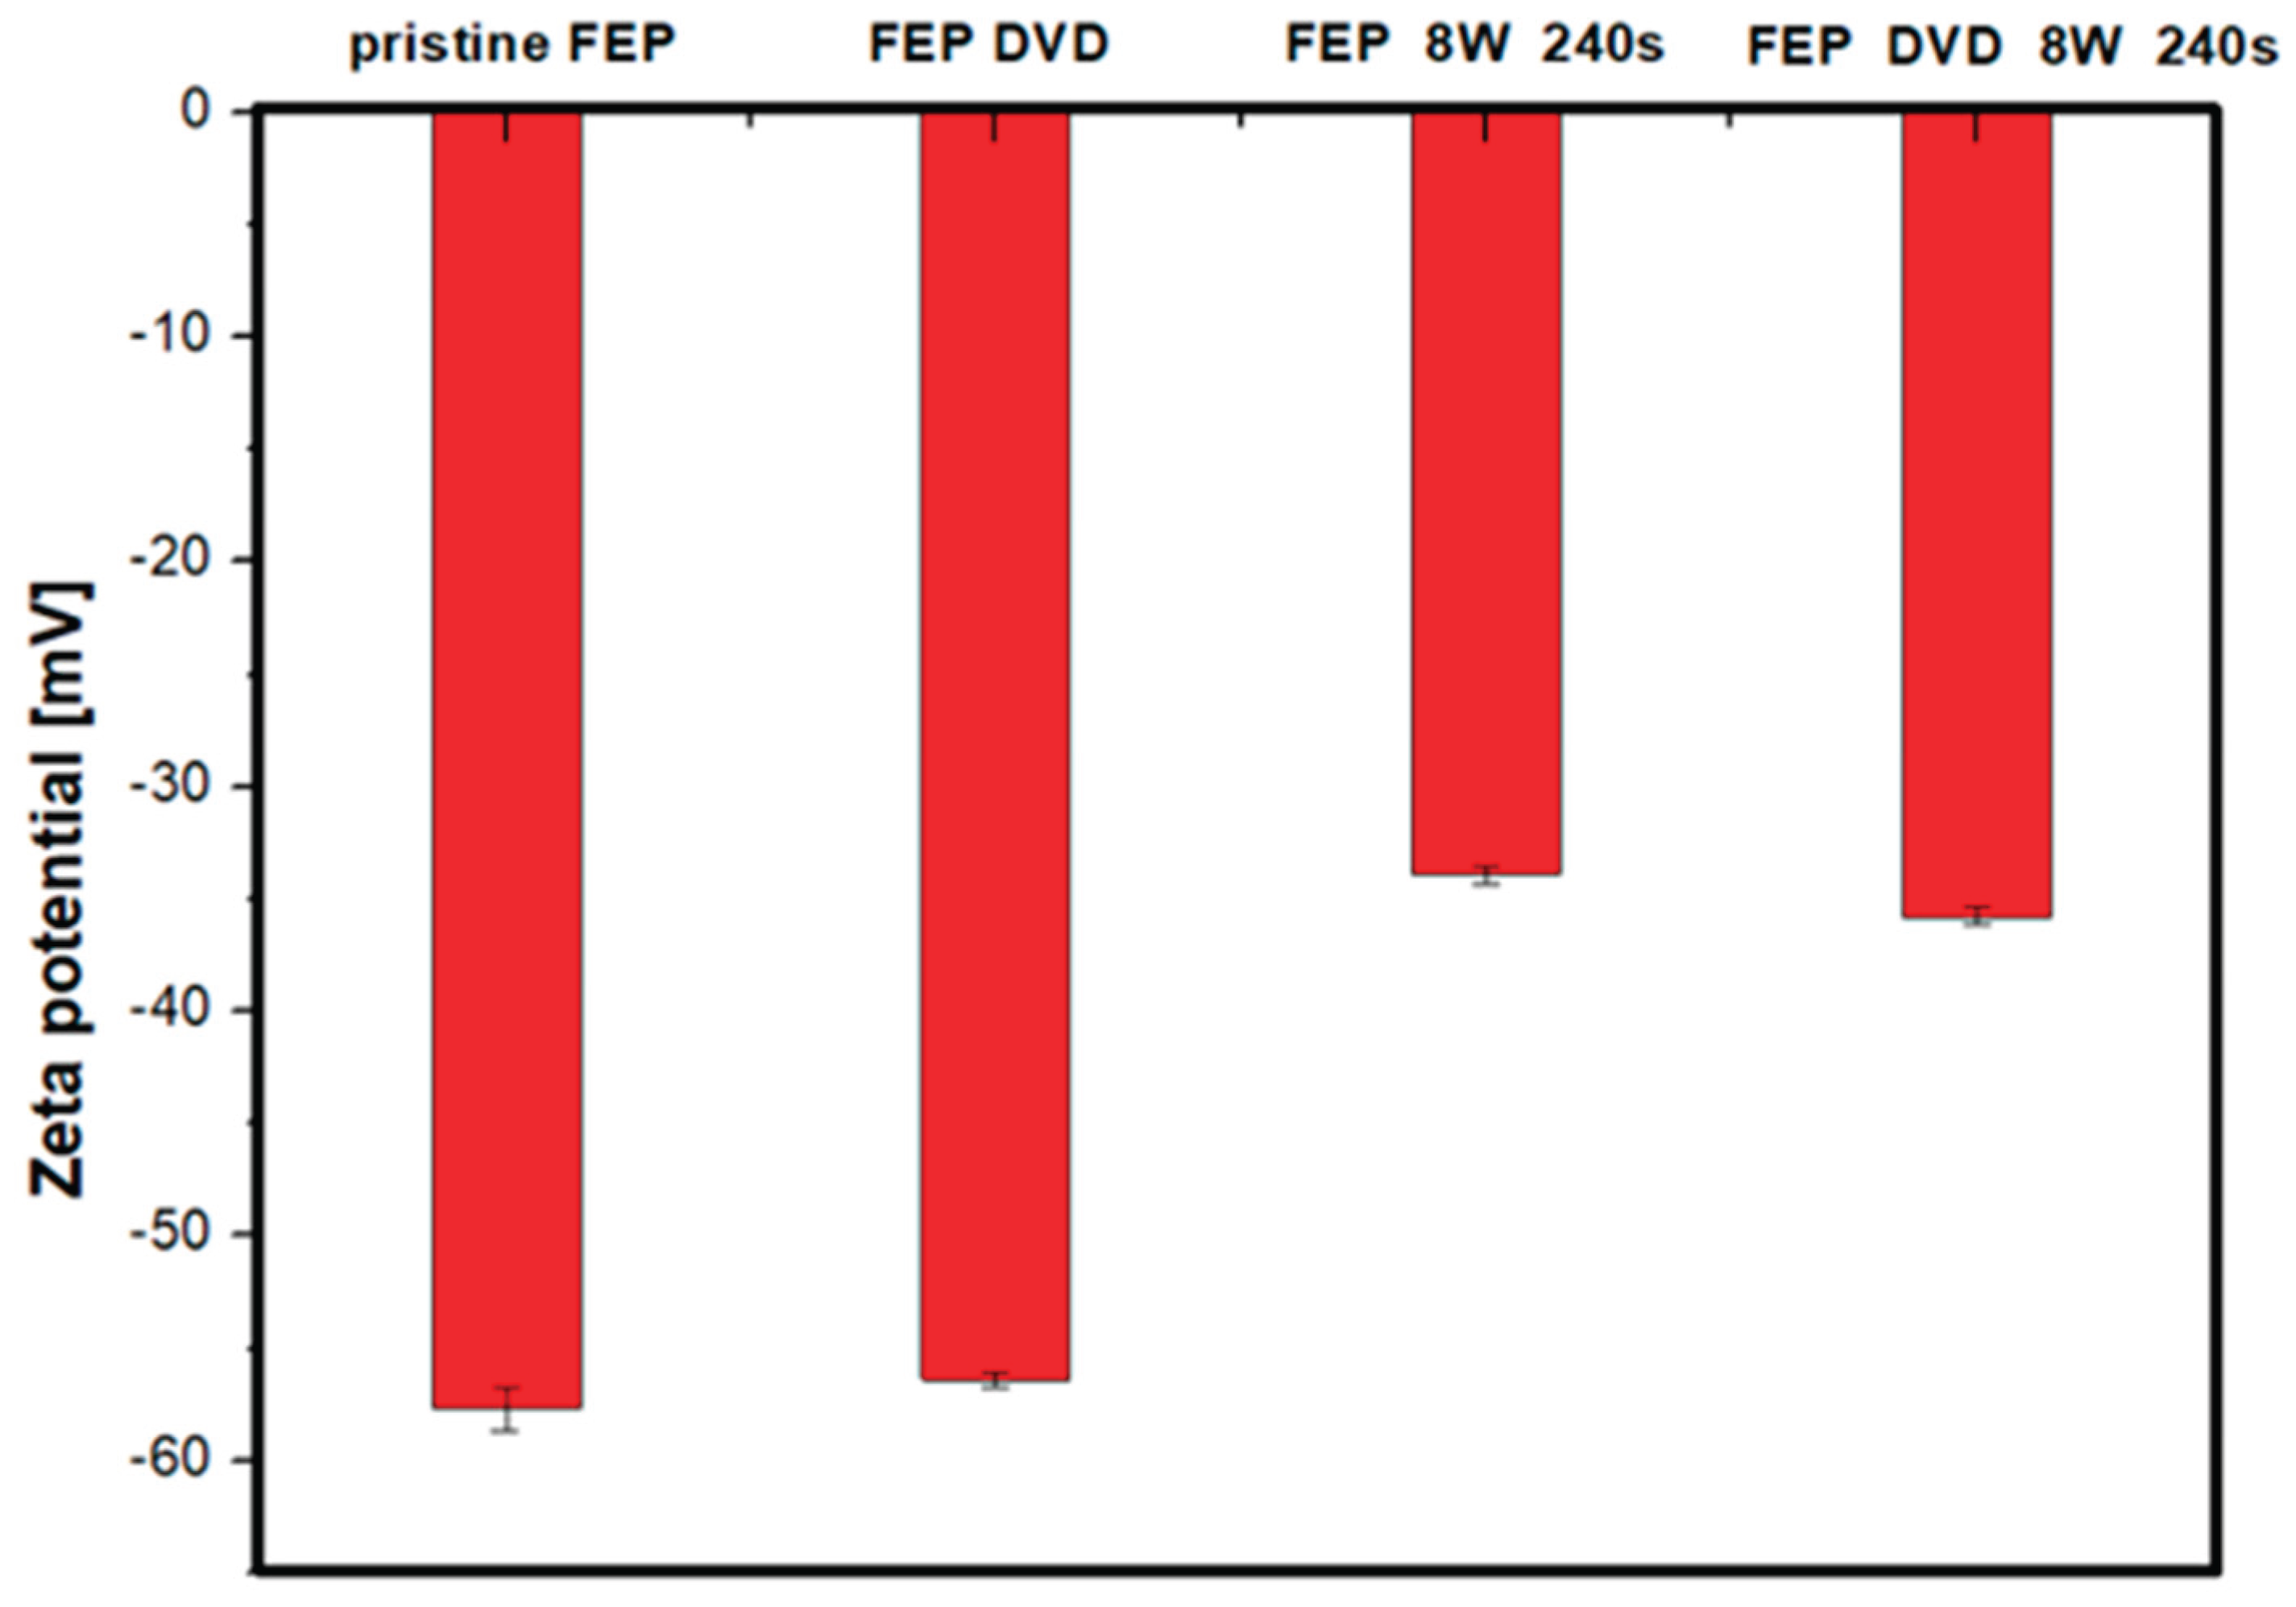
Figure 10.
Metabolic activity of human Wharton’s jelly-derived MSCs growing on differentially treated FEP substrates and control tissue culture polystyrene (Ctrl), determined by resazurin assay at 1 and 3 days post-seeding. Data are represented as Mean ± SD. (°) indicates a statistically significant difference (p < 0.05) compared to the control group; (*) indicates a statistically significant difference (p < 0.05) between untreated and plasma-treated FEP samples in the same time interval. One-way ANOVA, Student–Newman–Keuls method, p ≤ 0.05.
Figure 10.
Metabolic activity of human Wharton’s jelly-derived MSCs growing on differentially treated FEP substrates and control tissue culture polystyrene (Ctrl), determined by resazurin assay at 1 and 3 days post-seeding. Data are represented as Mean ± SD. (°) indicates a statistically significant difference (p < 0.05) compared to the control group; (*) indicates a statistically significant difference (p < 0.05) between untreated and plasma-treated FEP samples in the same time interval. One-way ANOVA, Student–Newman–Keuls method, p ≤ 0.05.
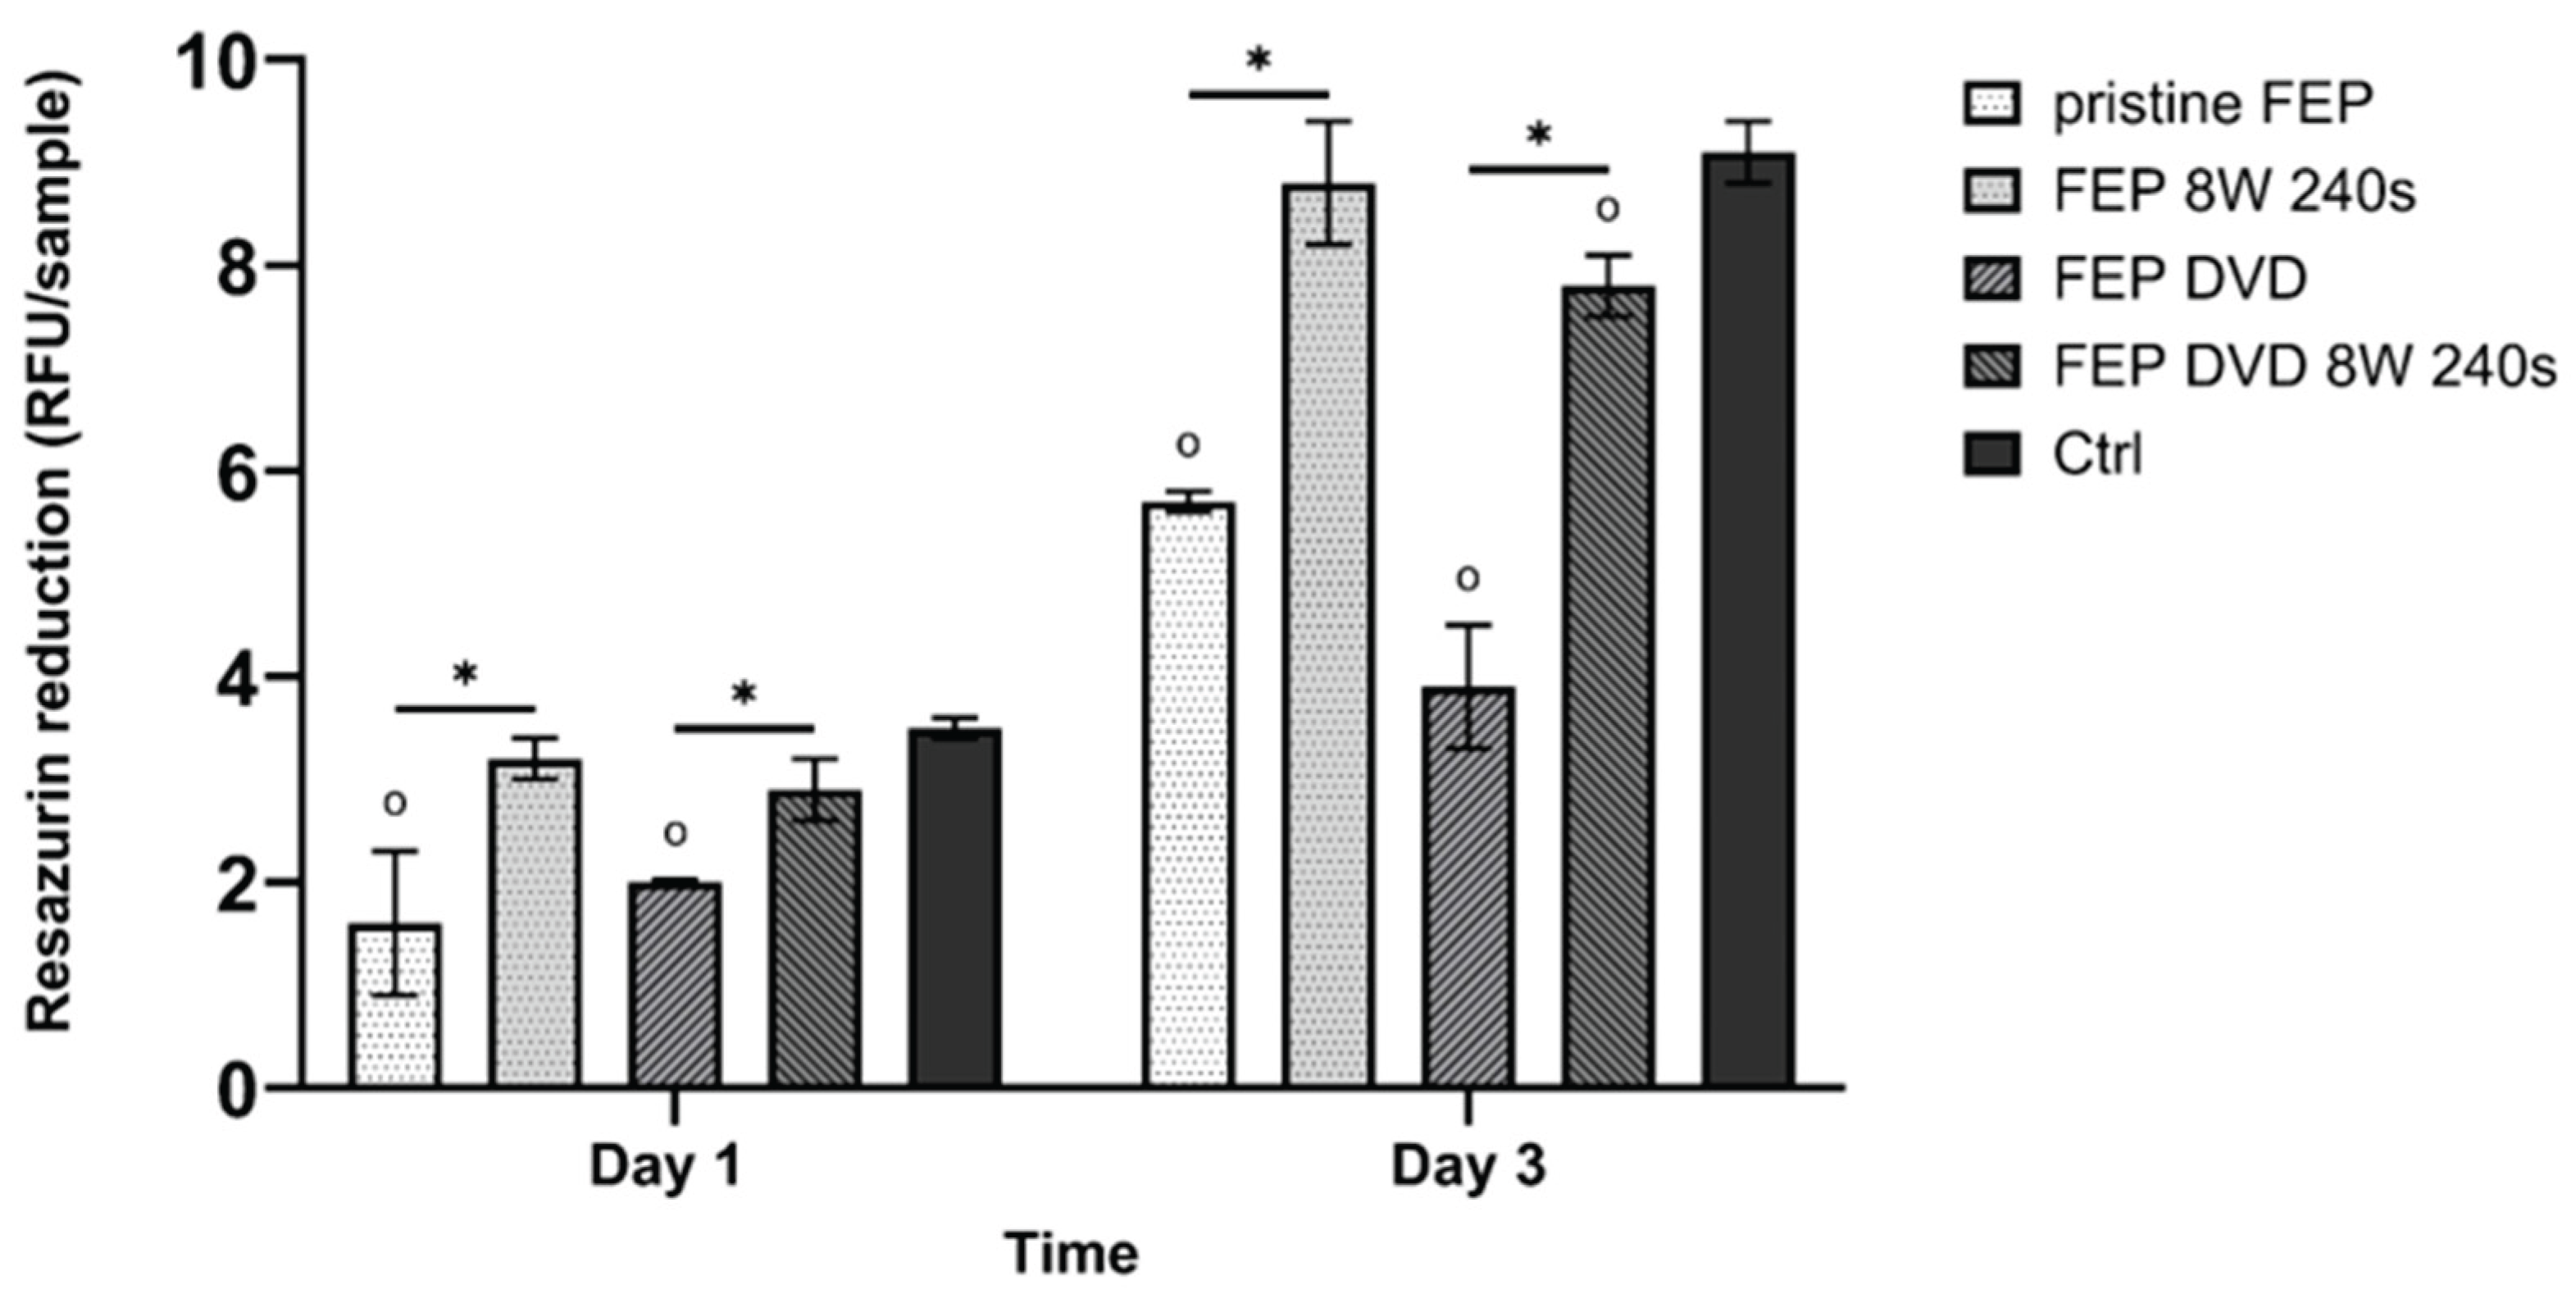
Figure 11.
Fluorescence microscopy images of human Wharton’s jelly-derived MSCs on day 1 (left column) and day 3 (right column) post-seeding on control tissue culture polystyrene (A, B) pristine FEP (C, D), FEP treated only by plasma 8W 240 s (E, F), FEP treated only by DVD replication (G, H) and FEP treated by both DVD-replication and plasma 8W 240 s. Cell nuclei stained with Hoechst (blue), F-actin labelled with phalloidin-Atto 488 (green). The scale bar = 100 μm.
Figure 11.
Fluorescence microscopy images of human Wharton’s jelly-derived MSCs on day 1 (left column) and day 3 (right column) post-seeding on control tissue culture polystyrene (A, B) pristine FEP (C, D), FEP treated only by plasma 8W 240 s (E, F), FEP treated only by DVD replication (G, H) and FEP treated by both DVD-replication and plasma 8W 240 s. Cell nuclei stained with Hoechst (blue), F-actin labelled with phalloidin-Atto 488 (green). The scale bar = 100 μm.
Disclaimer/Publisher’s Note: The statements, opinions and data contained in all publications are solely those of the individual author(s) and contributor(s) and not of MDPI and/or the editor(s). MDPI and/or the editor(s) disclaim responsibility for any injury to people or property resulting from any ideas, methods, instructions or products referred to in the content. |
© 2026 by the authors. Licensee MDPI, Basel, Switzerland. This article is an open access article distributed under the terms and conditions of the Creative Commons Attribution (CC BY) license (http://creativecommons.org/licenses/by/4.0/).
Copyright: This open access article is published under a Creative Commons CC BY 4.0 license, which permit the free download, distribution, and reuse, provided that the author and preprint are cited in any reuse.


