

Submitted:
24 June 2026
Posted:
25 June 2026
You are already at the latest version
Abstract
The study examined the relationship among climate finance (CF), Environmental Risk Accounting (ERA), and firm value for publicly listed non-financial firms in Nigeria and South Africa between 2010 and 2022. Using a carefully balanced panel sample consisting of 520 observations, we construct our independent variables as follows: Climate Finance (CF); Climate Financial Exposure (CFEI), using an AI-powered textual analysis approach; and Greenwashing Gap (GWG). Through fixed effects panel regression, our results indicate that while climate finance does not directly influence firm value, CF and the quality of ERA practices interact positively showing that CF only creates value conditional on high-quality ERA. Greenwashing risk has a negative impact on value creation, but ERA can significantly mitigate its negative impacts. Institutional differences across countries have consequences for the role of ERA. The application of difference-in-difference analysis through the adoption of King IV code by South African firms provides proof of the existence of an appreciable valuation premium by firms in South Africa after the intervention. The reliability of the findings is confirmed using methods such as IV-2SLS, System GMM, Propensity Score Matching, and the Heckman Selection Model. There are important ramifications of the findings for accounting practice and environmental policy within sub-Saharan Africa.
Keywords:
climate finance
; environmental risk accounting
; firm value
; greenwashing
; Nigeria
; South Africa
; Tobin’s Q
1. Introduction
Concerns about climate change have greatly impacted the setting in which corporate strategy and finance have been undertaken. In light of increased efforts by governments aimed at reducing greenhouse gas emissions through carbon prices, disclosures, and green finance initiatives (Giglio et al., 2021; Wang et al., 2022), corporations are now finding themselves increasingly obligated to direct capital towards their climate agendas. As such, apart from regulatory shifts in recent years, there has also been a shift by the UN's SDGs on the use of private climate finance as a means to sustainable development, with a financing gap that is more challenging in developing countries (Bracking, 2019; Carè et al., 2024). This is related to the fact that the question that occupies a lot of interest in modern finance is that of the link between climate finance made by firms and shareholder value (Giglio et al., 2021; Krueger, 2015). Thus, understanding how green finance or capital investment in climate actions affects a firm market value is important. This particular problem becomes even more apparent in Sub-Saharan Africa because different institutional frameworks create inherent differences in how climate finance responsibilities are created, enforced, and reported, making the region an ideal lab for experimentation that previous studies have overlooked.
Although the connection between spending in relation to climate and the financial performance of enterprises has been widely examined in academic literature, it cannot be said for sure whether it positively impacts company valuations and financial outcomes. As was suggested by Brooks and Oikonomou (2018) and Friede et al. (2015), environmental expenditures are associated with the provision of positive valuation effects, as firms will be able to foresee some advantages connected with meeting regulatory requirements and creating a good reputation. However, insufficient funds allocated for environmentally-oriented operations will lead to missed opportunities associated with better investments yielding higher benefits for enterprises (Ginglinger & Moreau, 2023; Kling et al., 2021). The problem of trade-offs mentioned above becomes especially urgent among firms operating in emerging markets due to additional complications connected with the development of a green finance market (Wang et al., 2022). The other sphere of research related to the topic of this study, but rather underdeveloped, is environmental risk accounting (ERA), which can be characterised as a procedure for quantification and disclosure of information about environmental risks and liabilities within the scope of corporate financial accounting. Since environmental risks are not disclosed in the sustainability performance narrative reports, ERA requires a comprehensive evaluation of these environmental risks and their quantifiability and audibility, similar to the approach used in financial accounting (Brooks & Schopohl, 2020; Gulluscio et al., 2020). In particular, according to Dhaliwal et al. (2011), voluntary environmental disclosures reduce the cost of equity capital, and Nyakuwanika and Panicker (2025) argue that the economic impacts of environmental disclosures are contingent upon the consistency of environmental accounting information and financial accounting information.
Past studies examining the association between the effect of climate finance and environmental risk disclosure on firm value have produced conflicting findings. For example, Huang (2022) finds a positive correlation between ESG factors and firm value, while Brooks and Oikonomou (2018) find that voluntary environmental disclosure is more likely to be strategic than performance-oriented. Busch and Friede (2018) discuss past research conducted regarding the subject matter and emphasise that the nature of the relationship between ESG factors and financial performance may be context-dependent. Given the above literature, it appears necessary to examine under what circumstances climate finance and environmental risk disclosure create or destroy firm value. To bridge this gap, this study applies the contingent resource-based view (CRBV) to serve as the theoretical perspective for this paper. As per the CRBV perspective, according to the hypothesis developed by Hart (1995) and then furthered by Aragon-Correa and Sharma (2003), environmental capabilities will fail to create competitive advantages unless accompanied by suitable internal resources and institutions. Climate finance constitutes environmental capabilities, whose financial significance depends on the efficacy of the environmental information reporting agency. The same is supported by the findings of Khan et al. (2016), indicating that the financial performance of material aspects of ESG is higher than non-materials.
There are two notable innovations made in methodology. First is the introduction of the Climate Financial Exposure Index (CFEI) at the company level, which employs the use of textual analytics based on annual reports, management commentaries, and sustainability disclosure to gauge future climate transition risks, physical climate risks, carbon strategy intensity, and adaptive preparedness, none of which can be quantified via expenditure-based indicators (Giglio et al., 2021; Li et al., 2024). Secondly, considering that greenwashing in firms' disclosures is not uncommon (Yang et al., 2025; Wang et al., 2025), the idea of greenwashing gap is introduced, which refers to the discrepancy between climate disclosure intensity and actual environmental performance. The choice of Nigeria and South Africa as the empirical case studies is rational and informed by a theoretical perspective. Firstly, both countries expose their climate risk while showing huge contrasts in institutional development and the sustainability reporting process. The higher development level of institutions in South Africa, including the introduction of King IV code and JSE Sustainability Index, implies mandatory disclosure of climate risk information and implementation of integrated reporting (King IV, 2016). On the contrary, the presence of a fragmented regulatory system in Nigeria results in sustainability reporting being performed voluntarily, with no easy access to green finance available (Chukwudi, 2023; Abdullahi & Abubakar, 2023). The problem with this mismatch between institutions, however, is not merely that it is the setting for the analysis, but rather that it serves as an empirical example of exogenous variation. The King IV code of corporate governance in South Africa constitutes a form of natural experiment because there is a shock to the regulations, such that firms have no option but to comply with the regulation at a certain point in time. On the contrary, Nigeria serves as a counterfactual because its firms have voluntarily disclosed their information. Therefore, the comparison of the two countries provides an excellent platform for investigating the impact of climate finance on firm value under different institutional conditions (Ioannou & Serafeim, 2012). Secondly, King IV initiatives in South Africa will create an opportunity to conduct a difference-in-differences analysis on the influence of climate finance on firm value (Ginglinger & Moreau, 2023).
This paper contributes to four main ways. First, it expands on current climate finance literature through an investigation into Tobin's Q as a forward-looking market output variable (Wongsinhirun et al., 2026). Second, it introduces ERA as a moderator to the climate finance and firm value relationship by merging both the accounting and finance literature perspectives, rarely brought together in prior works (Dhaliwal et al., 2011; Nyakuwanika & Panicker, 2025). Third, this paper constructs CFEI and greenwashing gap as innovative indices for the measurement of climate finance legitimacy in emerging African markets. Fourth, by leveraging the regulatory changes brought about by the King IV code as a quasi-experiment, this study contributes towards Africa-specific literature grounded in empirical reality, considering its institutional diversity (Barnes & Perkins, 2025; Acemoglu & Robinson, 2012; Luiz & Charalambous, 2009). This leads to the fourth aspect, which may be considered the most distinct, that involves the comparative analysis of the two nations’ varying institutional settings through which this research can assess the role that ERA might play in a different way in instances of obligatory and voluntary disclosure settings. The structure of this paper is organised in the following manner: Section 2 provides a review of the literature and proposes hypotheses; Section 3 outlines the methodology; Section 4 presents empirical results; and Section 5 and Section 6 provides discussion and conclusions.
2. Literature Review and Hypothesis Development
2.1. Theoretical Framework
The theoretical basis of this study is the contingent resource-based view (CRBV), an extension of Hart's (1995) natural resource-based view. The premise of CRBV is that environmental capabilities become valuable when conditioned by the resource configurations and institutional environment in which they are found (Aragon-Correa & Sharma, 2003). Traditional resource-based view theory (Barney, 1991) focuses on resources which are valuable, rare, inimitable, and irreplaceable. Hart (1995) extends this concept to include environmental strategies such as pollution prevention, product stewardship, and sustainable development. This extension further states that the value of environmental resources is dependent on their contingency and institutional environment. Climate finance is an environmental capability that creates value for the firm through risk reduction in terms of regulations, development of good stakeholder relations and cost savings (Li et al., 2024; Huang et al., 2022). It requires supportive internal systems for the investments to create value. Therefore, ERA takes on the proposed role of providing environment-related liabilities that communicate through a financially transparent process, leading to increased investor trust (Dhaliwal et al., 2011; Brooks & Schopohl, 2020). In other words, with a high ERA system in place, a firm will be able to produce value-relevant information based on its climate finance, whereas a low ERA system will bring about perceptions regarding discretionary spending or greenwashing (Yang et al., 2025; Wang et al., 2025).
On the other hand, CRBV seeks to solve another problem regarding the divergence between environmental disclosure and investment, with greenwashing threats involved (Gulluscio et al., 2020; Nyakuwanika & Panicker, 2025). It is important to measure it with an index showing divergence between two variables. The more divergence there is, the more negatively it will impact the market value of climate finance due to credibility concerns, whereas a high ERA will assist with bridging the divergence gap (Yang et al., 2025; Liu et al., 2024). Institutional contingency is also presented as another factor of contingency in the theory. The national institutional environment affects sustainability performance and its consequences for the bottom line (Ioannou & Serafeim, 2012). Whereas corporate social responsibility (CSR) and environmental disclosure in Nigeria rely heavily on social pressures from the community, in South Africa, they are highly regulated, making the institutional environment advantageous for environmental accountability (Andreasson, 2011; Frynas, 2005; King IV, 2016). Thus, the lack of some institutional features in developing economies will adversely affect the process of turning environmental investments into economic gains (Khanna & Palepu, 2000; Zhao et al., 2014). The suggested theoretical framework, considering the relationships among climate finance, ERA, greenwashing risks, and firm value in terms of institutional contingency, suggests several specific hypotheses. It may be predicted that climate finance contributes to firm value only when ERA is relatively high, while greenwashing risk is relatively low. Additionally, it is important to examine the effects of such relationships on the differences between Nigeria and South Africa as two countries with different institutional environments.
2.2. Climate Finance and Firm Value
Climate finance refers to investments by the firm geared towards reducing greenhouse gas emissions, building climate resilience, or achieving a low-carbon operation system. Such operations have been found to be among the key determinants of performance of the firm (Flammer et al., 2021; Giglio et al., 2021; Wongsinhirun et al., 2026). The climate finance includes investment in green capital expenditures, renewable energy expenditures, pollution prevention expenditures, and issuing green/sustainability bonds (Carè et al., 2024; Bracking, 2019). Research has shown that such investments reduce risk and improve reputation, leading to favourable analysts' reviews and cost reductions (Li et al., 2024; Huang et al., 2022). Markets also compensate firms for their commitments by valuing their climate commitment favourably (Flammer et al., 2021; Secinaro et al., 2020).
From a theoretical perspective, climate finance increases firm value through the following channels. First, it reduces different types of risk and, therefore, the discount rate (Huang et al., 2022; Ginglinger & Moreau, 2023). Second, it generates reputational gains which enable firms to attract customers, institutional investment, and financing (Bagh et al., 2025; Berkman et al., 2019). Third, it improves operational efficiency through productive resource utilisation (Hart, 1995; Jo et al., 2016). However, this relationship is not always wholly positive because, according to one study, climate finance investments could actually be perceived as costly and wasteful in situations where governance issues prevail (Brooks & Oikonomou, 2018), while climate risk could aggravate financial constraints and the cost of capital (Ginglinger & Moreau, 2023). The same applies to developing countries because climate risk and underdeveloped financial institutions may affect the efficacy of value creation strategies, including in Nigeria, which has a less-developed framework of green finance than South Africa (Chukwudi, 2023; Abdullahi & Abubakar, 2023; Andreasson, 2011; Luiz & Charalambous, 2009).
Hypothesis 1: Climate finance is positively associated with firm value among listed firms in Nigeria and South Africa.
2.3. Environmental Risk Accounting and Firm Value
Environmental risk accounting (ERA) refers to the identification, measurement, allocation, and disclosure of environmental costs, liabilities, and risks in accounting records (Gulluscio et al., 2020; Brooks & Schopohl, 2020; Liu et al., 2024). Different from qualitative ESG disclosure practices, ERA considers the incorporation of environment-related matters in audited financial statements using accrual-based accounting concepts and principles. Examples of environmental risk accounting elements include environmental provision, environmental rehabilitation liability, carbon credits, and impairment arising from climate-related risks (Nyakuwanika & Panicker, 2025). In comparison to narrative environmental disclosures, ERA is more relevant and comparable. According to existing studies, high-quality environmental accounting enhances firm value because of improved information quality and reduced information asymmetry. Use of ESG or environment-related disclosures helps boost firm valuation through better estimation of cash flows and lower cost of capital (Huang, 2022), while sustainability reporting reduces forecasting errors and increases institutional ownership (Dhaliwal et al., 2011). Also, high-quality disclosure combined with strong environmental performance leads to enhanced financial performance (Al-Tuwaijri et al., 2004), while green accounting contributes to positive stock market reactions, especially among sophisticated investors (Sukmadilaga et al., 2023; Krueger, 2015; Berkman et al., 2019). The obtained outcomes can be explained by the voluntary disclosure theory because, when the disclosure is trustworthy, the problem of asymmetric information is removed (Verrecchia, 1983; Dye, 1985).
On the other hand, ERA has its shortcomings related to its costly nature, inconsistent character, and strategic disclosure approach. Disclosure may often be conducted for legitimation rather than true disclosure purposes (Brooks & Oikonomou, 2018; Gulluscio et al., 2020), and the lack of guidelines that would standardise environmental accounting makes it even more inconsistent, especially in Africa (Abdullahi & Abubakar, 2015; Frynas, 2005). Methodological inconsistency also prevents comparing results, and variations in ESG scores make the process even less valid (Liu et al., 2024; Berg et al., 2022). Nevertheless, there should be sufficient differences in ERA quality to see some valuation effects.
Hypothesis 2: Environmental risk accounting quality is positively associated with firm value among listed firms in Nigeria and South Africa.
2.4. Moderation, Greenwashing Risk, and Institutional Context
Climate finance gains significance in the presence of complementary information sources, including ERA (Hart, 1995; Aragon-Correa & Sharma, 2003). It is ERA that provides an informational framework to facilitate climate finance and make it an appropriate market signal. In its absence, climate finance may seem irrelevant or lack value. The right presence of ERA helps climate finance gain financial recognition and value relevance (Dhaliwal et al., 2011; Huang, 2022). In simpler terms, there is a moderation between climate finance and firm value. The literature supports this idea. ESG investment with materiality considerations yields higher financial returns (Khan et al., 2016). At the same time, credible climate disclosure leads to improved valuation impact (Yang et al., 2025). Finally, a structured climate action report improves investor reaction to climate finance (Chu et al., 2025; Wang et al., 2025). The second vital contribution relates to the introduction of the greenwashing risk, defined as the gap between environmental disclosure and performance (Wang et al., 2025; Dai et al., 2021). In case of a large discrepancy, it results in negative market valuation due to mistrust regarding the veracity of these claims (Yang et al., 2025). ERA helps solve this issue by ensuring that there is audit verification, hence no manipulation of the environmental statements, thus reducing credibility issues and improving the valuation of climate finance. An institutional context may affect the relations above. South Africa has an integrated reporting framework, also known as King IV, which serves as a great source of institutional motivation for environmentally friendly accounting (King IV, 2016; Andreasson, 2011). Conversely, Nigeria lacks the necessary regulatory mechanisms, and its reporting procedures are more informal, which makes ERA ineffective as well. In addition to the above-mentioned more general institutional theories, research results show that both legal and market developments influence the effectiveness of disclosure (La Porta et al., 1998; Khanna & Palepu, 2000; Ioannou & Serafeim, 2012; Zhao et al., 2014). Thus, it can be assumed that climate finance will produce more valuable effects in South Africa due to the higher level of developed green finance mechanisms and knowledge of investors (Kling et al., 2021; Carè et al., 2024).
Hypothesis 3: Environmental risk accounting quality positively moderates the relationship between climate finance and firm value, such that the relationship is stronger when ERA quality is high and weaker when greenwashing risk is high.
Hypothesis 4: The positive associations between climate finance, environmental risk accounting, and firm value are stronger in South Africa than in Nigeria due to institutional differences in environmental regulation and financial market development.
3. Data and Methodology
3.1. Sample and Data Sources
The sample consists of listed non-financial firms from Nigeria and South Africa in the period between 2010 and 2022, and it is compiled from various databases. The firm-level financial information is derived from Refinitiv Eikon (Worldscope), providing standardised firm-level accounting data for EM firms. Information regarding ESG performance and environmental disclosure needed for the calculation of the ERA index is extracted from Refinitiv ESG data, similar to the approach utilised in prior international literature, namely the research of Ioannou and Serafeim (2012) and Sukmadilaga et al. (2023). Missing climate finance data is manually retrieved from annual reports, sustainability reports, and integrated reports of listed firms on NGX and JSE following the methodological approach of Dhaliwal et al. (2011) and Liu et al. (2024). Textual analysis technique similar to the one used in studies conducted by Li et al. (2024) and Giglio et al. (2021) is employed to construct the CFEI. Information regarding macroeconomic variables (economic growth, inflation, and financial development) is collected from the World Bank WDI database (Kling et al., 2021; Carè et al., 2024).
Similar to previous studies (Wongsinhirun et al., 2026), the financial and utility sectors are also not included due to different regulatory policies that affect the environmental performance and business model (Ginglinger & Moreau, 2023). The observations where data on the independent variables are not available and those considered as outliers as a result of winsorizing on all continuous variables within the 1st and 99th percentiles are also dropped. Year and industry fixed effect is controlled in order to control external disturbance on the macroeconomic and industrial level. The sampled firms are available in Appendix A1, which indicates that twenty firms were selected from each of the two countries.
The reason for this design approach lies in the idea of polar matching, which refers to matched pairs comparison design (Eisenhardt, 1989; Pettigrew, 1990), and not representative sampling design: Nigeria and South Africa have been selected on purpose because of the high levels of institutionality on one side and low levels of institutionality on the other side in Sub-Saharan Africa – mandatory vs. voluntary disclosure requirements concerning climate change in order to gain the highest degree of the explanation from King IV quasi-experiment design as explained in section 1, but not for getting representative sample of African listed firms. Therefore, the sample size (N=520 firm-years, 40 firms) will be sufficient for theoretical testing purposes, but not for drawing any general conclusions.
3.2. Variable Measurement
Dependent Variable: Firm Value.
Tobin's Q is used as a proxy for value and refers to the ratio of the sum of equity market value and total debt value to total assets (Huang, 2022; Flammer et al., 2021; Brooks & Oikonomou, 2018). Tobin's Q considers prospects and thus is an accurate measure to estimate the impacts of climate-related investments over time (Yang et al., 2025; Al-Tuwaijri et al., 2004).
Independent Variable: Climate Finance (CF)
For climate finance, a composite index was considered, which comprises of (i) environmental capital expenditures intensity, (ii) pollution abatement and compliance costs intensity, and (iii) green or sustainability-linked financing instruments (Jo et al., 2016; Flammer et al., 2021). This composite measure was then standardised and calculated as a mean value to calculate the climate finance index. Where there are low or no disclosures in case of any firm's data, dummy variables created on the basis of the firm's annual report were incorporated (Dhaliwal et al., 2011; Liu et al., 2024).
Climate Financial Exposure Index (CFEI).
CFEI is built upon AI-assisted textual analysis of MD&A and sustainability reporting that integrates five dimensions: (i) transition risk, (ii) physical risk, (iii) carbon strategy, (iv) resilience/adaptation, and (v) green innovation orientation. Keywords frequency is scored by sentiment weights through FinBERT that enables distinguishing between substance and boilerplate language (Li et al., 2024; Wang et al., 2022). The disclosure intensity is captured within the spectrum of the overall disclosure volume, adjusted for industry-year. The index was used as a convergent-validation and predictive variable for CF; construction and validation details are reported in Section 3.2.1.
Greenwashing Gap (GWG).
The greenwashing gap stands for the discrepancy between climate disclosure intensity (scaled and standardised) and performance in terms of emissions reduction, pollution management, and environment certifications, as defined by Yang et al. (2025) and Wang et al. (2025). The positive values imply the discrepancy between the level of exaggerated disclosures relative to performance. The greenwashing gap was used in interaction with credibility indicators; its construction and validation are detailed in Section 3.2.1.
Moderating Variable: Environmental Risk Accounting (ERA).
The ERA quality is an aggregate index, taking into account four criteria for accounting disclosures of environmental expenses: (i) quantitative estimate of environmental provision and liability, (ii) recognition of carbon credits and rehabilitation liability, (iii) consistency of measurement of environmental expenses, and (iv) assurance of the external auditor. Each criterion is separately estimated using the range from 0 to 3 and then averaged in an index with the range from 0 to 1 (following Brooks & Schopohl, 2020; Gulluscio et al., 2020; Dhaliwal et al., 2011; and Liu et al., 2024).
3.2.1. Variable Construction and Validation Procedures
Construction process. Each of the three indices (CFEI, GWG, ERA) was constructed through systematic content analysis, rather than subjective coding, according to the coding manuals prepared for environmental disclosure studies by Clarkson et al. (2008) and Cho & Patten (2007). Two trained assistants, blind to both the identity of the companies and the hypotheses, manually coded a random sample of 25% firm-year data (130 out of 520) using a manual specifically created for each sub-category of scoring criteria. Krippendorff’s α was chosen to measure the reliability of inter-coder agreement and showed an inter-coder reliability of α = 0.81 for the ERA sub-score index and α = 0.76 for CFEI keyword relevance categories, which exceeds the traditional 0.70 content analysis standard (Krippendorff, 2004). All controversies were resolved by a third coder and then scored.
CFEI construction and validation. Construction of the keyword dictionary employed for the CFEI measure involved two stages: (i) creation of an initial seed list using the climate-related risk terminology glossaries of Li et al. (2024) and Sautner et al. (2023), modified to reflect the language used in the South African and Nigerian regulations such as King IV and NGX guidance notes on sustainability reporting; and (ii) word-embedding similarity search against a corpus comprising 60 randomly sampled annual reports, followed by the evaluation of the generated candidate list in terms of the relevancy of the results to select the words. FinBERT sentiment weights were calculated with the help of adaptation of the climate disclosure terms from Li et al. (2024) rather than the general financial sentiment lexicon, in order to discriminate between commitment language and boilerplate risk factor descriptions. The relationship between the CFEI and the Refinitiv ESG pillar of “Environmental Innovation” scores (where applicable, n = 312 firms) was r = 0.58 (p < 0.01), indicating that the index is measuring something similar yet different.
GWG construction and validation. Greenwashing gap, on the other hand, builds on the notion of disclosure-performance gap proposed by Marquis et al. (2016) and Walker & Wan (2012). The concept has been further developed for the case of climate change by Yang et al. (2025) and Wang et al. (2025). Disclosure intensity is defined as the standardized CFEI score, while the measure of environmental performance includes (a) changes in emissions intensity annually, (b) environmental violations/penalties recorded in annual and NGX/JSE filings, and (c) third party environmental certifications obtained by the firm. A placebo test revealed that the greenwashing gap is not a function of firm size or industry make-up because neither explains more than 6% of variance in GWG with these two factors considered alone.
ERA construction and validation. The scores for each of the four sub-dimensions of the ERA were determined on the basis of a coding scheme of values from 0 to 3, based on Gulluscio et al. (2020) and Brooks & Schopohl (2020), where 0 - none, 1 - qualitative narrative disclosure only, 2 - quantification without independent verification, and 3 - quantification with independent verification. For the sake of comparing the index with an existing scale, the scores of the South African subsample for ERA were compared to King IV self-reporting compliance assessments of a subset of 12 companies, producing a concordance of 92% in terms of the assurance sub-dimension (ERA4). To our knowledge, there are no such external benchmarks for the Nigerian companies due to the institutional deficit under consideration by this paper.
We emphasize that although we have attempted to develop the indexes in the most reliable way possible, all three indexes are still at least partially based on the coding schemes created by the researchers rather than company reports or audits.
3.3. Control Variables
Control variables at the firm- and country-level were selected according to the literature (Ioannou & Serafeim, 2012; Sukmadilaga et al., 2023; Wongsinhirun et al., 2026; Huang, 2022). At the firm level, control variables include: SIZE – the logarithm of total assets, LEV - total debt / total assets, ROA - net income / total assets; intensity of investments in CAPEX; intensity of R&D expenditures; sales growth (SGR); shares. In relation to control variables at the country level, the GDP growth rate (GDP), financial development (FD), and inflation rate (INFL) have been included to capture factors that could be influencing investment and environmental policy decisions (Ioannou & Serafeim, 2012; Kling et al., 2021; Carè et al., 2024). The use of a country dummy variable (D_SA), where D_SA = 1 when the country is South Africa, and D_SA = 0 when the country is Nigeria, has been made in order to capture differences in institutions.
3.4. Estimation Technique
To evaluate the relationship between climate financing, environmental risk accounting, and firm value, the within-group fixed effects panel regression estimator is the primary econometric approach used. Based on the results of the Hausman specification test, which was used to determine whether there is any systematic difference between the two models, the choice to opt for either a random effects or fixed effects estimator was determined. If the null hypothesis is rejected on account of such a systematic difference, then it implies that there is an omitted variable problem specific to each firm, necessitating the use of a fixed effects estimator. The variables for year, industry, and country fixed effects were included in the model in order to avoid the effect of time-invariant firm characteristics and other time fixed effects when evaluating the effect of climate finance on firm value. Because of the likelihood of having heteroscedasticity and serial correlation at the firm level in a panel data regression model, clustering of standard errors at the firm level were applied to all regressions. Standard errors clustered in firms turned out to be robust both to within-firm serial correlations and heteroskedasticity, resulting in valid inference regardless of how structurally complicated the error term turns out to be. The test of cross-sectional dependence according to Pesaran was used to determine whether there is a need for the panel-corrected standard errors.
The endogeneity problem of climate finance due to its being jointly determined along with firm value and ERA quality can be solved by the use of instrumental variables in two-stage least squares (IV-2SLS). The instrumental variable used was the climate finance intensity of the average of the industry minus the climate finance intensity of the particular firm under consideration, on the assumption that although climate finance of peer firms affects investment at the firm level through competition and standards, it certainly cannot affect the firm's value. This endogeneity problem was tested robustly with a Durbin-Wu-Hausman test. To mitigate the potential for selection bias because of the non-random use of green debt instruments, the Heckman two-step selection model was utilised, whereby the use of green debt instruments was estimated using the probit regression equation during stage one, and an inverse Mills ratio was included in the structural regression equation in stage two. Furthermore, propensity score matching was utilised to generate a matched sample of firms that receive high and low climate finance on the basis of similarities in observed variables, using the standardised bias metric post-matching.
3.5. Empirical Model
The specification used in estimating Hypothesis 1 regarding the main impact of climate finance on firm value includes the following OLS equation incorporating multi-dimensional fixed effects:
where i and t represent firm and year identifiers, respectively. FV stands for the key dependent variable, denoting firm value based on Tobin’s Q. The independent variable, CF, represents the firm-level climate finance index, which is the main variable of focus. CONTROLS, on the other hand, represents a set of control variables both at the firm level and at the country level, which are discussed further in section 3.3. The three types of fixed effects mentioned in this context include year fixed effect, industry fixed effect, and country fixed effect. It is expected that β1>0, which conforms to Hypothesis 1. As explained in the previous paragraph, the independent variables in the equation above are all lagged by one period, with standard errors clustered at the firm level following Wongsinhirun et al. (2026).
To test Hypothesis 2 concerning the influence of the quality of environmental risk accounting on firm value, Equation (1) was revised by adding ERA as shown below:
Where ERA stands for environmental risk accounting quality, which was explained in Section 3.2. According to Hypothesis 2, the coefficient β2 should be positive and significant. With the CF and ERA incorporated into Equation (2), it is possible to differentiate the value of environmental accounting quality from climate finance value.
To test Hypothesis 3 concerning the moderating effect of ERA on the relationship between climate finance and firm value due to greenwashing risks as a barrier, the following equation was revised as:
The first interaction term that is considered important in this paper is CF x ERA, whose coefficient is expected to be significantly positive, indicating that the effects of climate finance on firm value was enhanced by high-quality ERA systems. In contrast, it is expected that the coefficient of the second interaction term, CF x GWG, will be significantly negative, implying that the greenwashing gap reduces the impact of climate finance on firm valuation. Thus, this specification of interaction terms adds something new to past moderation analysis (Yang et al., 2025; Wang et al., 2025), since it considers the moderating effects of accounting credibility and greenwashing risk simultaneously.
To test the hypothesis H4 that focuses on institutional heterogeneity in Nigeria and South Africa, equations 1-3 will be estimated for both Nigerian and South African subsamples, as well as adding the country dummy variable D_SA into equation (3). Comparing the levels of significance of coefficients β1,β2, and β3 in Nigerian and South African samples will give an indication of how institutional differences can impact the relation between climate finance and firm values using the institutional comparison approach proposed by Ioannou and Serafeim (2012) and Zhao et al. (2014).
Further, taking into consideration the quasi-experimental approach suggested by Section 1, we utilise the DiD approach, applying the institutional change due to King IV integrated reporting in South Africa as an external shock for estimating the following regression model equation:
where Postt is an indicator equal to 1 for years following King IV adoption, and SAi is a firm-level indicator equal to 1 for South African firms. Three-way interaction terms represent the extra effect of King IV reforms on the relationship between climate finance and firm value and ERA and firm value in South Africa compared to Nigeria, which acts as the control group. It is expected that δ4 will be positive because the King IV reforms increased the valuation effect of climate finance in South Africa through higher ERA credibility and investor responsiveness towards environmental disclosure (Ginglinger & Moreau, 2023; Yang et al., 2025).
To address the issue of endogeneity arising from the joint determination of climate finance, ERA quality, and firm value, the IV-2SLS methodology is employed in which the average climate finance intensity of the industry is employed as the instrument for firm climate finance, as per the methodology of and Kaplan and Zingales (1997). In addition to this, propensity score matching and Heckman's two-step selection model are applied in order to address any potential selection bias, as firms with sound governance mechanisms may be choosing climate finance and environmental accounting. Definitions of all variables have been provided in Appendix A.
4. Results
In Table 1, there is a set of descriptive statistics of all firm-year data for further analysis, where Tobin's Q represents the major value indicator. Specifically, the mean of Tobin's Q amounts to 1.719, while its standard deviation equals 0.391, its minimum value is 1.080, and its maximum value is 2.515. These values are rather high and correspond to previous research that demonstrates heterogeneity of observations in EM panel data (Wongsinhirun et al., 2026; Huang, 2022). The mean of Climate Finance Index (CF) equals 0.231, its dispersion ranges from 0.080 to 0.460, while Climate Financial Exposure Index (CFEI) averages 0.317, which proves that mentions of climate change in corporate reporting are more than its expenditure, and, thus, the first evidence of greenwashing is obtained. The mean value of Greenwashing Gap (GWG) is equal to 0.052, which means that there is some overreporting of climate change in corporate reporting, but at a relatively low level. Meanwhile, the average value of ERA quality amounts to 0.367, which proves that most companies have ERA quality below the halfway point of the accounting quality indicator (0-1), which corresponds to previous results (Gulluscio et al., 2020; Nyakuwanika & Panicker, 2025).

Table 1.
Descriptive Statistics.
| Variable | N | Mean | Std. Dev. | Min | Median | Max |
|---|---|---|---|---|---|---|
| Firm Value | ||||||
| Tobin's Q (TQ) | 520 | 1.719 | 0.391 | 1.080 | 1.700 | 2.515 |
| Climate Finance | ||||||
| Climate Finance Index (CF) | 520 | 0.231 | 0.097 | 0.080 | 0.215 | 0.460 |
| Climate Financial Exposure Index (CFEI) | 520 | 0.317 | 0.147 | 0.090 | 0.290 | 0.615 |
| Environmental Accountability | ||||||
| Environmental Risk Accounting (ERA) | 520 | 0.367 | 0.156 | 0.120 | 0.340 | 0.670 |
| Greenwashing Gap (GWG) | 520 | 0.052 | 0.030 | 0.010 | 0.050 | 0.110 |
| Firm-Level Controls | ||||||
| Firm Size – ln(Total Assets) (SIZE) | 520 | 14.865 | 1.369 | 12.185 | 15.105 | 17.705 |
| Leverage (LEV) | 520 | 0.305 | 0.061 | 0.170 | 0.305 | 0.420 |
| Return on Assets (ROA) | 520 | 0.124 | 0.035 | 0.050 | 0.128 | 0.200 |
| Capital Expenditure Intensity (CAPEX) | 520 | 0.080 | 0.034 | 0.030 | 0.070 | 0.155 |
| R&D Expenditure Intensity (RD) | 520 | 0.018 | 0.018 | 0.000 | 0.010 | 0.060 |
| Sales Growth Rate (SGR) | 520 | 0.117 | 0.039 | 0.020 | 0.120 | 0.200 |
| Closely Held Shares (SHARES) | 520 | 0.398 | 0.077 | 0.255 | 0.385 | 0.550 |
| Country-Level Controls | ||||||
| GDP Growth Rate (GDP) | 520 | 1.602 | 3.098 | -6.960 | 1.890 | 7.840 |
| Financial Development (FD) | 520 | 85.088 | 69.804 | 14.200 | 79.350 | 163.700 |
| Inflation Rate (INFL) | 520 | 9.237 | 4.404 | 3.300 | 7.500 | 18.800 |
Notes: All continuous variables are winsorized at the 1st and 99th percentiles. TQ = FV.
Table 1.
a: Descriptive Statistics by Country.
| Variable | Nigeria (N = 260) Mean | Std. Dev. | Median | South Africa (N = 260) Mean | Std. Dev. | Median |
|---|---|---|---|---|---|---|
| Tobin's Q (TQ) | 1.393 | 0.193 | 1.360 | 2.046 | 0.236 | 2.040 |
| Climate Finance (CF) | 0.155 | 0.045 | 0.150 | 0.307 | 0.072 | 0.310 |
| Environmental Risk Accounting (ERA) | 0.229 | 0.058 | 0.230 | 0.505 | 0.086 | 0.513 |
| Climate Financial Exposure Index (CFEI) | 0.188 | 0.052 | 0.188 | 0.445 | 0.087 | 0.453 |
| Greenwashing Gap (GWG) | 0.080 | 0.015 | 0.080 | 0.025 | 0.009 | 0.020 |
| Firm Size (SIZE) | 13.697 | 0.822 | 13.713 | 16.029 | 0.605 | 16.025 |
| Leverage (LEV) | 0.315 | 0.064 | 0.318 | 0.295 | 0.057 | 0.300 |
| Return on Assets (ROA) | 0.111 | 0.034 | 0.110 | 0.138 | 0.031 | 0.140 |
| Capital Expenditure Intensity (CAPEX) | 0.058 | 0.020 | 0.055 | 0.102 | 0.030 | 0.110 |
| R&D Expenditure Intensity (RD) | 0.003 | 0.005 | 0.000 | 0.033 | 0.012 | 0.030 |
| Sales Growth Rate (SGR) | 0.118 | 0.041 | 0.120 | 0.117 | 0.038 | 0.120 |
| Closely Held Shares (SHARES) | 0.464 | 0.045 | 0.465 | 0.332 | 0.034 | 0.335 |
| GDP Growth Rate (GDP) | 2.700 | 3.007 | 2.345 | 0.503 | 2.788 | 1.530 |
| Financial Development (FD) | 15.500 | 0.626 | 15.600 | 154.677 | 6.409 | 155.800 |
| Inflation Rate (INFL) | 13.181 | 2.573 | 12.950 | 5.292 | 1.002 | 5.450 |
The second table, 1a analyzes the results presented on a per-country basis and emphasises cross-country discrepancies that are viewed as the main motivating factors for applying the institutional comparative research framework. For instance, according to the study findings, on average, firms registered in South Africa demonstrate a significantly higher value of the Tobin's Q index – 2.046 versus 1.393 observed in the case of Nigerian corporations, due to a higher capital market development level and better protection of investors' rights in South Africa (Luiz & Charalambous, 2009). Besides, there is also considerable discrepancy in terms of climate finance indicators – 0.307 vs. 0.155 for South African and Nigerian firms, respectively. The difference between the ERA indices of the two countries is even greater – 0.505 for South African firms against 0.229 for those based in Nigeria. The greenwashing gap observed in Nigeria (GWG = 0.080) is also considerably higher than in the case of South Africa (GWG = 0.025), indicating the existence of larger performance-disclosure gaps among firms operating in the latter country without any mandatory sustainability reports required (Chukwudi, 2023).
The Table 2 presents the output of the mean difference test for the difference between companies whose CF > 0.215 (median for the whole sample) and those whose CF < 0.215. The companies that have higher climate financing have significantly higher values of Tobin’s Q (2.025 vs. 1.412; difference = -0.613; t = -28.90; p < 0.001). As a result, the study concludes that our Hypothesis 1 is supported by the analysis. It is worth noting that companies with higher values of climate finance also demonstrate better ERA Quality, larger company size, higher ROA, and higher CAPEX/SALES ratio. This provides one more piece of evidence that companies with high CF also demonstrate better company governance and resource quality. Moreover, the difference in terms of growth does not appear to be statistically significant (t = 0.32; p = 0.748).
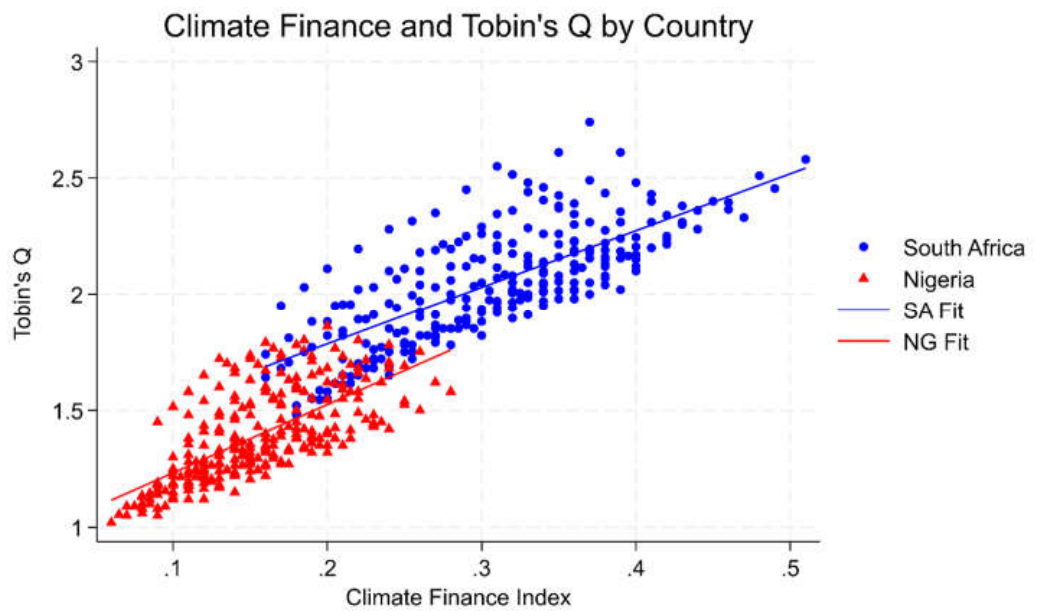
The correlation between climate finance and Tobin’s Q, illustrated separately for all countries in Figure 2, corroborates the results noted above. To start with, the coefficient for climate finance and the value of firms is rather high compared to that of Nigeria and, besides, is much less scattered, which means that the influence of climate finance on the valuation of firms depends on institutions. Lastly, the common area of support in Figure 1 guarantees enough overlap in the propensity scores for firms with and without climate finance.
Figure 1.
Propensity Scores Distribution.
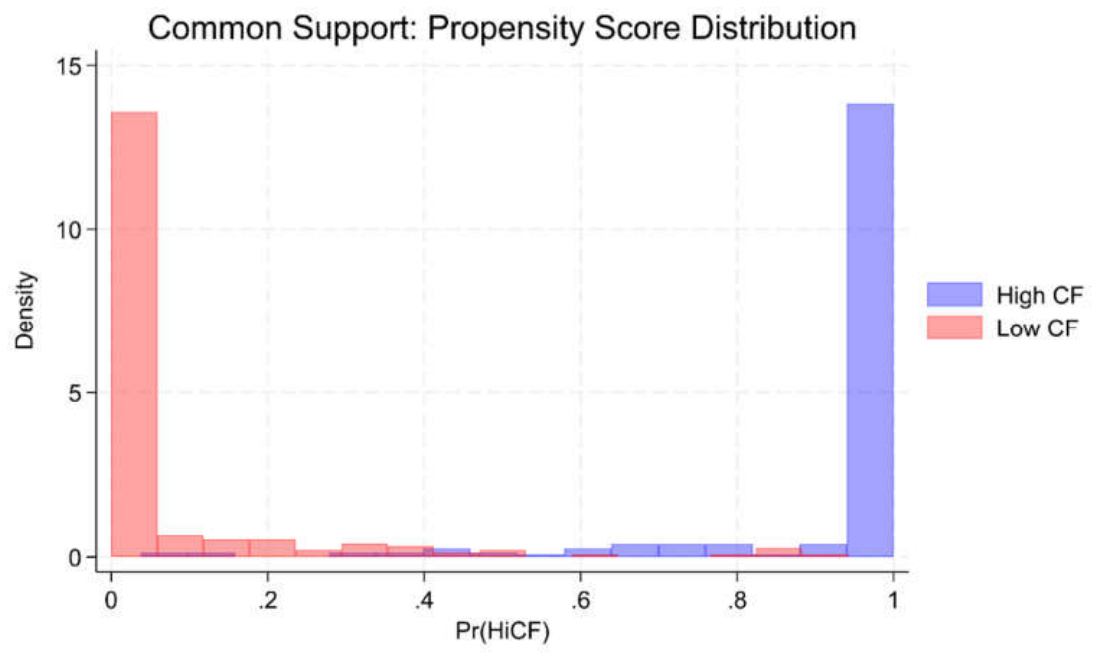
Figure 2.
Climate Finance and Tobin’s Q by Country.
The estimates of the fixed effects regression models with standard errors clustered by firm in four nested models are shown in Table 3. Model M1 includes only the CF variable and control variables. It was established that the CF coefficient is statistically insignificant (β = -0.075, p > 0.10), which means that CF itself does not improve Tobin's Q. This conclusion can be drawn in agreement with the theory that generic environmental actions are considered as costs and are devoid of value relevance in the absence of appropriate accounting procedures (Brooks & Oikonomou, 2018; Ginglinger & Moreau, 2023). Thus, the hypothesis is rejected.
Model M2 only includes ERA quality with controls. In this case, the ERA coefficient is also statistically insignificant (β = -0.335), while the CF coefficient remains statistically insignificant. It would be logical to assume that neither CF nor ERA affects the firm's value under fixed effects.
The interaction between CF and GWG variables is tested in Model M3a. In Model M3a, the interaction effect turns out to be highly significant and positive for Tobin's Q index (β = 1.322, p < 0.01). These results are consistent with Hypothesis 3 in light of CRBV's theoretical assumptions about complementarity between environmental capability and internal resources in generating competitive advantage (Hart, 1995; Aragon-Correa & Sharma, 2003). Moreover, company size becomes marginally significant (β = 0.193, p < 0.10) in this model, and the positive effect of ROA on Tobin's Q index is confirmed (β = 2.783, p < 0.01).
Model M3b includes both GWG and the interaction between CF and GWG variables and represents the most complete test of the proposed hypotheses. Importantly, the effect of GWG is extremely significant and negative (β = −7.686, p < 0.01) in this specification, thereby supporting Hypothesis 4 that companies incur negative effects from greenwashing behaviour. CF × GWG is significantly positive (β = 22.524, p < 0.01). Thus, the existence of climate finance investment and divergent greenwashing results in a degree of investors' scepticism towards such companies, which leads to an increase in the value of CF × ERA (β = 3.228) and proves the important moderating effect of ERA alone. CF becomes significantly negative (β = -2.137, p < 0.01). This means that climate finance investment alone does not create value; rather, it destroys it. Within-R² has gone up from 0.9845 in M1 to 0.9882 in M3b, and the interaction variables account for a large part of that increase. ROA turns out to be the most important variable affecting the value of Tobin's Q in all the regressions, FD is positively significant in most models, and inflation is positively significant in M3a and M3b, possibly because of nominal accounting reasons.
However, none of the leverage, CAPEX, R&D, or sales growth is significant in most models. CAPEX has a negligible impact on M1 and M2.
Regression results for Nigeria and South Africa subsamples are provided in the Table 4. In addition, the results of the regression analysis using pooled samples, where the interaction effects were incorporated in order to see whether there were any significant differences across countries regarding the relationship between climate finance and firm value, are discussed.
Regarding the Nigerian subsample, CF is positively and insignificantly related to firm value (CF = 2.071, p < 0.10), while the interaction CF × ERA variable is negatively and significantly related (β = −3.108, p < 0.05). Such a finding contradicts our expectations, thus suggesting that in Nigeria, the positive impact of CF may even be inverted at high ERA quality levels, this is caused either by the immaturity of the ERA framework to provide a proper evaluation of climate finance signal or by the excessive attention to ERA quality assessment despite the lack of the institutional recognition (Abdullahi & Abubakar, 2023; Frynas, 2005). ERA quality is positively and significantly correlated with firm value (β = 1.386, p < 0.01). GWG does not influence the dependent variable significantly in the Nigerian sample.
However, for the sub-sample of South Africa, the results are rather contrary to the ones mentioned above and provide better empirical support for Hypothesis 3. Firstly, there is a highly significant positive CF × ERA interaction term (β = 2.798, p < 0.01) that suggests the quality of ERA increases the effect of climate finance on stocks' performance. ERA itself is found to have a highly significant negative sign (β = -2.390, p < 0.05). The reason behind such a finding could be that there is a market accountability effect when higher market scrutiny affects those companies with high ERA ratings. GWG is also shown to have a mildly significant negative regression coefficient (β = -4.773, p < 0.10), suggesting risk pricing of disclosure credibility. As for the level of firm-level variables, SIZE has a highly significant positive value (β = 0.630, p < 0.01), while SGR has a significantly negative coefficient (β = -0.637, p < 0.05). Such a finding can be related to mean reversion in the context of fast-growing firms in South Africa.
The two triple interactions between CF × ERA × D_SA and CF × GWG × D_SA, shown in the third column of Table 5, are both statistically insignificant (β = -0.610, p > 0.10; β = 1.306, p > 0.10), indicating that the cross-national differences in the associations, observed in the subsample regression analysis, are not strong enough to meet the stringent requirement of interaction symmetry based on pooled test results. It seems that even though there are definitely cross-national directional differences in these associations, the institutional differences between countries do not seem to have reached the required level of difference for statistical asymmetry, which partially supports Hypothesis 4.
Results for the DiD estimations based on using the King IV adoption in South Africa as an exogenous institutional change can be seen in Table 5. Based on the basic DiD estimations, the POST variable has a positive coefficient and is statistically significant (β = 0.080; p < 0.05), which suggests that valuation performance has been improved since 2017 because of the positive effect of the global ESG trend dynamics on company valuations. Moreover, a triple interaction POST*SA_D is also positive and extremely statistically significant (β = 0.035; p < 0.01), meaning that South African companies have experienced the valuation boost due to the King IV adoption, confirming findings by Ginglinger and Moreau (2023) and suggesting that the credibility mechanism operates effectively in such a context. These results provide the ability to reject the Null hypothesis of the research (Hypothesis 4). However, the parallel trends test before the policy reveals a slightly significant F-value (F = 4.26; p = 0.046), meaning that the parallel trends assumption might be questioned. Lastly, the POST*CF*SA_D and POST*ERA*SA_D interactions in the full DiD models became insignificant due to the positive influence of King IV on all aspects of firm valuations.
Robustness Tests are presented in Table 6 and consist of six analyses. For Column (1), the IV-2SLS estimation employs industry average CF but excludes own firm CF as the instrument variable. The test for Endogeneity proves that CF is not endogenous, as indicated by the robust F-statistic of 0.038 (P-value = 0.846). The output from this robustness test provides support for the findings generated from the FE model analysis. On the other hand, Column (2) shows the result of the system GMM approach where the lagged dependent variable, L.TQ, is significantly positively related to TQ (β = 0.859, P-value < 0.01), suggesting persistent firm value. However, serial correlation of order 2 is observed (Z-value = -3.33, P-value = 0.001). However, Hansen J-statistic (p = 0.955) implies that the instrumental variables used here are not correlated with the error term, considering the problem of serial correlation. The third column represents the output of the PSM matching process using ATT of 0.025 (t = 0.64, p > 0.10), which implies that there is no proof regarding the issue of selection on observables based on the results from the baseline model. The fourth column utilises CFEI in place of CF. Based on its significance (β = 1.238, p < 0.05), we can conclude that forward-looking textual climate engagement also increases Tobin’s Q when interacting with ERA. Columns 5 and 6 represent a division of the sample into high and low GWG quintile groups. Correlation between CF*ERA among the low GWG subsample group is found to be positive and significant (β = 2.433, p < 0.01). This, again, makes a stronger case that ERA acts as the moderator in the relationship between CF and green value under low greenwashing conditions. Table 8 below is a representation of the Heckman two-step procedure for green debt issuance samples. The inverse Mills ratio (λ) is statistically insignificant (λ = -0.012, p = 0.665). Therefore, there was no effect of sample selection bias on the results above. In the result equation, ERA is positively significant (β = 2.496, p < 0.05), GWG is positively significant, but CF*GWG is negatively significant (β = -22.566, p < 0.05).
Table 7 highlights the Heckman Two-Stage Selection Model used in order to correct for any selection bias due to firms’ involvement in climate finance operations (CF3). Though Tobin’s Q was used as the outcome equation, climate financing operations were included in the selection equation. The main conclusions drawn from the analysis show that Climate Finance (CF) has a statistically insignificant negative relationship with firm value (β = -1.719). This means that climate finance operations generally do not have an effect on firm value after accounting for any potential sample selection bias. Conversely, Environmental Risk Accounting (ERA) has a positive relationship with the dependent variable (β = 2.496, p < 0.05), indicating that firms which have good practices in terms of environmental risk management and disclosure obtain high market valuation. Hence, the claim that ERA is market valued holds.
On the other hand, GWG has a strong positive influence on the value of the firm (β = 10.119, p < 0.01) even though its interaction effect with CF is negative and significant (β = -22.566, p < 0.05). Thus, even though it appears that there is a value premium associated with firms having a high level of GWG, the high use of climate finance may create suspicions among investors that the firm is engaging in greenwashing behaviour, which will reduce the firm's value. About control variables, SIZE is found to be positively associated with firm value, while LEV and CAPEX show an opposite relationship with the value of the firm, indicating that firms having more liabilities and investments are being penalised by the market. Firm value is also positively influenced by RD intensity and SGR. At the country level, the FD and D_SA dummy for South Africa are found to have a positive impact on firm value, whereas GDP and CPI decrease firm value.
The determinants of the occurrence of green bond issuances include factors such as ROA, CAPEX, SHARES, and FD, whereby financial development significantly increases the probability of issuance. Most important is the factor D_SA, which has a strong negative influence on the likelihood of selection; hence, this may highlight some structural differences between Nigeria and South Africa regarding green bond issuances. It is important to note that the inverse Mills ratio (λ = -0.012) is insignificant, meaning that there is no problem related to sample selection in the determination of the key variable.
These diagnostics in Table 8 show that the right estimation technique, namely fixed effects estimation techniques, has been chosen to estimate all of the estimations conducted in the study. According to the Hausman test, χ²(13) = 103.14 (p-value < 0.001), rejecting the model of the random effects estimator, given that firm-specific variables are highly correlated with independent variables. Modified Wald Test shows severe heteroskedasticity across the groups (χ²(40) = 9992.24; p-value < 0.001) while according to the Wooldridge test, the first order autocorrelation exists (F(1, 39) = 1074.14; p-value < 0.001). However, all of these problems are handled by means of clustering standard errors on the firm level. It allows for obtaining robust heteroskedasticity- and autocorrelation-consistent estimates without having to use additional transformations. Also, it should be noted that the Pesaran CD test shows that there is no cross-section dependency (z = -1.491; p-value = 0.136), therefore, the clustered estimator is more adequate for our case than the panel corrected estimation method. Given that the mean value of VIF equals 5.95, there is some multicollinearity, which, however, remains below the 10 threshold. Lastly, the PSM Balance statistic of 98.5% shows that there is a balance of covariates.
Table 8.
Diagnostic Test.
| Test | Statistic | p-value | Conclusion |
|---|---|---|---|
| Hausman (FE vs RE) | χ²(13) = 103.14 | 0.000 | Fixed effects preferred |
| Modified Wald (Heteroskedasticity) | χ²(40) = 9992.24 | 0.000 | Groupwise heteroskedasticity present |
| Wooldridge (Serial Correlation) | F(1, 39) = 1074.14 | 0.000 | First-order autocorrelation present |
| Pesaran CD Test | z = -1.491 | 0.136 | No cross-sectional dependence |
| Mean VIF | 5.95 | - | Moderate multicollinearity; acceptable |
| PSM Balance (B statistic) | 98.5% | - | Acceptable post-match balance |
5. Discussion
5.1. The Conditionality of Climate Finance Value
The main inference to be made from the results found in the results is that climate finance is not an elixir in terms of firm valuation because it helps generate firm value only when there is credible environmental risk accounting, and when the risk of greenwashing is low. Valid irrespective of all other potential variables, extend the resource-based approach, which is contingent on its application in Africa. Particularly, the positive relationship between CF and ERA in the base cases (Models M3a and M3b, Table 4) supports the theoretical position of Hart (1995), according to which environmental capability hinges on complementary internal processes that create economic value. With a high ERA, climate finance acts as a signal that indicates environmental spending that can be quantified and audited, thus reducing asymmetrical information. To the contrary, the negative effect of climate finance in M3b supports the “cost-of-resources” theory, since independent climate finance spending is perceived to be costly and inefficient, particularly by those firms working in environments characterised by weak governance (Brooks & Oikonomou, 2018; Ginglinger & Moreau, 2023). In this context, the negative relationship between CF and ERA in Nigeria (β = -3.108, p < 0.05) points to a valuation discount strategy that only makes sense in situations of weak institutions, in which the lack of compulsory requirements causes the high level of ERA to be viewed as a dispositive factor rather than as a dispositional factor, which requires institutions in order to be valued within markets. In a marked contrast to this is the situation in South Africa, where King IV aids ERA value recognition within the market (β = 2.798, p < 0.01).
5.2. The Greenwashing Penalty and the ERA Correction Mechanism
The highly significant negative effect of GWG (β = -7.686, p < 0.01 in M3b) provides one of the most powerful pieces of evidence in the emerging African market setting regarding the punishment for reporting expectations that exceed the firm's performance. In the case where companies find themselves in a position where their promises related to the environmental goal exceed the company's accomplishments, they suffer from depreciation, which corresponds with the concept of legitimacy degradation introduced by Yang et al. (2025) and Liu et al. (2024). Such findings become particularly crucial in the case of Nigeria, whose average GWG (0.080) surpasses the corresponding value for South Africa (0.025) more than three times, whereas the sustainability disclosure regulation in Nigeria is underdeveloped. Although the positive value of the coefficient of CF × GWG seems counterintuitive, the partial rescue effect suggests that companies that simultaneously invest significantly in climate finance when suffering from greenwashing problems can enjoy the additional advantage resulting from market expectations regarding better performance in the future due to the mentioned investment. Nevertheless, because of the dominant negative influence of GWG, the net effect of climate finance turns out to be negative.
ERA quality serves as a check and balance approach through this method. ERA is likely to enhance clarity of the information provided about environmental financing in instances where ERA values are high due to the quantification of environmental provisions, determination of rehabilitation responsibilities and third-party confirmation of environmental disclosures to mitigate risks associated with the authenticity of information disclosed regarding environmental financing (Gulluscio et al., 2020; Brooks & Schopohl, 2020). This can be seen through the evidence provided in Table 7, Column (5) and Column (6), since ERA adds the most value to climate finance in instances where disclosure is in agreement with performance in the low-GWG subsample. Another validation of ERA quality as a check and balances approach can be seen in the Heckman regression model, in which case the ERA quality variable still has a significant positive impact on the outcome equation even after green debt selection.
Moreover, application of the Heckman model (Table 8) adds still one more layer of complexity to the studied phenomenon. First of all, it needs to be mentioned that the presence of statistically significant positive impact of the GWG variable in isolation on firm value (β = 10.119, p < 0.01) together with negative coefficient of the interaction between CF × GWG (β = −22.566, p < 0.05) indicates the existence of a staged approach to penalizing firms for misrepresentation of their real environment-related results. In other words, markets are ready to reward firms for aggressive disclosure policy of theirs while remaining quite lenient to the incongruence between the disclosed performance data and actual results until the moment when the latter is revealed by means of climate financing.
5.3. Institutional Heterogeneity and the South Africa Premium
The analysis conducted at the country level highlights how the institutional environment influences the relationship between climate finance and firm value in a very profound way that cannot be captured using pooled models. The presence of a mandatory framework for integrated reporting (King IV), combined with a vibrant investor environment on the Johannesburg Stock Exchange, among others, makes climate finance and ERA more important in South Africa than in many other countries (King IV, 2016; Andreasson, 2011; Kling et al., 2021). It is not surprising that the sub-sample regression model finds that the interaction between climate finance and ERA is positive in South Africa (β = 2.798) but negative in Nigeria (β = -3.108).
Taking into consideration the involvement of the DiD model in this research, there is insight into the causal relationship regarding the institution under analysis. First of all, the fact of the substantially positive and high coefficient (β = 0.035; p < 0.01) of the POST × D_SA interaction term of the basic DiD model confirms that firms from South Africa have received the relative premium valuation owing to the adoption of King IV in 2017, taking time effects and other variations in firms into account on a global scale. As it has been mentioned by Ginglinger & Moreau (2023), such an impact can be caused by the influence of the regulatory environment regarding climate disclosure on financial incentives for environmental investments. In turn, the absence of statistically significant values of the triple interaction coefficients (CF × POST × D_SA and ERA × POST × D_SA) suggests that the effect of King IV is driven primarily through the mechanism of credibility aggregation (valuation floor increase).
In addition, the distinction between the macroeconomic and market environment of the two countries serves to create this disparity as well. The financial development index of South Africa stands at 154.7 (domestic private credit/GDP), while that of Nigeria is only 15.5, meaning that there is an opportunity for a ten times higher level of capital intermediation in South Africa for businesses engaging in green finance. Indeed, the empirical evidence is consistent with the findings of Carè et al. (2024) and Bracking (2019), who examine issues associated with green finance in low-income African countries. This is partly because of the increased levels of inflation (13.2% against 5.3%) and volatility of the GDP, making price assessment difficult.
5.4. Implications for Theory and Practice
In terms of theory, this paper is an expansion of CRBV because it shows that while the potential of value creation from environmental capabilities depends on external institutional legitimacy, the internal institutional legitimacy is also important, as environmental risk accounting quality complements climate finance in allowing for the conversion of environmental capabilities into economic value appreciated by investors. This value creation mechanism through environmental risk accounting quality has not been considered explicitly in the previous CRBV literature (Khan et al., 2016; Busch & Friede, 2018), and provides improvement to theory applicable to the wider field of ESG valuation research.
Firms cannot take advantage of climate finance as a value creator. They may end up destroying, rather than creating, value if they invest in green finance without developing the accounting quality of their environmental capability. The signal in this case carries immense significance for the businesses of Nigeria, as they have displayed a tendency to use disclosure as a means to seek legitimacy without following any accounting discipline in view of the high average GWG ratio. In contrast, this finding constitutes validation of the fact that South African companies have been able to establish an effective signalling system through integrated reporting, and further improvement in ERA quality would be vital in order to make the markets react to climate finance matters. Regarding the policymakers’ setters, the conclusions drawn from the study reveal one important policy implication that can be attributed to it, and this is related to creating mandatory accounting standards requiring the incorporation of climate liability in the financial statement reporting and not in the sustainability report. The ERA signalling system identified in the study differs from the ESG disclosure signalling strategy because it hinges on accounting credibility as opposed to disclosure intensity. The recommendation made here is consistent with the current proposals of the ISSB regarding financial materiality disclosures about climate matters. In terms of Nigerian regulatory authorities, especially FRCN, a possible course of action would be to adopt the disclosure of climate risk as suggested in the IFRS S2 developed by ISSB, based on the main principle in King IV of direct linkage between environmental risks and the financial consequences of such risks. It will be achieved through adoption on a graduated basis whereby it will be mandatory for large companies and voluntary for small companies, thus keeping the compliance cost low while solving the problem of greenwashing identified in Nigeria (GWG = 0.080 versus 0.025 in South Africa).
5.5. Limitations
The following limitations should be noted. First, the sampling of 40 companies from two countries has been done with the sole intention of conducting a polar comparison of cases and not a representative sample of African listed firms, which would affect the generality of the research findings as far as the institutions involved in this specific case are concerned. In this case, the choice made by the authors involves a trade-off whereby the internal validity of the study lies in the polar comparison of the mandatory and voluntary disclosure environment in the presence of an institutional shock (King IV), while compromising on statistical power as evidenced in Table 5 and other sections of the paper. Regardless, the findings from Table 5 and other areas in the paper are meant to be taken as evidence supporting the institutional theories in two polar countries and not the parameters of all Sub-Saharan Africa, sub-Saharan listed firms, or emerging markets. It would be better to conduct the study in more African countries for improving the external validity, but this is beyond the scope of this comparative case analysis.
Secondly, the ERA index is developed using an older methodology and is coded by the researchers. Thirdly, from Table 6, pre-treatment parallel trend tests (F = 4.26, p-value = 0.046) indicate that there was an obvious trend regarding the valuation before King IV in South Africa and Nigeria, which raises doubts about causality concerning the difference-in-differences estimations. These distinct trends are likely to arise from the structural differences between economic, commodity, and capital markets in South Africa and Nigeria, and not from the reaction to the regulation although the former cannot be entirely disentangled from the latter. In order to resolve the problem to some extent, we applied firm fixed effect with clustered standard error and country-level subsampling. Fourthly, due to the presence of AR(2) autocorrelation in the system GMM regression (p = 0.001), dynamic panel estimates may not be viewed as entirely reliable. For further research, it is recommended to expand the sample to other African countries.
6. Conclusion
This paper examines the effects of climate finance on the value of firms in relation to non-financial listed firms in Nigeria and South Africa during the period of 2010 to 2022, using the moderating role of environmental risk accounting quality and the risk of greenwashing. Based on the contingent resource-based view framework, we propose that climate finance will be able to create value for the firms only if there are adequate environmental accounting practices in place, and the environmental reports are a correct reflection of the firm's environmental performance. Using an exogenous identification of environmental accounting and climate finance, along with an adequately balanced sample size of 40 firms (N = 520), the findings tend to confirm our hypotheses. The major findings indicate that the positive effect of climate finance on Tobin's Q measure of value is moderated by environmental risk accounting quality. Specifically, the significantly positive interaction between climate finance and ERA quality supports the activation of market value in relation to climate finance due to ERA quality. In contrast, investment in climate finance does not have a positive effect on Tobin's Q and may reduce value. The gap is negatively related to firm value, hence suggesting that greenwashing in Nigeria and South Africa carries some sort of penalty from the markets in terms of penalties for climate disclosure intensity as well as environmental performance gap, albeit this is more evident in South Africa.
From a country perspective, an understanding can be learned about the differences in institutional settings among countries. Firms in South Africa operate within an environment where credibility concerning climate finance and ERA is highly regarded, leading to magnification of the positive CF x ERA interaction effect. The opposite holds in Nigeria, where firms have been struggling under dynamics that are opposite due to the poor disclosure structure and lack of green finance market development. Hence, it implies that the environmental accounting quality is too low to produce any kind of signal here. The difference-in-differences test shows that the implementation of King IV in South Africa led to an increase in firm value in 2017. The results are highly validated through all the robustness tests conducted via IV-2SLS estimation technique, system GMM, propensity score matching estimator, CFEI substitution, GWG subsampling, and Heckman correction for sample selection. Lack of significance in the inverse Mills ratio in the selection model and lack of endogeneity of the instrumental variables further demonstrate that the findings derived from this study are not influenced by any possible selection biases or reverse causation.
Regarding the contributions made by this paper in general, there are three main points. Firstly, this research empirically demonstrates the role of environmental risk accounting quality as a moderator in the relationship between climate finance and firm value, while previous literature assumes these two variables are identical, ignoring their differences. Secondly, the innovative indices proposed by this study, CFEI and GWG, provide a much more comprehensive assessment of climate finance legitimacy as compared to mere expenditure-based indicators. Furthermore, in this study, we provide a comparative view on two institutional settings in Africa - an area which lacks data in contrast to advanced economies in terms of past literature on climate finance – but we are not trying to extrapolate results of the firm level and country level analysis to stock exchange firms in Africa or emerging markets. In the context of the two markets analysed above, the most obvious policy implication for policy-makers in Nigeria and similar poorly regulated markets is to adopt mandatory and auditable ERA requirements that include climate change liabilities in accounting; it is an empirical question if the same holds true for other Sub-Saharan African markets with different institutional starting points.. The firms must realise that without adequate ERA, their investments in climate finance might become vulnerable to undervaluation within capital markets. Investors, on the other hand, need to take into consideration the quality of ERA and climate finance within one criterion for screening.
Appendix
Table A1.
Sampled Firms in Nigeria and South Africa (2010–2022).
| Firm ID | Firm Name | Country | Industry |
|---|---|---|---|
| 1 | Dangote Cement | Nigeria | Materials |
| 2 | BUA Cement Plc | Nigeria | Materials |
| 3 | Lafarge Africa | Nigeria | Materials |
| 4 | Nestlé Nigeria | Nigeria | Consumer Staples |
| 5 | Flour Mills Nigeria | Nigeria | Consumer Staples |
| 6 | Nigerian Breweries | Nigeria | Consumer Staples |
| 7 | Unilever Nigeria | Nigeria | Consumer Staples |
| 8 | Dangote Sugar | Nigeria | Consumer Staples |
| 9 | Cadbury Nigeria | Nigeria | Consumer Staples |
| 10 | Guinness Nigeria | Nigeria | Consumer Staples |
| 11 | MTN Nigeria | Nigeria | Telecom |
| 12 | Airtel Africa Nigeria | Nigeria | Telecom |
| 13 | Seplat Energy | Nigeria | Energy |
| 14 | TotalEnergies Nigeria | Nigeria | Energy |
| 15 | Conoil Plc | Nigeria | Energy |
| 16 | Okomu Oil Palm | Nigeria | Materials |
| 17 | Presco Plc | Nigeria | Materials |
| 18 | Nascon Allied | Nigeria | Materials |
| 19 | Julius Berger | Nigeria | Industrials |
| 20 | CCNN Plc | Nigeria | Materials |
| 21 | Anglo American SA | South Africa | Materials |
| 22 | Sasol Limited | South Africa | Energy |
| 23 | Shoprite Holdings | South Africa | Consumer Staples |
| 24 | MTN Group SA | South Africa | Telecom |
| 25 | Naspers Limited | South Africa | Consumer Discretionary |
| 26 | BHP Group | South Africa | Materials |
| 27 | Gold Fields | South Africa | Materials |
| 28 | AngloGold Ashanti | South Africa | Materials |
| 29 | Impala Platinum | South Africa | Materials |
| 30 | Sibanye Stillwater | South Africa | Materials |
| 31 | Woolworths Holdings | South Africa | Consumer Discretionary |
| 32 | Pick n Pay | South Africa | Consumer Staples |
| 33 | Vodacom Group | South Africa | Telecom |
| 34 | Telkom SA | South Africa | Telecom |
| 35 | Exxaro Resources | South Africa | Energy |
| 36 | Sappi Limited | South Africa | Materials |
| 37 | Tiger Brands | South Africa | Consumer Staples |
| 38 | AVI Limited | South Africa | Consumer Staples |
| 39 | Bidvest Group | South Africa | Industrials |
| 40 | Mondi Group | South Africa | Materials |
Table A2.
Variable Definitions and Data Sources.
| Variable | Symbol | Definition | Measurement | Source |
|---|---|---|---|---|
| Dependent Variable | ||||
| Firm Value | FV (TQ) | Tobin's Q: market value of equity plus book value of total debt, divided by total assets | (Market Cap + Total Debt) / Total Assets | Refinitiv Eikon |
| Primary Independent Variable | ||||
| Climate Finance Index | CF | Composite of three standardised components: environmental capex ratio, pollution abatement cost ratio, and green bond/loan issuance dummy | Mean of standardised (EnvCapex/TotalCapex), (EnvCost/OpCost), GreenDebt dummy | Refinitiv ESG; Annual Reports; JSE/NGX Filings |
| Env. Capex Ratio | CF1 | Environmental capital expenditure as a proportion of total capital expenditure | EnvCapex / TotalCapex | Refinitiv Eikon; Annual Reports |
| Pollution Abatement Ratio | CF2 | Pollution abatement and compliance costs as a proportion of total operating costs | EnvCost / TotalOpCost | Annual Reports; Sustainability Reports |
| Green Debt Dummy | CF3 | Binary: 1 if firm issued green bond, green loan, or sustainability-linked instrument in year t; 0 otherwise | Binary indicator | Bloomberg; Annual Reports |
| Climate Financial Exposure Index | ||||
| CFEI | CFEI | AI-assisted textual measure of forward-looking climate engagement from MD&A and sustainability disclosures. Captures transition risk, physical risk, carbon strategy, adaptation, and green innovation | Climate keyword frequency × FinBERT sentiment weight / Total disclosure volume; standardised within industry-year | Annual Reports; Sustainability Reports; NLP/FinBERT Processing |
| Greenwashing Gap | ||||
| Greenwashing Gap | GWG | Divergence between standardised climate disclosure intensity and standardised actual environmental performance | Std(Disclosure Intensity Score) - Std(Environmental Performance Score) | Refinitiv ESG; Annual Reports; Third-party Certifications |
| Moderating Variable | ||||
| ERA Quality Index | ERA | Composite index (0–1) scoring four dimensions of environmental risk accounting quality in annual financial statements and sustainability reports | Standardised sum of four sub-scores (each 0–3): quantified provisions, carbon/rehabilitation recognition, reporting consistency, third-party assurance | Annual Reports; Audit Reports; Sustainability Reports |
| ERA Dimension 1 | ERA1 | Disclosure of quantified environmental provisions and contingent liabilities | Scored 0–3 | Annual Financial Statements |
| ERA Dimension 2 | ERA2 | Recognition and measurement of carbon credits, rehabilitation obligations, pollution control assets | Scored 0–3 | Annual Financial Statements; Sustainability Reports |
| ERA Dimension 3 | ERA3 | Consistency and comparability of environmental cost reporting across periods | Scored 0–3 | Annual Reports (multi-year) |
| ERA Dimension 4 | ERA4 | Third-party assurance or auditor attestation of environmental accounting disclosures | Scored 0–3 | Audit Reports; Assurance Statements |
| Firm-Level Control Variables | ||||
| Firm Size | SIZE | Natural logarithm of total assets (USD thousands) | ln(Total Assets) | Refinitiv Eikon |
| Leverage | LEV | Total debt as a proportion of total assets | Total Debt / Total Assets | Refinitiv Eikon |
| Profitability | ROA | Net income divided by total assets | Net Income / Total Assets | Refinitiv Eikon |
| Capital Expenditure Intensity | CAPEX | Total capital expenditure divided by total assets | Total Capex / Total Assets | Refinitiv Eikon |
| R&D Expenditure | RD | Research and development expenditure divided by total assets; coded 0 where not disclosed | R&D Exp / Total Assets | Refinitiv Eikon; Annual Reports |
| Sales Growth | SGR | Year-on-year percentage change in total revenue | (Rev_t - Rev_{t-1}) / Rev_{t-1} | Refinitiv Eikon |
| Closely Held Shares | SHARES | Proportion of shares held by insiders and controlling shareholders | Insider Holdings / Total Shares Outstanding | Refinitiv Eikon; Company Filings |
| Country-Level Control Variables | ||||
| GDP Growth | GDP | Annual real GDP growth rate of the firm's home country | Annual % change in real GDP | World Bank WDI |
| Financial Development | FD | Ratio of domestic private credit to GDP, capturing depth of domestic financial markets | Private Credit / GDP | World Bank WDI; IMF IFS |
| Inflation Rate | INFL | Annual consumer price index inflation rate of the firm's home country | Annual % change in CPI | World Bank WDI |
| Country Indicator | D_SA | Binary indicator equal to 1 for South African firms and 0 for Nigerian firms | Binary | Sample construction |
| Post King IV | POST | Binary indicator equal to 1 for years 2017 and beyond (King IV effective date) | Binary (1 = 2017–2022; 0 = 2010–2016) | King IV (2016) |
| DiD Interaction | POST×SA | Interaction of POST and D_SA; captures King IV treatment effect on South African firms | POST × D_SA | Constructed |
References
- Abdullahi, A.; Abubakar, A. Challenges and Barriers to Sustainability Reporting in the Nigerian Context. FUDMA J. Account. Financ. Res. 2023, 1(3), 177–190. [Google Scholar] [CrossRef]
- Acemoglu, D.; Robinson, J. A. Why nations fail: The origins of power, prosperity, and poverty; Crown Publishers, 2012. [Google Scholar]
- Al-Tuwaijri, S. A.; Christensen, T. E.; Hughes, K. E. The relations among environmental disclosure, environmental performance, and economic performance: A simultaneous equations approach. Account. Organ. Soc. 2004, 29(5–6), 447–471. [Google Scholar] [CrossRef]
- Andreasson, S. Africa's development impasse: Rethinking the political economy of transformation; Zed Books, 2011. [Google Scholar]
- Aragon-Correa, J. A.; Sharma, S. A contingent resource-based view of proactive corporate environmental strategy. Acad. Manag. Rev. 2003, 28(1), 71–88. [Google Scholar] [CrossRef]
- Bagh, T.; Bouri, E.; Khan, M. A. Climate change sentiment, ESG practices and firm value: International insights. China Financ. Rev. Int. 2025, 15(3), 608–635. [Google Scholar] [CrossRef]
- Barnes, J.; Perkins, R. Climate finance and the legitimacy machine: Insights from the Green Climate Fund in South Africa. Environment and Planning E: Nature and Space 2026. Advance online publication. [Google Scholar] [CrossRef]
- Barney, J. Firm resources and sustained competitive advantage. J. Manag. 1991, 17(1), 99–120. [Google Scholar] [CrossRef]
- Berg, F.; Kölbel, J. F.; Rigobon, R. Aggregate confusion: The divergence of ESG ratings. Rev. Financ. 2022, 26(6), 1315–1344. [Google Scholar] [CrossRef]
- Berkman, H.; Jona, J.; Soderstrom, N. Firm value and government commitment to combating climate change. Pac.-Basin Financ. J. 2019, 53, 297–307. [Google Scholar] [CrossRef]
- Bracking, S. Financialisation, climate finance, and the calculative challenges of managing environmental change. Antipode 2019, 51(3), 709–729. [Google Scholar] [CrossRef]
- Brooks, C.; Oikonomou, I. The effects of environmental, social and governance disclosures and performance on firm value: A review of the literature in accounting and finance. Br. Account. Rev. 2018, 50(1), 1–15. [Google Scholar] [CrossRef]
- Brooks, C.; Schopohl, L. Green accounting and finance: Advancing research on environmental disclosure, value impacts and management control systems. SSRN Working Paper. 2020. Available online: https://papers.ssrn.com/sol3/papers.cfm?abstract_id=3741193.
- Busch, T.; Friede, G. The robustness of the corporate social and financial performance relation: A second-order meta-analysis. Corp. Soc. Responsib. Environ. Manag. 2018, 25(4), 583–608. [Google Scholar] [CrossRef]
- Carè, R.; Lehner, O.; Weber, O. Editorial overview: Climate finance, risks, and accounting. Curr. Opin. Environ. Sustain. 2024, 70, 101473. [Google Scholar] [CrossRef]
- Cho, C. H.; Patten, D. M. The role of environmental disclosures as tools of legitimacy: A research note. Account. Organ. Soc. 2007, 32(7–8), 639–647. [Google Scholar] [CrossRef]
- Chu, H.; Liu, N.; Tsang, A.; Zeng, X. Environmental risk, environmental action, and firm value: Evidence from climate-linked contracts. Aust. Account. Rev. 2025, 35(3), 215–240. [Google Scholar] [CrossRef]
- Chukwudi, J. The Legal and Regulatory Framework For ESG Reporting In Nigeria as A Means to Corporate Sustainability. Available at SSRN 4952335 2023. [Google Scholar] [CrossRef]
- Clarkson, P. M.; Li, Y.; Richardson, G. D.; Vasvari, F. P. Revisiting the relation between environmental performance and environmental disclosure: An empirical analysis. Account. Organ. Soc. 2008, 33(4–5), 303–327. [Google Scholar] [CrossRef]
- Dai, R.; Duan, R.; Liang, H.; Ng, L. Outsourcing climate change; European Corporate Governance Institute., 2021; Available online: https://papers.ssrn.com/sol3/papers.cfm?abstract_id=3765485(ECGI Finance Working Paper No. 723).
- Dhaliwal, D. S.; Li, O. Z.; Tsang, A.; Yang, Y. G. Voluntary nonfinancial disclosure and the cost of equity capital: The initiation of corporate social responsibility reporting. Account. Rev. 2011, 86(1), 59–100. [Google Scholar] [CrossRef]
- Dye, R. A. Disclosure of nonproprietary information. J. Account. Res. 1985, 23(1), 123–145. [Google Scholar] [CrossRef]
- Eisenhardt, K. M. Building theories from case study research. Acad. Manag. Rev. 1989, 14(4), 532–550. [Google Scholar] [CrossRef]
- Flammer, C.; Toffel, M. W.; Viswanathan, K. Shareholder activism and firms' voluntary disclosure of climate change risks. Strateg. Manag. J. 2021, 42(10), 1850–1879. [Google Scholar] [CrossRef]
- Friede, G.; Busch, T.; Bassen, A. ESG and financial performance: Aggregated evidence from more than 2000 empirical studies. J. Sustain. Financ. Invest. 2015, 5(4), 210–233. [Google Scholar] [CrossRef]
- Frynas, J. G. The false developmental promise of corporate social responsibility: Evidence from multinational oil companies. Int. Aff. 2005, 81(3), 581–598. [Google Scholar] [CrossRef]
- Giglio, S.; Kelly, B.; Stroebel, J. Climate finance. Annu. Rev. Financ. Econ. 2021, 13(1), 15–36. [Google Scholar] [CrossRef]
- Ginglinger, E.; Moreau, Q. Climate risk and capital structure. Manag. Sci. 2023, 69(12), 7492–7516. [Google Scholar] [CrossRef]
- Gulluscio, C.; Puntillo, P.; Luciani, V.; Huisingh, D. Climate change accounting and reporting: A systematic literature review. Sustainability 2020, 12(13), 5455. [Google Scholar] [CrossRef]
- Hart, S. L. A natural-resource-based view of the firm. Acad. Manag. Rev. 1995, 20(4), 986–1014. [Google Scholar] [CrossRef]
- Huang, D. Z. Environmental, social and governance factors and assessing firm value: Valuation, signalling and stakeholder perspectives. Account. Financ. 2022, 62(S1), 1983–2010. [Google Scholar] [CrossRef]
- Institute of Directors in South Africa. King IV report on corporate governance for South Africa; IoDSA, 2016. [Google Scholar]
- Ioannou, I.; Serafeim, G. What drives corporate social performance? The role of nation-level institutions. J. Int. Bus. Stud. 2012, 43(9), 834–864. [Google Scholar] [CrossRef]
- Jo, H.; Kim, H.; Park, K. Environmental costs and firm value. Asia-Pac. J. Financ. Stud. 2016, 45(6), 813–838. [Google Scholar] [CrossRef]
- Kaplan, S. N.; Zingales, L. Do investment-cash flow sensitivities provide useful measures of financing constraints? Q. J. Econ. 1997, 112(1), 169–215. [Google Scholar] [CrossRef]
- Khan, M.; Serafeim, G.; Yoon, A. Corporate sustainability: First evidence on materiality. Account. Rev. 2016, 91(6), 1697–1724. [Google Scholar] [CrossRef]
- Khanna, T.; Palepu, K. The future of business groups in emerging markets: Long-run evidence from Chile. Acad. Manag. J. 2000, 43(3), 268–285. [Google Scholar] [CrossRef] [PubMed]
- Kling, G.; Volz, U.; Murinde, V.; Ayas, S. The impact of climate vulnerability on firms' cost of capital and access to finance. World Dev. 2021, 137, 105131. [Google Scholar] [CrossRef]
- Krippendorff, K. Content analysis: An introduction to its methodology, 2nd ed.; Sage Publications, 2004. [Google Scholar]
- Krueger, P. Climate change and firm valuation: Evidence from a quasi-natural experiment; 2015; Available online: https://papers.ssrn.com/sol3/papers.cfm?abstract_id=2565523(Swiss Finance Institute Research Paper No. 15-40).
- La Porta, R.; Lopez-de-Silanes, F.; Shleifer, A.; Vishny, R. W. Law and finance. J. Political Econ. 1998, 106(6), 1113–1155. [Google Scholar] [CrossRef] [PubMed]
- Li, Q.; Shan, H.; Tang, Y.; Yao, V. Corporate climate risk: Measurements and responses. Rev. Financ. Stud. 2024, 37(6), 1778–1830. [Google Scholar] [CrossRef]
- Liu, J.; Zaman, R.; Atawnah, N.; Lehner, O. Guest editorial: Climate risk and environmental accounting in a world of change. J. Appl. Account. Res. 2024, 25(4), 777–782. [Google Scholar] [CrossRef]
- Luiz, J.; Charalambous, H. Factors influencing foreign direct investment of South African financial services firms in Sub-Saharan Africa. Int. Bus. Rev. 2009, 18(3), 305–317. [Google Scholar] [CrossRef]
- Marquis, C.; Toffel, M. W.; Zhou, Y. Scrutiny, norms, and selective disclosure: A global study of greenwashing. Organ. Sci. 2016, 27(2), 483–504. [Google Scholar] [CrossRef]
- Nyakuwanika, M.; Panicker, M. The role of environmental accounting in mitigating climate change: ESG disclosures and effective reporting—A systematic literature review. J. Risk Financ. Manag. 2025, 18(9), 480. [Google Scholar] [CrossRef]
- Pettigrew, A. M. Longitudinal field research on change: Theory and practice. Organ. Sci. 1990, 1(3), 267–292. [Google Scholar] [CrossRef]
- Sautner, Z.; van Lent, L.; Vilkov, G.; Zhang, R. Firm-level climate change exposure. J. Financ. 2023, 78(3), 1449–1498. [Google Scholar] [CrossRef]
- Secinaro, S.; Brescia, V.; Calandra, D.; Saiti, B. Impact of climate change mitigation policies on corporate financial performance: Evidence based on European publicly listed firms. Corp. Soc. Responsib. Environ. Manag. 2020, 27(6), 2491–2501. [Google Scholar] [CrossRef]
- Sukmadilaga, C.; Winarningsih, S.; Yudianto, I.; Lestari, T. U.; Ghani, E. K. Does green accounting affect firm value? Evidence from ASEAN countries. Int. J. Energy Econ. Policy 2023, 13(2), 509–515. [Google Scholar] [CrossRef]
- Verrecchia, R. E. Discretionary disclosure. J. Account. Econ. 1983, 5, 179–194. [Google Scholar] [CrossRef]
- Walker, K.; Wan, F. The harm of symbolic actions and green-washing: Corporate actions and communications on environmental performance and their financial implications. J. Bus. Ethics 2012, 109(2), 227–242. [Google Scholar] [CrossRef]
- Wang, B.; Mirza, N.; Umar, M.; Shan, S. Firm valuation under climate uncertainty: The role of climate risk exposure and disclosure practices. Int. Rev. Financ. Anal. 2025, 104724. [Google Scholar] [CrossRef]
- Wang, Y.; Wu, Z.; Zhang, G. Firms and climate change: A review of carbon risk in corporate finance. Carbon Neutrality 2022, 1(1), 6. [Google Scholar] [CrossRef]
- Wongsinhirun, N.; Chatjuthamard, P.; Denlertchaikul, N.; Jiraporn, P.; Korphaibool, V. The role of green corporate finance in enhancing firm resilience to climate change. Journal of Economic Surveys. Advance online publication. 2026. [Google Scholar] [CrossRef]
- Yang, B.; Zhu, C.; Xiang, C.; Cao, Y. Honesty pays off: Climate risk disclosure credibility and firm value. Financ. Res. Lett. 2025, 108414. [Google Scholar] [CrossRef]
- Zhao, M.; Tan, J.; Park, S. H. From voids to sophistication: Institutional environment and MNC CSR crisis in emerging markets. J. Bus. Ethics 2014, 122(4), 655–674. [Google Scholar] [CrossRef]
Table 2.
Mean Difference Tests – High vs. Low Climate Finance Firms.
| Variable | Low CF Firms (N = 259) | High CF Firms (N = 261) | Difference | t-statistic | p-value |
|---|---|---|---|---|---|
| Tobin's Q (TQ) | 1.412 | 2.025 | -0.613 | -28.90 | 0.000 |
| ERA Quality | 0.233 | 0.500 | -0.267 | -37.57 | 0.000 |
| Firm Size (SIZE) | 13.828 | 15.893 | -2.065 | -26.19 | 0.000 |
| Leverage (LEV) | 0.319 | 0.290 | 0.029 | 5.64 | 0.000 |
| Return on Assets (ROA) | 0.106 | 0.143 | -0.037 | -14.22 | 0.000 |
| Capital Expenditure (CAPEX) | 0.056 | 0.103 | -0.047 | -22.05 | 0.000 |
| Sales Growth (SGR) | 0.118 | 0.117 | 0.001 | 0.32 | 0.748 |
Notes: High CF firms are those at or above the sample median of CF = 0.215. Low CF firms are those below the median. t-tests use unpooled variance. Significance levels: *** p < 0.01.
Table 3.
Baseline and Moderation Regressions (Fixed Effects, Clustered SE).
| M1: CF Only | M2: CF + ERA | M3a: CF × ERA | M3b: CF × ERA + GWG | |
|---|---|---|---|---|
| Variable | ||||
| CF | -0.075 (0.535) | 0.231 (0.661) | -0.287 (0.661) | -2.137*** (0.686) |
| ERA | -0.335 (0.729) | -0.273 (0.577) | 0.489 (0.473) | |
| CF × ERA | 1.322*** (0.345) | 3.228*** (0.438) | ||
| GWG | -7.686*** (1.362) | |||
| CF × GWG | 22.524*** (4.450) | |||
| SIZE | 0.117 (0.116) | 0.124 (0.112) | 0.193* (0.107) | 0.244** (0.105) |
| LEV | -1.117 (0.808) | -1.164 (0.815) | -1.754* (0.909) | -1.208 (0.758) |
| ROA | 3.487*** (0.737) | 3.537*** (0.775) | 2.783*** (0.691) | 2.232*** (0.512) |
| CAPEX | 0.910* (0.533) | 0.889* (0.514) | 0.368 (0.505) | 0.115 (0.447) |
| RD | 2.219** (0.994) | 2.167** (0.990) | 1.003 (1.022) | 1.407 (1.037) |
| SGR | -0.048 (0.198) | -0.039 (0.198) | -0.118 (0.193) | 0.039 (0.153) |
| SHARES | 0.331 (1.067) | 0.407 (1.067) | 0.515 (1.089) | 0.562 (0.903) |
| GDP | -0.002 (0.002) | -0.002 (0.002) | 0.001 (0.001) | -0.000 (0.001) |
| FD | 0.005** (0.002) | 0.005** (0.003) | 0.000 (0.002) | 0.005** (0.002) |
| INFL | 0.000 (0.001) | 0.000 (0.001) | 0.003* (0.002) | 0.004*** (0.001) |
| Year FE | Yes | Yes | Yes | Yes |
| Industry FE | Yes | Yes | Yes | Yes |
| Country FE | Yes | Yes | Yes | Yes |
| Within R² | 0.9845 | 0.9845 | 0.9859 | 0.9882 |
| N | 520 | 520 | 520 | 520 |
| Groups | 40 | 40 | 40 | 40 |
Notes: * p < 0.10, ** p < 0.05, *** p < 0.01. Standard errors adjusted for 40 firm-level clusters in parentheses. Country dummy D_SA is absorbed by firm fixed effects.
Table 4.
Country-Level Subsample Regressions.
| Nigeria | South Africa | Pooled (Interaction) | |
|---|---|---|---|
| Variable | |||
| CF | 2.071* (1.006) | -1.583 (1.013) | -1.876** (0.706) |
| ERA | 1.386*** (0.385) | -2.390** (0.993) | 0.404 (0.443) |
| CF × ERA | -3.108** (1.402) | 2.798*** (0.734) | 3.266*** (0.450) |
| GWG | -2.335 (1.753) | -4.773* (2.519) | -6.822*** (1.575) |
| CF × GWG | -4.915 (6.910) | 8.981 (7.833) | 18.267*** (5.747) |
| CF × ERA × D_SA | -0.610 (0.434) | ||
| CF × GWG × D_SA | 1.306 (5.734) | ||
| SIZE | 0.136* (0.068) | 0.630*** (0.127) | 0.237** (0.112) |
| LEV | 1.058** (0.485) | 1.531* (0.768) | -1.201 (0.813) |
| ROA | 1.474*** (0.511) | 1.053 (0.771) | 2.105*** (0.521) |
| CAPEX | 0.787** (0.293) | -0.824 (0.924) | 0.166 (0.461) |
| RD | 1.122* (0.646) | 1.666 (1.372) | 1.521 (1.027) |
| SGR | 0.236* (0.134) | -0.637** (0.304) | 0.017 (0.161) |
| SHARES | 0.049 (0.435) | -1.406 (1.467) | 0.474 (0.904) |
| GDP | 0.013** (0.006) | 0.018* (0.009) | -0.001 (0.002) |
| FD | -0.006 (0.022) | 0.026*** (0.009) | 0.008*** (0.002) |
| INFL | -0.015** (0.006) | -0.042* (0.023) | 0.003** (0.001) |
| Year FE | Yes | Yes | Yes |
| Industry FE | Yes | Yes | Yes |
| Country FE | - | - | Yes |
| Within R² | 0.9886 | 0.9928 | 0.9883 |
| N | 260 | 260 | 520 |
| Groups | 20 | 20 | 40 |
Notes: * p < 0.10, ** p < 0.05, *** p < 0.01. Standard errors clustered at the firm level in parentheses. Nigeria subsample uses D_SA = 0 observations; South Africa uses D_SA = 1 observations. The pooled model includes three-way interaction terms CF × ERA × D_SA and CF × GWG × D_SA to test cross-country moderation differences.
Table 5.
Difference-in-Differences Analysis – King IV Adoption.
| Basic DiD | Full DiD | |
|---|---|---|
| Variable | ||
| POST | 0.080** (0.033) | 0.115* (0.068) |
| D_SA | -0.109 (0.279) | 0.384 (0.541) |
| POST × D_SA | 0.035*** (0.011) | -0.392 (0.415) |
| CF | 0.497 (0.726) | |
| ERA | -0.302 (0.727) | |
| CF × POST × D_SA | -2.041 (2.017) | |
| ERA × POST × D_SA | 2.044 (1.962) | |
| CF × ERA | 0.081 (0.718) | |
| GWG | 0.865 (2.192) | |
| CF × GWG | -6.814 (5.356) | |
| SIZE | 0.080*** (0.012) | 0.081*** (0.013) |
| LEV | 0.141 (0.264) | 0.201 (0.280) |
| ROA | 4.654*** (0.349) | 4.891*** (0.448) |
| CAPEX | -0.953** (0.455) | -0.938 (0.575) |
| RD | 3.718*** (1.278) | 2.946** (1.420) |
| SGR | -0.037 (0.483) | -0.019 (0.543) |
| SHARES | -0.258 (0.159) | -0.174 (0.164) |
| GDP | 0.004** (0.002) | 0.006** (0.003) |
| FD | 0.002 (0.002) | -0.001 (0.004) |
| INFL | 0.001 (0.001) | 0.002 (0.002) |
| Year FE | Yes | Yes |
| Industry FE | Yes | Yes |
| R² | 0.9887 | 0.9893 |
| N | 520 | 520 |
Notes: * p < 0.10, ** p < 0.05, *** p < 0.01. Standard errors clustered at the 40 firm level in parentheses. POST = 1 for 2017–2022 (post-King IV). D_SA = 1 for South African firms. Pre-treatment parallel trends were tested via a pre-period regression on D_SA (F = 4.26, p = 0.046), confirming pre-treatment differences. The triple interactions CF × POST × D_SA and ERA × POST × D_SA test whether King IV amplified the valuation effects of climate finance and ERA in South Africa.
Table 6.
Robustness Checks.
| (1) IV-2SLS | (2) System GMM | (3) PSM Matched | (4) CFEI Substitute | (5) High GWG | (6) Low GWG | |
|---|---|---|---|---|---|---|
| Variable | ||||||
| CF / CFEI | -0.204 (3.859) | -0.461 (2.539) | -1.374 (5.515) | - | 2.066** (0.881) | -1.410 (1.439) |
| CFEI | - | - | - | 1.238** (0.539) | - | - |
| ERA | 0.290 (3.029) | -0.050 (2.205) | 1.794 (3.060) | -1.733*** (0.512) | 1.219*** (0.408) | -1.780 (1.132) |
| CF × ERA | - | 0.491 (0.511) | -0.560 (11.237) | 2.331*** (0.417) | -2.485* (1.318) | 2.433*** (0.555) |
| GWG | - | -1.383 (1.444) | 2.033 (9.404) | -4.473*** (1.346) | - | - |
| CF × GWG | - | 3.488 (3.750) | 3.669 (41.552) | 14.905*** (3.797) | - | - |
| SIZE | 0.080*** (0.012) | 0.011 (0.010) | 0.092*** (0.018) | 0.161** (0.080) | 0.107** (0.049) | 0.540*** (0.096) |
| L.TQ | - | 0.859*** (0.152) | - | - | - | - |
| Year FE | Yes | Yes | No | Yes | Yes | Yes |
| Industry FE | Yes | No | No | Yes | Yes | Yes |
| Within R² / R² | 0.989 | - | 0.949 | 0.988 | 0.991 | 0.987 |
| N | 520 | 480 | 88 | 520 | 173 | 210 |
| AR(2) p-value | - | 0.001 | - | - | - | - |
| Hansen p-value | - | 0.955 | - | - | - | - |
| Endogeneity F | 0.038 (p=0.85) | - | - | - | - | - |
Notes: * p < 0.10, ** p < 0.05, *** p < 0.01.
Table 7.
Heckman Selection Model (Green Debt Issuance).
| Outcome Equation (TQ) | Selection Equation (CF3) | |
|---|---|---|
| CF | -1.719 (1.071) | - |
| ERA | 2.496** (1.059) | - |
| CF × ERA | 0.514 (0.569) | - |
| GWG | 10.119*** (3.766) | - |
| CF × GWG | -22.566** (11.048) | - |
| SIZE | 0.056*** (0.011) | -0.251 (0.392) |
| LEV | -0.637** (0.259) | 0.697 (4.794) |
| ROA | 0.553 (0.434) | 19.163* (10.669) |
| CAPEX | -1.136*** (0.368) | 24.467** (10.617) |
| RD | 3.335*** (0.515) | 6.564 (24.566) |
| SGR | 3.632*** (0.479) | 1.988 (9.490) |
| SHARES | -1.270*** (0.253) | -12.177** (6.179) |
| GDP | -0.014*** (0.004) | -0.054 (0.163) |
| FD | -0.038*** (0.006) | 1.327*** (0.294) |
| INFL | -0.034*** (0.007) | - |
| D_SA | 5.182*** (0.813) | -185.021*** (40.943) |
| λ (Inverse Mills Ratio) | -0.012 (0.028) | - |
| Constant | 1.504*** (0.375) | -18.206** (9.062) |
| Ρ | -0.264 | |
| Σ | 0.046 | |
| Wald χ²(16) | 1704.27*** | |
| N (Total / Selected) | 520 / 151 |
Notes: * p < 0.10, ** p < 0.05, *** p < 0.01. Standard errors in parentheses. The selection equation models the probability of green debt issuance (CF3 = 1). D_SA perfectly predicts non-selection in Nigeria, reducing the usable selection sample.
Disclaimer/Publisher’s Note: The statements, opinions and data contained in all publications are solely those of the individual author(s) and contributor(s) and not of MDPI and/or the editor(s). MDPI and/or the editor(s) disclaim responsibility for any injury to people or property resulting from any ideas, methods, instructions or products referred to in the content. |
© 2026 by the authors. Licensee MDPI, Basel, Switzerland. This article is an open access article distributed under the terms and conditions of the Creative Commons Attribution (CC BY) license (http://creativecommons.org/licenses/by/4.0/).
Copyright: This open access article is published under a Creative Commons CC BY 4.0 license, which permit the free download, distribution, and reuse, provided that the author and preprint are cited in any reuse.