

Submitted:
22 June 2026
Posted:
24 June 2026
You are already at the latest version
Abstract
Background/Objectives: Finerenone improves cardiovascular and renal outcomes in diabetic kidney disease (DKD), but hyperkalemia remains a key safety concern. Patients with elevated baseline potassium levels (≥ 4.9 mEq/L) are largely excluded from clinical trials, and real-world data in this population are scarce. Methods: In this retrospective multicenter cohort study derived from the FINE-TURK cohort, adults with DKD who initiated finerenone with baseline serum potassium ≥ 4.9 mEq/L were included. The primary outcome was clinically significant hyperkalemia (CSH) (≥ 5.5 mEq/L) within three months. Multivariable logistic regression analyses were used to identify associated factors, with multiple sensitivity analyses performed. Results: 166 patients were included, of whom 47 (28.3%) had baseline potassium levels between 5.1 to 5.5 mEq/L. Of the 166 patients, 35 (21.1%) developed CSH, and 10 (6%) patients had follow-up potassium ≥ 6.0 mEq/L. 126 (76.8%) patients required no intervention, 24 (14.6%) were initiated on potassium binders, and finerenone was discontinued only in 12 (7.3%) patients. Baseline eGFR, baseline urinary albumin, loop diuretic use and 20mg finerenone dose were associated with CSH. In contrast, baseline serum potassium was not associated with CSH. Conclusions: In patients with DKD and elevated baseline potassium levels, finerenone initiation was associated with manageable rates of hyperkalemia. Our findings support the cautious use of finerenone in selected patients under close monitoring, as well as highlight the need for a multidimensional approach to hyperkalemia risk assessment.
Keywords:
diabetes complications
; diabetic nephropathies
; hyperkalemia
; mineralocorticoid receptor antagonists
1. Introduction
Type 2 diabetes mellitus (T2DM) and diabetic kidney disease (DKD) represent a major and growing global health burden, contributing substantially to cardiovascular and renal morbidity and mortality, collectively known as cardio-renal-metabolic (CRM) disease [1,2,3,4]. Over the past decades, significant therapeutic advances—particularly with renin–angiotensin–aldosterone system (RAAS) inhibitors, including angiotensin-converting enzyme inhibitors (ACEi) and angiotensin receptor blockers (ARB), as well as sodium–glucose cotransporter-2 (SGLT2) inhibitors—have markedly improved cardiovascular and renal outcomes in this population [5,6,7,8,9]. Despite these benefits, a considerable residual risk of disease progression persists, highlighting the need for additional therapeutic strategies targeting complementary pathophysiological pathways [10].
Due to increased aldosterone activity in CRM diseases, steroidal mineralocorticoid receptor antagonists (MRAs) such as spironolactone and eplerenone play a significant role in the management of heart failure; however, their use has been largely limited by the risk of hyperkalemia in chronic kidney disease (CKD) [11]. Finerenone, a novel nonsteroidal MRA, has demonstrated significant renal and cardiovascular benefits in patients with DKD in large randomized controlled trials [12,13]. Importantly, compared with steroidal MRAs, finerenone has been associated with a more favorable safety profile with respect to hyperkalemia [14,15]. Nevertheless, hyperkalemia remains one of the most clinically relevant adverse effects and continues to influence prescribing decisions, especially in patients with impaired kidney function or elevated baseline potassium levels. The pivotal trials of finerenone, including FIDELIO-DKD and FIGARO-DKD [12,13], largely excluded patients with higher baseline potassium levels (i.e., potassium ≥ 4.9 mEq/L), and current prescribing recommendations on the manufacturer’s label, which are derived from the aforementioned trials, reflect similar criteria [16]. As a result, only selected patients with borderline hyperkalemia (i.e., potassium ≥ 4.9 mEq/L) are initiated on finerenone, and patients with mild hyperkalemia (i.e., potassium ≥ 5.1 mEq/L) are not initiated on finerenone at all. These scenarios are frequently encountered in routine clinical practice, creating a gap between trial-based recommendations and real-world decision-making.
While prior analyses [14], including our earlier work from the FINE-TURK cohort [17], have identified baseline potassium and estimated glomerular filtration rate (eGFR) as key determinants of hyperkalemia risk in a general DKD population. It remains unclear whether these relationships persist in patients who already have elevated baseline potassium levels. Given this uncertainty, we aimed to evaluate potassium dynamics, management strategies, and factors associated with hyperkalemia in patients with DKD initiating finerenone despite elevated baseline potassium levels.
2. Materials and Methods
2.1. Study Design and Population
This study was designed as a retrospective cohort analysis derived from the FINE-TURK cohort, a national, multicenter cohort evaluating the real-world use of finerenone in patients with DKD who receive contemporary CRM treatments. The design and overall characteristics of the FINE-TURK cohort have been described previously [18]. For the present analysis, a subgroup of patients from the FINE-TURK cohort was evaluated. Adult patients (≥18 years) with T2DM and DKD, with baseline serum potassium ≥4.9 mEq/L, who initiated finerenone, were eligible. Patients were included if baseline serum potassium, baseline estimated glomerular filtration rate (eGFR, calculated using the CKD-EPI equation), and at least one follow-up potassium measurement within three months of finerenone initiation were available. If more than one potassium measurement was available, the higher potassium value was chosen as the follow-up potassium value to adopt a conservative, worst-case approach to hyperkalemia ascertainment.
The present study represents a distinct prespecified subgroup analysis of the FINE-TURK cohort, specifically focusing on patients with elevated baseline serum potassium levels (≥4.9 mEq/L). This population was not included in our previous FINE-TURK analysis [17], which evaluated finerenone-associated hyperkalemia in patients with baseline serum potassium ≤4.8 mEq/L and more closely reflected the eligibility criteria of pivotal finerenone trials.
2.2. Variables of Interest
The following variables were collected from electronic medical records: Age, sex, systolic blood pressure (BP), diastolic BP, body mass index (BMI), clinician-diagnosed or patient-reported comorbidities of hypertension, coronary artery disease (CAD, defined as history of myocardial infarction or revascularization), stroke, and diabetic retinopathy (DRP); finerenone dose initiated (20 mg or 10 mg); current use of any SGLT2 inhibitor, use of any ACE inhibitor or ARB, presence of maximal RAAS inhibition (according to manufacturers’ labels), use of any glucagon-like peptide-1 (GLP-1) receptor agonist, dipeptidyl peptidase-4 (DPP-4) inhibitors, current use of any insulin, metformin, sulfonylurea, calcium channel blocker, beta blocker, alpha blocker, thiazide (or thiazide-like) diuretic, loop diuretic, any antihypertensive, and statin. Regarding laboratory tests, baseline eGFR, baseline serum potassium, baseline urinary albumin (mg/g creatinine), baseline urinary protein (mg/g creatinine), baseline serum sodium, baseline serum albumin, baseline serum uric acid, baseline hemoglobin, and baseline hemoglobin A1c (HbA1c) values were acquired. Baseline serum potassium levels were dichotomized into 4.9 – 5.0 mEq/L and 5.1 – 5.5 mEq/L for further analysis. The former represents the group for borderline hyperkalemia, for whom the manufacturer’s label states finerenone initiation may be considered according to patient characteristics with close potassium follow-up. The latter represents patients with mild hyperkalemia, for whom finerenone should not be initiated according to the manufacturer’s label.
2.3. Outcome Definition
The primary outcome was clinically significant hyperkalemia, defined as a follow-up serum potassium level of ≥5.5 mEq/L, within three months of finerenone initiation. The potassium threshold was selected based on the manufacturer’s label and contemporary clinical guidelines, which recommend treatment cessation at potassium levels ≥ 5.5 mEq/L. In addition, follow-up potassium levels were also analyzed as an ordinal variable, categorized as < 5.0, 5.0–5.4, 5.5–5.9, and ≥ 6.0 mEq/L. This approach was used to better characterize the distribution and severity of hyperkalemia in the cohort and to capture clinically relevant gradients of risk beyond a single threshold. Furthermore, hyperkalemia management strategies, including no intervention, initiation of potassium binders, finerenone discontinuation, and initiation of bicarbonate therapy, were evaluated and grouped according to follow-up potassium levels.
2.4. Statistical Analysis
Continuous variables were assessed for normality using the Shapiro–Wilk test. No variables were distributed normally, and non-normally distributed variables were presented as medians with interquartile ranges. Between-group comparisons of continuous variables were performed using the Mann–Whitney U test. Categorical variables were shown as counts and percentages, and between-group comparisons were performed using the chi-square test. To evaluate factors associated with clinically significant hyperkalemia, logistic regression (LR) analyses were performed. Univariate LR analyses were initially conducted to assess crude associations between candidate variables and clinically significant hyperkalemia. Covariates included in the multivariable model were selected a priori based on biological plausibility, existing literature, and findings from previous analyses of the FINE-TURK cohort rather than solely on univariate statistical significance. The final model included baseline serum potassium, baseline eGFR, log-transformed baseline urinary albumin, finerenone dose, and loop diuretic use. Given the limited number of outcome events, the number of covariates included in each multivariable model was restricted to minimize overfitting, in accordance with events-per-variable principles Baseline serum potassium was modeled as a continuous variable and scaled per 0.1 mEq/L increase to facilitate clinical interpretation of effect estimates. Baseline urinary albumin and protein were logarithmically transformed because of their right-skewed distributions. Finerenone dose and loop diuretic use were analyzed as binary variables. Results are presented as odds ratios (ORs) with corresponding 95% confidence intervals (CIs). To evaluate the robustness of the findings, prespecified sensitivity analyses were performed using alternative model specifications, including substitution of baseline urinary albumin with baseline urinary protein, replacement of loop diuretic use with diabetic retinopathy status, replacement of loop diuretic use with thiazide diuretic use, and removing loop diuretics from the model. Missing data were handled using pairwise deletion, allowing each analysis to include all available observations without imputation. A two-sided p value <0.05 was considered statistically significant. All statistical analyses were performed using IBM SPSS Statistics, version 25 (IBM Corp., Armonk, NY, USA).
3. Results
3.1. Study Population and Baseline Characteristics
A total of 166 patients with DKD and baseline serum potassium ≥ 4.9 mEq/L were included. The median age was 61.5 (54–70) years, and 51.2% were female. The median baseline serum potassium level was 5.0 (4.9–5.1) mEq/L. When stratified by baseline serum potassium categories, patients with mild hyperkalemia had higher BMI (30.9 vs. 28.4, p = 0.008) and lower diastolic BP (76 vs. 80, p = 0.023) compared to borderline hyperkalemic patients. They also exhibited significantly higher levels of baseline urinary albumin (1900 vs. 949, p = 0.018) and baseline urinary protein (2269 vs. 1423, p = 0.044). Initiation of finerenone at 20 mg was also more frequent in patients with baseline mild hyperkalemia (12.8% vs. 2.5%, p = 0.009), though it was numerically low for both groups (6 vs. 3). When patients were stratified according to follow-up serum potassium levels, clinically significant hyperkalemia occurred in 35 patients (21.1%). Patients who developed clinically significant hyperkalemia had lower baseline eGFR (39 vs. 47, p = 0.011) and higher levels of baseline urinary albumin (3096 vs. 903, p < 0.001) and baseline urinary protein levels (4260 vs. 1419, p = 0.001). DRP was more frequent (66.7% vs 45.8%, p = 0.041), and loop diuretic use was more common in patients who developed clinically significant hyperkalemia (31.4% vs 12.6%, p = 0.008). Table 1 demonstrates the baseline characteristics according to baseline serum potassium categories and follow-up hyperkalemia status in detail.
3.2. Potassium Trajectory and Distribution
The median follow-up serum potassium level was 5.1 (4.9–5.4) mEq/L. Patients with baseline mild hyperkalemia had higher follow-up serum potassium values compared to borderline hyperkalemic patients (5.2 vs 5.0 mEq/L, p = 0.003). However, the magnitude of potassium change did not differ significantly between baseline serum potassium groups (0.1 vs. 0.1, p = 0.162) (Table 2). When categorized ordinally, 46 (27.7%) patients had follow-up serum potassium levels < 5.0 mEq/L, 85 (51.2%) had levels of 5.0–5.4 mEq/L, 25 (15.1%) had levels of 5.5–5.9 mEq/L, and 10 (6.0%) had levels ≥ 6.0 mEq/L. Patients with baseline mild hyperkalemia levels approached statistical significance with a shift toward higher follow-up serum potassium categories (p = 0.052). Table 2 illustrates the distribution of follow-up serum potassium levels according to baseline serum potassium categories in detail.
3.3. Hyperkalemia Management
Data on hyperkalemia management were missing for 2 patients; therefore, hyperkalemia management analysis was conducted on 164 patients. Overall, no intervention was required in 76.8% of patients. Follow-up serum potassium levels were associated with different intervention strategies (p < 0.001). Among patients with follow-up serum potassium levels of 5.5–5.9 mEq/L, potassium binders were initiated in 65.2%, and finerenone was discontinued only in 13% of patients. However, in patients with follow-up serum potassium levels ≥ 6.0 mEq/L, finerenone was discontinued in all cases. Bicarbonate therapy was infrequently used and limited to two patients with moderate hyperkalemia. Table 3 shows the management strategies and treatment modifications following hyperkalemia in detail.
3.4. Factors Associated with Clinically Significant Hyperkalemia
In univariate LR analysis (Figure 1), baseline serum potassium, baseline eGFR, DRP, baseline urinary albumin (log-transformed) and protein, and loop diuretic use were associated with clinically significant hyperkalemia. Thiazide use and finerenone dose were not associated with clinically significant hyperkalemia in univariate logistic regression analysis. In multivariable logistic regression analysis (Figure 2), baseline serum potassium was not independently associated with clinically significant hyperkalemia (OR 1.026, 95% CI 0.737–1.429, p=0.879). Conversely, lower baseline eGFR (OR 0.966, 95% CI 0.934–0.998, p=0.040), higher baseline urinary albumin (log-transformed; OR 2.837, 95% CI 1.199–6.716, p=0.018), loop diuretic use (OR 3.118, 95% CI 1.005–9.678, p=0.049), and initiation with a 20 mg finerenone dose (OR 16.354, 95% CI 2.245–119.115, p=0.006) were independently associated with clinically significant hyperkalemia. The model demonstrated moderate explanatory performance (Nagelkerke R2 = 0.274). Table 4 demonstrates the factors associated with hyperkalemia in univariate and multivariable LR analyses in detail.
3.5. Sensitivity Analyses
Sensitivity analyses using alternative multivariable model specifications demonstrated overall robustness of the findings (Table 5). Replacement of baseline urinary albumin with baseline urinary protein yielded comparable results, with lower eGFR, higher baseline urinary protein, and 20mg finerenone dose remaining independently associated with clinically significant hyperkalemia, whereas baseline serum potassium and loop diuretic use were not associated. Similarly, replacing loop diuretic use with diabetic retinopathy and thiazide diuretic use did not materially alter the results, with baseline urinary albumin and 20mg finerenone dose remaining significant factors, while baseline serum potassium, diabetic retinopathy and thiazide diuretic use were not associated with hyperkalemia. In an additional model excluding loop diuretic use, lower baseline eGFR, higher baseline urinary albumin excretion, and 20mg finerenone dose remained independently associated with clinically significant hyperkalemia. Across all sensitivity analyses, baseline serum potassium consistently lacked an independent association with clinically significant hyperkalemia, whereas the association between 20mg finerenone dose and hyperkalemia remained robust.
4. Discussion
In this multicenter retrospective cohort analysis derived from the FINE-TURK cohort, we evaluated potassium dynamics, management strategies, and factors associated with clinically significant hyperkalemia in patients with DKD who were initiated on finerenone despite borderline or mild hyperkalemia. This represents a clinically relevant, yet significantly understudied population that is largely, if not totally, excluded from randomized trials [12,13,19]. Clinically significant hyperkalemia occurred in approximately one-fifth of patients; however, most cases were mild and manageable, and the majority of patients did not require treatment cessation. Importantly, in contrast to patients with baseline serum potassium levels ≤ 4.8 mEq/L [14,17], baseline serum potassium was not independently associated with clinically significant hyperkalemia, whereas baseline urinary albumin demonstrated a more consistent association. These apparently differing observations should not be interpreted as contradictory findings but rather as complementary evidence derived from distinct clinical populations. While our previous FINE-TURK analysis [17] evaluated patients with baseline potassium levels within the conventional finerenone initiation range, the present study specifically focused on patients with elevated baseline potassium levels who were largely excluded from randomized clinical trials. Therefore, the determinants of finerenone-associated hyperkalemia may differ between these two clinically distinct scenarios. To the best of our knowledge, this is the first real-world study specifically evaluating finerenone-associated hyperkalemia in patients with elevated baseline serum potassium levels—a population largely excluded from clinical trials.
The percentages of patients experiencing serum potassium levels > 5.5 mEq/L and > 6.0 mEq/L were 21.4% and 4.5%, respectively, in the FIDELIO-DKD trial and 13.5% and 2.3%, respectively, in the FIGARO-DKD trial [12,13,14]. However, observational FINE-REAL study and a recent cohort study using the FOUNTAIN platform demonstrated that serum potassium levels > 5.5 mEq/L were observed in only 8% and 1.2% of the patients, respectively [20,21]. These rates are similar to our group’s recent study [17], in which similar eligibility criteria to landmark trials were used, which demonstrated potassium levels ≥ 5.5 mEq/L were observed only in 7.3% of the patients. Our current study demonstrated that potassium levels > 5.5 mEq/L and > 6.0 mEq/L were almost similar to findings from the FIDELIO-DKD trial [13], indicating a risk profile comparable to that observed in clinical trials. The observed difference of hyperkalemia between clinical trials and observational studies may be explained by exceedingly low SGLT2 inhibitor utilization in landmark trials (4.4% and 8.5% in the FIDELIO-DKD and the FIGARO-DKD, respectively, vs. 38.0% in the FOUNTAIN platform study and 89% in our previous study); and, a higher rate of the 10 mg finerenone dose in cohort studies compared to 20 mg dose (85% in both the FOUNTAIN platform study and the FINE-REAL study; and, 83% in our previous study.
Analyzing the factors associated with clinically significant hyperkalemia yielded several unexpected and contrasting findings to published literature data. Our previous study [17] had demonstrated that baseline serum potassium, baseline eGFR and finerenone dose were the most prominent factors associated with hyperkalemia, followed by thiazide diuretic use. Similarly, post-hoc safety analysis of the FIDELIO-DKD trial, and the FOUNTAIN platform study indicated baseline serum potassium, baseline eGFR, diuretic use, SGLT2 inhibitor use, and baseline urinary albumin were associated with hyperkalemia [14,20]. However, baseline serum potassium and thiazide diuretics were not associated with clinically significant hyperkalemia in the current study, and loop diuretics use was associated clinically significant hyperkalemia. There may be several explanations for these findings. Firstly, approximately three-quarters of the patients in our study had baseline potassium levels of either 4.9 mEq/L or 5 mEq/L, thereby its analysis as an independent variable might be impaired. Secondly, association of loop diuretics and clinically significant hyperkalemia may reflect confounding by indication, as loop diuretics are more frequently prescribed in patients with advanced CKD, volume overload, or concomitant heart failure. Therefore, loop diuretic use may act as a surrogate marker of disease severity rather than an independent causal factor, since biological causality would be expected in reverse direction, namely, association with lower odds of hyperkalemia. Taken together, these findings suggest that the determinants of hyperkalemia are context-dependent and may not be generalizable for each baseline serum potassium and CKD severity level. This pattern mirrors the contemporary classification of CKD, which integrates both eGFR and albuminuria rather than relying on either parameter alone [22]. Similarly, our findings suggest that finerenone-associated hyperkalemia risk is not driven by a single parameter but rather emerges from a multidimensional interplay between various markers.
From a clinical perspective, our findings provide reassurance regarding the safety profile of finerenone in patients with borderline or mild hyperkalemia. Although rates of drug discontinuation in our cohort were higher (7.3%) than those reported in the landmark trials of FIDELIO-DKD (2.3%) and FIGARO-DKD (1.2%), this likely reflects real-world practice patterns, including more conservative decision-making in response to rising potassium levels, as well as an already higher baseline serum potassium starting point. It is of particular importance to note that 13.6% of the patients in the FIDELIO-DKD trial had baseline serum potassium > 4.8 mEq/L, and 6.9% had baseline potassium > 5 mEq/L, similar to our study’s eligibility criteria. Similarly, 4.9% of the patients in the FINE-REAL observational study had baseline serum potassium > 5.0 mEq/L. However, clinically significant hyperkalemia rates, factors associated with clinically significant rates, and management strategies including drug discontinuation were not reported in these specific subgroups [14,21].
Since our study evaluated potassium dynamics within the first three months of finerenone initiation, potassium elevations beyond this period may seem like a major limitation. The FIDELIO-DKD study demonstrated that finerenone elevated potassium levels by 0.23 mEq/L at month 4, and the levels remained largely stable thereafter [13]. The FIGARO-DKD study, which included DKD patients with lower disease severity, demonstrated that finerenone elevated potassium levels by 0.16 mEq/L at month 1, and potassium levels remained largely stable thereafter [12]. Moreover, a recent cohort study demonstrated that mean serum potassium increased by 0.1 mEq/L at 4 months of finerenone initiation and remained unchanged at 12 months (increase of 0.1 mEq/L from baseline) [20]. Clinical trials, as well as the latter cohort data, provide assurance for our study for its ability to capture clinically significant hyperkalemia, since potassium levels are expected to elevate within the first months of finerenone initiation and become stable thereafter.
Another important finding of our study was the independent association between 20mg finerenone dose and clinically significant hyperkalemia. Although the estimated effect size was accompanied by wide confidence intervals, reflecting the limited number of patients initiated on 20 mg finerenone, this association remained directionally consistent across all sensitivity analyses. Therefore, while the precise magnitude of risk should be interpreted cautiously, our findings support a potential dose-dependent relationship between finerenone exposure and hyperkalemia risk. This observation is biologically plausible and consistent with the dose-dependent increases in serum potassium observed in our prior analyses from the FINE-TURK cohort [17].
Our study has several limitations. Firstly, its retrospective design impairs strong causality, and results are subject to residual confounding. Secondly, the sample size, particularly the number of clinically significant hyperkalemia events, was relatively limited, which may reduce statistical power, contribute to imprecision in some estimates, and result in wide confidence intervals. Thirdly, treatment decisions, including initiation and discontinuation of finerenone or use of potassium-lowering therapies, were not standardized. Despite these limitations, the study has notable strengths. It represents, to our knowledge, the first focused real-world evaluation of finerenone use in patients with elevated baseline serum potassium levels, a population largely excluded from randomized trials. Also, a well-characterized, multicenter real-world cohort enhances generalizability, and the consistency of findings across multiple sensitivity analyses strengthens the robustness of the results.
5. Conclusions
In patients with elevated baseline potassium levels, finerenone-associated clinically significant hyperkalemia was broadly comparable to rates observed in clinical trials, with most cases not requiring treatment discontinuation. Baseline serum potassium was no longer associated with hyperkalemia in this high-risk subgroup. These findings support the cautious use of finerenone in selected patients with borderline or mildly elevated serum potassium levels under close monitoring and suggest the need for refined risk stratification beyond traditional predictors.
Author Contributions
Conceptualization: M.O., S.Y., A.T.G., S.A., F.A., M.S., B.O., E.Y.A., B.D., I.A., S.M.D., M.D., S.K., U.Y., A.I., H.C., B.Dem., S.T., E.G.O., M.D.A., E.Av., F.Y., B.Do., S.Ka., M.S.K., B.G.D., K.T., I.B., M.Ba., M.Me., E.Ay., F.Y.A., E.P., P.O., B.E., Z.A., M.E.D., S.S., S.U., O.B., B.A., A.A., M.I., S.Y.K., M.M., B.Du., N.E., S.B.D., M.A.B., A.E., G.K., M.H., A.Z.S., M.T., M.Du., S.F.Y., H.M.Y.U., M.Al., R.S., F.S., D.T., S.Kh., A.S.K., T.A., H.Ce., S.Kz., I.O., M.P., M.F.A., M.Mes., A.D., U.D., E.Al., S.Ba., E.K., C.A., M.B.A., A.Il., A.Ek., S.Ul., M.Ar., E.S., E.A.B. Data curation: M.O., A.T.G. Formal analysis: M.O., A.T.G. Funding acquisition: Not applicable. Investigation: M.O., S.Y., A.T.G., S.A., F.A., M.S., B.O., E.Y.A., B.D., I.A., S.M.D., M.D., S.K., U.Y., A.I., H.C., B.Dem., S.T., E.G.O., M.D.A., E.Av., F.Y., B.Do., S.Ka., M.S.K., B.G.D., K.T., I.B., M.Ba., M.Me., E.Ay., F.Y.A., E.P., P.O., B.E., Z.A., M.E.D., S.S., S.U., O.B., B.A., A.A., M.I., S.Y.K., M.M., B.Du., N.E., S.B.D., M.A.B., A.E., G.K., M.H., A.Z.S., M.T., M.Du., S.F.Y., H.M.Y.U., M.Al., R.S., F.S., D.T., S.Kh., A.S.K., T.A., H.Ce., S.Kz., I.O., M.P., M.F.A., M.Mes., A.D., U.D., E.Al., S.Ba., E.K., C.A., M.B.A., A.Il., A.Ek., S.Ul., M.Ar., E.S., E.A.B. Methodology: M.O., S.Y., A.T.G., E.A.B. Project administration: M.O., S.Y., A.T.G., E.A.B. Resources: M.O., S.Y., A.T.G., S.A., F.A., M.S., B.O., E.Y.A., B.D., I.A., S.M.D., M.D., S.K., U.Y., A.I., H.C., B.Dem., S.T., E.G.O., M.D.A., E.Av., F.Y., B.Do., S.Ka., M.S.K., B.G.D., K.T., I.B., M.Ba., M.Me., E.Ay., F.Y.A., E.P., P.O., B.E., Z.A., M.E.D., S.S., S.U., O.B., B.A., A.A., M.I., S.Y.K., M.M., B.Du., N.E., S.B.D., M.A.B., A.E., G.K., M.H., A.Z.S., M.T., M.Du., S.F.Y., H.M.Y.U., M.Al., R.S., F.S., D.T., S.Kh., A.S.K., T.A., H.Ce., S.Kz., I.O., M.P., M.F.A., M.Mes., A.D., U.D., E.Al., S.Ba., E.K., C.A., M.B.A., A.Il., A.Ek., S.Ul., M.Ar., E.S., E.A.B. Software: M.O., A.T.G. Supervision: M.O., S.Y., A.T.G., E.A.B. Validation: M.O., S.Y., A.T.G., E.A.B. Visualization: M.O., A.T.G. Writing – original draft: M.O., S.Y., A.T.G., E.A.B. Writing – review & editing: M.O., S.Y., A.T.G., S.A., F.A., M.S., B.O., E.Y.A., B.D., I.A., S.M.D., M.D., S.K., U.Y., A.I., H.C., B.Dem., S.T., E.G.O., M.D.A., E.Av., F.Y., B.Do., S.Ka., M.S.K., B.G.D., K.T., I.B., M.Ba., M.Me., E.Ay., F.Y.A., E.P., P.O., B.E., Z.A., M.E.D., S.S., S.U., O.B., B.A., A.A., M.I., S.Y.K., M.M., B.Du., N.E., S.B.D., M.A.B., A.E., G.K., M.H., A.Z.S., M.T., M.Du., S.F.Y., H.M.Y.U., M.Al., R.S., F.S., D.T., S.Kh., A.S.K., T.A., H.Ce., S.Kz., I.O., M.P., M.F.A., M.Mes., A.D., U.D., E.Al., S.Ba., E.K., C.A., M.B.A., A.Il., A.Ek., S.Ul., M.Ar., E.S., E.A.B.
Funding
No funding was received for this study.
Institutional Review Board Statement
Patients in the study were assigned an anonymous identification number to protect confidentiality.The study complies with the principles outlined in the Declaration of Helsinki, and it was approved by the Kartal Dr. Lütfi Kırdar City Hospital Ethical Board on 25.12.2024, decision number: 2024/010.99/11/23, and each participating center also provided institutional approval.
Informed Consent Statement
Due to the retrospective and non-interventional nature of the study, informed consent was waived.
Data Availability Statement
SPSS outputs are uploaded in a data repository and are freely available at: https://doi.org/10.6084/m9.figshare.32114377 . Raw data are available upon reasonable request.
Conflicts of Interest
Alper Tuna Guven reports a relationship with Bayer Turkey that includes: speaking and lecture fees. Other authors declare that they have no known competing financial interests or personal relationships that could have appeared to influence the work reported in this paper.
References
- Genitsaridi, I.; Salpea, P.; Salim, A.; Sajjadi, S.F.; Tomic, D.; James, S.; et al. 11th edition of the IDF Diabetes Atlas: global, regional, and national diabetes prevalence estimates for 2024 and projections for 2050. Lancet Diabetes Endocrinol. 2026, 14(2), 149–56. [Google Scholar] [CrossRef] [PubMed]
- Ndumele, C.E.; Rangaswami, J.; Chow, S.L.; Neeland, I.J.; Tuttle, K.R.; Khan, S.S.; et al. Cardiovascular-Kidney-Metabolic Health: A Presidential Advisory From the American Heart Association. Circulation 2023, 148(20), 1606–35. [Google Scholar] [CrossRef] [PubMed]
- Thomas, M.C. The clustering of Cardiovascular, Renal, Adipo-Metabolic Eye and Liver disease with type 2 diabetes. Metabolism 2022, 128, 154961. [Google Scholar] [CrossRef] [PubMed]
- Romeo, S.; Vidal-Puig, A.; Husain, M.; Ahima, R.; Arca, M.; Bhatt, D.L.; et al. Clinical staging to guide management of metabolic disorders and their sequelae: a European Atherosclerosis Society consensus statement. Eur. Heart J. 2025. [Google Scholar] [CrossRef] [PubMed]
- Bakris, G.L.; Weir, M.R.; Shanifar, S.; Zhang, Z.; Douglas, J.; Van Dijk, D.J.; et al. Effects of blood pressure level on progression of diabetic nephropathy: Results from the RENAAL study. Arch Intern Med [Internet]. 2003. Available online: https://www.scopus.com/inward/record.uri?eid=2-s2.0-0038155497&doi=10.1001%2farchinte.163.13.1555&partnerID=40&md5=39ec0324d80e65fdf934a2f5d74bb7aa.
- Lewis, E.J.; Hunsicker, L.G.; Clarke, W.R.; Berl, T.; Pohl, M.A.; Lewis, J.B.; et al. Renoprotective Effect of the Angiotensin-Receptor Antagonist Irbesartan in Patients with Nephropathy Due to Type 2 Diabetes. N. Engl. J. Med. 2001, 345(12), 851–60. [Google Scholar] [CrossRef] [PubMed]
- Lewis, E.J.; Hunsicker, L.G.; Bain, R.P.; Rohde, R.D. The Effect of Angiotensin-Converting-Enzyme Inhibition on Diabetic Nephropathy. N. Engl. J. Med. 1993, 329(20), 1456–62. [Google Scholar] [CrossRef] [PubMed]
- Empagliflozin in Patients with Chronic Kidney Disease. N. Engl. J. Med. 2023, 388(2), 117–27. [CrossRef] [PubMed]
- Heerspink, H.J.L.; Stefánsson, B. V.; Correa-Rotter, R.; Chertow, G.M.; Greene, T.; Hou, F.F.; et al. Dapagliflozin in Patients with Chronic Kidney Disease. N. Engl. J. Med. 2020, 383(15), 1436–46. [Google Scholar] [CrossRef] [PubMed]
- Alicic, R.Z.; Rooney, M.T.; Tuttle, K.R. Diabetic Kidney Disease. Clin. J. Am. Soc. Nephrol. 2017, 12(12), 2032–45. [Google Scholar] [CrossRef] [PubMed]
- Savarese, G.; Lindberg, F.; Filippatos, G.; Butler, J.; Anker, S.D. Mineralocorticoid receptor overactivation: targeting systemic impact with non-steroidal mineralocorticoid receptor antagonists. Diabetologia 2024, 67(2), 246–62. [Google Scholar] [CrossRef] [PubMed]
- Pitt, B.; Filippatos, G.; Agarwal, R.; Anker, S.D.; Bakris, G.L.; Rossing, P.; et al. Cardiovascular Events with Finerenone in Kidney Disease and Type 2 Diabetes. N. Engl. J. Med. 2021, 385(24), 2252–63. [Google Scholar] [CrossRef] [PubMed]
- Bakris, G.L.; Agarwal, R.; Anker, S.D.; Pitt, B.; Ruilope, L.M.; Rossing, P.; et al. Effect of Finerenone on Chronic Kidney Disease Outcomes in Type 2 Diabetes. N. Engl. J. Med. 2020, 383(23), 2219–29. [Google Scholar] [CrossRef] [PubMed]
- Agarwal, R.; Joseph, A.; Anker, S.D.; Filippatos, G.; Rossing, P.; Ruilope, L.M.; et al. Hyperkalemia Risk with Finerenone: Results from the FIDELIO-DKD Trial. J. Am. Soc. Nephrol. 2022, 33(1), 225–37. [Google Scholar] [CrossRef] [PubMed]
- Idowu, A.; Bryan Lo, K.; Adebolu, O.; Hamilton, M.; Abdelmaseeh, P.; Navaneethan, S.D.; et al. Hyperkalemia risk of finerenone versus spironolactone in CKD patients with type 2 diabetes. Nephrol. Dial. Transplant. 2025, 40(10), 1996–9. [Google Scholar] [CrossRef] [PubMed]
- Kerendia Product Information. European Medicines Agency [Internet] Kerendia Product Information. 2026. Available online: https://www.ema.europa.eu/en/medicines/human/EPAR/kerendia#product-info (accessed on 30 April 2026).
- Özdede, M.; Yadigar, S.; Güven, A.T.; Akgür, S.; Arslan, F.; Sezen, M.; et al. Hyperkalemia Risk with Finerenone in Diabetic Kidney Disease: A Real-World Analysis from the FINE-TURK Cohort; Preprints (Basel), May 2026. [Google Scholar] [CrossRef]
- Yadigar, S.; Akgür, S.; Arslan, F.; Sezen, M.; Özcan, B.; Ayaz, E.Y.; et al. Real-World Effects of Finerenone in Diabetics Kidney Disease: Data From Fine-Turk Study (Preprint) [Internet]. 2026. Available online: https://www.researchsquare.com/article/rs-9043582/v1. [CrossRef]
- Agarwal, R.; Green, J.B.; Heerspink, H.J.L.; Mann, J.F.E.; McGill, J.B.; Mottl, A.K.; et al. Finerenone with Empagliflozin in Chronic Kidney Disease and Type 2 Diabetes. N. Engl. J. Med. 2025, 393(6), 533–43. [Google Scholar] [CrossRef] [PubMed]
- Kovesdy, C.P.; Ebert, N.; Vizcaya, D.; Walsh, M.; Kosiborod, M.N.; Layton, J.B.; et al. Change in Urine Albumin-Creatinine Ratio and Occurrence of Hyperkalemia in Patients Initiating Finerenone in the USA: A Cohort Study from the FOUNTAIN Platform. Nephron 2025, 149(7), 371–83. [Google Scholar] [CrossRef] [PubMed]
- Wheeler, D.C.; Pantalone, K.M.; Guo, L.; Desai, N.R.; Correa-Rotter, R.; Nicholas, S.B.; et al. Dosing, treatment patterns and safety of finerenone use in routine care: an interim analysis of the prospective, real-world and observational FINE-REAL study. Clin. Kidney J. 2025, 18(11). [Google Scholar] [CrossRef] [PubMed]
- Stevens, P.E.; Ahmed, S.B.; Carrero, J.J.; Foster, B.; Francis, A.; Hall, R.K.; et al. KDIGO 2024 Clinical Practice Guideline for the Evaluation and Management of Chronic Kidney Disease. Kidney Int. 2024, 105(4), S117–314. [Google Scholar] [CrossRef] [PubMed]
Figure 1.
Forest plot of factors associated with clinically significant hyperkalemia in univariate logistic regression analyses.
Figure 1.
Forest plot of factors associated with clinically significant hyperkalemia in univariate logistic regression analyses.
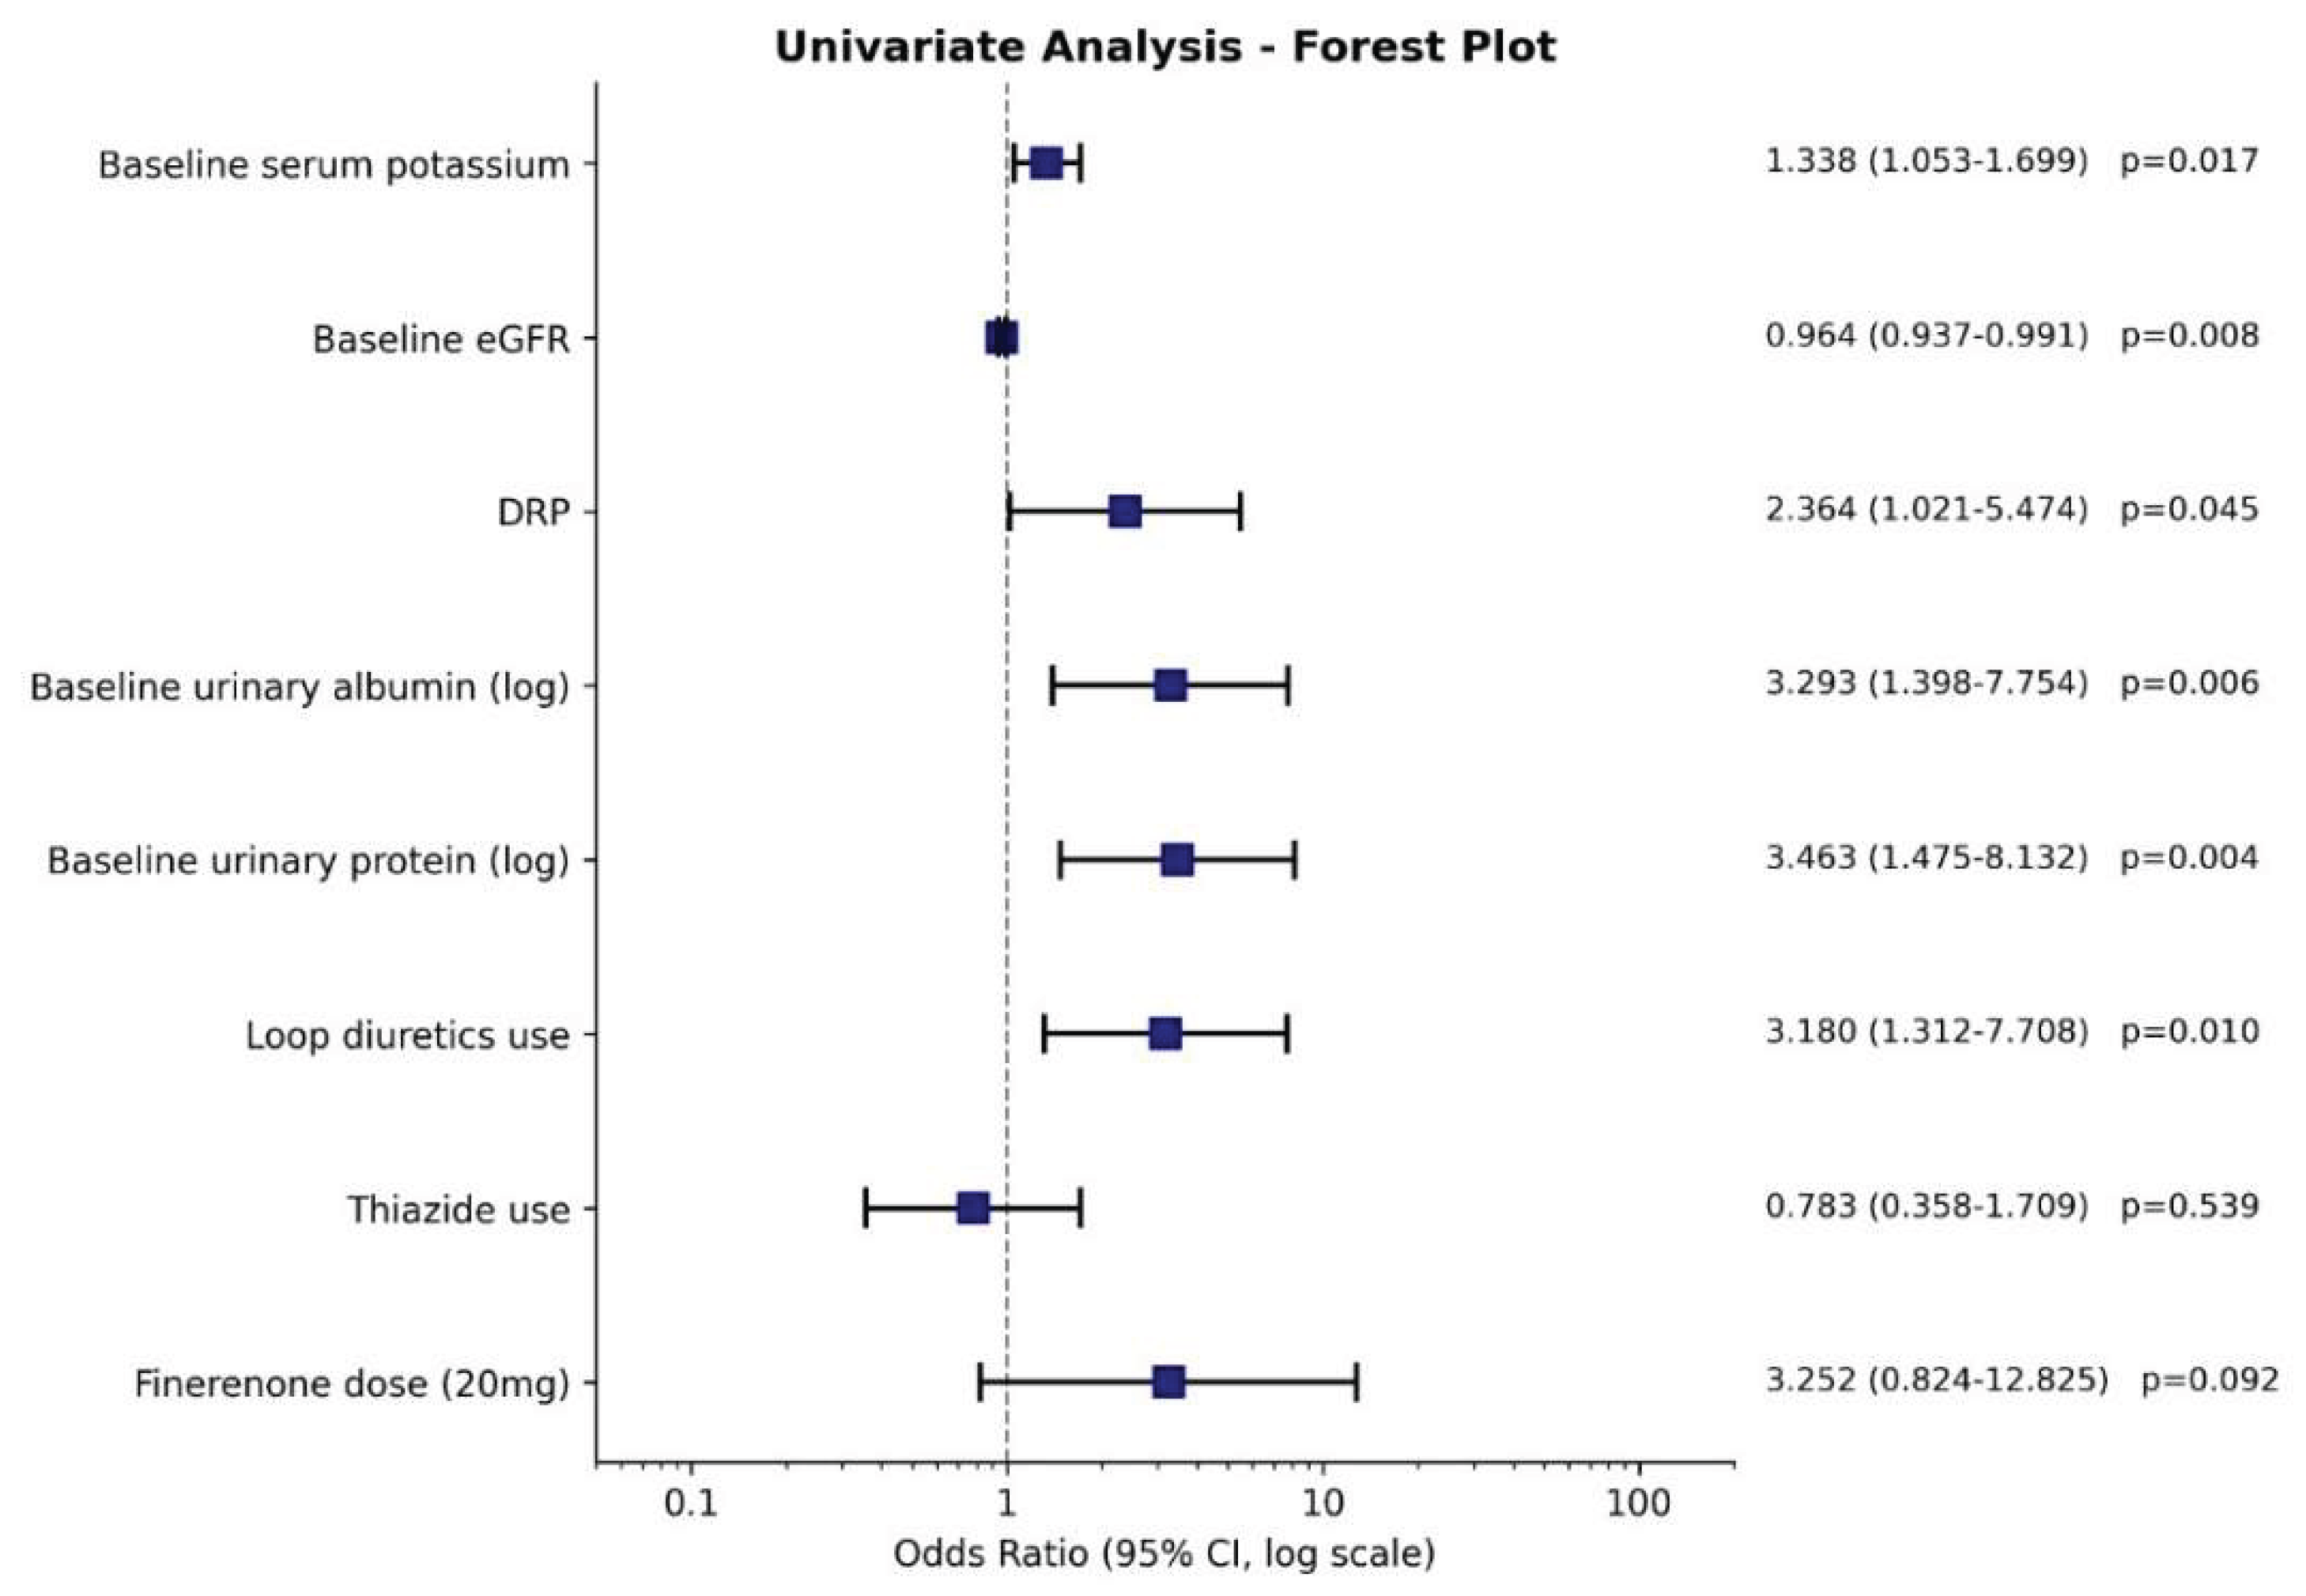
Figure 2.
Forest plot of factors associated with clinically significant hyperkalemia in multivariable logistic regression analyses.
Figure 2.
Forest plot of factors associated with clinically significant hyperkalemia in multivariable logistic regression analyses.
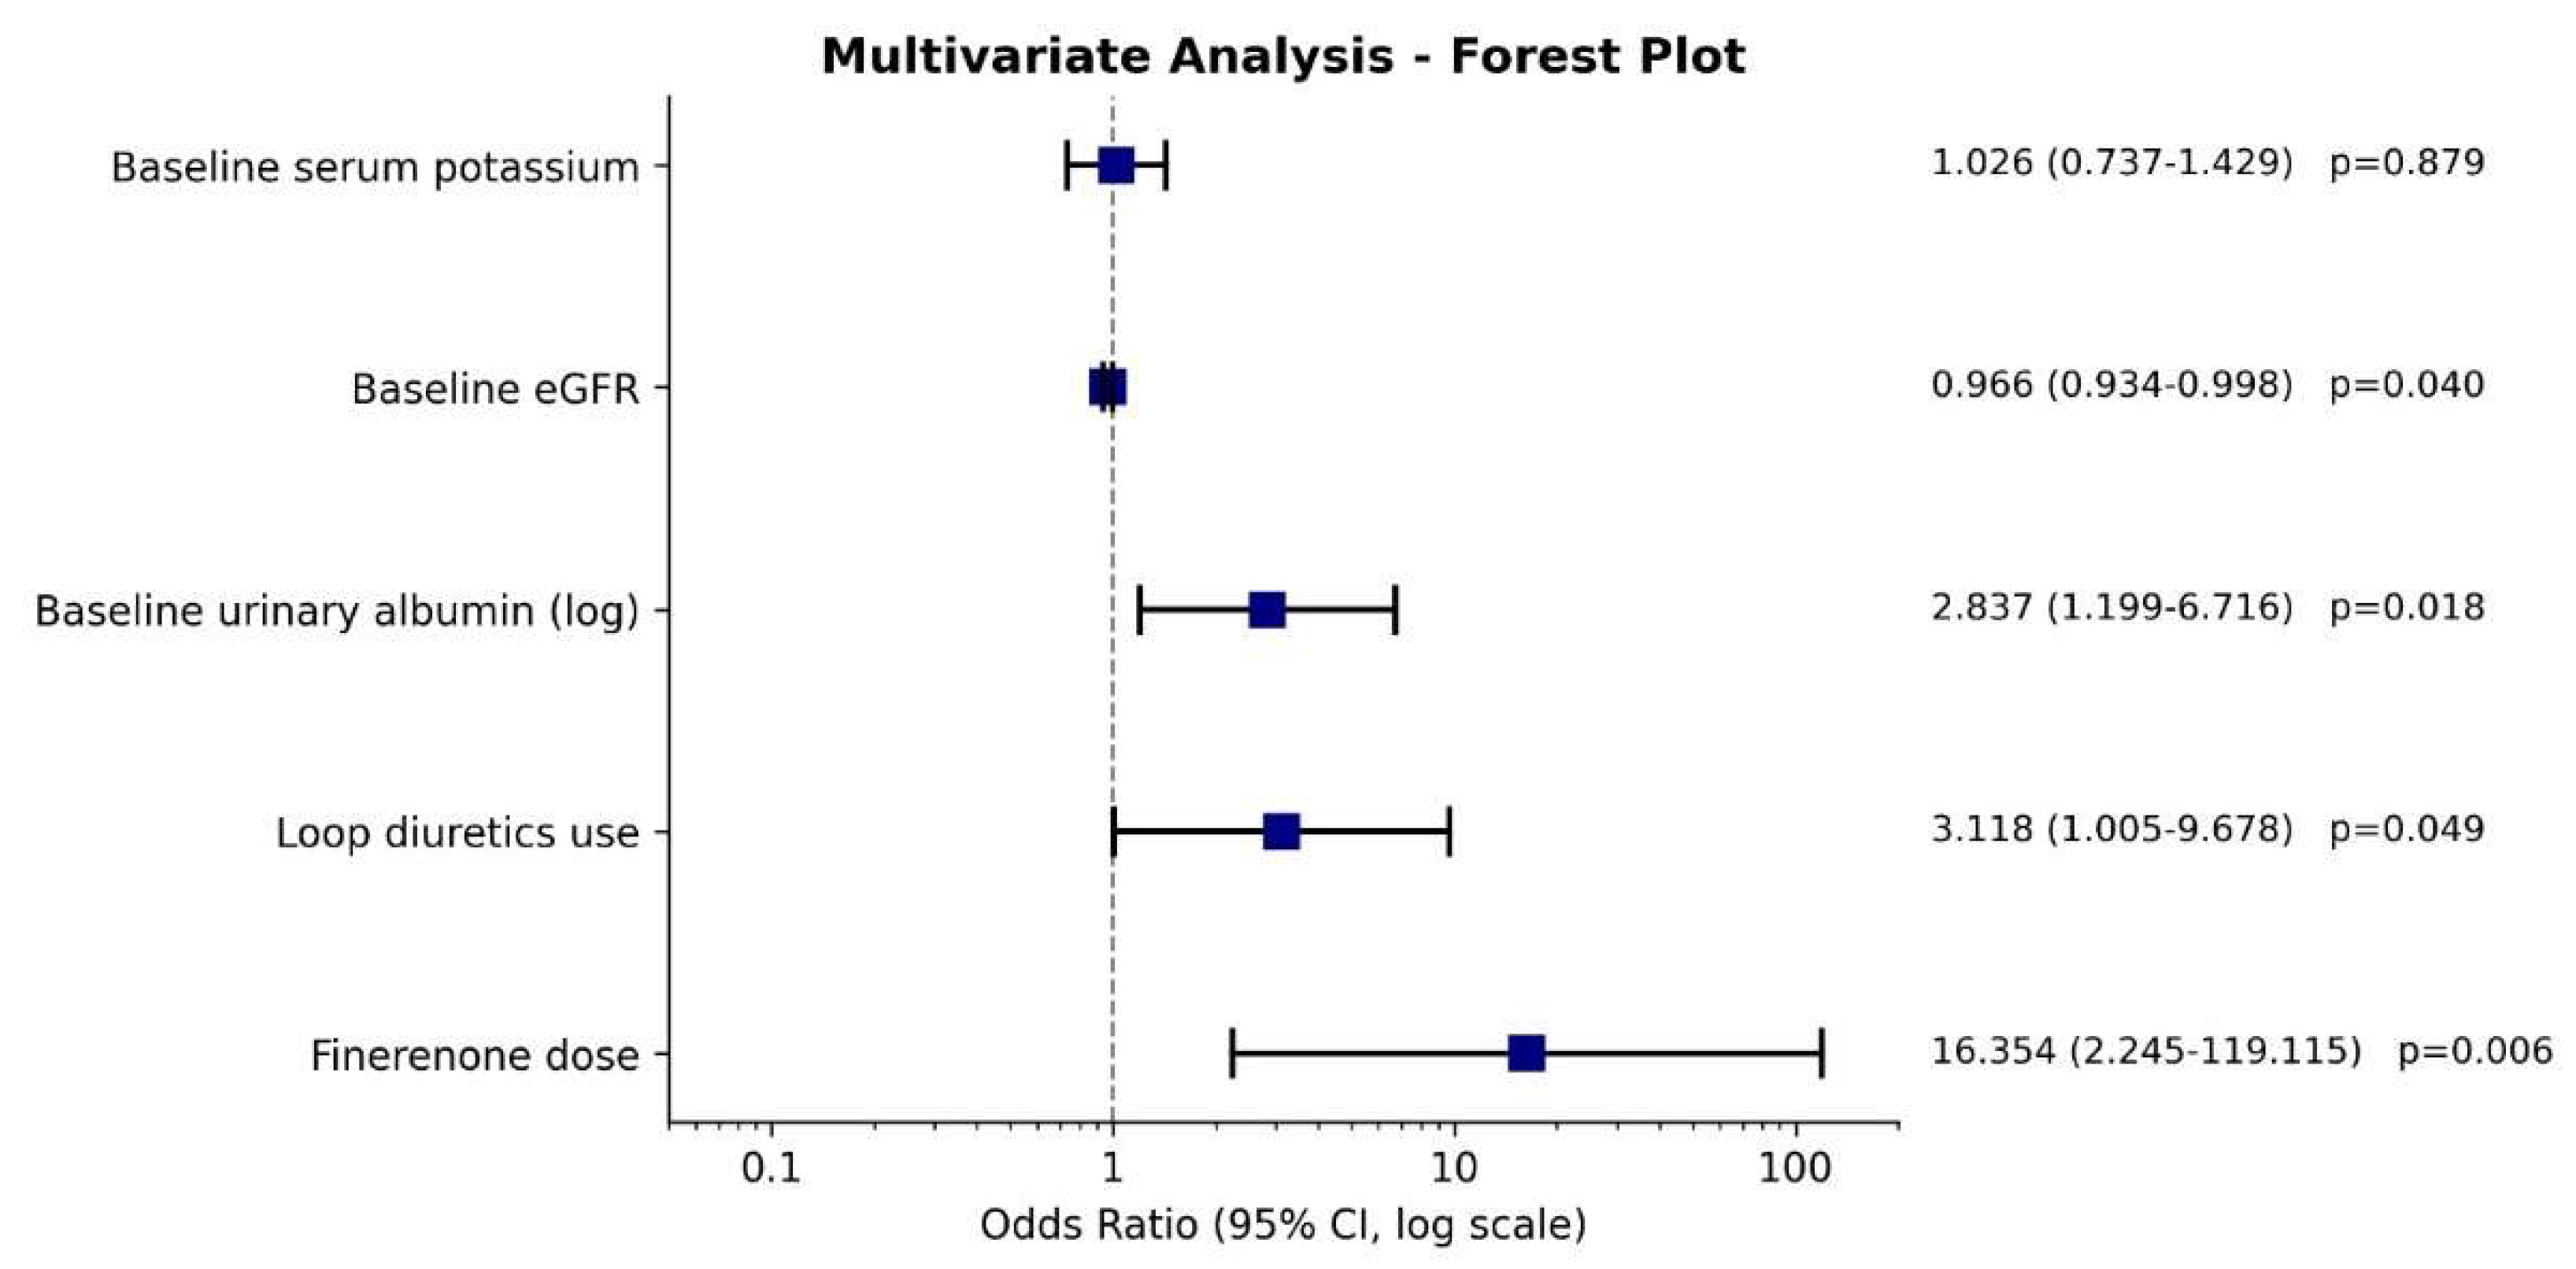

Table 1.
Baseline patient characteristics according to baseline serum potassium categories and follow-up hyperkalemia status.
Table 1.
Baseline patient characteristics according to baseline serum potassium categories and follow-up hyperkalemia status.
| TOTAL | BASELINE POTASSIUM | FOLLOW-UP POTASSIUM | |||||
|---|---|---|---|---|---|---|---|
| (N=166) | K = 4.9 – 5.0 (N = 119) |
K = 5.1 – 5.5 (N = 47) |
P* | K < 5.5 (N = 131) |
K ≥ 5.5 (N=35) |
P* | |
| Demographics and Physical Examination | |||||||
| Age | 61.5 (54 – 70) | 61 (54 – 70) | 62 (54 – 69) | 0.87 | 62 (54 – 69) | 59 (54 – 71) | 0.804 |
| Sex Female Male |
85 (51.2%) 81 (48.8%) |
58 (48.7%) 61 (51.3%) |
27 (57.4%) 20 (42.6%) |
0.312 |
66 (50.4%) 65 (49.6%) |
19 (54.3%) 16 (45.7%) |
0.681 |
| BMI | 29.1 (26.3 – 33.0) | 28.4 (25.7 – 32.7) | 30.9 (28 – 33.3) | 0.008 | 29.0 (25.8 – 33) | 29.4 (26.9 – 33.1) | 0.664 |
| Systolic BP | 130 (125 – 144) | 130 (127 – 140) | 132 (123 – 149) | 0.786 | 130 (125 – 140) | 140 (130 – 154) | 0.096 |
| Diastolic BP | 80 (72 – 88) | 80 (75 – 90) | 76 (70 – 80) | 0.023 | 80 (70 – 88) | 80 (73 – 89) | 0.575 |
| Comorbidities | |||||||
| Hypertension | 155 (93.4%) | 111 (93.3%) | 44 (93.6%) | 0.937 | 120 (91.6%) | 35 (100%) | 0.076 |
| CAD | 61 (37.2%) | 45 (38.5%) | 16 (34%) | 0.597 | 50 (38.8%) | 11 (31.4%) | 0.426 |
| Stroke | 19 (11.7%) | 14 (12.1%) | 5 (10.6%) | 0.797 | 15 (11.6%) | 4 (11.8%) | 0.982 |
| DRP | 75 (50%) | 52 (48.1%) | 23 (54.8%) | 0.467 | 55 (45.8%) | 20 (66.7%) | 0.041 |
| RAS Inhibitors | |||||||
| ACE inhibitor | 65 (39.4%) | 46 (38.7%) | 19 (41.3%) | 0.755 | 51 (39.2%) | 14 (40%) | 0.934 |
| ARB | 80 (48.5%) | 56 (47.1%) | 24 (52.2%) | 0.556 | 64 (49.2%) | 16 (45.7%) | 0.712 |
| Maximal RAAS blockade | 105 (67.3%) | 78 (69%) | 27 (62.8%) | 0.458 | 82 (66.7%) | 23 (69.7%) | 0.742 |
| SGLT-2 Inhibitors and GLP-1 Receptor Agonists | |||||||
| SGLT-2 inhibitor | 142 (85.5%) | 100 (84%) | 42 (89.4%) | 0.379 | 114 (87%) | 28 (80%) | 0.294 |
| GLP-1 receptor agonist | 1 (0.6%) | 0 | 1 (2.1%) | 0.283 | 1 (0.8%) | 0 | 1 |
| Finerenone | |||||||
| Finerenone dose 10mg 20mg |
157 (94.6%) 9 (5.4%) |
116 (97.5%) 3 (2.5%) |
41(87.2%) 6 (12.8%) |
0.009 |
126 (96.2%) 5 (3.8%) |
31 (88.6%) 4 (11.4%) |
0.095 |
| Other Glucose-Lowering Medications | |||||||
| DPP-4 inhibitor | 99 (59.6%) | 70 (58.8%) | 29 (61.7%) | 0.733 | 79 (60.3%) | 20 (57.1%) | 0.735 |
| Insulin | 90 (56.3%) | 61 (53%) | 29 (64.4%) | 0.191 | 70 (56%) | 20 (57.1%) | 0.904 |
| Metformin | 70 (42.2%) | 51 (42.9%) | 19 (40.4%) | 0.775 | 57 (43.5%) | 13 (37.1%) | 0.498 |
| Sulfonylurea | 8 (4.8%) | 5 (4.2%) | 3 (6.4%) | 0.554 | 5 (3.8%) | 3 (8.6%) | 0.367 |
| Anti-Hypertensive Medications | |||||||
| CCB | 84 (50.9%) | 59 (49.6%) | 25 (54.3%) | 0.583 | 61 (46.9%) | 23 (65.7%) | 0.048 |
| Beta-blocker | 75 (45.5%) | 48 (40.3%) | 27 (58.7%) | 0.034 | 58 (44.6%) | 17 (48.6%) | 0.677 |
| Alpha-blocker | 20 (12.1%) | 13 (10.9%) | 7 (15.2%) | 0.449 | 14 (10.8%) | 6 (17.1%) | 0.305 |
| Thiazide | 64 (38.8%) | 41 (34.5%) | 23 (50%) | 0.066 | 52 (40%) | 12 (34.3%) | 0.538 |
| Loop diuretics | 27 (16.7%) | 17 (14.3%) | 10 (23.3%) | 0.176 | 16 (12.6%) | 11 (31.4%) | 0.008 |
| Any anti-hypertensive | 160 (96.4%) | 114 (95.8%) | 46 (97.9%) | 0.519 | 125 (95.4%) | 35 (100%) | 0.197 |
| Lipid-Lowering Medications | |||||||
| Statin | 100 (60.6%) | 70 (59.3%) | 30 (63.8%) | 0.593 | 80 (61.1%) | 20 (58.8 %) | 0.811 |
| Laboratory | |||||||
| Baseline serum potassium (mEq/L) | 5.0 (4.9 – 5.1) | 4.9 (4.9 – 5.0) | 5.2 (5.1 – 5.3) | <0.001 | 4.9 (4.9 – 5.1) | 5.0 (5.0 – 5.1) | 0.007 |
| Baseline eGFR (mL/min/1.73m2) | 44 (34 – 57) | 45 (36 – 58) | 41 (32 – 55) | 0.128 | 47 (36 – 60) | 39 (32 – 46) | 0.011 |
| Baseline urinary albumin (mg/g creatinine) | 1392 (373 – 2901) | 949 (247 – 2370) | 1900 (805 – 4349) | 0.018 | 903 (258 – 2105) | 3096 (1527 – 4808) | <0.001 |
| Baseline urinary protein (mg/g creatinine) | 1950 (732 – 4194) | 1423 (610 – 3400) | 2269 (1192 – 5779) | 0.044 | 1419 (660 – 3142) | 4260 (1220 – 6717) | 0.001 |
| Baseline serum sodium (mEq/L) | 139 (137 – 141) | 139 (138 – 141) | 139 (137 – 141) | 0.947 | 139 (138 – 141) | 138 (137 – 142) | 0.833 |
| Baseline serum albumin (g/dL) | 4.1 (3.9 – 4.3) | 4.1 (3.9 – 4.3) | 4.1 (3.8 – 4.5) | 0.619 | 4.1 (3.9 – 4.3) | 4.0 (3.5 – 4.3) | 0.356 |
| Baseline serum uric acid (mg/dL) | 6.4 (5.5 – 7.5) | 6.5 (5.6 – 7.5) | 6.4 (5.2 – 7.4) | 0.564 | 6.4 (5.3 – 7.4) | 6.7 (5.6 – 7.6) | 0.430 |
| Baseline HbA1c (%) | 7.6 (6.7 – 8.4) | 7.4 (6.6 – 8.4) | 7.9 (7 – 8.5) | 0.138 | 7.6 (6.7 – 8.4) | 7.4 (6.6 – 8.4) | 0.776 |
ACE: Angiotensin converting enzyme, ARB: Angiotensin receptor blocker, BP: Blood pressure, CCB: Calcium channel blocker, DPP-4: Dipeptidyl peptidase-4, DRP: Diabetic retinopathy, eGFR: Estimated glomerular filtration rate, GLP-1: Glucagon-like peptide-1, HbA1c: Glycated hemoglobin, RAAS: Renin angiotensin aldosterone system, SGLT2: Sodium-glucose transporter-2. *p values with statistical significance are shown in bold.
Table 2.
Distribution of follow-up serum potassium levels according to baseline potassium categories.
Table 2.
Distribution of follow-up serum potassium levels according to baseline potassium categories.
| TOTAL | BASELINE POTASSIUM | |||
|---|---|---|---|---|
| (N = 166) | K = 4.9 – 5.0 (N = 119) |
K = 5.1 – 5.5 (N = 47) |
P* | |
| Follow-up serum potassium (mEq/L) | 5.1 (4.9 – 5.4) | 5 (4.9 – 5.3) | 5.2 (5.1 – 5.5) | 0.003 |
| Serum potassium change | 0.1 (0 – 0.4) | 0.1 (0 – 0.4) | 0.1 (-0.1 – 0.2) | 0.162 |
| Follow-up serum potassium (Ordinal) <5.0 (mEq/L) 5.0 – 5.4 (mEq/L) 5.5 – 5.9 (mEq/L) ≥ 6.0 (mEq/L) |
46 (27.7%) 85 (51.2%) 25 (15.1%) 10 (6%) |
40 (33.6%) 58 (48.7%) 15 (12.6%) 6 (5%) |
6 (12.8%) 28 (59.6%) 9 (19.1%) 4 (8.5%) |
0.052 |
Table 3.
Management strategies and treatment modifications following hyperkalemia.
| TOTAL | FOLLOW-UP POTASSIUM | ||||
|---|---|---|---|---|---|
| Management for follow-up serum potassium levels | (N = 164*) | <5.0 (mEq/L) (N = 46) |
5.0 – 5.4 (mEq/L) (N = 86) |
5.5 – 5.9 (mEq/L) (N = 23) |
≥ 6.0 (mEq/L) (N = 9) |
| No intervention | 126 (76.8%) | 46 (100%) | 77 (89.5%) | 3 (13%) | 0 |
| Potassium binder initiation | 24 (14.6%) | 0 | 9 (10.5%) | 15 (65.2%) | 0 |
| Finerenone cessation | 12 (7.3%) | 0 | 0 | 3 (13%) | 9 (100 %) |
| Bicarbonate initiation | 2 (1.2%) | 0 | 0 | 2 (8.7%) | 0 |
* 2 patients’ data on hyperkalemia management were missing.
Table 4.
Factors associated with hyperkalemia: Univariate and multivariable logistic regression analyses.
Table 4.
Factors associated with hyperkalemia: Univariate and multivariable logistic regression analyses.
| UNIVARIATE ANALYSIS | ||
| OR (95%CI) | P* | |
| Baseline serum potassium | 1.338 (1.053 – 1.699) | 0.017 |
| Baseline eGFR | 0.964 (0.937 – 0.991) | 0.008 |
| DRP | 2.364 (1.021 – 5.474) | 0.045 |
| Baseline urinary albumin (log-transformed) | 3.293 (1.398 – 7.754) | 0.006 |
| Baseline urinary protein (log-transformed) | 3.463 (1.475 – 8.132) | 0.004 |
| Loop diuretics use | 3.180 (1.312 – 7.708) | 0.010 |
| Thiazide use | 0.783 (0.358 – 1.709) | 0.539 |
| Finerenone dose (20mg) | 3.252 (0.824 – 12.825) | 0.092 |
| MULTIVARIATE ANALYSIS | ||
| OR (95%CI) | P* | |
| Baseline serum potassium | 1.026 (0.737 – 1.429) | 0.879 |
| Baseline eGFR | 0.966 (0.934 – 0.998) | 0.040 |
| Baseline urinary albumin (log-transformed) | 2.837 (1.199 – 6.716) | 0.018 |
| Loop diuretics use | 3.118 (1.005 – 9.678) | 0.049 |
| Finerenone dose | 16.354 (2.245 – 119.115) | 0.006 |
| Nagelkerke R2 = 0.274 | ||
CI: Confidence interval, DRP: Diabetic retinopathy, eGFR: Estimated glomerular filtration rate, OR: Odds ratio *p values with statistical significance are shown in bold.
Table 5.
Sensitivity analyses of multivariable models for factors associated with hyperkalemia.
| MODEL 1 | OR (95%CI) | P* |
| Baseline serum potassium | 1.064 (0.795 – 1.425) | 0.677 |
| Baseline eGFR | 0.960 (0.931 – 0.990) | 0.010 |
| Baseline urinary protein (log-transformed) | 3.474 (1.339 – 9.014) | 0.010 |
| Loop diuretics use | 1.712 (0.614 – 4.770) | 0.304 |
| Finerenone dose | 17.773 (2.358 – 133.964) | 0.005 |
| Nagelkerke R2 = 0.248 | ||
| MODEL 2 | OR (95%CI) | P* |
| Baseline serum potassium | 1.049 (0.754 – 1.459) | 0.779 |
| Baseline eGFR | 0.974 (0.943 – 1.006) | 0.114 |
| Baseline urinary albumin (log-transformed) | 3.252 (1.202 – 8.797) | 0.020 |
| DRP | 1.414 (0.487 – 4.102) | 0.524 |
| Finerenone dose | 15.630 (1.157 – 211.206) | 0.038 |
| Nagelkerke R2 = 0.183 | ||
| MODEL 3 | OR (95%CI) | P* |
| Baseline serum potassium | 1.066 (0.774 – 1.468) | 0.695 |
| Baseline eGFR | 0.961 (0.930 – 0.992) | 0.015 |
| Baseline urinary albumin (log-transformed) | 3.302 (1.353 – 8.058) | 0.009 |
| Finerenone dose | 15.437 (2.116 – 112.630) | 0.007 |
| Nagelkerke R2 = 0.240 | ||
| MODEL 4 | OR (95%CI) | P* |
| Baseline serum potassium | 1.086 (0.784 – 1.503) | 0.619 |
| Baseline eGFR | 0.960 (0.930 – 0.992) | 0.013 |
| Baseline urinary albumin (log-transformed) | 3.322 (1.355 – 8.142) | 0.009 |
| Thiazide diuretics use | 0.692 (0.254 – 1.885) | 0.471 |
| Finerenone dose | 14.103 (1.910 – 104.159) | 0.009 |
| Nagelkerke R2 = 0.246 | ||
CI: Confidence interval, DRP: Diabetic retinopathy, eGFR: Estimated glomerular filtration rate, OR: Odds ratio *p values with statistical significance are shown in bold.
Disclaimer/Publisher’s Note: The statements, opinions and data contained in all publications are solely those of the individual author(s) and contributor(s) and not of MDPI and/or the editor(s). MDPI and/or the editor(s) disclaim responsibility for any injury to people or property resulting from any ideas, methods, instructions or products referred to in the content. |
© 2026 by the authors. Licensee MDPI, Basel, Switzerland. This article is an open access article distributed under the terms and conditions of the Creative Commons Attribution (CC BY) license.
Copyright: This open access article is published under a Creative Commons CC BY 4.0 license, which permit the free download, distribution, and reuse, provided that the author and preprint are cited in any reuse.