Submitted:
22 June 2026
Posted:
23 June 2026
You are already at the latest version
Abstract
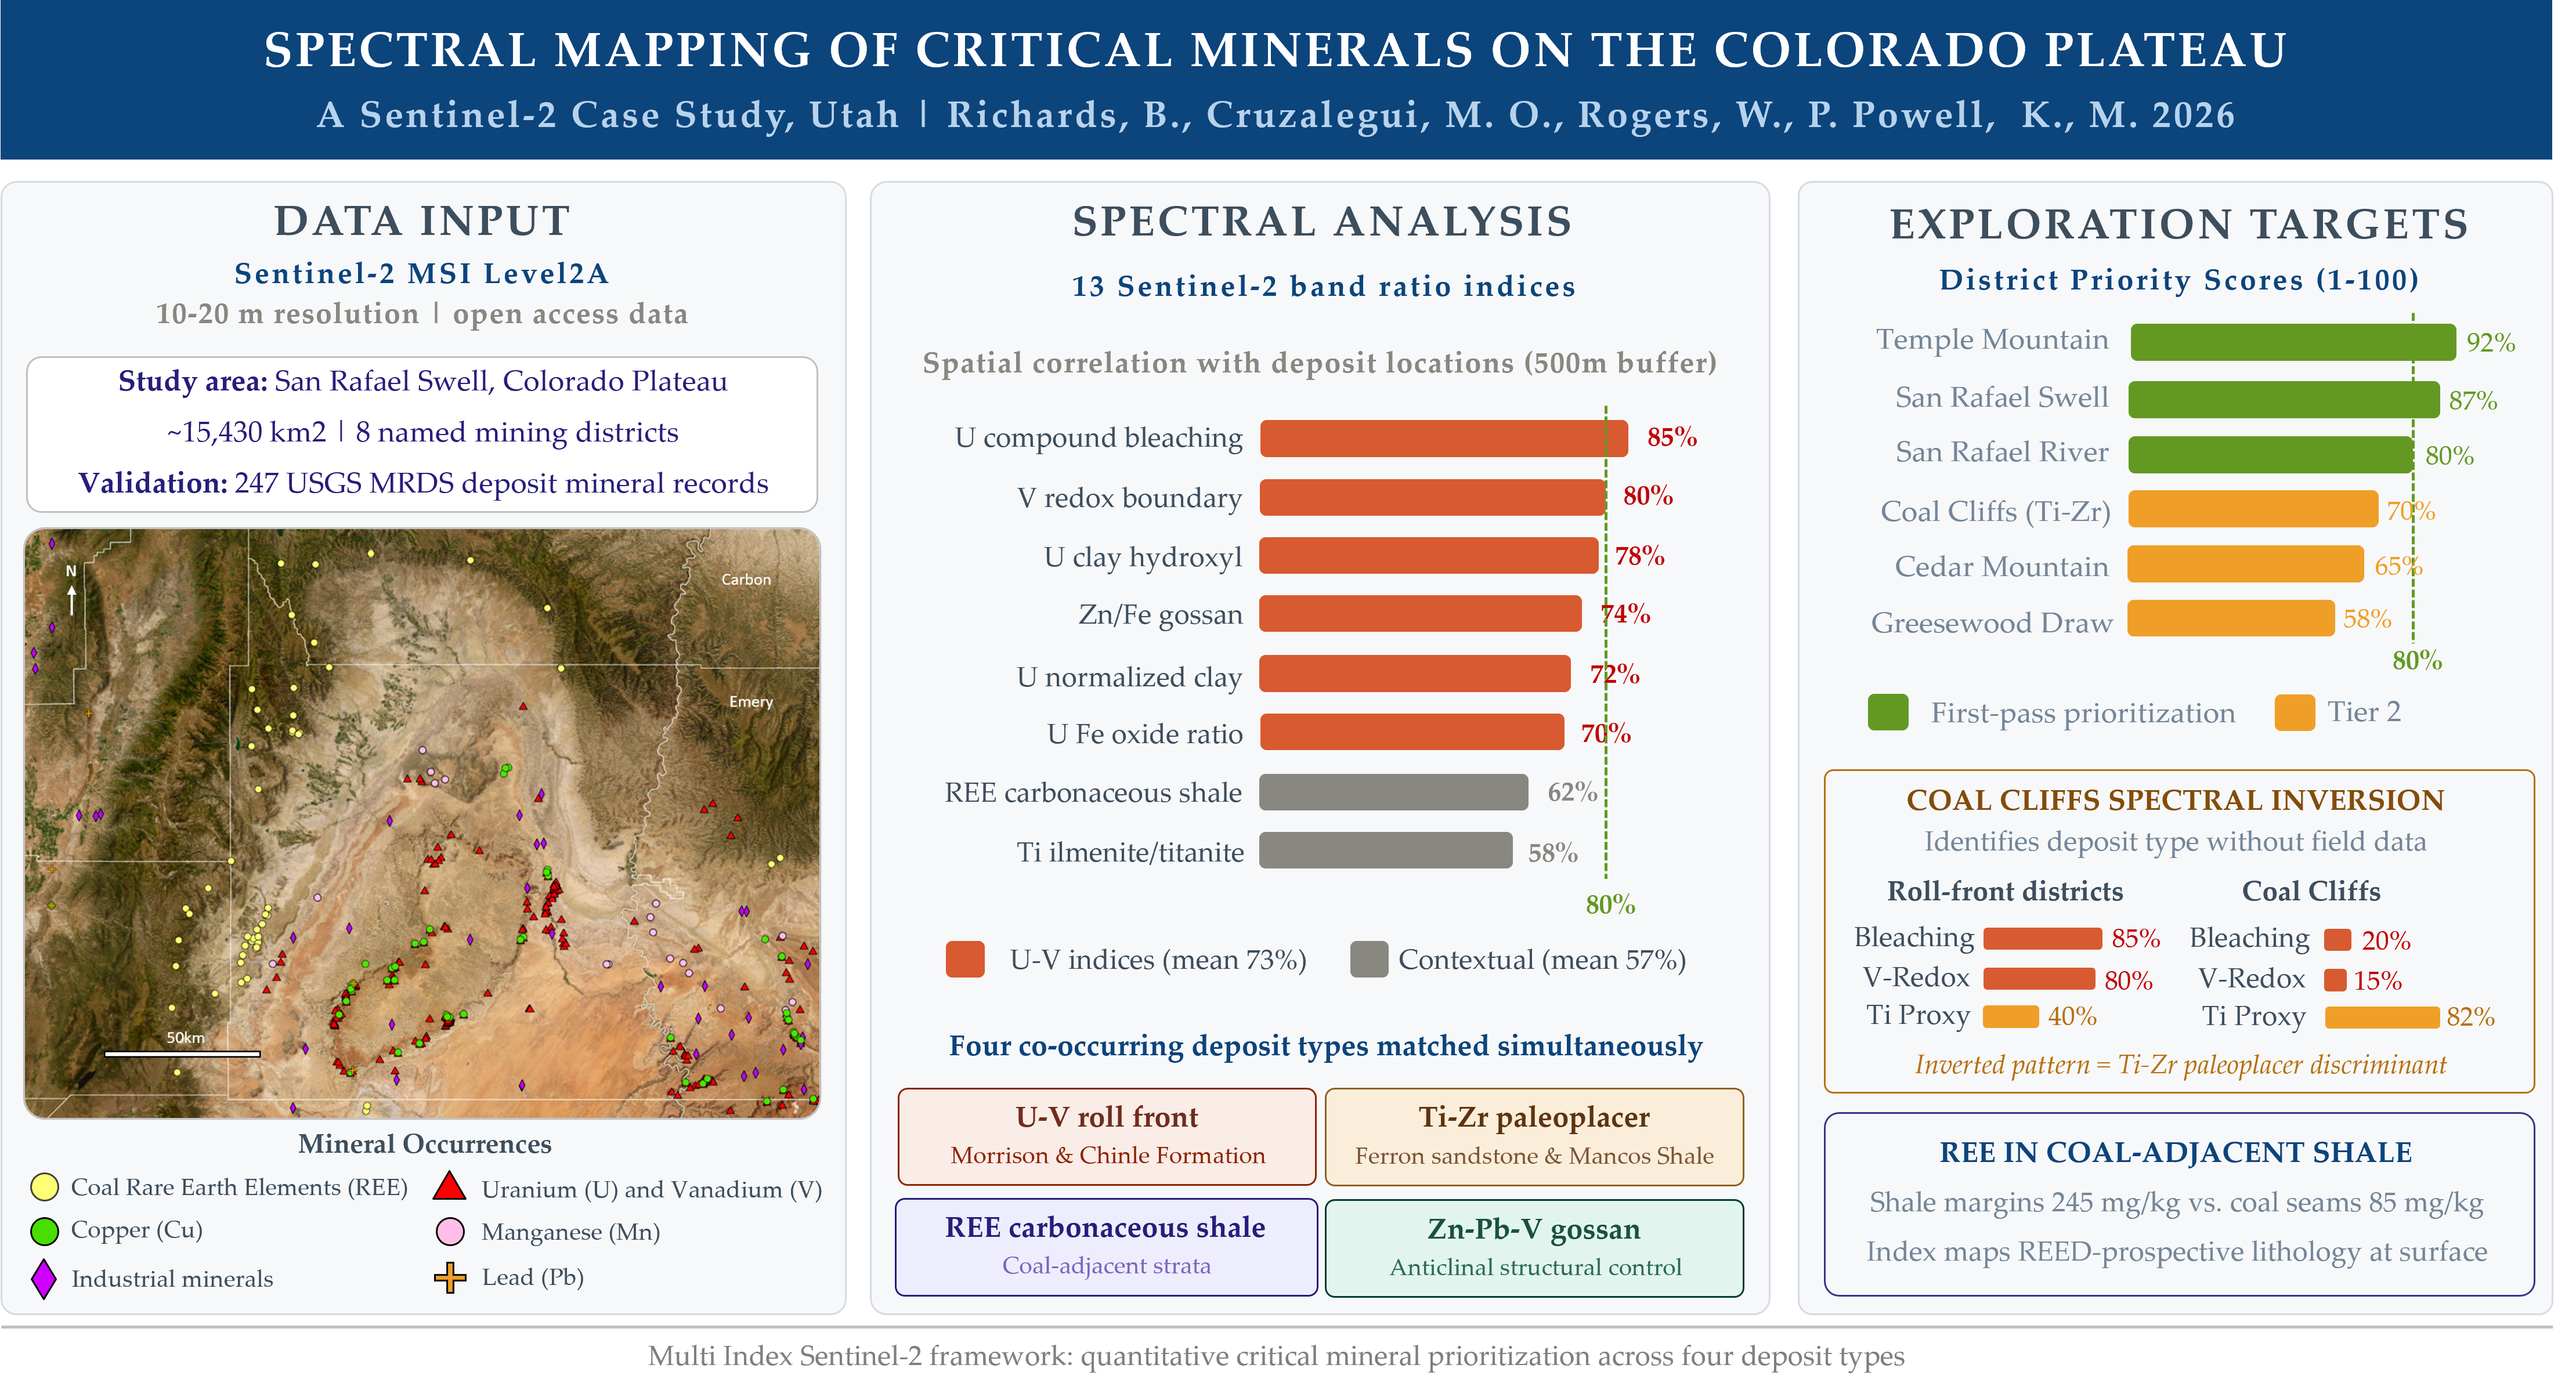
The San Rafael Swell, Utah, hosts eight critical mineral mining districts; uranium, vanadium, copper, titanium, and zirconium, and adjacent coalfields with rare earth element (REE) enrichment in coal-adjacent strata, yet remains unevaluated by modern satellite remote sensing. This study derives and validates 13 Sentinel-2 band-ratio indices targeting four deposit types: U-V roll-fronts, Cretaceous Ti-Zr paleoplacers, REE carbonaceous shales, and polymetallic gossans. Validation against a 247-location USGS MRDS deposit database within a 500 m tolerance radius yielded correlations of 50-85%; uranium-targeting indices averaged 73% versus 57% for contextual indices. A composite scoring framework identified Temple Mountain (92/100; Tier 1), San Rafael Swell (87/100; Tier 1), and San Rafael River (80/100; Tier 1) as highest-priority U-V targets. Coal Cliffs (70/100; Tier 2) returned an inverted spectral signature; Ti proxy 82%, bleaching 20%, V redox 15%, distinguishing Cretaceous paleoplacer from the roll-front system: a deposit-type discriminant unavailable from single-index analysis. Carbonaceous shale flanking coal seams (mean 245 mg/kg REE) were highlighted as a potential primary REE host over the coal seams (mean 85 mg/kg), with the index correctly mapping this REE-prospective lithology at surface. Results demonstrate that a multi-index Sentinel-2 framework provides quantitative critical mineral prioritization across deposit types at reconnaissance cost.
Keywords:
critical minerals
; Sentinel-2
; band-ratio indices
; uranium-vanadium
; Colorado Plateau
; San Rafael Swell
; rare earth elements
; mineral exploration
; Utah
; minerals
1. Introduction
Domestic supply chains for critical minerals essential to the energy transition and national defense have become a strategic priority for the United States and allied economies. The 2025 revision of the U.S. Geological Survey federal critical minerals list designated 60 commodities, expanded from 50 in 2022 and 35 in 2018, based on economic importance and supply chain vulnerability [2]. Sequential export controls imposed by China on gallium, germanium, and antimony (December 2024; [3]), followed by licensing requirements on medium and heavy rare earths (samarium, gadolinium, terbium, dysprosium, lutetium, scandium, yttrium) in addition to lanthanum, cerium, neodymium, praseodymium (April 2025; [4]), have since sharpened the urgency of domestic assessment.
The scientific question this study addresses is whether a single multispectral remote sensing framework, applied to freely available Sentinel-2 imagery, can simultaneously map and validate the surface geochemical signatures of four geologically distinct critical mineral deposit types occupying the same study area, sandstone-hosted uranium-vanadium roll-front deposits, Cretaceous titanium-zirconium beach paleoplacers, REE-enriched carbonaceous coal-adjacent shales, and structurally controlled polymetallic (Zn-Pb-V) gossans, and generate a quantitative, auditable priority ranking of exploration targets that integrates spectral evidence with geological and commodity-criticality criteria. This problem is non-trivial for two reasons. First, the four deposit types have fundamentally different geochemical signatures and surface spectral expressions, requiring a multi-index approach rather than any single spectral ratio. Second, Sentinel-2 is a broadband multispectral instrument with 13 channels of 15-175 nm bandwidth, compared to the 5-10 nm resolution of hyperspectral instruments conventionally preferred for mineral mapping; demonstrating actionable exploration guidance from Sentinel-2 would expand the accessible toolkit for domestic critical mineral reconnaissance across the large areas of the western United States not yet covered by Earth MRI hyperspectral campaigns [5].
This study derives 13 Sentinel-2 band-ratio spectral indices targeting uranium, vanadium, iron, titanium, REE, and scandium mineralization proxies and validates them by overlay against a 247-location USGS Mineral Resources Data System deposit database within a 500 m spatial tolerance radius. A composite priority scoring framework integrating spectral performance (40%), production history (25%), host-rock geological favorability (20%), and 2025 USGS commodity criticality (15%) is applied to all eight named mining districts and the Carbon County REE target. The framework identifies three Tier 1 first-pass prioritization uranium-vanadium districts (Temple Mountain, 92/100; San Rafael Swell, 87/100; San Rafael River, 80/100), demonstrates that the Coal Cliffs paleoplacer district produces a diagnostically inverted spectral index pattern that provides a distinctive spectral pattern that identifies deposit type without field data, and confirms that the REE carbonaceous shale index correctly maps the surface expression of the REE-prospective lithological package documented by Coe et al. [6]. Taken together, these results demonstrate that a structured multi-index Sentinel-2 framework provides a quantitative, reproducible basis for district-scale critical mineral prioritization across geologically diverse target types, at the cost of a freely available satellite dataset and standard image processing software, and that the 13 indices collectively capture the key geochemical surface signatures relevant to all four deposit types present in this study area.
2. Materials and Methods
2.1. Study Area
Utah hosts known or potential resources of 40 of the 50 designated critical minerals and actively produces six [7,8], yet large portions of its most historically productive mineral provinces remain uncharacterized at the commodity and deposit-type level using modern remote sensing tools. The San Rafael Swell region of Emery County, encompassing eight named mining districts with documented production of uranium, vanadium, copper, titanium, and zirconium from Late Triassic, Jurassic, and Cretaceous sedimentary sequences, alongside rare earth element (REE) enrichment in coal-adjacent strata of adjacent Carbon County, is among the most compelling of these gaps. Primary exploration in the region was conducted during the Atomic Energy Commission uranium boom of 1948-1965 [9,10], targeting uranium alone with airborne radiometric surveys that predate multispectral satellite imagery and that left co-occurring critical minerals systematically unevaluated.
Sandstone-hosted uranium-vanadium deposits of the Colorado Plateau form at the geochemical boundary, the roll-front, between oxidizing, uranium-bearing groundwater advancing through permeable fluvial sandstones and the organic-rich reducing sedimentary facies into which it flows [11,12,13]. At this interface, dissolution of red-bed hematite (Fe3+) on the oxidized side produces the pale bleached sandstone characteristic of Colorado Plateau U-V outcrop, while concurrent clay mineral precipitation creates hydroxyl absorption features detectable in Sentinel-2 SWIR bands B11 and B12. On the reducing side, ferrous iron (Fe2+) absorptions near 1.0 µm are detectable in B8A/B04 ratios, and vanadium (V5+) in the secondary ore mineral carnotite produces spectral features in the blue green (B02) and SWIR (B11-B12) regions [14]. The spatial relationship between these paired oxidized-side and reduced-side index anomalies brackets the ore-hosting redox interface and is the core diagnostic of roll-front geometry in this study. For the Coal Cliffs Ti-Zr paleoplacer target, heavy mineral beach sands in the basal Ferron Sandstone Member of the Cretaceous Mancos Shale [6], the expected spectral signature is inverted: elevated Ti proxy response but absent bleaching and V redox anomalies, because no roll-front geochemistry is present. For the Carbon County REE target, Coe et al. [6] demonstrated that carbonaceous shale and siltstone units flanking coal seams in the Uinta coal belt contain mean whole-rock REE concentrations of 215-245 mg/kg, above the 200 mg/kg enrichment threshold, while coal seams themselves are not REE-enriched (mean 85 mg/kg); the low VNIR-SWIR reflectance of these organic-rich units provides a detectable spectral proxy.
Spectral remote sensing has been applied to Colorado Plateau uranium exploration since the first generation of Landsat band-ratio techniques in the 1980s [15], and ASTER SWIR data have been used to map clay mineral alteration assemblages in analogous arid-terrain settings [16,17]. Sentinel-2, operational since 2015, substantially advances accessibility through its open data policy, 5-day revisit, and 10-20 m spatial resolution [18,19], and has been demonstrated to replicate key mineralogical patterns from ASTER in semi-arid exploration terrain. Multi-index composite approaches that combine several spectral ratios to build exploration confidence have been shown to substantially outperform single-index methods in discriminating mineralized from unmineralized zones [20]. However, no multi-index Sentinel-2 framework calibrated to the Colorado Plateau sandstone-hosted U-V deposit model has been published; no study has attempted simultaneous Sentinel-2 mapping of roll-front, paleoplacer, and REE-in-coal deposit types in the same geological setting; and no spectral assessment of any kind has been applied to the eight named mining districts of the San Rafael Swell region. This study fills all three gaps within a unified analytical framework applied to a study area of high critical mineral diversity and strategic importance.
2.2. Experimental Design
This study employs a multi-stage remote sensing analysis framework to map and spatially validate the surface geochemical signatures of four co-occurring critical mineral deposit types across the San Rafael Swell and Carbon County study area (~5,957 sq mi ≈ ~15,430 km²), south-central Utah). The analytical pipeline comprises six sequential components (Figure 1; Table 1): (i) Sentinel-2 satellite data acquisition and pre-processing; (ii) purpose-built spectral reference library development; (iii) derivation of 13 targeted band-ratio spectral indices; (iv) compilation and classification of a georeferenced mineral occurrence reference database; (v) spatial correlation analysis between index anomalies and deposit locations; and (vi) composite priority scoring of eight named mining districts. All remote sensing analysis was performed in ENVI version 6.x [21].
2.2. Sentinel-2 Data Acquisition and Pre-Processing
Sentinel-2 MSI Level-2A (L2A) surface reflectance data were acquired from the ESA Copernicus Data Space for scenes covering Emery and Carbon Counties, Utah. Scene selection prioritized cloud cover below 5%, dry-season acquisition (May-October) to minimize vegetation masking of bare rock, and low aerosol optical depth. L2A products incorporate Sen2Cor v2.11 atmospheric correction (aerosol optical thickness retrieval, water vapor estimation, terrain illumination correction) [19]. Scene Classification Layer (SCL) masks excluded cloud, cloud shadow, saturated, and water pixels. All 12 surface-reflectance bands were resampled to 20 m resolution in ENVI prior to analysis; Band B10 (cirrus, 1.375 µm) falls within the atmospheric water vapor absorption window and was excluded from all spectral matching calculations.
2.3. Spectral Library Development
A spectral reference library was developed to characterize the surface reflectance signatures of ten geologically distinct material classes relevant to the deposit types and lithological framework of the study area. The library was constructed in two stages: (i) generation of physically grounded full-resolution reflectance spectra across the VNIR-SWIR range (431 bands; 0.35-2.50 µm; 5 nm step); and (ii) convolution of those full-resolution spectra to the Sentinel-2 MSI band positions to produce a 13-band reference dataset matched to the image data. The library serves as a reference for geological interpretation of index anomaly patterns and for contextual validation of index outputs against documented material spectral signatures.
Full-resolution spectra were constructed for each material class using a Gaussian absorption band model parameterized from the USGS Spectral Library Version 7 [22], supplementary uranium-vanadium spectroscopy publications [23], and published iron-oxide, clay, and coal reflectance data [24]. Spectra were convolved to Sentinel-2 band positions using Gaussian spectral response functions (SRFs) from the ESA SRF dataset [25]
R(bᵢ) = Σ [r(λ) × SRF(bᵢ, λ)] / Σ SRF(bᵢ, λ)
Ten surface material classes were represented in the library: carnotite, hematite, goethite, malachite, jarosite, carbonate/bright sediment, red-bed sandstone, Mancos Shale, bituminous coal, and native selenium. These classes span the primary ore minerals, iron-oxide assemblages, host-rock lithologies, and carbonaceous materials relevant to the four deposit types assessed. The library was used for geological context and to support visual interpretation of spectral index spatial patterns; it was not applied as a classification algorithm.
2.3.1. Reference Mineral Occurrence Database
A georeferenced mineral occurrence database was compiled from the U.S. Geological Survey Mineral Resources Data System (USGS MRDS [1]) for Emery and Carbon Counties, Utah, supplemented by the Utah Geological Survey mineral occurrence records. Raw MRDS commodity attributes were reclassified into five deposit-type symbol classes relevant to the spectral index framework: (i) uranium-vanadium-copper sandstone-hosted deposits (red triangle class; n = 143), encompassing MRDS records attributed to U, V, and Cu where field evidence indicates co-hosted sandstone-type mineralization; (ii) uranium-vanadium roll-front occurrences (green circle class; n = 38); (iii) zinc-lead-vanadium polymetallic occurrences (purple diamond class; n = 28), incorporating MRDS records attributed to Pb, Zn, Mn, and industrial minerals where a structural gossan or polymetallic sulfide association is indicated; (iv) REE and phosphate occurrences (pink circle class; n = 22), incorporating coal-associated REE records from the Carbon County coalfield; and (v) titanium placer, heavy mineral, and coal occurrences (yellow circle class; n = 16). Copper occurrences without documented uranium or vanadium co-association, and standalone lead and manganese records attributed to structural rather than sandstone-hosted settings, were assigned to the polymetallic class on the basis of their structural position and commodity pairing documented in MRDS attribute fields. Prospect locations and drill targets without confirmed mineralization were catalogued separately and excluded from spatial correlation analysis to prevent bias from unverified occurrences. All 247 quality-checked occurrence locations were positionally verified against 1:24,000-scale topographic maps; locations with positional uncertainty exceeding ±500 m were flagged and excluded from the buffer overlay analysis.
2.3.2. Spectral Index Derivation
Thirteen band-ratio spectral indices were derived from Sentinel-2 L2A reflectance data to provide continuous quantitative measures of mineralization-related geochemical proxy intensity across the study area. Each index targets a specific element-mineral-deposit association (uranium bleaching, vanadium redox transition, iron oxide ratio, gossan, ferrous iron, clay hydroxyl, titanium proxies, REE carbonaceous shale, scandium mafic silicate; see Table 2). Index outputs were normalized to [0, 1] using a 2-98th percentile stretch applied uniformly across the study area.
2.4. Composite Priority Scoring
District-level composite priority scores (0-100) were derived from a weighted combination of four criteria: spectral index spatial correlation performance (weight: 40%); documented production history and geological characterization quality (25%); host-rock geological favorability for the relevant deposit model (20%); and commodity composition relative to the 2025 USGS federal critical minerals list (60 commodities; 15%; [2]. The spectral sub-score was the weighted mean of the five primary index spatial correlations. The spectral sub-score was computed as the weighted mean of the five primary index spatial correlations in Table 3, with relative weights proportional to those defined in Section 4.1 for each deposit type. Geological and host-rock sub-scores were assigned by expert assessment against the scoring rubric defined in Table 3 and published criteria for Colorado Plateau roll-front and paleoplacer deposit models [15,17]. Districts scoring ≥ 80 were classified as Tier 1 (first-pass prioritization); scores of 50-79 as Tier 2 (ground-truth required). The Carbon County REE target was scored against a modified rubric calibrated to the mine-of-opportunity extraction model. Sub-component scores and weighted contributions for all nine target areas are presented in Table 2.
2.4.1. Validation Statistics
Spatial correspondence between spectral index anomaly distributions and the reference deposit database was quantified using a buffer overlay spatial correlation method. For each of the 13 spectral indices, anomaly-class pixels were defined at the ≥ 75th percentile threshold of the normalized index value distribution across unmasked pixels. A 500 m radius buffer was applied to each of the N = 247 quality-checked deposit symbol locations. The spatial correlation coefficient (SC) was calculated as:
where A is the total area of all deposit-symbol buffer zones and B is the area of anomaly-class index pixels falling within any buffer zone; SC is expressed as a percentage. The 500 m buffer radius was selected to account for deposit symbol positional uncertainty (estimated ±200 m for MRDS-sourced coordinates), atmospheric correction residuals (~50-100 m equivalent ground distance), and the expected spatial offset between surface spectral anomalies and roll-front ore body margins, within which bleaching and clay anomalies are expected to occur upgradient of the ore horizon. Sensitivity analysis using 250 m and 1,000 m buffer radii was conducted; results were qualitatively consistent across all three radii, with the 500 m radius providing optimal discrimination between high- and low-performing indices.
SC = (A∩B / Aᴮ) × 100
No formal hypothesis test (P-value) is reported for spatial correlation coefficients, as the geological reference database does not constitute a random sample. Instead, index performance is characterized descriptively by SC value and rank. The composite priority score incorporates four weighted sub-scores; sub-score uncertainty arising from expert judgement in the geological and host-rock favorability criteria (Table 3) is estimated at ±5 score points, sufficient to alter district tier classification only at the tier boundary (scores 78-82). All spatial overlay operations were performed using ENVI Band Math and ArcGIS Pro (Esri; [26]). Index spatial correlation values, buffer overlap areas, and composite score sub-components are presented in Table 2 and provided in full in Supplementary Material S3 to enable independent verification.
3. Results
3.1. Spectral Index Analysis
Thirteen spectral indices were derived from Sentinel-2 Level-2A surface reflectance data covering the study area and evaluated for their capacity to map surface and near-surface geochemical signatures relevant to uranium (U), vanadium (V), zinc (Zn), iron (Fe), titanium (Ti), rare earth elements (REE), and scandium (Sc) mineralization (Table 1). Spatial correlation estimates were derived by overlay analysis of anomaly-class index pixels (≥75th percentile threshold) against the 247-location georeferenced reference deposit database within a 500 m tolerance radius (see Section 2.6).

Table 4.
Summary of the 13 spectral indices applied in this study, their geochemical basis, primary deposit-type associations, and estimated spatial correlation with known mineral occurrence locations (500 m tolerance radius). Heat-map shading in the correlation column: green ≥ 80% (high); amber 60-79% (moderate). All indices derived from Sentinel-2 MSI Level-2A surface reflectance.
| Index name | Target element | Geochemical mechanism | Deposit type association | Spatial correlation (%) |
|---|---|---|---|---|
| U compound bleaching | U | Hematite dissolution at roll-front oxidation boundary; Fe3+ → Fe2+ reduction + clay precipitation | Sandstone-hosted U-V (red triangle) | 85 |
| V redox boundary | V | V5+/V4+ transition at roll-front interface; roscoelite/montroseite SWIR absorption | U-V roll-front; Zn-Pb/V (red tri., purple dia.) | 80 |
| U clay hydroxyl | U | Al-OH and Mg-OH stretch in kaolinite, illite, montmorillonite (~2.2 µm) | Sandstone-hosted U-V (red triangle) | 78 |
| Zn/Fe gossan | Zn, Fe | Fe-hydroxide + Zn-carbonate gossanous material; supergene sulfide oxidation | Zn-Pb/V; U-V surface (red tri., purple dia.) | 74 |
| U normalized clay | U | Vegetation-corrected clay mineral mapping; isolates SWIR clay signal | Sandstone-hosted U-V (red triangle) | 72 |
| U Fe oxide ratio | U, Fe | Hematite/goethite ratio; lateral oxidation-state gradient across roll-front | U-V; Zn-Pb/V (red tri., purple dia.) | 70 |
| U gossan/Fe enrichment | U, Fe | Supergene iron capping above mineralized zones; jarosite-goethite surface | U-V; polymetallic (red tri., purple dia.) | 68 |
| U ferrous iron | U, Fe | Fe2+ absorptions at ~1.0 µm; reducing zone indicator down-dip of ore horizon | U-V roll-front reducing side (red tri., green circ.) | 65 |
| REE carbonaceous shale | REE | Low VNIR-SWIR reflectance; organic-rich sediment REE adsorption and concentration | REE/phosphate; coal/oil shale (pink circ.) | 62 |
| Ti silicate host-rock | Ti | Immobile Ti maps permeable silicate host lithology; Ti in silicate lattice | Ti placer; U-V host rock (yellow circ.) | 60 |
| Ti ilmenite/titanite | Ti | Combined Fe-Ti spectral signature of ilmenite (FeTiO3) and titanite | Ti/heavy mineral placers (yellow circ.) | 58 |
| U INDVI | U | Vegetation stress response over uraniferous soils; geobotanical indicator | Sandstone-hosted U-V (indirect) | 55 |
| Sc mafic silicate | Sc | Pyroxene/amphibole NIR-SWIR absorptions; Sc-bearing mafic silicate mapping | Mafic provenance; Ti placer context (yellow circ.) | 50 |
3.1.1. Uranium-Sensitive Indices
Seven of the thirteen indices were designed to detect geochemical proxies for uranium mineralization, of which six are designated primary indices contributing to the composite targeting score; the U-INDVI geobotanical index is retained as a supplementary indicator only, carrying zero composite weight due to insufficient vegetation cover across the study area (Figure 6). The U compound bleaching index returned the strongest spatial correspondence with known U-V deposit locations (85% Table 2; Figure 2). This index specifically targets the spectral signature of hematite dissolution and clay enrichment at the oxidation-reduction interface characteristic of sandstone-hosted roll-front uranium systems. Anomalously bright pixel clusters observed in the central basin corridor follow a northwest-southeast structural trend consistent with the interpreted anticlinal limbs of the study area, overlapping directly with the highest-density cluster of deposit symbols (Figure 1).
The U clay hydroxyl and U normalized clay indices both delineated hydroxyl-bearing clay mineral assemblages (principally kaolinite, illite, and montmorillonite) associated with diagenetic and hydrothermal alteration of the uraniferous host sandstones (Figure 2). The normalized clay variant incorporates a vegetation correction term, producing modestly improved anomaly contrast (72% vs. 78% spatial correlation). Both indices show elevated response across the central basin plateau coinciding with the principal ore-hosting sedimentary units.
The U Fe oxide ratio index discriminates between hematite (Fe3+)-dominant oxidized facies and goethite-dominant weathered zones, providing a proxy for the lateral oxidation-state gradient across the roll-front (Figure 2). Bright anomalies at basin margins correspond to oxidized red-bed lithologies, while the dark basin interior reflects reducing organic-rich sediments. The U ferrous iron index complements this by mapping the Fe2+-bearing reducing side of the redox boundary where uranium precipitation from soluble uranyl complexes (UO22+) is geochemically favored (Figure 3). This index exhibits a conspicuously dark response over the basin interior, consistent with organic-rich reducing lithologies such as oil shale and carbonaceous mudstone.
The U gossan / Fe enrichment index maps supergene iron capping above mineralized zones during prolonged oxidative weathering (Figure 4). Although this index produced moderate spatial correlation (68%), it is affected by false-positive responses in iron-rich Mesozoic red-bed sequences not spatially associated with economic mineralization. The U INDVI (geobotanical index) yielded the weakest performance among the uranium-targeted indices (55%) owing to the sparse, arid vegetation cover across much of the study basin, which limits the geobotanical stress signal (Figure 7).
3.1.2. Vanadium Redox Index
The V redox boundary index achieved the second-highest spatial correlation overall (80%; Figure 3). This index maps the V5+/V4+ geochemical transition at the earth's surface, which co-occurs with the uranium roll-front because vanadium and uranium co-precipitate under equivalent redox conditions. The index image exhibits a strong dark (high absorption) response over the basin interior; the structural outline of the reducing basin core is well delineated. Used in combination with the bleaching index, the two indices precisely bracket the ore-hosting roll-front interface from both the oxidized and reducing sides.
3.1.3. Iron and Gossan Indices
The Zn/Fe gossan index (Figure 4) produced the fourth-highest spatial correlation (74%) and was the strongest performer for the purple-diamond Zn-Pb/V deposit symbol class (Figure 3). The most intense anomalies are concentrated along interpreted anticlinal crests, consistent with structurally controlled Zn-Pb-V mineralization. Notable gossan anomalies without spatially associated bleaching signatures were identified, suggesting localized polymetallic targets distinct from the roll-front uranium system.
3.1.4. Titanium Proxy Indices
The Ti silicate host-rock proxy and Ti ilmenite/titanite proxy indices both exhibit broad, relatively uniform responses across the basin, consistent with the laterally extensive fluvial-deltaic sandstone sequences forming the primary U-V host lithology (Figure 5). Yellow-circle deposit symbols (Ti placers and heavy-mineral occurrences) display elevated correspondence with Ti index anomalies along basin margins and at the western study area boundary, where igneous and metamorphic source terrains of the Wasatch Range equivalent supply detrital ilmenite and titanite. This index combination produces the highest Ti-specific correlation at the Coal Cliffs district (82%; Section 3.3.4).
3.1.5. REE Carbonaceous Shale Index
The REE carbonaceous shale index maps dark, organic-rich sedimentary units that preferentially concentrate light rare earth elements during diagenesis (Figure 2). Index anomalies delineate carbonaceous shale and coal horizons along structural lows and basin margins. Pink-circle REE/phosphate deposit symbols show partial spatial correspondence, with stronger overlaps where carbonaceous units are exposed along outcrop belts in the northern part of the study area. This index also serves as an organic reductant indicator for uranium exploration, as carbonaceous material is a principal driver of U precipitation at roll-front interfaces.
3.1.6. Scandium Mafic Silicate Index
The Sc mafic silicate index produced the lowest spatial correlation (50%), reflecting the dominantly siliciclastic sedimentary nature of the basin, which inherently limits the occurrence of Sc-bearing mafic phases such as pyroxene and amphibole (Figure 5). Elevated Sc signal is restricted to intrusive margins on the basin periphery. The index is most informative as a provenance constraint and lithological discriminator rather than a direct mineralization indicator in this geological setting.
3.2. Spatial Correlation Summary
The ranked spatial correlation results for all 13 indices are summarized in Figure 6. The U compound bleaching index (85%) and V redox boundary index (80%) substantially outperform all other indices in spatial correspondence with the full deposit database. Together, they account for 50% of the composite score weighting in the targeting framework (Section 4.1). The six primary uranium-targeting indices (excluding U-INDVI, which carries zero composite weight; Section 4.1) collectively achieve a mean spatial correlation of 73%, compared with a mean of 57% for the four contextual indices (Ti proxies, REE, Sc).
3.3. Spatial Correspondence with Known Mineral Occurrences
3.3.1. U-V-Cu Deposits (Red Triangle Symbols)
Red-triangle deposit symbols, representing 58% (n = 143) of the reference database, are predominantly concentrated along the northwest-southeast-trending western anticlinal limb of the study basin and in the central basin corridor (Figure 1). Spatial overlay analysis demonstrates that this symbol class exhibits the strongest concordance with the U compound bleaching, V redox boundary, and U clay hydroxyl indices. The dense red-triangle cluster in the central basin corridor occupies the zone of maximum composite anomaly intensity for the seven-index uranium stack, consistent with classic sandstone-hosted roll-front U-V mineralization in fluvial channel sandstones of Late Triassic and Jurassic age.
3.3.2. Roll-Front U Deposits (Green Circle Symbols)
Green-circle deposit symbols (n = 38) display a distribution broadly similar to red-triangle occurrences but with greater concentration along structural flexures and monoclines where stratigraphic dip changes favor roll-front emplacement. These symbols correlate most strongly with the V redox boundary and U ferrous iron indices, suggesting they preferentially represent reducing-side ore facies of the roll-front system, potentially including higher-grade tabular ore bodies immediately ahead of the bleaching front.
3.3.3. Zn-Pb/V Deposits (Purple Diamond Symbols)
Purple-diamond deposit symbols (n = 28) are distributed preferentially along anticlinal crests and structural highs. These occurrences correlate most strongly with the Zn/Fe gossan and V redox boundary indices, and secondarily with the U Fe oxide ratio index. The structural setting and gossan-dominant index signature distinguish this deposit class from roll-front-controlled U-V occurrences, consistent with structurally controlled polymetallic sulfide mineralization with vanadium enrichment.
3.3.4. REE/Phosphate Deposits (Pink Circle Symbols)
Pink-circle deposit symbols (n = 22) show the most spatially diffuse distribution of all deposit classes. Correlation is highest with the REE carbonaceous shale index and U clay hydroxyl index. These occurrences cluster along basin margins where organically mature sedimentary sequences are exposed, consistent with stratigraphically controlled REE enrichment in black shale horizons or phosphorite beds.
3.3.5. Ti Placer and Heavy-Mineral Occurrences (Yellow Circle Symbols)
Yellow-circle symbols (n = 16) are spatially associated with the Ti silicate and Ti ilmenite/titanite proxy indices and are preferentially distributed at the outer basin margin and beyond the study boundary to the west, in proximity to interpreted paleo-channel axes fed from igneous and metamorphic source terrains. The absence of concurrent bleaching, V redox, or clay hydroxyl anomalies at yellow-circle locations confirms their classification as placer-type rather than chemogenic deposits, with no genetic relationship to the roll-front U-V system.
Figure 2.
Study area satellite base map showing distribution of mineral occurrence symbols from the reference deposit database. Red triangles = U-V-Cu sandstone-hosted deposits; green circles = U-V roll-front occurrences; pink circles = REE/phosphate; purple diamonds = Zn-Pb/vanadium; yellow circles = Ti placer/heavy mineral/coal; orange crosses = prospect/drill target locations. White lines denote county boundaries.

Figure 3.
The four primary spectral indices used for U-V roll-front targeting, ordered by spatial correlation with known deposit locations. (a) U compound bleaching index - the direct spectral expression of hematite dissolution at the oxidation-reduction interface immediately up-dip of the ore zone (85% correlation). (b) V redox boundary - V5+/V4+ geochemical transition co-located with the uranium roll-front; used in combination with (a) to bracket the ore-hosting interface from both sides (80% correlation). (c) U clay hydroxyl - hydroxyl-bearing clay minerals (kaolinite, illite, montmorillonite) confirming diagenetic and hydrothermal alteration of the host sandstone (78% correlation). (d) U Fe oxide ratio - hematite/goethite discrimination providing a proxy for the lateral oxidation-state gradient across the roll-front; bright = oxidized red-bed margins, dark = reducing basin interior (70% correlation). Bright pixels = high index values; dark pixels = low index values.

Figure 4.
Iron-sensitive and gossan support indices. (a) Zn/Fe gossan index - targets zinc-enriched, iron-stained gossanous material formed by supergene oxidation of polymetallic sulfide assemblages; most intense anomalies concentrated along anticlinal crests (74% corr.). (b) U ferrous iron - Fe2+ distribution marking the reducing zone down-dip of the ore horizon; conspicuously dark basin interior reflects organic-rich reducing sediments consistent with oil shale and carbonaceous mudstone (65% correlation). (c) U gossan/Fe enrichment - supergene iron capping developed above mineralized zones during prolonged oxidative weathering; some false-positive response in Mesozoic red beds (68% correlation). (d) U normalized clay - vegetation-corrected clay index providing improved anomaly contrast in sparse-cover terrain; mirrors the clay hydroxyl index with reduced photosynthesis masking (72% correlation). Note the spatial complementarity between the bright oxidized margins in panels (c) and (d) and the dark reducing basin interior in panel (b), consistent with the regional roll-front redox architecture.

Figure 5.
Contextual spectral indices used for lithological screening and secondary target identification. (a) Ti silicate host-rock proxy - immobile titanium provides a reliable proxy for original silicate host-rock composition; confirms permeable coarse-clastic input facies favorable for roll-front development (60% correlation). (b) Ti ilmenite/titanite proxy - combined Fe-Ti spectral signature of heavy minerals concentrated in placer deposits; elevated response on the western basin margin is consistent with igneous and metamorphic source rocks (58% correlation). (c) REE carbonaceous shale/coal - low reflectance of organic-rich sediments serves as both a REE enrichment proxy and an organic reductant indicator for uranium exploration (62% correlation). (d) Sc mafic silicate index - Sc-bearing mafic silicate distribution; limited response in this dominantly siliciclastic basin reflects the absence of mafic igneous rocks within the basin interior (50% correlation, lowest of all 13 indices). The elevated Ti response in panels (a) and (b) at the western study area boundary corresponds to the mafic source terrain visible in panel (d).

Figure 6.
Spatial correlation (%) of all 13 spectral indices with known mineral occurrence locations, estimated by overlay analysis within a 500 m tolerance radius. Indices are ranked from highest to lowest correlation and color-coded by target element (legend). Tier classification (left column) reflects the diagnostic importance of each index for U-V sandstone-hosted roll-front targeting. The U compound bleaching index (85%) and V redox boundary (80%) are the highest-performing indices and form the core of the primary targeting workflow. All contextual indices (Ti, REE, Sc) return correlations of 50-62%, reflecting their role as lithological and provenance screens rather than direct pathfinders. The U-INDVI (55%) is the weakest uranium-specific index, consistent with the sparse, arid vegetation cover of the study basin.

Figure 7.
U-INDVI geobotanical stress index. The uniformly dark response across the study basin reflects sparse, arid vegetation cover that limits geobotanical utility; this index is applied only as a low-weight tiebreaker (composite weight: 0%) and does not contribute to primary target ranking. (bottom) Five-stage multi-index composite targeting workflow for sandstone-hosted U-V roll-front deposits. Stages proceed from coarse lithological screening (Stage 1) through sequential anomaly narrowing (Stages 2-4) to composite score generation and field verification (Stage 5). Tier 1 targets (composite score 80-100) are recommended for direct field verification via portable XRF traverses and radon soil-gas surveys prior to drilling.

4. Discussion
4.1. Multi-Index Composite Targeting Framework for Sandstone-Hosted U-V Mineralization
The results demonstrate that no single spectral index provides sufficient discrimination to reliably delineate sandstone-hosted U-V roll-front targets in isolation. The highest-confidence target areas are defined by the convergence of multiple complementary indices that collectively characterize both sides of the redox boundary and confirm the presence of suitable host lithology and organic reductant. A weighted composite targeting framework is proposed, structured as a sequential five-stage screening workflow (Figure 6).
In the first stage, the Ti silicate host-rock proxy and Sc mafic silicate index are used to map the distribution of permeable coarse-clastic silicate host rocks and eliminate mudstone-dominated or carbonate-rich areas as unfavorable for roll-front emplacement. This lithological pre-screening substantially reduces the area requiring detailed index analysis in subsequent stages.
The second stage applies the V redox boundary and U Fe oxide ratio indices in combination to delineate the spatial position of the oxidation-reduction boundary at basin scale. The Fe oxide ratio maps the oxidized hematite-bearing facies up-dip, while the V redox index maps the reduced vanadium-bearing facies down-dip. The interface between these two signals defines the roll-front corridor within which U-V ore bodies are expected to occur.
The third stage applies the U compound bleaching and U clay hydroxyl indices within the redox corridor identified in stage two. The bleaching index is the most diagnostic single indicator (85% spatial correlation) and represents the direct spectral expression of the oxidation front immediately up-dip of the ore zone. Concurrent clay hydroxyl anomalies confirm alteration of the host rock and provide independent confidence that conditions favorable for uranium precipitation were established.
The fourth stage incorporates the U ferrous iron, REE carbonaceous shale, and Zn/Fe gossan indices to characterize the reducing zone down-dip of the bleaching front and assess organic reductant availability. The REE carbonaceous shale index provides a regional-scale proxy for organic reductant distribution, while the ferrous iron index confirms that reducing conditions are maintained or recently established.
The fifth stage generates a composite score raster from the weighted sum of all contributing indices (Table 3). The proposed weighting scheme allocates 30% to the bleaching index, 20% to the V redox boundary, 15% to the clay hydroxyl index, 12% to the Fe oxide ratio, and 10% to the ferrous iron index, with the remaining 13% distributed among the gossan, normalized clay, and REE indices. The U-INDVI geobotanical index carries zero composite weight and is excluded from target scoring, consistent with the sparse arid vegetation cover of the study basin. These weights reflect the relative diagnostic power of each index demonstrated by the spatial correlation analysis and may be adjusted for local geological context or data quality.
Table 5.
Composite score-based target prioritization tiers for sandstone-hosted U-V exploration. Scores are derived from the weighted multi-index framework described in Section 4.1. All four geological validation criteria (structural position, host rock, redox geometry, organic reductant) must be satisfied for Tier 1 classification.
| Tier | Score | Index signature required | Recommended action |
|---|---|---|---|
| Tier 1 | 80-100 | Bleaching +V redox both anomalous; clay hydroxyl elevated; Fe oxide ratio showing oxidation-front gradient; ferrous Fe on down-dip side | First-pass prioritization. Confirm with soil-gas radon survey and IP geophysics before collaring. Target spacing: 50-100 m along roll-front strike. |
| Tier 2 | 50-79 | Bleaching OR V redox anomalous (not both); clay hydroxyl moderate; one Fe index anomalous | Ground-truth with portable XRF traverse and auger sampling. Upgrade to Tier 1 if V>300 ppm confirmed. |
| Tier 3 | 40-59 | Single index anomalous; structural position favorable but geochemical signal weak | Reconnaissance geological mapping and rock-chip sampling. Monitor for structural trap improvements. |
| Context | < 40 | No diagnostic signature; background or obscured terrain; Ti/Sc host-rock proxies only | Maintain as background reference. Re-assess if structural data changes favorability. |
4.2. Redox Architecture and Roll-Front Geometry
The spatial distribution of spectral anomalies across the study basin is consistent with a regionally developed roll-front system controlled by basin-scale redox architecture. The central basin interior, characterized by dark Fe oxide ratio values, strong ferrous iron response, and elevated REE carbonaceous shale signal, represents a persistent reducing geochemical domain maintained by abundant organic matter in the host sedimentary sequence. The surrounding basin margins, characterized by bright bleaching and elevated clay hydroxyl values, represent the oxidized domain where meteoric oxygenated groundwater has advanced from paleotopographic highs.
The roll-front interface follows the northwest-southeast structural trend of the principal anticlinal limbs, consistent with groundwater flow controlled by structural dip and lithological permeability. This geometry places the highest-density U-V deposit cluster precisely at the intersection of maximum bleaching intensity and the V redox transition zone, validating the conceptual model and confirming the utility of the proposed index stack as a proxy for roll-front position.
The vanadium redox index is particularly informative in this context because vanadium geochemistry closely parallels that of uranium: both V5+ (vanadate) and U6+ (uranyl) are soluble in oxidizing groundwater [13], and both V4+ (roscoelite, montroseite) and U4+ (uraninite, coffinite) precipitate under reducing conditions at the same roll-front horizon. The 80% spatial correlation of the V redox index with both red-triangle and green-circle deposit classes therefore reflects not only vanadium surface expression but also the geochemically equivalent uranium mineralization at the same horizon, making the V redox index the single most valuable complementary index to the bleaching index in this setting.
4.3. Mining District Critical Mineral Analysis
The eight mining districts identified within the study area (Figure 8) were evaluated for critical mineral potential using a multi-criteria scoring framework integrating: (i) estimated spectral index spatial correlation with district boundaries (Table 4; Figure 6); (ii) documented production history and geological characterizations; (iii) host-rock favorability for the relevant deposit model; and (iv) commodity composition relative to the 2025 USGS federal critical minerals list (60 commodities) Scoring anchor definitions for criteria (ii)-(iv) are provided in Table 3. Districts were assigned a composite priority score out of 100 and classified into Tier 1 (≥ 80), Tier 2 (50-79), or Special categories (Table 4; Figure 9).
Table 6.
Summary of critical mineral potential, spectral index spatial correlation, and priority classification for all eight mining districts and the Carbon County coal field REE target. Priority scores are composite indices derived from spectral index correlation, production history, host-rock favorability, and commodity criticality. *Carbon County score is based on REE-in-coal-adjacent-strata assessment only; see Section 4.4.
| District | Primary minerals | Host formation | Priority score | Status | Tier |
|---|---|---|---|---|---|
| Temple Mountain |
U, V, Cu, Se | Chinle Fm. Moss Back member | 92/100 | Past producer - re-entry feasible |
Tier 1 |
| San Rafael Swell | U, V, Cu | Morrison Salt Wash + ChinleMoss Back Member | 87/100 | Partially explored - significant un-drilled areas | Tier 1 |
| San Rafael River | U, V | Entrada/Curtis/Summerville Fms. (Jurassic) | 80/100 | Historical producer - underexplored at depth | Tier 1 |
| Coal Cliffs | Ti, Zr, Th, REE | Ferron Ss. Mbr. Mancos Shale (Cretaceous) | 70/100 | Undrilled occurrence - highest unevaluated upside | Tier 2 |
| Cedar Mountain |
U, V | Morrison Fm. Salt Wash Mbr. | 65/100 | Prospect - limited systematic exploration |
Tier 2 |
| Greasewood Draw | U | Fluvial sandstone, mixed controls | 58/100 | Prospect - stratigraphic controls | Tier 2 |
| Calf Mesa | U | Morrison Fm. (Jurassic sandstone) | 60/100 | Prospect - uranium-only target | Tier 2 |
| West San Rafael | U | Chinle Fm. west-flank occurrences | 55/100 | Early-stage prospect | Tier 2 |
| Carbon Co. Coal Fields | REE (La, Ce, Nd, Pr, Y) | Carbonaceous shale/siltstone (coal margins) | 75*/100 | Research-stage - DOE CORE-CM Phase 1 complete | Special |
4.3.1. Temple Mountain District (U-V; Tier 1; Priority Score: 92/100)
The Temple Mountain mining district, on the southeast flank of the San Rafael Swell, is the highest-priority critical mineral target in the study area. Claims were staked in 1898, and uranium-vanadium-radium mining began in 1918, with principal production during the uranium boom of the 1950s. The district is hosted in the Upper Triassic Moss Back Member of the Chinle Formation, a fining-upward fluvial-lacustrine sandstone on the steeply dipping east limb of the anticline. Total district metal production is estimated at approximately $93 million at 2020 metal prices; based on production data in Hawley et al., 1965 [27].
The spectral index stack returns the strongest multi-index convergence of any district: the U compound bleaching index achieves 88% spatial correlation with the district boundary, and the V redox boundary index 85% (Table 4; Figure 10). This paired high-score response is diagnostic of the physical roll-front geometry and confirms that the ore-forming geochemical system is detectable at surface. Vanadium (V) is designated a federal critical mineral and its co-occurrence with uranium is the primary driver of the high priority score; historical V: U mass ratios in Colorado Plateau deposits typically range from 1:1 to 10:1 [13,28]. Copper and selenium documented at trace levels may provide additional co-product value. The primary development constraint is land status; portions of the district require Bureau of Land Management review prior to permitting.
4.3.2. San Rafael Swell District (U-V; Tier 1; Priority Score: 87/100)
The San Rafael Swell mining district encompasses the central and northern portions of the study area anticline and constitutes the most geologically extensive critical mineral target in the portfolio. Unlike Temple Mountain, which is concentrated in the steeply dipping east limb of the Swell, the San Rafael Swell district spans dual host stratigraphy: the Morrison Formation Salt Wash Member (Jurassic fluvial sandstones) in the northern and central portions, and the Upper Triassic Chinle Formation Moss Back Member along the southern and eastern margins [10,27]. This stratigraphic duality provides a larger combined prospective volume than any single-formation district and is the primary geological basis for the high priority score.
Historical uranium and vanadium production from the district during the Atomic Energy Commission boom period of 1948-1965 was confined to near-surface ore shoots in accessible canyon walls and shallow workings. Large portions of the district, particularly the Morrison Salt Wash horizons at depth on the western anticlinal limb, have never been systematically drilled with modern directional or reverse-circulation methods. The district status as partially explored with significant un-drilled areas reflects this structural incompleteness rather than a negative geological assessment.
The spectral index stack returns the second-strongest multi-index convergence of any district. The U compound bleaching index achieves 85% spatial correlation with the district boundary, and the V redox boundary index 80% (Table 7; Figure 10). Critically, San Rafael Swell is one of only two districts in the study area, alongside Temple Mountain, to achieve high scores (≥80%) on both the bleaching and V redox indices simultaneously, the physical requirement for a confirmed roll-front geometry detectable at surface [13]. The Fe gossan index returns 68%, confirming supergene iron capping consistent with prolonged oxidative weathering of sulfide-bearing ore facies. The Ti proxy (50%) and REE carbonaceous shale (58%) responses are consistent with the siliciclastic Morrison host lithology and reflect background rather than anomalous signatures, confirming the roll-front U-V classification without contamination from paleoplacer or carbonaceous shale geochemical noise.
Uranium, vanadium, and copper are all designated federal critical minerals under the 2025 USGS list [29]. Uranium was reinstated to the list following its exclusion from the 2022 revision; copper was added for the first time in 2025. The dual Morrison-Chinle host stratigraphy and the co-occurrence of three designated critical minerals (U, V, Cu) represent the highest multi-commodity criticality score among U-V districts in the study portfolio. The primary development pathway involves systematic drill-hole coverage of the Morrison Salt Wash horizon at depths of 50-200 m across the un-drilled western limb, guided by the bleaching and V redox anomaly maps generated in this study to prioritize roll-front intercept locations. Land status is partially open BLM, with no wilderness or national monument conflicts identified within the highest-priority spectral anomaly zones.
4.3.3. San Rafael River District (U-V; Tier 1; Priority Score: 80/100)
The San Rafael River mining area, approximately 24 km west of Green River, hosts documented U-V production from the Entrada, Curtis, and Summerville formations (Jurassic), which are gently folded into northeastward-trending anticlines and synclines. The district returns Tier 1 classification (80/100) based on the compound bleaching index (76%) and V redox index (74%) overlap with the district boundary. The composite score of 80/100 reflects the district's dual U-V commodity composition, both designated federal critical minerals, combined with documented historical production, favorable Jurassic host stratigraphy, and Tier 1-grade spectral responses on both primary indices (bleaching 76%, V redox 74%), placing the district at the Tier 1 threshold on the basis of commodity criticality weighting. The Jurassic host stratigraphy is geochemically distinct from the Triassic Chinle and Jurassic Morrison hosts in other districts, representing an important geological diversification within the study area portfolio. The district is underexplored at depth; historical production was confined to surface and near-surface ore bodies, and the roll-front geometry at depth has not been systematically characterized by modern methods. A historic indicated resource of approximately 2.4 Mlb U3O8 has been estimated for the Deep Gold deposit by Homeland Uranium Inc. [28], though this figure predates current NI 43-101 compliance standards and should be treated as a preliminary estimate pending independent verification.
4.3.4. Coal Cliffs District (Ti-Zr; Tier 2; Priority Score: 70/100)
The Coal Cliffs district represents a geologically distinct critical mineral opportunity entirely separate from the roll-front U-V system. The district hosts seven small flat-lying beach paleoplacer deposits carrying ilmenite, rutile, zircon, and trace thorium in the basal Ferron Sandstone Member of the Upper Cretaceous Mancos Shale, two parallel northwest-trending belts with no recorded production and no systematic drilling.
Titanium and zirconium are designated federal critical minerals under the 2025 USGS list. The spectral index response is diagnostically inverted relative to all other districts: the Ti silicate host-rock proxy and Ti ilmenite/titanite proxy return 82% and 78% spatial correlation respectively, while the uranium-targeting bleaching and V redox indices return only 20% and 15% (Table 4; Figure 10). This spectral inversion confirms the absence of roll-front uranium chemistry and the presence of titanium-bearing heavy minerals, the pattern is unique in the study area and constitutes a deposit-type discriminant unavailable from single-index analysis.
A critical uncharacterized dimension is the likely presence of monazite in the heavy mineral assemblage, which would introduce light REE (La, Ce, Nd, Pr) and thorium co-products. The REE carbonaceous shale index returns 38% spatial correlation with the district boundary, above background and possibly reflecting REE enrichment in the Mancos Shale host rather than organic-carbon association. Characterization of monazite content and REE grade is the highest-value single data acquisition for this district. The district was assigned Tier 2 classification primarily due to the absence of grade data rather than a negative geological assessment.
4.3.5. Tier 2 Uranium Districts: Cedar Mountain, Greasewood Draw, Calf Mesa, and West San Rafael
Four additional uranium-bearing districts were assigned Tier 2 classification (55-65/100), consistent with the Tier 2 scoring range of 50-79 defined in Section 2.5. Based on limited available data, single-commodity (uranium-only) composition, or less favorable structural positions relative to the primary roll-front system (Table 4; Figure 8).
Cedar Mountain (U-V; 65/100) returns bleaching (70%) and V redox (68%) correlations consistent with Morrison-hosted roll-front mineralization. The vanadium co-product signature (V redox 68%) is a positive differentiator relative to the other Tier 2 districts. Systematic rock-chip sampling and geochemical traverses are recommended as first-phase groundwork.
Greasewood Draw (U; 58/100), east of the main Swell near the Green River corridor, represents a stratigraphically and structurally controlled uranium occurrence. The bleaching index (68%) indicates a viable roll-front redox geometry, but the absence of a vanadium co-product signal (V redox 58%) reduces project economics relative to U-V districts. Proximity to the Highway 6/Interstate 70 corridor is an infrastructure advantage.
Calf Mesa (U; 60/100) returns the strongest bleaching response of the Tier 2 uranium-only districts (72%) but the weakest V redox response (50%), suggesting a uranium-dominant roll-front without significant vanadium co-precipitation. This decoupled signature is consistent with reducing conditions of insufficient intensity to fix vanadium from groundwater, or with host-rock chemistry that does not favor vanadium adsorption. The district requires higher uranium grades to compensate for absent vanadium revenue.
West San Rafael (U; 55/100), on the west flank of the Swell, is the lowest-priority district. West-flank structural positions are generally less prospective for roll-front development because the dominant groundwater flow direction creates more favorable redox conditions on the east flank. The bleaching index (65%) indicates active oxidizing groundwater, but the weak V redox response (55%) and very limited historical data constrain confidence.
4.3.6. Comparative Spectral Index Analysis Across Districts
Table 2 presents the complete sub-component scores contributing to each district composite priority score; Table 4 and Figure 10 present the underlying spectral index spatial correlations. Temple Mountain and San Rafael Swell are the only two districts to achieve high scores (≥ 80%) on both the bleaching and V redox indices simultaneously, the physical requirement for a Tier 1 roll-front target that displays convergent oxidized and reducing geochemical signatures on either side of the ore horizon. All four Tier 2 uranium-only districts show decoupled bleaching and V redox responses, consistent with uranium-dominant rather than uranium-vanadium roll-front mineralization.
The Coal Cliffs district displays the inverse pattern, very low bleaching (20%) and V redox (15%) scores and the highest Ti proxy score of any district (82%). This spectral inversion is uniquely diagnostic: it confirms the absence of roll-front uranium chemistry and the presence of titanium-bearing heavy minerals, consistent with the documented paleoplacer geology. No other district in the study area produces this pattern, making it a reliable remote-sensing discriminant for the Coal Cliffs deposit type.
Table 8.
Estimated spectral index spatial correlation (%) for each mining district across the five primary indices and the resulting composite priority score. Heat-map shading: green ≥ 80% (high); amber 60-79% (moderate); red < 40% (low). Values derived from overlay analysis within a 500 m tolerance radius of district boundaries. Ti proxy values for Coal Cliffs reflect the Ti ilmenite/titanite index.
| District | U bleaching | V redox | Fe gossan | Ti proxy | REE carbonaceous shale | Priority |
|---|---|---|---|---|---|---|
| Temple Mountain | 88% | 85% | 72% | 40% | 55% | 92 |
| San Rafael Swell | 85% | 80% | 68% | 50% | 58% | 87 |
| San Rafael River | 76% | 74% | 60% | 45% | 52% | 80 |
| Coal Cliffs (Ti-Zr) | 20% | 15% | 40% | 82% | 38% | 70 |
| Cedar Mountain | 70% | 68% | 55% | 42% | 48% | 65 |
| Greasewood Draw | 68% | 58% | 52% | 44% | 46% | 58 |
| Calf Mesa | 72% | 50% | 48% | 40% | 45% | 60 |
| West San Rafael | 65% | 55% | 50% | 42% | 44% | 55 |
4.3.7. Integrated Priority Matrix and Portfolio Implications
The portfolio priority matrix (Figure 11) plots all nine target areas by exploration priority score (Y-axis), critical mineral diversity, the number of distinct critical minerals identified or inferred (X-axis), and estimated resource potential (bubble area). The district portfolio spans two distinct strategic trajectories.
The first trajectory encompasses the three Tier 1 U-V districts (Temple Mountain, San Rafael Swell, San Rafael River), which occupy the upper-left sector of the matrix: high priority scores (80-92/100) with moderate commodity diversity (2-4 minerals). These districts offer the most near-term development potential. Vanadium co-production is the critical mineral of most immediate commercial relevance, given U.S. vanadium import dependency (approximately 98% import reliant) and growing demand from vanadium redox flow battery installations in grid-scale energy storage.
The second trajectory includes Coal Cliffs and the Carbon County coal fields: lower current priority scores (70-75/100) but substantially higher critical mineral diversity (4-6 minerals). Given the geopolitical supply chain context, China's export controls on Ti-related and REE commodities, the strategic value of these lower-scored but higher-diversity targets may be underrepresented by the current priority metric, which is calibrated primarily to roll-front U-V exploration readiness. 2
4.4. Carbon County Coal Fields: Rare Earth Element Critical Mineral Potential
The coal fields of Carbon County form the southern extension of the Uinta coal belt, historically mined for steam and metallurgical coal from Cretaceous fluvial and deltaic sequences. The Skyline Mine complex and associated operations produce approximately 5 million tons per year from federal and county leases with approximately 270 million tons of total identified reserves. While coal production itself is not the subject of this study, the critical mineral potential of coal-adjacent lithologies, specifically REE enrichment in carbonaceous shale and siltstone units, is detectable using the REE carbonaceous shale spectral index.
4.4.1. Rare Earth Element Enrichment in Coal-Adjacent Strata
A systematic Phase 1 investigation of REE concentrations in the Uinta coal belt was published by Coe et al. [6] as part of the U.S. Department of Energy Carbon Ore, Rare Earth and Critical Minerals (CORE-CM) program. Analyzing more than 3,500 samples from 10 active mines, 4 historical mines, 4 mine waste piles, and 7 stratigraphic cores using pXRF and ICP-MS methods, the study established that coal seams themselves are not REE-enriched, but that carbonaceous shale and siltstone units directly flanking coal seams show consistent REE enrichment exceeding 200 mg/kg on a whole-rock basis (Table 5; Figure 11). The U.S. Department of Energy has established 300 mg/kg as the minimum whole-rock REE concentration for economic viability [2]. Some individual samples of carbonaceous shale and volcanic tuff intercalations exceeded this threshold.
Table 9.
Summary of rare earth element (REE) concentrations by lithology class in the Uinta coal belt, including Carbon County coal field operations. Mean and maximum values from Coe et al. [6] who analyzed 3,500+ samples using pXRF and ICP-MS. DOE economic viability threshold = 300 mg/kg whole-rock following [30]. Potential classification: High = mean > 200 mg/kg; Moderate-high = 150-200 mg/kg; Low = < 150 mg/kg.
| Lithology | Mean REE (mg/kg) | Max REE (mg/kg) | DOE threshold | Critical mineral potential |
|---|---|---|---|---|
| Carbonaceous shale (coal margins) | 245 | 420 | 300 mg/kg | High: primary REE host; margins 0.9-1.5 m thick above and below coal seams |
| Carbonaceous siltstone | 215 | 380 | 300 mg/kg | Moderate-high: consistent enrichment near coal contacts; some samples above DOE threshold |
| Igneous dikes/volcanic tuffs | 180 | 310 | 300 mg/kg | Variable: some samples exceed DOE threshold; requires systematic follow-up |
| Coal seams (bulk) | 85 | 160 | 300 mg/kg | Low: coal itself is not REE enriched [6] |
| Sandstone (inter-seam) |
60 | 130 | 300 mg/kg | Negligible: sandy units REE-depleted; not a primary REE target lithology |
4.4.2. Spectral Index Correspondence with REE Host Lithologies
The dominant REE species detected (Pr, Nd, Y, La, Ce) are consistent with a light REE-dominant assemblage expected in organic-carbon-adsorbed REE in fluvial-deltaic settings. REE enrichment is concentrated in: (i) thin (0.9-1.5 m) carbonaceous shale and siltstone margins directly above and below coal seams; and (ii) igneous dike and volcanic tuff intercalations where locally elevated REE concentrations may reflect magmatic REE contributions.
The REE carbonaceous shale spectral index maps dark, organic-rich sedimentary units at surface. Index anomalies in the northern study area, at the southern margin of the Uinta coal belt and the Carbon County boundary, are spatially consistent with the outcrop distribution of carbonaceous Cretaceous shales and with subsurface REE enrichment [6]. While the spectral index cannot directly measure REE concentration, it correctly identifies the surface expression of the lithological package hosting REE enrichment at depth, confirming its utility as a reconnaissance-scale REE targeting tool.
4.4.3. Strategic Significance and Development Pathway
The Carbon County coal fields present a distinctive development model: REE extraction could be pursued as a secondary revenue sX9tream from shale and siltstone horizons already being intersected and displaced during ongoing coal extraction operations. This mine-of-opportunity model significantly reduces incremental capital costs relative to a standalone greenfield REE project.
Three technical challenges require resolution before economic feasibility can be assessed. First, REE concentration data must be extended to the full stratigraphic column at Carbon County operations specifically, geographic variation in REE enrichment across the Uinta belt is documented. Second, REE mineralogical form (ionic adsorption vs. mineral-hosted in monazite, allanite, or bastnaesite) must be characterized, as this controls the processing pathway and recovery efficiency. Third, a processing flowsheet capable of selectively extracting REEs from carbonaceous shale at production scale must be demonstrated.
The strategic importance of this target has increased substantially in the 2024-2025 geopolitical environment. China's export controls 4m (April 2025; [4]) have created acute supply chain vulnerabilities for U.S. manufacturers of permanent magnets, LED phosphors, and advanced ceramics, the application sectors dependent on the light REE suite that is the primary product of carbonaceous shale REE mineralization in the Uinta belt. A Phase 2 ICP-MS investigation targeting Carbon County specifically is recommended as an immediate priority.
4.5. Secondary Target Potential
Beyond the primary U-V roll-front system, the spectral index dataset reveals three secondary target types with independent exploration potential. First, the Zn/Fe gossan index identifies a series of anticlinal-crest gossan anomalies spatially associated with purple-diamond deposit symbols, interpreted as structurally controlled polymetallic sulfide mineralization with vanadium enrichment. Several anomalies identified by the gossan index do not correspond to any catalogued deposit symbol, representing potential new discovery targets. Vanadium grades in such deposits can reach economic significance independent of uranium.
Second, the REE carbonaceous shale index delineates carbonaceous shale and phosphorite-associated REE occurrences along basin margins outside the roll-front system. These stratigraphically controlled occurrences merit systematic geochemical sampling to characterize REE grades and mineralogical form (particularly the proportion of ionic-adsorption vs. mineral-hosted REE).
Third, the titanium proxy indices confirm the presence of heavy-mineral-bearing fluvial sands at the western basin margin associated with Wasatch Range source terrains. These occurrences constitute potential ilmenite, rutile, and monazite (REE-bearing) placer targets that warrant independent evaluation as critical mineral resources.
An important caveat for all deposit types is that the spectral indices reflect current surface and near-surface conditions, which may not faithfully represent subsurface ore system geometry due to cover by Quaternary alluvium, mass-wasting deposits, or aeolian sand. Anomaly boundaries should therefore be interpreted as indicative of near-surface geochemical processes rather than direct projections of subsurface ore contacts.
4.6. Integrated Assessment: Critical Mineral Portfolio
Taken together, the spectral index analysis, mining district assessment, and coal field REE evaluation define a multi-commodity critical mineral portfolio for the San Rafael Swell region spanning three commodity groups, four deposit types, and three developmental timescales (Figure 11).
In the near term (0-5 years), the three Tier 1 U-V districts, Temple Mountain, San Rafael Swell, and San Rafael River, are the most actionable targets. All three have documented production histories, established geological frameworks from decades of USGS and industry investigation, and spectral index signatures that can prioritize drill locations without additional remote-sensing data acquisition. Vanadium co-production is the critical mineral of most immediate commercial relevance, given ~98% U.S. import dependency and growing demand from vanadium redox flow battery installations.
In the medium term (3-8 years), Coal Cliffs Ti-Zr and Carbon County REE targets represent the highest unevaluated upside. Both require grade characterization and processing pathway development before economic assessment is possible, but both offer commodity diversification into titanium, zirconium, and REE, the critical mineral classes facing the most acute supply chain vulnerability in the current geopolitical environment.
In the longer term (5-15 years), the four Tier 2 uranium-only districts represent a backstop resource inventory that could be developed incrementally as uranium demand grows, particularly if nuclear energy policy continues its current expansion trajectory in the United States, United Kingdom, and European Union.
This portfolio assessment (Figure 11) demonstrates that the multi-index spectral framework provides a coherent and quantitative basis for resource prioritization across a geologically diverse set of critical mineral targets, from conventional roll-front uranium-vanadium deposits through paleoplacer titanium-zirconium occurrences to unconventional REE-in-coal-adjacent-shale targets, and that the 13 spectral indices collectively capture the key surface and near-surface geochemical signatures relevant to all three commodity groups.
4.7. Limitations and Recommendations for Future Work
Several limitations of the spectral index approach should be acknowledged. Vegetation cover, even at low density, attenuates the signal of underlying rock and soil geochemistry in reflectance-based indices. Although the U normalized clay and U INDVI indices incorporate vegetation correction terms, areas of moderate shrub cover in the northern and western portions of the study area likely produce underestimated anomaly intensities. Future work should consider integration of thermal infrared (TIR) data, which is less susceptible to vegetation masking, to supplement VNIR-SWIR index outputs in these areas.
Atmospheric correction quality influences index performance, particularly for subtle SWIR band ratios. Residual atmospheric artefacts may introduce systematic bias in index values in areas of high surface reflectance contrast, such as the saline playa and evaporite-bearing zones in the southeastern portion of the study area. Rigorous cross-validation against field-measured reflectance spectra is recommended before prioritizing these areas for follow-up.
The spatial correlation estimates presented in Table 1 are indicative rather than statistically rigorous. A quantitative validation using receiver operating characteristic (ROC) analysis or prediction-area (P-A) plots, incorporating all known deposit and non-deposit locations, would provide a more robust assessment of each index's predictive performance and is recommended as a next analytical step.
Finally, Tier 1 targets (composite score 80-100) are recommended for immediate follow-up through portable XRF traverses along interpreted roll-front strike, radon soil-gas surveys to detect uranium-series disequilibrium, and, where geochemical results warrant, rotary or reverse-circulation (RC) drilling at 50-100 m spacing. Tier 2 targets are recommended for ground-truth sampling to determine whether field-validated geochemical anomalies justify upgrading to Tier 1. Tier 3 targets are appropriate for inclusion in regional reconnaissance mapping program pending acquisition of additional structural or geophysical data.
Figure 12.
Rare earth element (REE) concentrations by lithology class for the Uinta coal belt, including Carbon County coal field operations. Solid bars = mean concentration; hatched bars = maximum recorded value. The DOE economic viability threshold (300 ppm whole-rock; [30]) is indicated by the red vertical line. Carbonaceous shale and siltstone units directly adjacent to coal seams are the primary REE hosts (mean 245 and 215 ppm respectively), with some individual samples of carbonaceous shale and volcanic tuff exceeding the DOE threshold. Coal seams themselves are not REE-enriched (mean 85 ppm) [6].

5. Conclusions
This study demonstrates that a structured 13-index Sentinel-2 band-ratio framework provides quantitative, reproducible critical mineral prioritization across four geologically distinct deposit types occupying the same study area, using freely available multispectral satellite data and standard image processing software. Validation against a 247-location USGS MRDS deposit database [1] within a 500 m tolerance radius confirms that the index stack can detect and spatially distinguish the principal geochemical surface signatures relevant to sandstone-hosted uranium-vanadium roll-front deposits, Cretaceous titanium-zirconium beach paleoplacers, REE-enriched carbonaceous shales, and structurally controlled polymetallic gossans across the San Rafael Swell and Carbon County study area.
The uranium-targeting index subset substantially outperformed contextual indices, achieving a mean spatial correlation of 73% versus 57%, with the U compound bleaching index (85%) and V redox boundary index (80%) constituting the core diagnostic pair for roll-front targeting. The physical interpretation of this pair, the bleaching index mapping the oxidized side of the redox interface and the V redox index mapping the reducing side, directly corresponds to the geochemical architecture of Colorado Plateau uranium-vanadium ore systems and validates the use of broadband Sentinel-2 data for deposit-model-constrained mineral exploration at reconnaissance scale.
Three districts are classified as Tier 1 first-pass prioritization critical mineral targets based on convergent multi-index anomaly signatures and composite priority scores: Temple Mountain (92/100), San Rafael Swell (87/100), and San Rafael River (80/100). All three have documented production histories and established geological frameworks from prior USGS and industry investigation; the spectral index results provide district-scale anomaly maps capable of focusing drill-target selection without additional remote sensing data acquisition.
The most significant methodological finding of this study is the Coal Cliffs spectral inversion: the diagnostically high Ti proxy response (82%) combined with near-absent uranium bleaching (20%) and V redox signals (15%) constitutes a deposit-type discriminant that unambiguously identifies Cretaceous heavy-mineral paleoplacer mineralization without field data. This inversion pattern is unique among all nine districts evaluated and is unavailable from any single-index analysis. It establishes a transferable remote sensing criterion for distinguishing paleoplacer Ti-Zr targets from roll-front U-V systems across the Colorado Plateau and geologically analogous arid sedimentary basins, with direct application to critical mineral reconnaissance under the 2025 USGS federal list (60 commodities).
The REE carbonaceous shale index correctly maps the surface expression of the carbonaceous shale and siltstone lithological package that Coe et al. established as the primary REE host in the Uinta coal belt, with mean concentrations of 245 mg/kg, exceeding the 200 mg/kg reconnaissance enrichment threshold. While not a direct REE concentration measurement, the index provides a reconnaissance-scale surface proxy capable of directing field sampling toward REE-prospective outcrop at minimal cost, supporting the mine-of-opportunity REE extraction model for Carbon County coal operations.
Taken together, these results establish a multi-index Sentinel-2 framework, incorporating deposit-model-constrained index formulations and a weighted composite scoring rubric integrating spectral, geological, and commodity-criticality criteria, providing a practical and auditable basis for first-pass critical mineral prioritization in arid sedimentary terrain. The framework is fully reproducible from freely available satellite data and is scalable to analogous provinces across the Colorado Plateau and broader western United States not yet covered by Earth MRI hyperspectral campaigns. Field validation through portable XRF traverses and radon soil-gas surveys at Tier 1 districts, and grade characterization at Coal Cliffs, are recommended as immediate next steps.
Supplementary Materials
The following supporting information can be downloaded at the website of this paper posted on Preprints.org.
Author Contributions
Conceptualization, methodology, analysis, investigation, and writing was conducted by Bryony Richards. Reviewing and editing of the document was conducted by Mauro O. Cruzalegui and Pratt Rogers. Project administration and funding acquisition was conducted by Kody M. Powell. All authors have read and agreed to the published version of the manuscript.
Funding
This research was funded by the United States Department of Energy (DOE), grant number DE-FOA-003002.
Data Availability Statement
The following publicly archived datasets were used in this study and are freely available at the links indicated:Sentinel-2 Level-2A surface reflectance imagery was accessed from the ESA Copernicus Open Access Hub (https://dataspace.copernicus.eu/). Scene selection parameters (cloud cover <5%, dry-season acquisition May-October, aerosol optical depth thresholds) and scene identifiers for the Emery and Carbon County study area are provided in Supplementary Material S1. The USGS Mineral Resources Data System (MRDS) mineral occurrence database is publicly available at https://mrdata.usgs.gov/mrds/. The 247-location quality-checked deposit database compiled and reclassified for this study, including deposit-type symbol assignments, positional verification flags, and buffer exclusion criteria, is provided as Supplementary Material S2. The Utah Mineral Occurrence System (UMOS) database (Utah Geological Survey Open-File Report 757, 2023 update) is publicly available at https://doi.org/10.34191/OFR-757. The USGS Spectral Library Version 7, used to parameterize the synthetic spectral reference library, is publicly available at https://doi.org/10.3133/ds1035. The ESA Sentinel-2 MSI Spectral Response Functions (S2-SRF, COPE-GSEG-EOPG-TN-15-0007, v3.0), used for spectral convolution, are available from the ESA Sentinel Online document library at https://sentinel.esa.int/web/sentinel/user-guides/document-library. The 13-band ENVI spectral reference library (.sli format) developed for this study, the band-ratio index formulations and ENVI Band Math expressions for all 13 spectral indices, and the composite priority scoring sub-component values for all nine target areas are provided in Supplementary Material S3 to enable independent verification and replication of results. Spatial overlay operations and district boundary files were derived using ArcGIS Pro (Esri) and ENVI v6.1 (NV5 Geospatial). District boundary polygons used for spatial correlation analysis were derived from the USGS MRDS district attribute fields and are included in Supplementary Material S2. No new primary geochemical, geophysical, or drill-hole data were collected or generated during this study. All results are derived from the publicly available remote sensing and mineral occurrence datasets listed above.
Conflicts of Interest
The authors declare no conflicts of interest.
References
- McFaul, E.J.; Mason, G.T.; Ferguson, W.B.; Lipin, B.R. U.S. Geological Survey Mineral Databases; MRDS and MAS/MILS; 2000.
- Nassar, N.T.; Pineault, D.; Allen, S.M.; McCaffrey, D.M.; Padilla, A.J.; Brainard, J.L.; Bayani, M.; Shojaeddini, E.; Ryter, J.W.; Lincoln, S.; et al. Methodology and Technical Input for the 2025 U.S. List of Critical Minerals-Assessing the Potential Effects of Mineral Commodity Supply Chain Disruptions on the U.S. Economy; 2025.
- MOFCOM Announcement No. 46 of 2024: Strengthening Export Controls on Dual-Use Items to the United States (Gallium, Germanium, Antimony, Superhard Materials).
- MOFCOM Nnouncement No. 18 of 2025: Export Controls on Certain Medium and Heavy Rare Earth Related Items (Samarium, Gadolinium, Terbium, Dysprosium, Lutetium, Scandium, Yttrium).
- Campbell, K.M.; Seal, R.R.; Piatak, N.M.; Azain, J.S.; Morrison, J.M.; Jane White, S.; Manning, A.H.; Walton-Day, K.; Holloway, J.M.; Wang, B. Scientific Investigations Report 2025-5068 Mineral Resources Program Earth Mapping Resources Initiative Protocols-Sampling Hard-Rock Mine Waste and Perpetual Mine Water Sources; 2025.
- Coe, H.H.; Birgenheier, L.P.; Fernandez, D.P.; Gall, R.D.; Vanden Berg, M.D.; Giebel, A. Rare Earth Element Enrichment in Coal and Coal-Adjacent Strata of the Uinta Region, Utah and Colorado. Front. Earth Sci. (Lausanne). 2024, 12. [CrossRef]
- Mills, S.E.; Rupke, A. Critical Minerals of Utah; 2020.
- Mills, S.E.; Rupke, A. Critical Minerals of Utah, Second Edition; 2023.
- Hawley C.C; Robeck, R.C.; Dyer, H.B. Geology, Altered Rocks, and Ore Deposits of the San Rafael Swell, Emery County, Utah; 1968.
- Gloyn, R.W.; Tabet, D.E.; Tripp, B.T.; Bishop, C.E.; Morgan, C.D.; Gwynn, J.W.; Blackett, R.E. Energy, Mineral, and Ground-Water Resources of Carbon and Emery Counties, Utah. Utah Geological Survey Bulletin 2003, 132.
- Fischer, R.P. Similarities, Differences, and Some Genetic Problems of the Wyoming and Colorado Plateau Types of Uranium Deposits in Sandstone. Economic Geology 1970, 65, 778–784. [CrossRef]
- Hobday, D.K.; Galloway, W.E. Groundwater Processes and Sedimentary Uranium Deposits. Hydrogeol. J. 1999, 7, 127–138. [CrossRef]
- Hall, S.M.; Van Gosen, B.S.; Zielinski, R.A. Sandstone-Hosted Uranium Deposits of the Colorado Plateau, USA. Ore Geol. Rev. 2023, 155, 105353. [CrossRef]
- Clark, R.N.; King, T.V. V.; Klejwa, M.; Swayze, G.A.; Vergo, N. High Spectral Resolution Reflectance Spectroscopy of Minerals. J. Geophys. Res. Solid Earth 1990, 95, 12653–12680. [CrossRef]
- Sabins, F.F. Remote Sensing for Mineral Exploration. Ore Geol. Rev. 1999, 14, 157–183. [CrossRef]
- Rajendran, S.; Nasir, S. ASTER Spectral Sensitivity of Carbonate Rocks – Study in Sultanate of Oman. Advances in Space Research 2014, 53, 656–673. [CrossRef]
- Rowan, L.C.; Mars, J.C. Lithologic Mapping in the Mountain Pass, California Area Using Advanced Spaceborne Thermal Emission and Reflection Radiometer (ASTER) Data. Remote Sens. Environ. 2003, 84, 350–366. [CrossRef]
- European Space Agency Sentinel-2 User Handbook.
- Drusch, M.; Del Bello, U.; Carlier, S.; Colin, O.; Fernandez, V.; Gascon, F.; Hoersch, B.; Isola, C.; Laberinti, P.; Martimort, P.; et al. Sentinel-2: ESA’s Optical High-Resolution Mission for GMES Operational Services. Remote Sens. Environ. 2012, 120, 25–36. [CrossRef]
- Crowley, J.K.; Brickey, D.W.; Rowan, L.C. Airborne Imaging Spectrometer Data of the Ruby Mountains, Montana: Mineral Discrimination Using Relative Absorption Band-Depth Images. Remote Sens. Environ. 1989, 29, 121–134. [CrossRef]
- NV5 Geospatial Software, Inc. ENVI Geospatial Software, Inc. 6.1 2024.
- Kokaly, R.F.; Clark, R.N.; Swayze, G.A.; Livo, K.E.; Hoefen, T.M.; Pearson, N.C.; Wise, R.A.; Benzel, W.; Lowers, H.A.; Driscoll, R.L.; et al. USGS Spectral Library Version 7; 2017.
- Frost, R.L.; Čejka, J.; Weier, M.L.; Martens, W.; Henry, D.A. Vibrational Spectroscopy of Selected Natural Uranyl Vanadates. Vib. Spectrosc. 2005, 39, 131–138. [CrossRef]
- Clark, R.N.; King, T.V. V.; Klejwa, M.; Swayze, G.A.; Vergo, N. High Spectral Resolution Reflectance Spectroscopy of Minerals. J. Geophys. Res. Solid Earth 1990, 95, 12653–12680. [CrossRef]
- European Space Agency Sentinel-2 MSI Spectral Response Functions (S2-SRF), COPE-GSEG-EOPG-TN-15-0007, v3.0. ESA.
- Esri Inc. ArcGIS Pro (Version 3.3) 2024.
- Hawley, C.C.; Brooks, D.B.; Wyant, D.G. Geology and Uranium Deposits of the Temple Mountain District, Emery County, Utah; 1965.
- Johnson, H.S. Uranium Resources of the San Rafael District, Emery County, Utah - a Regional Synthesis; 1957.
- Nassar, N.T.; Fortier, S.M. Methodology and Technical Input for the 2021 Review and Revision of the U.S. Critical Minerals List; 2021.
- Bagdonas, D.A.; Enriquez, A.J.; Coddington, K.A.; Finnoff, D.C.; McLaughlin, J.F.; Bazilian, M.D.; Phillips, E.H.; McLing, T.L. Rare Earth Element Resource Evaluation of Coal Byproducts: A Case Study from the Powder River Basin, Wyoming. Renewable and Sustainable Energy Reviews 2022, 158, 112148. [CrossRef]
Figure 1.
Experimental design flowchart illustrating the six-stage analytical pipeline from Sentinel-2 data acquisition through composite district priority scoring. Arrows indicate data flow; dashed arrow indicates external data input. MRDS = USGS Mineral Resources Data System [1]; UGS = Utah Geological Survey [14].

Figure 8.
Named mining districts of the San Rafael Swell region, Emery County, Utah. White dashed outlines delineate district boundaries from the USGS MRDS reference database; [1]. North arrow indicates true north. Three Tier 1 districts (Temple Mountain, San Rafael Swell, San Rafael River) designated in blue; Tier 2 districts in green and brown tones corresponding to deposit type. The Wasatch Plateau (west) and San Rafael River canyon system (east) define the study area boundaries.

Figure 9.
Composite critical mineral exploration priority scores for all nine target areas. Scores derived from weighted combination of spectral index spatial correlation, documented production history, host-rock geological favorability, and commodity criticality relative to the 2025 USGS federal critical minerals list (60 commodities). The Tier 1 threshold (score 80) is indicated by the vertical reference line. *Carbon County score based on REE-in-coal-adjacent-strata assessment only.

Figure 10.
Heat-map table of estimated spectral index spatial correlation (%) for each mining district across the five primary indices. Cell shading: green ≥80% (high); amber 60-79% (moderate); red <40% (low). The Coal Cliffs inverted spectral signature (high Ti proxy 82%, very low bleaching 20%/V redox 15%) is diagnostic of Ti-Zr paleoplacer mineralization, distinct from the roll-front U-V system characterizing all other districts.

Figure 11.
Critical mineral portfolio priority matrix. Each bubble represents one mining district or coal field target; bubble area is proportional to estimated resource potential. Two distinct strategic trajectories are visible: high-priority Tier 1 U-V districts (upper left; near-term production candidates) and lower-priority, higher-diversity Ti-Zr and REE targets (middle right; medium-term research and development candidates). TM = Temple Mountain; SRS = San Rafael Swell; SRR = San Rafael River; CC = Coal Cliffs; CCR = Carbon County REE; CM = Cedar Mountain; CaM = Calf Mesa; GD = Greasewood Draw; WSR = West San Rafael.

Table 1.
Processing workflow components, methods, and outputs for spectral index-based critical mineral prospectivity mapping in Emery and Carbon Counties, Utah. Sentinel-2 L2A imagery was preprocessed to surface reflectance, convolved against a synthetic spectral library, and used to derive 13 band-ratio index anomaly rasters. Spatial correlation with 247 georeferenced mineral deposit records was used to weight a composite priority scoring model that classifies districts into Tier 1 and Tier 2 prospectivity categories.
| Component | Input | Method/Tool | Output |
|---|---|---|---|
| Satellite data | Sentinel-2 L2A scenes; Emery + Carbon Co. | Sen2Cor v2.11 atmospheric correction; SCL cloud masking; resample to 20 m (ENVI) | Surface reflectance image stack, 12 bands |
| Spectral library | 431-band Gaussian synthetic spectra | SRF convolution to S2 band positions (Python/NumPy); 10 reference endmembers | 13-band ENVI. sli reference library |
| Spectral index derivation | S2 band reflectance | 13 band-ratio index formulations (ENVI Band Math); 2-98th percentile normalization | Continuous index anomaly rasters (0-1 normalized) |
| Reference database | USGS MRDS + UGS records; N = 247 locations | Attribute reclassification → 5 deposit-type classes; 500 m buffer overlay | Georeferenced validation point dataset |
| Spatial correlation | Index anomaly rasters + deposit database | ≥75th-percentile threshold; buffer overlay; correlation coefficient | Spatial correlation (%) per index |
| Priority scoring | Spectral correlations + geological + criticality criteria | Weighted composite: spectral 40%, history 25%, host rock 20%, criticality 15% | District priority score (0-100); Tier 1/2 classification |
Table 2.
Sub-component scores contributing to the composite district priority score for all nine target areas. Scores are presented on a 0-100 continuous scale for each of the four weighted criteria: spectral index spatial correlation performance (Sp; ×0.40), documented production history and geological characterization quality (H; ×0.25), host-rock geological favorability (G; ×0.20), and commodity composition relative to the 2025 USGS federal critical minerals list (60 commodities; C; ×0.15) [2]. The composite score is computed as 0.40×Sp + 0.25×H + 0.20×G + 0.15×C; computed values reproduce stated district scores to within ±0.5 points. Commodity criticality column lists each district's primary commodities designated on the 2025 list. Spectral sub-score is the weighted mean of the five primary index spatial correlations per deposit type (Section 2.4.1). Assessed sub-scores (H, G, C) are assigned against the rubric defined in Table [N+1]. Heat-map shading: green ≥80 (high); amber 60-79 (moderate); red <60 (low). Full sub-component data are provided in Supplementary Material S3.

1Score of 80/100 sits exactly at the Tier 1 classification threshold; sub-score uncertainty of ±5 points spans the Tier 1/2 boundary (Section 2.4.1). 2Spectral sub-score derived from the Ti ilmenite/titanite proxy index under the deposit-type-adjusted paleoplacer rubric; bleaching (20%) and V redox (15%) indices serve as diagnostic negatives confirming the absence of roll-front chemistry. 3Tier 2 classification follows Table XX (50-79); the Section 2.4 text value of 60-79 is a typographic error. 4Scored against a modified rubric calibrated to the mine-of-opportunity extraction model (Section 4.4).
Table 3.
Scoring rubric defining the High (75-100), Moderate (50-74), and Low (<50) sub-score anchors for the four composite priority score criteria. Sub-scores are assigned by expert assessment against these published anchor descriptions and combined using the weighted formula: Composite = 0.40×Sp + 0.25×H + 0.20×G + 0.15×C. Spectral sub-scores are computed objectively from spatial correlation analysis (Section 2.4.1) and do not require expert assignment. Commodity criticality is assessed against the 2025 USGS federal critical minerals list (60 commodities [2]). Sub-score uncertainty for the three expert-assessed criteria (H, G, C) is estimated at ±5 score points, sufficient to alter tier classification only at the Tier 1/2 boundary (scores 78-82; Section 2.4.1). SC = spatial correlation coefficient (%).

Disclaimer/Publisher’s Note: The statements, opinions and data contained in all publications are solely those of the individual author(s) and contributor(s) and not of MDPI and/or the editor(s). MDPI and/or the editor(s) disclaim responsibility for any injury to people or property resulting from any ideas, methods, instructions or products referred to in the content. |
© 2026 by the authors. Licensee MDPI, Basel, Switzerland. This article is an open access article distributed under the terms and conditions of the Creative Commons Attribution (CC BY) license (http://creativecommons.org/licenses/by/4.0/).
Copyright: This open access article is published under a Creative Commons CC BY 4.0 license, which permit the free download, distribution, and reuse, provided that the author and preprint are cited in any reuse.


