

Submitted:
23 June 2026
Posted:
24 June 2026
You are already at the latest version
Abstract
Timely identification of company financial risks is crucial for investors and regulators. However, existing studies overlook the class imbalance caused by the scarcity of high-risk samples, and the interpretability of deep models is insufficient, making it difficult to meet the practical needs.To address these problems, we propose a classification model named FA-LSTFormer, which models a company's financial situation as low, medium, and high risk warning tasks. FA-LSTFormer employs LSTM and Transformer to capture the short-term continuity and the long-term dependency of financial data, respectively. We also propose the Risk Sensitive Hierarchical Indicator Attention (RSHA) module, which focuses on specific financial indicators. Further propose the Class Imbalance Aware Loss (CIAL) function to correct the class imbalance caused by the scarcity of high-risk company samples, to reduce the misclassification of high-risk companies. On the dataset of Chinese A-share manufacturing listed companies, experimental results show that our FA-LSTFormer achieves superior performance in accuracy, precision, recall, F1 score and AUC, achieving 92.76%, 93.13%, 91.84%, 92.48%, and 95.27%, respectively. Compared to the suboptimal LTR-Net, it improves these metrics by 1.64%–3.60%. Compared to the the LSTM-Transformer baseline, it improves them by 4.30%–9.13%. In the risk-oriented decision evaluation, FA-LSTFormer achieves a warning ROC of 0.954 for the high-risk class,, and lowers the error rate to 9.82%. Maintaining an accuracy rate of 84.46% even after three years of early warning, and exhibits strong robustness across different warning thresholds and company sizes. These results verify the advantages of FA-LSTFormer in both algorithmic performance and practical early-warning application.
Keywords:
financial risk
; early warning
; LSTM-Transformer
; RSHA
; CIAL
1. Introduction
The financial health of a company is the foundation of its survival and development. When a company faces financial risks, operational difficulties may trigger a chain reaction, including debt defaults, layoffs and bankruptcy, damaging the interests of investors and creditors and undermining the stability of the wider economic system [1,2]. Therefore, accurately predicting financial risks is one of the core issues in corporate finance and financial management [3]. An effective early warning method provides managers with a window in which to take corrective action, enables creditors and investors to reprice risk, and supports regulators in maintaining market order [4,5]. In recent years, with the rapid development of deep learning and time-series modelling, research on financial risk early warning has been evolving from static discrimination toward dynamic, interpretable and gradable methods [6,7,8].
Research on financial risk prediction has broadly gone through three stages. The first stage is dominated by statistical discriminant methods. Altman [1] pioneers the Z-score model, using multiple discriminant analysis to combine accounting ratios to distinguish between healthy enterprises and potential bankruptcy candidates. Beaver [2] examines the predictive ability of individual financial ratios for company failure with a univariate analysis.Ohlson [3] employes logistic regression to relax distributional assumptions such as normality and provided easily rankable probability estimates. These linear models are transparent and easy to apply, yet they rest on strict statistical assumptions and treat each reporting period in isolation rather than capturing the joint evolution of indicators across years. The second stage introduces machine learning classifiers such as support vector machines, decision trees, random forests and gradient-boosted trees [9], which can capture nonlinear interactions among financial metrics. These often outperform classical statistical models in cross-sectional data and are further combined with imbalance mitigation techniques like SMOTE to enhance minority class recognition, such as SMOTE [10]. Many works [11] point out that, although this stage markedly improves predictive accuracy, most studies still compress multi-period information into hand-crafted summary features, discarding the temporal structure that risk evolution should inherently reveal. The third stage applies deep learning to the inherently temporal nature of financial data. The LSTM proposed by Hochreiter [4] models sequences directly , and captures short-range dependencies between adjacent reporting periods through gated memory mechanism. Vaswani [5] proposes Transformerto replace cyclic structures with self attention, which excels in modeling long-range dependencies and identifying the most important time points. Subsequently, representative works such as Informer [12], Temporal Fusion Transformer [13] and Autoformer [14] emerged in the field of long sequence prediction.
For financial warning tasks, Cheng [15] proposes a DUAL-LSTM with embedded attention that confirms the value of attention mechanisms in improving warning accuracy. Mai et al. [16] integrate textual disclosures into deep bankruptcy prediction. Hosaka [17] visualizes financial ratios and applies convolutional neural networks. Jiang et al. [19] further mine semantic features from patent texts to assist distress prediction. Because financial statements exhibit both short-range continuity and long-range dependency, hybrid designs that couple recurrent components with attention-based components are particularly attractive. LTR-Net [18] fuses LSTM, Transformer and residual modules and reports that the joint design outperforms any single architecture in capturing temporal dependencies, global information and non-linear relations. Wang et al. [19] propose a fusion deep neural network for multi-period annual report data. Mohamed [20] constructs a deep warning model for multidimensional analysis. Yang [21] explores how CNN-LSTM supports company financial forecasting. Beyond Transformers-based, selective state space models represented by Mamba [22] have emerged as efficient sequence learners. Recent frameworks such as TSCMamba [23], Mamba-hypergraph [24] and MambaSL [25] report strong improvements on time series classification benchmarks, offering competitive baselines for sequence modelling.
Although deep models and hybrid architectures continue to advance the accuracy of financial early warning, there are still three prominent limitations when facing actual company risk warning demands. First, most studies formulate the task as a binary classification between distressed and healthy firms [16,17]. However, managers actually make decisions in a hierarchical warning manner. It is necessary to distinguish between companies in a state of concern and those in acute danger in order to apply differentiated intervention measures. Second, high-risk companies are extremely rare, and this class imbalance biases models trained with ordinary cross-entropy toward the majority class, making the high-risk firms whose misclassification cost is the highest precisely the most likely to be missed [27]. Thirdly, deep models often sacrifice transparency while improving performance, and regulatory agencies' requirements for model interpretability are increasing. More works are integrating interpretability tools into financial warning models , such as attention weights and Shapley attribution [15,26], enabling a warning to be traced back to its underlying risk drivers.To solve the above problems, we propose an improved LSTM-Transformer model for company financial risk grading warning, named FA-LSTFormer. FA-LSTFormer models the enterprise financial risk early-warning as a three classification of low risk, medium risk, and high risk. The core idea is to combine the time-series encoding backbone composed of LSTM and Transformer with the Risk Sensitive Hierarchical Indicator Attention (RSHA) module, and the Class Imbalance Aware Loss (CIAL) function, to provide timely and accurate segmentation early-warnings for company financial indicators.
Our contributions are as follows:
(1) FA-LSTFormer consists of LSTM-Transformer, RSHA module and CIFLloss function. The LSTM-Transformer maps multi-year financial indicator sequences into contextual representations that combine short-term continuity and cross period long-term dependencies, thereby characterising the gradual evolution trajectory of risk. The RSHA adaptively focuses on key financial risk drivers factors. CIFL is an imbalanced loss function that corrects the class bias caused by the scarcity of high-risk companies during training, reducing false negatives.
(2) We propose RSHA, which decomposes the contextual representation obtained by LSTM-Transformer backbone into tensors with financial indicator, and then uses Softmax to learn a set of normalized attention weights, enabling the model to dynamically focus on key risk driven indicators . RSHA both suppresses the interference of irrelevant indicators on the warning result and makes the result traceable to specific financial factors, thereby enhancing interpretability.
(3) We propose CIFL to address the scarcity of high-risk enterprise samples and the highest cost of underreporting. CIFL collaboratively corrects the bias of enterprise category distribution in three ways: introducing a focus modulation factor in the loss layer, focusing training on high-risk samples that are difficult to distinguish, using category weights based on the number of effective samples in the sample layer, and introducing a minority class synthesis mechanism in the training layer.
(4) On the dataset of Chinese A-share manufacturing listed companies from 2015 to 2025, we compare FA-LSTFormer with six methods, including LSTM, Transformer, LSTM-Transformer, LTR- Net, TSCMamba and MambaSL. The results show that FA-LSTFormer achieves optimal performance in both algorithm performance and financial risk warning application. The former is manifested in superior accuracy, F1, and AUC indicators. The latter is reflected in the lowest cost weighted misjudgment, the longest warning lead time, and the strongest cross industry robustness.
2. Company Financial Data and Problem Description
2.1. Making a Dataset
We collect Chinese A-share manufacturing listed companies from 2015 to 2025 as the research sample. The manufacturing industry occupies a large proportion in the A-share market, with standardized financial report disclosure and strong comparability between companies. And the special regime implemented by the exchange for companies with significant uncertainty in their ongoing operations an institutional basis for the objective definition of financial-risk labels.
We operationalise company's financial risk warning into a three classification task, namely low-risk, medium-risk and high-risk.The high-risk level corresponds to companies that are subject to ST or * ST in the prediction year or the following year, both of which belong to the category of risk warning companies issued by the exchange. The medium-risk level denotes companies that have not yet triggered special treatment but have shown clear deterioration in financial indicators. The criteria for deterioration are negative total asset return rate for two consecutive years, or asset liability ratio higher than the 75th percentile of the current year in the industry, or negative operating profit. The low-risk level covers companies that have not undergone special treatment and do not satisfy any of the above deterioration conditions.To preserve sample quality, companies with prolonged trading suspension during the study period and firm-year observations with critical missing items are removed, and extreme outliers are treated by Winsorisation.After filtering, 536 companies are retained, of which 300 are low-risk, 128 are medium-risk and 108 are high-risk. Furthermore, we select 8 financial indicators as training features for FA-LSTForme, namely profitability, debt paying ability, operational efficiency, growth ability and cash flow, as shown in Table 1. These indicators cover the main aspects of company's financial condition while keeping inter-indicator redundancy low, and together with the three labels provides high-quality input features for the subsequent training and evaluation of the FA-LSTFormer.
2.2. Formalization of Financial Risk EARLY Warning in Companies
Let a company be represented by a time series X=(x (t-T), x (t-T+1),..., x (t-1)) of length T. Each x(i) ∈ ℝd is a vector composed of d financial indicators observed by the company in year i, and t is the predicted year. We formalize the financial risk early warning of a company as a mathematical modeling problem. Given X, learn a mapping f:X→y, where y ∈ Y={low risk, medium risk, high risk} represents the risk level in the predicted year t. And the three levels are arranged in ascending order of risk severity to form an ordered output space. Specifically, the mapping f is implemented by a deep neural network with parameter θ, and the model produces predictions of risk level in the form of conditional probabilities. The risk level with the maximum posterior probability is taken as the warning result, as given in equation (1).
where fθ is the unnormalised scores output by the model at three risk levels, then softmax operator converts them into a valid probability distribution, and ŷ is the final predicted level. The model parameter θ is optimized by minimizing the loss function on the training set. This formal definition transforms the company's financial risk eaely-warning problem into supervised sequence classification task that can be directly processed by deep models.
P(y = c|X;θ) = softmax(fθ(X))c, ŷ = argmaxP(y=c|X;θ) {c ∈ Y},
3. Method
3.1. Overall Framework
The design motivation of FA-LSTFormer originates from two characteristics of the company's financial risk evolution proces. Along the time dimension, short-term continuity exists between adjacent reporting periods, while the path into distress often depends on short-term signals across years. Along the indicator dimension, the contribution of different financial indicators to risk is not uniform, and their relative importance varies with the company and risk scenario. Along the sample dimension, high-risk companies are extremely rare, but their underreporting incurs the highest cost. If any one of these characteristics is ignored, the warning model fails in practice. Based on this, FA-LSTFormer builds an end-to-end warning framework, which assigns the above three types of characteristics to interconnected components for processing, and embeds two targeted innovative mechanisms. The overall architecture is shown in Figure 1.
The overall process of FA-LSTFormer consists of five stages. The first stage is input preprocessing. Standardize the eight financial indicators of the company to form multivariate time series tensor. Then is LSTM temporal encoding.Read indicator vectors year by year in chronological order, capture short-term continuity between adjacent reporting periods through gating mechanisms, and output hidden state sequences. Next is Transformer global modeling. After applying positional encoding, multi-head self-attention models the long-term dependencies and outputs high-dimensional representation z that integrates context. Based on this, our RS-HIAM module decomposes z into eight indicator dimensions and assigns learnable normalized weights to each indicator according to the specific risk scenario of the sample. Further obtain a weighted discriminant representation of the indicators, and make the warning results. The fifth stage is training optimization. Output three risk probability using Softmax, and take the CIFL as loss function. Then, end-to-end gradient feedback then drives the whole network jointly toward optimisation that favours high-risk identification.
3.2. LSTM-Transformer Backbone Network
LSTM can update the tight encoding of short-term continuity between adjacent reporting periods. Transformer aggregates cross temporal long-term dependencies globally through self attention mechanism. The combination of these two can simultaneously characterize the local and global characteristics of financial time-series data. If xt is the input vector at time t and ht-1 is the hidden state at the previous time, then the state update equation (2) for the three gates of LSTM is as follows:
where is the logistic Sigmoid function, are the forget gate, input gate, and output gate, respectively. and are the updated cell state and hidden state, respectively.
After traversing the input company financial data, the hidden state sequence {h1, h2, h3} is obtained. It encodes short-term continuity between adjacent reporting periods as input to the Transformer encoder. The Transformer encoder adds positional encoding to the hidden-state sequence to preserve temporal, performs pairwise comparisons for each year through a multi head self-attention mechanism. The core operator is scaled dot product attention, as shown in equation (3).
where Q, K, and V are the query, key and value matrices, respectively. dk is the dimension of the key vector. The multi head mechanism obtains a linear transformation by running multiple independent attention heads in parallel and concatenating their results. Each encoder block consists of multiple self attention sub layers and position wise feedforward sub layers, with residual connections and layer normalization applied. After processing by the encoder block, the model outputs a contextual representation for each reporting year that combines local continuity and global long-range dependencies. For the convenience of subsequent description, the global representation of the entire sequence is denoted as z, which is the input of the RS-HIAM mechanism.
Attention(Q, K, V) = softmax( QKT / sqrt( dk ) ) V
3.3. LSTM-Transformer Backbone Network
The evolution of financial risk exhibits clear heterogeneity in the indicator. Solvency-related indicators dominate in leverage-driven risks, while cash flow-related indicators play a pivotal role in operational distress. This implies that risk signals are sparse and context-dependent across indicator dimensions. RSHA incorporates learnable indicator-level attention distributions under the premise of integrating contextual global representations, enabling the model to dynamically and sparsely focus on key risk drivers based on sample-specific risk contexts. This approach enhances discriminative accuracy while maintaining a priori verifiable interpretability. RSHA decomposes the global representation z into eight indicator dimensions, obtaining sub-representations associated with each financial indicator, as shown in equation (4).
where is the sub-representation associated, while and are the learnable projection parameters exclusive to this indicator. This hierarchical decomposition is equivalent to constructing a dedicated perspective for each indicator dimension atop the shared global representation, enabling the subsequent attention mechanism to apply weighting at the indicator level rather than the overall level.
Next, calculate the learnable attention distribution. Nonlinearly fuse the global representation with each sub-representation of the metrics and score them, then normalize them into a distribution via a temperature-adjustable Softmax, as shown in equation (5).
where , , and are learnable parameters, and coefficient is used to regulate the sparsity of attention distribution. When approaches zero, the distribution tends towards hard selection, and the model focuses more on a very small number of samples. During the training process, appropriate sparsity is obtained through joint optimization, ensuring that the attention distribution remains moderately sparse while being dependent on the samples.
Further combining the weighted indicators with sparse regularization, a weighted fusion representation of the indicators and its corresponding attention entropy regularization term are obtained, as shown in equation (6).
where is the weighted discriminant representation of financial indicators. Quantifying the uncertainty of the current attention distribution with encourages the model to form a sparse focus rather than a uniformly scattered attention distribution.
3.4. CIFL Function
In real-scenarios, the number of high-risk companies is small, the sample ratio is low, and the cost of underreporting is high. The CIFL function reshapes the class prior weights through the effective sample size, reallocates the gradient contributions of difficult and easy samples, and couples the minority class synthesis mechanism to expand the support domain of high-risk manifolds, enabling the model to synergistically correct imbalanced biases in the loss layer, sample layer, and training layer. CIFL allocates gradient contributions of difficult and easy samples based on Focal loss, and reshapes class priors with class weights based on the number of effective samples, as shown in equation (7).
where is the prediction probability of the model for the true class of the sample, is the focus parameter, and the modulation factor rapidly decays when p approaches 1. The class weight draws on the idea of effective sample size, where is the number of training samples for category , and beta is a decay constant close to 1. This weight can more robustly reflect the effective information of minority classes, avoiding training instability caused by excessive weighting under extreme imbalance.
4. Experiments and Results
4.1. Experimental Setting
In the experiment, the LSTM sets 64 hidden units. Transformer encoder consists of two blocks and four attention heads. The RSHA module operates across eight metric dimensions. Optimization using Adam, initial learning rate of 0.001, batch size of 64, and regularization using 0.2 Dropout. We compare FA-LSTFormer with five other methods, including LSTM, Transformer, LSTM-Transformer, LTR-Net and TSCMamba. All models share the same chronological data split and the same set of eight financial indicators. Given the class imbalance inherent in corporate financial risk early-warning tasks, the evaluation metrics include not only accuracy, but also precision, recall, F1-score, AUC, and the geometric mean of per-class recall rates, the last of which is particularly sensitive to minority-class performance.
4.2. The Overall Performance of Financial Risk Early Warning
Table 2 shows the overall performance of various methods on the testset for financial risk early warning. Our FA-LSTFormer achieves achieves superior performance across all metrics, with an F1 score of 92.48% and an AUC of 95.27%. Compared to the suboptimal LTR-Net, the F1 score and AUC improve by 1.84% and 3.60%, respectively. Relative to the LSTM-Transformer baseline, the F1 score and AUC increase by 8.56% and 5.64%, respectively.
Figure 2 further shows the ROC of the top three models across three risk levels. It can be observed that low corporate financial risk is the easiest to identify, with all three models achieving high and closely clustered AUC values. The performance gap among the three methods widens in medium financial risk early warning. For financial high-risk warning, the AUC of FA-LSTFormer is 0.954, significantly better than LTR-Net's 0.913 and LSTM Transformer's 0.895. Moreover, the curve shows a particularly significant lead in the low false positive rate area on the left side. This is precisely the work range that financial risk warning values the most. On the premise of strictly controlling false positives and avoiding disturbing health companies, FA-LSTFormer can still capture a higher proportion of real high-risk companies. The advantage of three consistent levels of curves indicates that our FA-LSTFormer effectively enhances the model's ability to identify and warn of three types of financial risks, especially high-risk companies with the most severe consequences.
4.3. Risk Early Warning Results for Company Decision-Making
There are usually two types of misclassification in company financial risk early warning, with vastly different consequences. The first type of error is false alarm, which means that the health company is classified as at risk. The cost of misreporting mainly includes additional due diligence costs, unnecessary attention, and minor impact on the company's reputation. The second type of error is underreporting, which means that companies that are actually at risk are judged as healthy. The cost of underreporting is very serious, which may cause investors and creditors to miss the opportunity to cut losses due to failure to receive timely warnings, and regulators may also overlook it as a result. Table 3 shows the evaluation results of five methods for two types of errors. According to the consensus of financial risk management, we calculate the total cost based on a weight of 5:1 between the second type error and the first type error. FA-LSTFormer reduces the second type error rate to 9.82% and achieves the lowest total cost of 60.18, far lower than LTR-Net, LSTM Transformer, MambaSL, and TSCMamba. This indicates that FA-LSTFormer not only leads in statistical indicators, but also significantly reduces actual decision risk in the most critical dimension of underreporting.
Figure 3 shows the accuracy of early warning under different prediction lead times, measuring the accuracy of making predictions one year, two years, and three years before the occurrence of risk events. As expected, the accuracy of all models decreases with the extension of the early stage, as earlier signals are weaker. The attenuation of FA-LSTFormer is the smoothest. It maintained an accuracy of 85.46% three years ahead of schedule, while the accuracy of LSTM Transformer is only 78.05%. Early and reliable warnings are crucial in providing financial risk managers with sufficient decision-making and action time, and have significant practical value.
Figure 4 visualizes the indicator level attention weights generated by the RSHA module after taking the average within each risk level. The rows represent three levels of risk, and each column represents a financial indicator. The cell value represents the attention weight of the model on financial indicators at the risk level. The darker the color, the higher the weight. Horizontally representing the financial indicators that the model is most concerned about under the same risk level. Vertically reflect the changes in attention of the same financial indicators among different risk levels. For low-risk companies, attention is evenly distributed across various indicators. For high-risk companies, the model focuses on the asset liability ratio and the ratio of operating cash flow to total liabilities. This model is economically reasonable, because debt repayment pressure and insufficient cash coverage are precursors of the company's financial risk, which indicates that the module has learned to focus on the most important indicators when the risk is acute.
Table 4 shows the three indicators that received the highest attention when FA-LSTFormer issued a high-risk warning for the three companies that were subjected to special treatment. Among them, the company logo has undergone desensitization treatment. For the three companies, the dominant indicators are consistent with the difficulties publicly disclosed by the companies. For example, a rise in leverage or a deterioration in cash flow indicates that the warning is not only accurate but also auditable.
Figure 5 shows the robustness test results of FA-LSTFormer. (a) By changing the financial risk warning threshold, it is shown that the FA-LSTFormer remains higher than the macro F1 of the base model throughout the entire range of values. 6 (b) Grouping companies by market value shows that this advantage also holds true in large, medium, and small companies, with only a slight decrease in the smallest group. This confirms that the model has generalization ability across different company sizes.
4.3. Ablation Experiment
We conduct comprehensive ablation experiments on the model components, as shown in Table 5. Using LSTM-Transformer as the baseline, add RSHA module and CIFL function in sequence. After adding RSHA separately, the F1 score of the model increased from 85.19% to 87.12%, indicating that explicit modeling of indicator importance can effectively sharpen the model's risk discrimination ability. After adding CIFL separately, the high-risk level recall rate significantly increased to 89.50%, confirming the targeted suppression effect of this loss function on false negatives. After synergistically integrating the two improvements, the complete FA-LSTFormer achieved optimal performance on all evaluation metrics. The results indicate that RSHA and CIFL have high complementarity at the functional level rather than redundant superposition.
Table 6 verifies the impact of different loss functions on the FA-LSTFormer backbone network. The precision of identifying financial high risks using cross-entropy loss is 85.42%, but the recall rate is only 79.34%, indicating that the model tends to make conservative predictions and a large number of high-risk samples are missed. Weighted cross entropy improves recall by reallocating class weights, but at the cost of sacrificing accuracy. After replacing Focal Loss, the model achieves a better balance between precision and recall, with a high-risk F1 score of 86.95%. After replacing CIFL, the model's F1 score for financial high-risk warning increased to 91.84%, and the overall F1-score also reach 92.48%, verifying the rationality and effectiveness of CIFL's design concept of combining loss reweighting with data level enhancement.
5. Discussion and Conclusion
Our FA-LSTFormer deep network model solves the problem of underreporting caused by class imbalance in financial samples and insufficient interpretability of deep models, ultimately achieving three-level early warning of company financial risks. FA-LSTFormer adopts LSTM-Transformer as its baseline backbone, leveraging it as a temporal-encoding backbone to jointly characterize the local continuity and cross-period long-range dependencies of risk evolution. Then, through the RSHA module, sample adaptive sparse attention is applied in the indicator dimension to focus on key risk driving factors. And employs the CIFL function to correct the class bias of high-risk samples. On the dataset of Chinese A-share manufacturing listed companies from 2015 to 2025, FA-LSTFormer achieved superior performance in all metrics, with F1 score and AUC reaching 92.48% and 95.27%, respectively, and an improvement of 1.67% and 3.31% compared to the suboptimal LTRNet. In the evaluation of enterprise risk decision-making, the ROC of high-risk warning reached 0.954, and the cost weighted total misjudgment decreased to 60.18. The second type of error rate has been reduced to 9.82%, with an accuracy rate of 84.46% even after three years of early warning, and remains robust under different thresholds and company sizes. Ablation experiments further demonstrated the complementarity between RSHA and CIFL, which improved discrimination accuracy and high-risk recall, respectively. The above results show that FA-LSTFormer not only leads in algorithm performance, but also translates into lower decision costs, longer warning lead times, and auditable alerts.
Our works still have some limitations, which are also our future research plans: (1) The study sample covers only A-share manufacturing listed companies, and the labels rely on the special treatment system. Future work will extend the method to other industries, markets, and finer-grained risk grading to test its robustness. (2) The model currently only utilizes structured financial indicators, and can integrate multiple heterogeneous sources of information such as annual report text, management discussions, public opinion, and macroeconomics in the future to further enhance the foresight of early warning. (3) Causal inference and uncertainty quantification can be introduced on the basis of RSHA and CIFL, so that early warning results can be explained while providing credibility intervals, thereby better serving the company's financial risk management and regulatory decision-making.
Data Availability Statement
Our dataset is collected from relevant data disclosed by Chinese listed companies, and we are willing to share the dataset after the paper is published.
Conflicts of Interest
The author declares no conflicts of interest.
Abbreviations
The following abbreviations are used in this manuscript:
| RSHA | Risk Sensitive Hierarchical Indicator Attention |
| CIAL | Class Imbalance Aware Loss |
References
- Altman, E. I. Financial ratios, discriminant analysis and the prediction of corporate bankruptcy. J. Financ. 1968, 23(4), 589–609. [Google Scholar] [CrossRef]
- Beaver, W. H. Financial ratios as predictors of failure. J. Account. Res. 1966, 4, 71–111. [Google Scholar] [CrossRef]
- Ohlson, J. A. Financial ratios and the probabilistic prediction of bankruptcy. J. Account. Res. 1980, 18(1), 109–131. [Google Scholar] [CrossRef]
- Joshi, S. Predictive analytics in finance: How deep learning enhances stress testing. Preprints.org 2025, 2025030738. [Google Scholar] [CrossRef]
- Elhoseny, M.; Metawa, N.; Sztano, G.; El-hasnony, I. M. Deep learning-based model for financial distress prediction. Ann. Oper. Res. 2025, 345, 885–907. [Google Scholar] [CrossRef] [PubMed]
- Liu, S. LTR-Net: A deep learning-based approach for financial data prediction and risk evaluation in enterprises. PLoS ONE 2025, 20(8), e0328013. [Google Scholar] [CrossRef] [PubMed]
- Wang, C.; Gong, P.; Li, J.; Wang, Z.; Tian, J.; Johannssen, A. Corporate financial distress prediction with multiperiod annual report data: A fusion deep neural network model. PLoS ONE 2025, 20(9), e0333064. [Google Scholar] [CrossRef] [PubMed]
- Sun, J.; Li, X.; Zhou, J. Financial distress early warning for Chinese A-share listed firms with non-financial information. PLoS ONE 2025, 20(5), e0323737. [Google Scholar] [CrossRef] [PubMed]
- Lin, T.-Y.; Goyal, P.; Girshick, R.; He, K.; Dollar, P. Focal loss for dense object detection. In Proceedings of the IEEE International Conference on Computer Vision (ICCV), 2017; pp. 2999–3007. [Google Scholar] [CrossRef]
- Chawla, N. V.; Bowyer, K. W.; Hall, L. O.; Kegelmeyer, W. P. SMOTE: Synthetic minority over-sampling technique. J. Artif. Intell. Res. 2002, 16, 321–357. [Google Scholar] [CrossRef]
- Sun, J.; Fujita, H.; Zheng, Y.; Ai, W. Class-imbalanced dynamic financial distress prediction based on Adaboost-SVM ensemble combined with SMOTE and time weighting. Inf. Fusion 2021, 54, 128–144. [Google Scholar] [CrossRef]
- Zhou, H.; Zhang, S.; Peng, J.; Zhang, S.; Li, J.; Xiong, H.; Zhang, W. Informer: Beyond efficient transformer for long sequence time-series forecasting. Proc. AAAI Conf. Artif. Intell. 2021, 35(12), 11106–11115. [Google Scholar] [CrossRef]
- Lim, B.; Arik, S. O.; Loeff, N.; Pfister, T. Temporal fusion transformers for interpretable multi-horizon time series forecasting. Int. J. Forecast. 2021, 37(4), 1748–1764. [Google Scholar] [CrossRef]
- Wu, H.; Xu, J.; Wang, J.; Long, M. Autoformer: Decomposition transformers with auto-correlation for long-term series forecasting. Adv. Neural Inf. Process. Syst. 2021, 34, 22419–22430. [Google Scholar]
- Cheng, X. An attention embedded DUAL-LSTM method for financial risk early warning of the three new board-listed companies. PeerJ Comput. Sci. 9, e1271. [CrossRef] [PubMed]
- Mai, F.; Tian, S.; Lee, C.; Ma, L. Deep learning models for bankruptcy prediction using textual disclosures. Eur. J. Oper. Res. 2019, 274(2), 743–758. [Google Scholar] [CrossRef]
- Hosaka, T. Bankruptcy prediction using imaged financial ratios and convolutional neural networks. Expert Syst. With Appl. 2019, 117, 287–299. [Google Scholar] [CrossRef]
- Liu, S. LTR-Net: A deep learning-based approach for financial data prediction and risk evaluation in enterprises. PLoS ONE 2025, 20(8), e0328013. [Google Scholar] [CrossRef] [PubMed]
- Che, W.; Wang, Z. Predicting financial distress using multimodal data: An attentive and regularized deep learning method. Inf. Process. Manag. 2024, 61(4), 103703. [Google Scholar] [CrossRef]
- Mohamed, A.; Mohamed, M. S. Deep learning-based financial risk early warning model for listed companies: A multi-dimensional analysis approach. Expert Syst. With Appl. 2025, 283, 127331. [Google Scholar] [CrossRef]
- Yang, A. Big data-driven corporate financial forecasting and decision support: A study of CNN-LSTM machine learning models. Front. Appl. Math. Stat. 2025, 11, 1566078. [Google Scholar] [CrossRef]
- Gu, A.; Dao, T. Mamba: Linear-time sequence modeling with selective state spaces. In Proceedings of the Conference on Language Modeling (COLM), 2024; Available online: https://arxiv.org/abs/2312.00752.
- Ahamed, M. A.; Cheng, Q. TSCMamba: Mamba meets multi-view learning for time series classification. Inf. Fusion 2025, 120, 103079. [Google Scholar] [CrossRef] [PubMed]
- Mamba-hypergraph. A novel Mamba-hypergraph enhanced time-frequency fusion network for multivariate time series classification. Complex Intell. Syst. 2025, 11, Article 02016. [Google Scholar] [CrossRef]
- MambaSL. MambaSL: Exploring single-layer Mamba for time series classification. In Proceedings of the International Conference on Learning Representations (ICLR 2026).
Figure 1.
Our method framework.
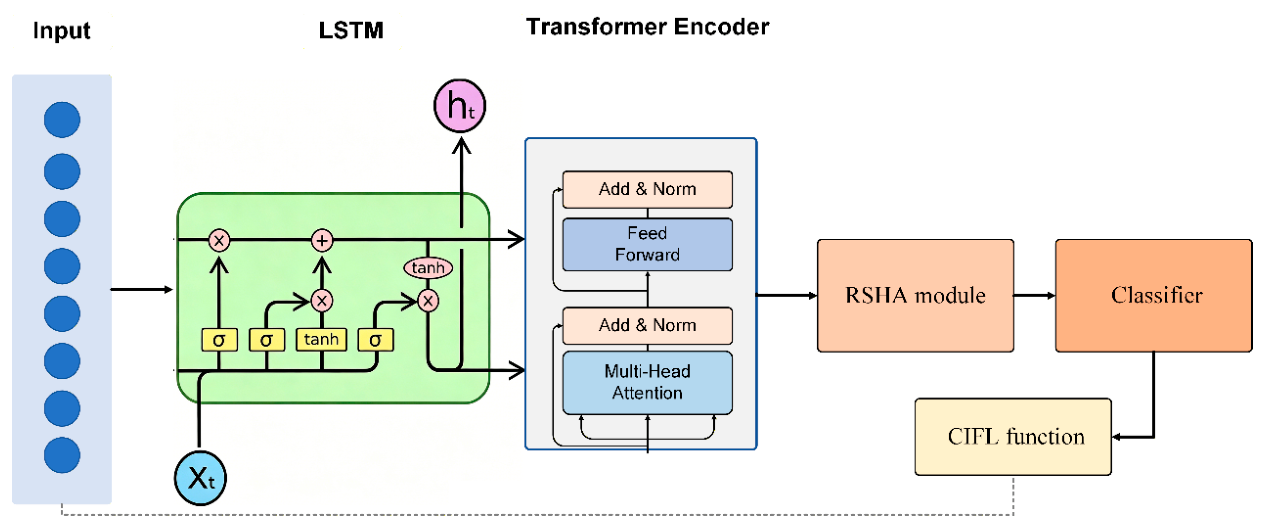
Figure 2.
ROC curves for three types of financial risk warnings.
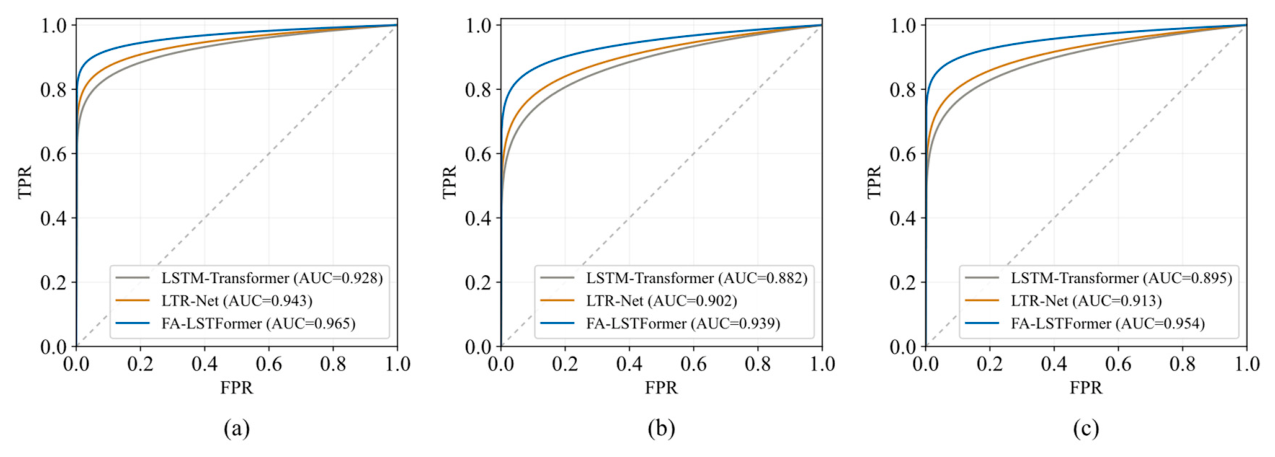
Figure 3.
Accuracy of risk warning under different forecast years.
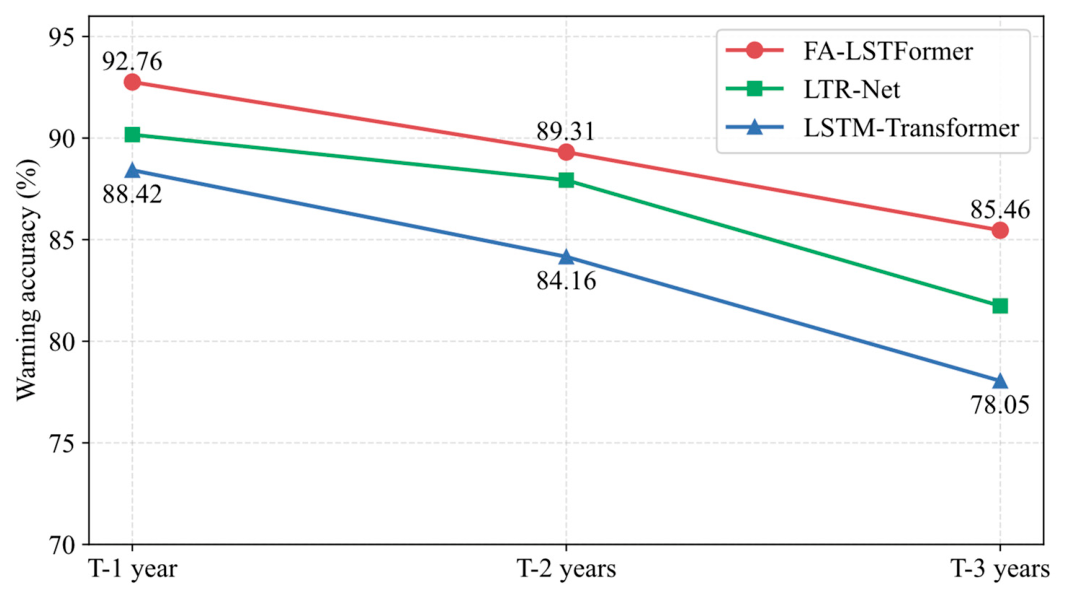
Figure 4.
Model attention weights for financial indicators under three types of risks.
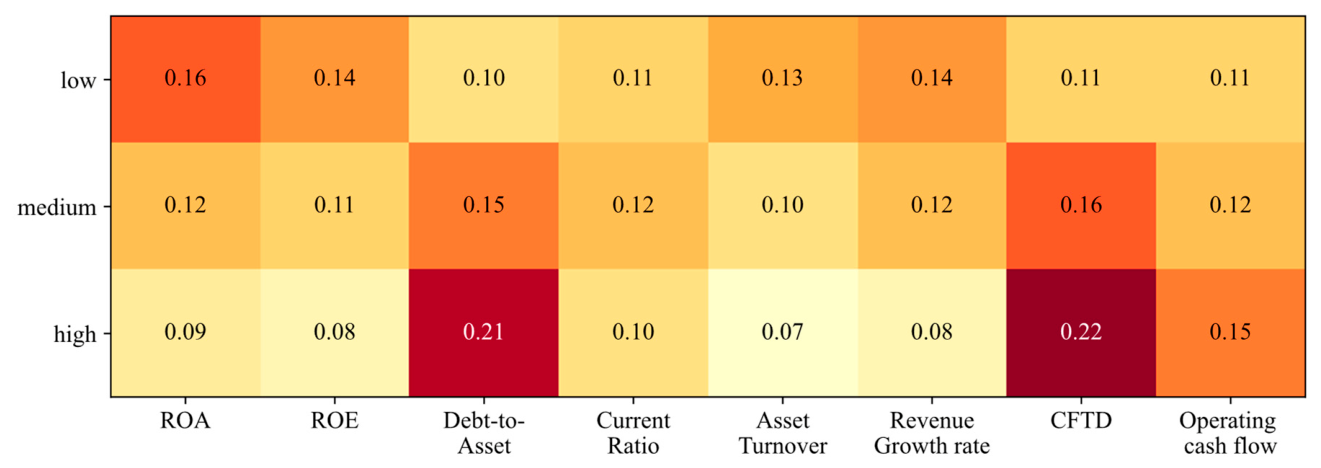
Figure 5.
Threshold sensitivity and robustness across company sizes.
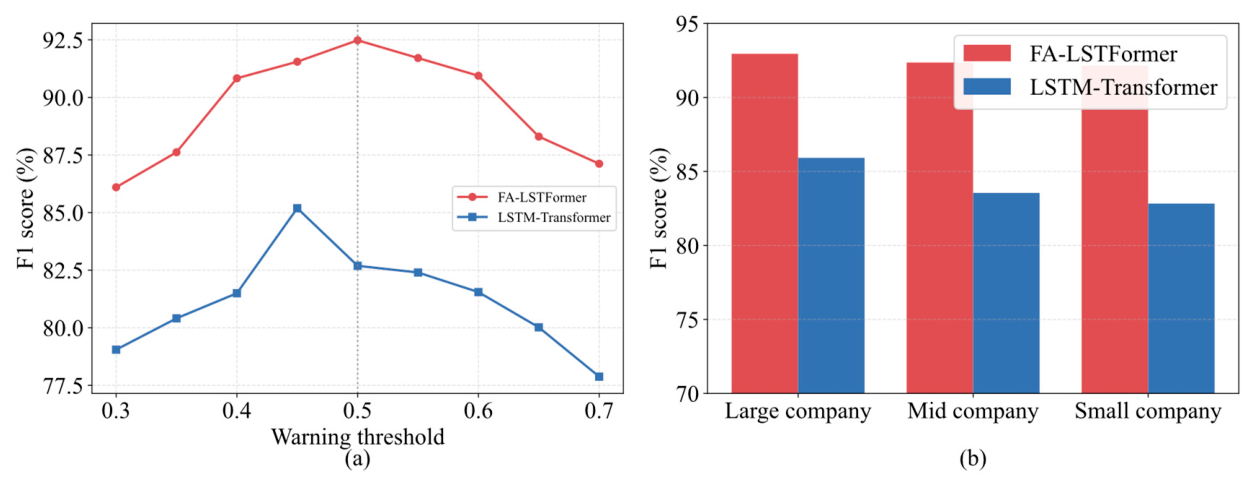

Table 1.
8 financial indicators and their meanings.
| Indicator | Evaluation dimension | Economic meaning |
|---|---|---|
| Return on assets (ROA) | Profitability | Profit generated per unit of total assets |
| Return on equity (ROE) | Profitability | Return delivered to shareholders |
| Debt-to-asset ratio | Solvency | Leverage level and long-term solvency pressure |
| Current ratio | Solvency | Short-term debt-paying ability |
| Total asset turnover | Operating efficiency | Efficiency of asset utilisation |
| Revenue growth rate | Growth | Momentum of business expansion |
| Operating cash flow to total debt ratio(CFTD) | Cash flow | Cash coverage of total debt |
| Operating cash flow | Cash flow | Quality of earnings measured in cash |
Table 2.
Performance of Different Methods in Financial Risk Warning for Companies
| Method | Accuracy | Precision | Recall | F1-score | AUC |
|---|---|---|---|---|---|
| LSTM | 82.14 | 78.65 | 76.92 | 77.77 | 85.43 |
| Transformer | 83.06 | 79.88 | 78.1 | 79.98 | 86.72 |
| TSCMamba | 84.79 | 82.05 | 83.47 | 82.75 | 89.94 |
| MambaSL | 85.33 | 82.71 | 81.26 | 81.97 | 90.51 |
| LSTM-Transformer | 88.91 | 85.34 | 85.05 | 85.19 | 90.18 |
| LTR-Net | 90.42 | 91.27 | 90.36 | 90.81 | 91.96 |
| FA-LSTFormer(Ours) | 92.76 | 93.13 | 91.84 | 92.48 | 95.27 |
Table 3.
Cost evaluation of misclassification errors for different methods.
| Method | Error I | Error II | Cost |
| TSCMamba | 18.62 | 23.08 | 134.02 |
| MambaSL | 17.95 | 21.9 | 127.45 |
| LSTM-Transformer | 15.41 | 17.95 | 105.16 |
| LTR-Net | 13.27 | 15.64 | 91.47 |
| FA-LSTFormer(Ours) | 11.08 | 9.82 | 60.18 |
Table 4.
Case analysis of three struggling companies
| Case | Top financial indicators | Risk of Disclosure |
| Company A | Debt-to-Assets Ratio,total liabilities,Current ratio | Liquidity stress driven by excessive leverage |
| Company B | total liabilities,ROA,OCF per share | Persistent operating cash flow deficit |
| Company C | Debt-to-assets ,atio, Revenue growth rate, ROA | Revenue collapse under high leverage pressure |
Table 5.
The ablation results of the two components of FA-LSTFormer.
| RSHA | CIFL | Accuracy | F1-score | AUC | High-Risk Recall |
| 88.91 | 85.19 | 90.18 | 79.34 | ||
| √ | 90.34 | 87.12 | 92.41 | 83.07 | |
| √ | 89.87 | 86.58 | 92.05 | 86.95 | |
| √ | √ | 92.76 | 92.48 | 95.27 | 95.40 |
Table 6.
Warning results of different loss functions for high-risk companies.
| Loss function | Precision | Recall | F1 score | Macro F1 |
| Cross-Entropy | 85.42 | 79.34 | 82.27 | 85.19 |
| Weighted Cross-Entropy | 83.18 | 84.56 | 83.86 | 86.43 |
| Focal Loss | 86.07 | 87.73 | 86.89 | 88.71 |
| CIFL(Ours) | 92.95 | 91.84 | 91.05 | 92.48 |
Disclaimer/Publisher’s Note: The statements, opinions and data contained in all publications are solely those of the individual author(s) and contributor(s) and not of MDPI and/or the editor(s). MDPI and/or the editor(s) disclaim responsibility for any injury to people or property resulting from any ideas, methods, instructions or products referred to in the content. |
© 2026 by the authors. Licensee MDPI, Basel, Switzerland. This article is an open access article distributed under the terms and conditions of the Creative Commons Attribution (CC BY) license (http://creativecommons.org/licenses/by/4.0/).
Copyright: This open access article is published under a Creative Commons CC BY 4.0 license, which permit the free download, distribution, and reuse, provided that the author and preprint are cited in any reuse.


