

Submitted:
22 June 2026
Posted:
23 June 2026
You are already at the latest version
Abstract
This study evaluated the construct validity of the Child Assessment and Education System (CAES) in Hong Kong early intervention services using a cross-sectional Multitrait–Multimethod (MTMM) framework. Reliable CAES scores have been previously established, but validity evidence for score interpretation across methods and objective indicators remained limited. CAES domain scores (Gross Motor, Fine Motor, Social, Cognition, Self-regulation, Language) were compared with theoretically related questionnaire benchmarks from multiple validated instruments administered to 336 children. Objective multi-method cross-validation was further conducted in a randomly selected subsample of 180 children using eye-tracking attention metrics, AI-assisted dyadic interaction coding (MEACI), and salivary cortisol. Results indicated that CAES domains show meaningful validity-relevant structure: convergent and discriminant validity patterns were supported through selective trait–method associations and improved measurement model fit. However, cross-validation with objective indicators was domain-dependent. Among emotion components, CAES Emotion Expression (EE) aligned significantly with salivary cortisol, whereas Emotion Identification (EI) and Emotion Regulation (ER) showed no meaningful correspondence with the eye-tracking metrics used. Overall, CAES demonstrates construct validity for intervention profiling and provides clear directions for refining objective mappings and future longitudinal evaluation.
Keywords:
Child Assessment and Education System (CAES)
; multitrait–multimethod (MTMM)
; early intervention (construct validity)
Introduction
The Child Assessment and Education System (CAES) is a widely used standardized instrument in Hong Kong’s early intervention services for profiling the developmental needs of young children with special needs. Prior psychometric research has demonstrated that CAES can yield reliable scores for children aged 0–6, including evidence of high person reliability (i.e., score stability and consistency). However, reliability alone is insufficient to justify the use of an assessment system for real-world early intervention decision-making. In validity terms, stable scores may still fail to represent the developmental constructs and intervention-relevant domains that the tool is intended to measure. Thus, the key next step is to establish construct validity: whether CAES scores reflect the theoretical structure of children’s development rather than artifacts driven by measurement format, informant perspectives, or context-specific responding (Messick, 1995).
This study is motivated by empirical gaps that can arise in prior psychometric evaluations of CAES or similar instruments. Validity evidence is often derived from unvarying, cross-sectional, and single-method analyses. While such designs are informative for estimating internal consistency and some aspects of scale functioning, they provide limited leverage for determining whether observed associations represent true trait relations or instead reflect shared variance due to common reporting pathways. In multi-informant assessment contexts—such as early intervention—children’s functioning is typically understood through multiple informants (e.g., parents and teachers), each contributing distinct observations shaped by their role, access to behavior across settings, and interpretive biases. Consequently, construct validity requires testing whether CAES domains show a theoretically meaningful pattern of relationships across different sources and methods (Campbell & Fiske, 1959; Messick, 1995).
Testing construct validity is especially consequential for early intervention practice. CAES results are used to inform intervention goals and prioritize areas of need. If CAES domains have weak construct validity, practitioners may misinterpret children’s profiles, leading to misaligned intervention targets and reduced coherence across professionals and families. Therefore, validation evidence must address not only whether CAES scores are consistent, but also whether the domain structure supports defensible interpretation for intervention planning and monitoring (Messick, 1995). In this regard, early intervention contexts necessitate a design that can separate trait variance from method variance—an issue that is directly addressed by Multitrait–Multimethod (MTMM) approaches.
MTMM is particularly appropriate for the present study because it provides an established framework for evaluating construct validity through the expected pattern of convergent and discriminant relations across traits and methods. The classic MTMM logic proposes that measures of the same (or closely related) traits assessed via different methods should correlate more strongly (convergent validity), whereas measures of different traits—whether assessed via the same or different methods—should show weaker associations (discriminant validity). This pattern-based evidence is stronger than reliance on any single coefficient because it directly tests whether the empirical association structure matches the intended construct representation (Campbell & Fiske, 1959). Contemporary MTMM research further recommends confirmatory modeling strategies that specify trait–method expectations a priori and evaluate whether the hypothesized structure fits the observed covariance patterns, thereby yielding clearer, model-based validity conclusions (Marsh & Hocevar, 1985; van de Schoot et al., 2017).
Consistent with contemporary validity theory, the present study also extends beyond questionnaire-to-questionnaire comparisons by incorporating objective behavioral and physiological indicators. Validity is not a property of a test in isolation; rather, it concerns whether interpretations of scores are supported by evidence relevant to the intended use. Messick’s unified validity framework emphasizes that multiple sources of evidence are needed to support score meaning, particularly when the construct is expected to manifest in observable behavior and underlying processes, not solely in rating tendencies (Messick, 1995). For early intervention, this implies that CAES domains—especially those tied to self-regulation and social–emotional functioning—should be reflected in intervention-relevant criteria that can be measured through controlled observation and biomarkers. Multi-trait objective indicators therefore strengthen the construct coverage argument by testing whether CAES domains correspond to measurable behavioral and emotional processes beyond informant-report effects (van de Schoot et al., 2017).
Accordingly, this study implements an MTMM validation design that is tailored to the CAES domain structure and the multi-source nature of early intervention assessment. By examining CAES domain scores in relation to theoretically related constructs assessed through multiple validated parent- and teacher-report instruments, and by cross-validating CAES against objective, multi-dimensional behavioral–physiological indicators, the study aims to clarify whether CAES captures true developmental constructs rather than measurement-method variance. This design directly addresses the limitations of prior psychometric evaluations that relied predominantly on cross-sectional and single-method evidence, and it provides a more defensible foundation for CAES-based decision-making in Hong Kong early intervention practice (Campbell & Fiske, 1959; Messick, 1995; van de Schoot et al., 2017).
Finally, the present MTMM approach contributes to ongoing psychometric development for CAES by aligning validation activities with the practical demands of intervention planning. Because early intervention decisions depend on accurate and interpretable domain profiles, validity evidence must be evaluated through patterns of convergent/discriminant relations and through cross-method representation of the underlying constructs. In doing so, this study strengthens the overall measurement argument for CAES by testing whether its scores are meaningful in ways that are relevant to both theoretical expectations and real-world assessment use (Messick, 1995; van de Schoot et al., 2017).
To address the empirical gaps identified in previous psychometric evaluations of the Child Assessment and Education System (CAES)—specifically the reliance on unvarying, cross-sectional, and single-method analyses—this study implements a robust Multitrait-Multimethod (MTMM) validation framework. The primary objectives are as follows:
-
Test convergent, discriminant, and construct validity through MM across informants and trait domains:To evaluate whether CAES subdomains (Gross Motor, Fine Motor, Social, Cognition, Self-regulation, and Language) show the expected MTMM pattern—stronger associations with conceptually related constructs measured by multiple validated parent- and teacher-report instruments (convergent validity), and weaker associations with conceptually distinct constructs (discriminant validity)—thereby separating true trait variance from variance attributable to reporting methods or informant perspectives.
-
Cross-validate CAES with multi-dimensional behavioral–physiological indicators (MT):To examine whether the latent behavioral and emotional aspects reflected in CAES (particularly self-regulation and social–emotional functioning) align with objective, intervention-relevant criteria obtained through controlled empirical observation and biomarkers—namely eye-tracking–based attention metrics for emotion-related processing, salivary cortisol for physiological stress regulation, and AI-assisted coding of dyadic social interaction quality—thereby verifying that CAES constructs are represented beyond questionnaire/report effects.
Research Questions
Do CAES domain scores show the expected convergent, discriminant, and construct validity patterns when compared with theoretically related constructs measured by multiple methods (e.g., Speech Development Questionnaire, Preschool Play Behavior, Penn Interactive Peer Play Scale, Child Development Checklist (EdUHK), and Developmental Screening Checklist for Children aged 3 to 6)?
To what extent are CAES domains reflected in objective, multi-trait behavioral–physiological indicators, such as eye-tracking attention metrics, salivary cortisol, and AI-assisted coding of dyadic social interaction quality?
Method
Participants and Setting
Data were collected from a coordinated network of 12 service sites across Hong Kong between January 3 and January 27, 2025. Families were recruited through participating service centers. A total of 339 parents provided written informed consent for their children to participate. Children younger than 12 months were excluded from the secondary objective testing component because of developmental considerations affecting the feasibility and interpretability of infant ocular and physiological markers. After exclusions (n = 3), the final eligible sample comprised 336 children. Parents and caregivers of all 336 eligible children completed a full questionnaire battery. From these participants, 180 children were randomly selected to complete the secondary objective cross-validation procedures involving biofeedback- and physiology-related measures.
Study Design
This study used a cross-sectional Multi-Trait Multi-Method (MTMM) validation design to evaluate the construct validity of the Child Assessment and Education System (CAES). In the MTMM framework, validity evidence is evaluated by examining whether the pattern of relationships among measures differs appropriately as a function of (a) traits (i.e., developmental domains) and (b) methods (i.e., measurement procedures or sources). Specifically, the design tests whether CAES domain scores demonstrate (a) convergent validity through stronger associations with theoretically related constructs measured using different instruments and methods, and (b) discriminant validity through weaker associations with theoretically distinct constructs, even when measured using the same method source.
Measures
Children Assessment and Education System (CAES)
CAES served as the primary assessment instrument and provided domain scores across six developmental subdomains: Gross Motor, Fine Motor, Social, Cognition, Self-regulation, and Language.
Questionnaires (Concurrent / Multi-Method Validity Benchmarks)
To provide comparative construct anchors, CAES domain scores were examined against multiple standardized questionnaires and screening checklists administered as part of the full questionnaire battery. The instruments were selected to represent overlapping or theoretically related constructs relevant to CAES domains.
- Speech Development Questionnaire: a standardized parent-reported screening instrument designed to identify early language delay using a milestone-based structure across age cohorts. The instrument assesses receptive comprehension and expressive competence (e.g., vocalizations, gestural communication, early phrase production) using binary response options (“can”/”cannot”) (Huang, 2009).
- Preschool Play Behavior Scale (PPBS): a teacher-rated 16-item questionnaire assessing social withdrawal in nonsocial play settings. The measure includes three subscales corresponding to nonsocial play behaviors (reticent behavior, solitary-passive behavior, solitary-active behavior). Responses are provided on a 5-point Likert-type scale reflecting frequency (1 = never to 5 = very often) (Leung, 2017).
- Penn Interactive Peer Play Scale (PIPPS; Hong Kong version): a teacher- or parent-report instrument assessing peer-play behavior in classroom or home settings. The Hong Kong adaptation includes 22 items and retains the original factor structure, yielding scales reflecting play interaction, play disruption, and play disconnection. Response options include never, seldom, often, and always (Leung, 2015).
- Child Development Checklist (EdUHK; 兒童發展評量表): a Hong Kong Institute of Education-developed assessment tool for children aged 3 to 6 that tracks development across five domains (Cognitive, Language, Physical, Affective & Social, and Aesthetic & Cultural). Development is assessed using a three-stage developmental scale (兒童發展評量表研究小組 & 香港教育學院, 2007).
- Developmental Screening Checklist for Children Aged 0 to 6 (零歲至六歲兒童發展篩檢量表): a standardized screening instrument designed to detect developmental delays and special educational needs in young children. It assesses six domains (cognitive, language, gross motor, fine motor, self-care, and social functioning) (黃惠玲, 2000).
Biofeedback and Behavioral–Physiological Indicators (Multi-Trait / Cross-Validation Subsample)
The objective multi-method validation component was administered to a randomly selected subsample (n = 180). Three objective procedures were conducted, each intended to capture intervention-relevant behavioral and physiological aspects associated with CAES constructs.
- Eye-tracking assessment: children completed a 15-minute session to assess visual attention and emotional recognition. This procedure was used to provide objective indices relevant to emotion-related processing expected to relate to CAES social-domain conceptualizations. Across the 12 sites, 91 valid eye-tracking datasets were obtained.
- Structured video observation (MEACI; AI-assisted analysis): one-on-one parent–child sessions were video recorded for approximately 20 minutes. Videos were subsequently analyzed using the AI-assisted Measurement of Empathy in Adult–Child Interaction (MEACI) scale to evaluate social interaction quality and the child’s responsiveness during the testing context. Across the 12 sites, 164 valid MEACI datasets were obtained.
- Salivary cortisol (physiological stress marker): salivary samples were collected using non-invasive test strips to quantify cortisol levels as a biological baseline indicative of emotional regulation during the assessment. A standardized non-invasive collection protocol was implemented across service centers. The exact collection time for each sample was recorded, samples were stored at 0–4 °C, and samples were transported to the laboratory for analysis within two days. Across the 12 sites, 153 valid cortisol datasets were obtained.
Procedure
Following recruitment, parents completed the CAES and the supplementary questionnaire battery as part of the full questionnaire component (N = 336). For the objective cross-validation subsample (N = 180), children underwent the three objective procedures (eye-tracking assessment, structured video observation with MEACI AI-assisted coding, and salivary cortisol sampling) at the participating service centers. Data completeness varied by procedure, resulting in differing numbers of valid datasets across eye-tracking (n = 91), MEACI (n = 164), and cortisol (n = 153).
Data Analytic Approach (MTMM Framework Overview)
Construct validity evidence was examined using the MTMM framework by evaluating the relationship patterns between CAES domain scores and (a) theoretically related and theoretically distinct questionnaire measures and (b) objectively measured indicators (eye-tracking, AI-assisted observational coding, and cortisol). Analyses were designed to test convergent validity (stronger associations for related traits assessed via different instruments/methods) and discriminant validity (weaker associations for distinct traits).
Results
Assessing Convergent, Discriminant, and Construct Validity of CAES Domain Scores Using Multiple Methods
Multiple Methods (MM) analysis was used to examine the seven factors of CAES and different questionnaires: Speech Development Questionnaire (Language), Child Development Checklist EdUHK (Cognition, Self-regulation, Social), Developmental Screening Checklist for children aged 0 to 6 (Cognition, Gross Motor, Fine Motor), Preschool Play Behavior Scale (PPBS) (Play), and Penn Interactive Peer Play Scale (PIPPS) (Play).
GM, FM, SO, CO, SE, LA and PL were assessed by CAES and questionnaires. The Multi-Methods (MM) approach was used to assess the discriminant and convergent validity of the measures. Based on the results of the correlation analysis, the MT model 1 was removed, and the SE, LA, and PL were deleted.

Table 1.
Trait and Method Correlations for the MTMM model 1 (Correlated Traits-Correlated Methods).
| Method 1(CAES) | Method 2 (QUES) | |||||||||||||||
|---|---|---|---|---|---|---|---|---|---|---|---|---|---|---|---|---|
| GM | FM | SO | CO | SE | LA | PL | GM (DSC) | FM (DSC) |
SO (CDC) | CO (CDC,DSC) | SE (CDC) |
LA (SDQ) |
PL1 (PPBS) |
PL2 (PIPPS) |
||
| Method 1 (CAES) |
GM | 1 | ||||||||||||||
| FM | .566** | 1 | ||||||||||||||
| SO | .399** | .437** | 1 | |||||||||||||
| CO | .564** | .765** | .595** | 1 | ||||||||||||
| SE | 0.124 | .239** | .219** | .190* | 1 | |||||||||||
| LA | .399** | .437** | 1.000** | .595** | .219** | 1 | ||||||||||
| PL | .329** | .393** | .436** | .500** | 0.105 | .436** | 1 | |||||||||
| Method 2 (QUES) |
GM (DSC) |
.472** | 1 | |||||||||||||
| FM (DSC) |
.521** | .783** | 1 | |||||||||||||
| SO (CDC) |
.463** | .365** | .448** | 1 | ||||||||||||
| CO (CDC,DSC) | .512** | .682** | .757** | .419** | 1 | |||||||||||
| SE (CDC) |
0.065 | .713** | .787** | .737** | .698** | 1 | ||||||||||
| LA (SDQ) |
-.385** | -.243** | -.336** | -.247** | -.442** | -.378** | 1 | |||||||||
| PL1 (PPBS) |
.206** | .327** | .404** | .291** | .369** | .443** | -.228** | 1 | ||||||||
| PL2 (PIPPS) |
-.200** | .156* | 0.123 | -0.001 | 0.001 | -0.001 | -0.027 | 0.095 | 1 | |||||||
Note 1. ** p<0.01, * p<0.05, GM=Gross Motor, FM=Fine Motor, SO=Social, CO=Cognition, SE=Self-regulation, LA=Language, PL=Play, PL1=Play (PPBS), PL2=Paly (PIPPS) (Sample size:168). Note 2. SDC=Speech Development Questionnaire, PPBS=Preschool Play Behavior Scale, PIPPS=Penn Interactive Peer Play Scale, CDC=Child Development Checklist EdUHK, DSC=Developmental Screening Checklist for children aged 0 to 6.
In general, GM, FM, SO, CO, SE, LA, and PL measured by the same method all correlated significantly. Moreover, only GM, FM, SO, and CO correlated significantly when the seven factors were measured by different methods.
Figure 1.
MTMM model 1 (Correlated Traits-Correlated Methods). Note. GM=Gross Motor, FM=Fine Motor, SO=Social, CO=Cognition, SE=Self-regulation, LA=Language, PL=Play, PL1=Play (PPBS), PL2=Paly (PIPPS).
Figure 1.
MTMM model 1 (Correlated Traits-Correlated Methods). Note. GM=Gross Motor, FM=Fine Motor, SO=Social, CO=Cognition, SE=Self-regulation, LA=Language, PL=Play, PL1=Play (PPBS), PL2=Paly (PIPPS).
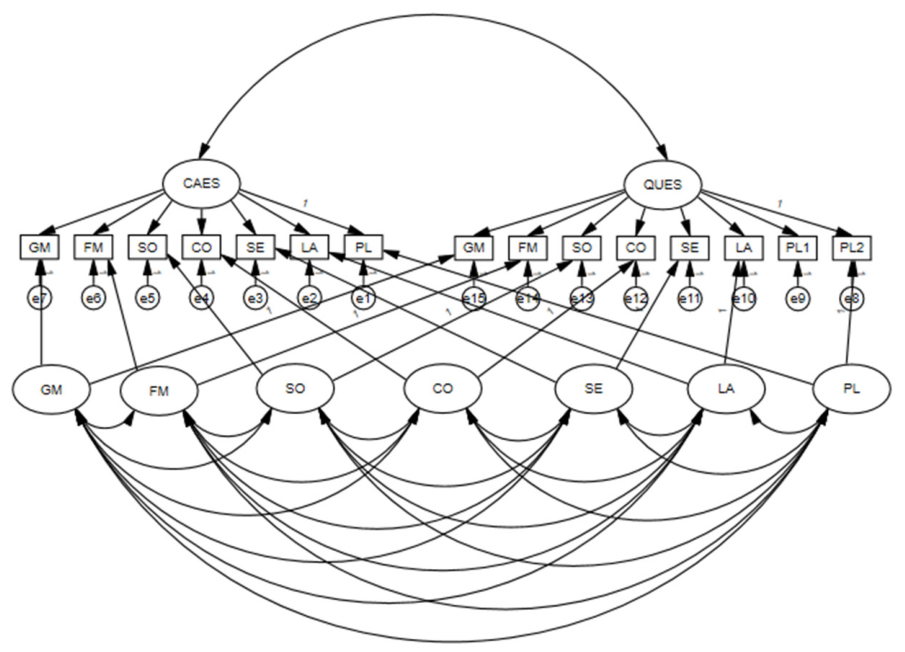
GM, FM, SO, CO, SE, LA, PL (PL1, PL2) were assessed by CAES and questionnaires. The MTMM (Multi-trait Multi-Method) approach was used to assess the discriminant and convergent validity of the measures. Based on the results of the correlation analysis, the MT model 1 was removed, and the SE, LA, and PL2 were deleted.
In general, GM, FM, SO, CO, SE, LA, and PL measured by the same method all correlated significantly. Moreover, only GM, FM, SO, CO, PL(PL1) correlated positive significantly when the factors were measured by different methods.
Figure 2.
MM model 1 (Correlated Methods). Note. GM=Gross Motor, FM=Fine Motor, SO=Social, CO=Cognition, PL=Play, PL1=Play (PPBS).
Figure 2.
MM model 1 (Correlated Methods). Note. GM=Gross Motor, FM=Fine Motor, SO=Social, CO=Cognition, PL=Play, PL1=Play (PPBS).
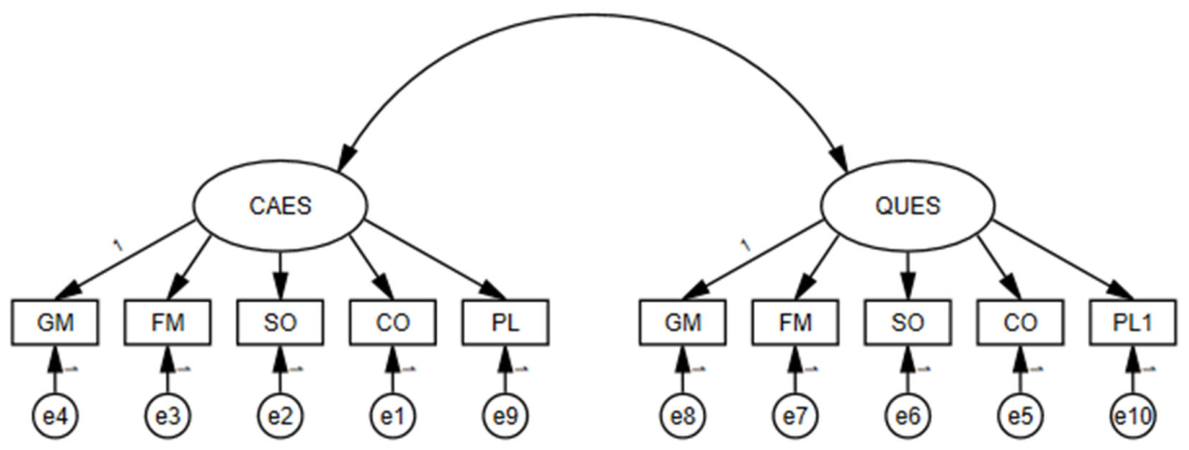
Table 2.
Model fit indices of MM model 1 (Correlated Methods).
| χ² | df | χ²/df | TLI | CFI | GFI | AGFI | RMSEA | SRMR | |
|---|---|---|---|---|---|---|---|---|---|
| Acceptable fit threshold | >0.90 | >0.90 | >0.90 | >0.90 | <0.08 | <0.08 | |||
| Structural model | 109.399 | 34 | 3.818 | 0.897 | 0.914 | 0.901 | 0.842 | 0.075 | 0.055 |
Table 3.
Convergent validity: Method Loadings for the MM Model 1 (Correlated Methods).
| β | S.E. | T | ||
|---|---|---|---|---|
| Method 1 (CAES) | ||||
| GM | 0.660 | |||
| FM | 0.822 | 0.101 | 9.032*** | |
| SO | 0.646 | 0.176 | 7.395*** | |
| CO | 0.898 | 0.060 | 9.526*** | |
| PL | 0.54 | 0.467 | 6.318*** | |
| Method 2 (QUES) | ||||
| GM | 0.823 | |||
| FM | 0.926 | 0.142 | 14.410*** | |
| SO | 0.586 | 0.349 | 7.969*** | |
| CO | 0.823 | 0.321 | 12.451*** | |
| PL1 | 0.460 | 0.108 | 6.030*** |
Note. *** p<0.001.
Conclusion
To establish the validity of the measurement model, this study employed a multi-trait multi-method (MTMM) approach. The MTMM framework is particularly suitable for disentangling trait variance (true differences among constructs) from method variance (systematic bias due to measurement source or procedure). Accordingly, evidence was collected in three dimensions: (i) convergent validity, assessed by the degree to which indicators measuring the same construct relate strongly when assessed using the same method; (ii) discriminant validity, assessed by whether different constructs remain empirically distinguishable—especially when assessed using different methods; and (iii) construct validity, assessed through the overall adequacy of the proposed multi-method measurement structure using model fit indices.
Within this framework, trait indicators were measured using two methods: Method 1 (CAES) and Method 2 (QUES). The MTMM correlation pattern (Table 1), the measurement/method loadings for the MM model (Table 3), and the goodness-of-fit statistics (Table 2) were integrated to provide a comprehensive validity assessment.
Convergent Validity
Convergent validity was examined using the multi-trait multi-method (MTMM) framework to determine whether measures targeting the same underlying constructs show consistent relationships across indicators using the same method. In the trait–trait correlations presented under Method 1 (CAES) and Method 2 (QUES) (Table 1), the retained constructs (GM, FM, SO, CO, SE, LA, and PL) exhibited predominantly significant positive associations when measured via the same method, indicating that constructs intended to be related (e.g., gross and fine motor; cognition and self-regulation) are measured in a coherent manner within a method condition.
In addition, convergent validity was supported by the measurement (method-loading) results reported in the convergent validity analysis of the MM model (Table 3). The standardized/estimated method loadings linking the retained traits to their corresponding method measurement models were generally substantive and statistically significant. Specifically, under Method 1 (CAES), GM (β = 0.660), FM (β = 0.822; t = 9.032***), SO (β = 0.646; t = 7.395***), CO (β = 0.898; t = 9.526***), and PL (β = 0.54; t = 6.318***) demonstrated significant convergence. Under Method 2 (QUES), GM (β = 0.823), FM (β = 0.926; t = 14.410***), SO (β = 0.586; t = 7.969***), CO (β = 0.823; t = 12.451***), and PL1 (β = 0.460; t = 6.030***) were also significant. Taken together, the consistent and significant method loadings provide evidence that the indicators converge on the intended constructs, supporting convergent validity.
Discriminant Validity
Discriminant validity was evaluated through the MTMM logic that different traits should not be indistinguishable once the method is controlled, and trait relationships across methods should be selective rather than uniformly strong. The correlation pattern in Table 1 indicated that, when traits were measured using different methods, only a limited set of constructs demonstrated significant positive associations (as summarized in the key findings), whereas other cross-method associations were weak, non-significant, or inconsistent. Such selectivity is consistent with the notion that the retained constructs reflect distinguishable dimensions rather than a single common factor.
Furthermore, the refinement of the MTMM model strengthens discriminant validity evidence. Specifically, based on the MTMM results, the MT model 1 was removed, and the constructs SE, LA, and PL2 were deleted from the final model. This model pruning is indicative that these constructs did not exhibit the expected trait–method separability and/or discriminative behavior in the presence of method effects, whereas the remaining constructs formed a clearer and more distinct measurement structure. Accordingly, the retained trait–method configuration demonstrates improved discriminant functioning, supporting discriminant validity.
Construct Validity
Construct validity was evaluated primarily through model adequacy in an MTMM (multitrait–multimethod) framework, using goodness-of-fit statistics to assess how well the proposed measurement structure reproduced the observed covariance patterns. As shown in Table 2, the structural measurement solution fit the data acceptably (χ² = 109.399, df = 34; χ²/df = 3.818; TLI = 0.897; CFI = 0.914; GFI = 0.901; AGFI = 0.821; RMSEA = 0.075; SRMR = 0.055). In particular, CFI values above .90 together with RMSEA and SRMR values below .08 indicate that the latent constructs and their method-specific measurement relations were generally consistent with the data. These results support the claim that the measurement model reflects the intended constructs rather than failing to capture their underlying structure.
Further construct interpretation was supported by convergent evidence (Table 3) and a coherent trait–method correlation pattern (Table 1). Taken together, the combination of acceptable fit indices and theoretically interpretable trait–method loading patterns provides convergent validity evidence (significant same-method associations and meaningful method loadings) and reinforces construct validity within the MTMM logic.
Discriminant validity was strengthened by moving beyond overall model fit and examining whether distinct traits yield distinguishable measurement outcomes under the same methods. In this study, the same two methods (CAES and QUES) were applied to multiple theoretically different constructs (GM, FM, SO, CO, SE, LA, and PL). If method variance or a single underlying construct dominated, cross-method associations would be broadly strong and consistent across traits. Instead, only GM, FM, SO, CO, and PL (PL1) showed significant positive cross-method associations, whereas other trait combinations were weaker, non-significant, or inconsistent. Additionally, SE, LA, and PL2 were deleted during model refinement. This selective and trait-specific pattern indicates that constructs remain empirically differentiated rather than being interchangeable artifacts of method effects, thereby providing additional justification for discriminant validity.
Linking CAES Domains to Multi-Traits from Eye-Tracking Attention Metrics, Salivary Cortisol, and AI-Coded Dyadic Social Interaction Quality
The present study evaluates whether the developmental and behavioral domains assessed by CAES correspond to meaningful differences in children’s real-world functioning. Because CAES results can be shaped by measurement context and reporter perspective, validating the instrument requires evidence beyond associations among self/observer ratings. Therefore, this study tests whether CAES domains are reflected in objective, multi-trait indicators of children’s functioning.
Specifically, CAES domains are linked to three complementary forms of objective measurement: (a) eye-tracking attention metrics, (b) salivary cortisol (stress physiology), and (c) AI-assisted coding of dyadic social interaction quality. These indicators were chosen to capture theoretically related but distinct processes underlying attention, stress regulation/reactivity, and social functioning. If CAES truly measures distinct constructs, its domains should show selective, not uniform, relations to these objective indicators.
The study is guided by MTMM (multi-trait multi-method) logic. Within this framework, convergent validity is supported when measures intended to represent the same construct correlate strongly, whereas discriminant validity is supported when different constructs remain empirically distinguishable across methods. Applying this logic, the study examines whether CAES domains (e.g., GM, FM, SO, CO, SE, LA, PL) show trait-specific patterns across objective behavioral–physiological measures. For example, eye-tracking indicators should align more strongly with attention-related CAES domains, cortisol with regulation/stress-related domains, and AI-coded interaction quality with social and interactive functioning domains.
Overall, connecting CAES to objective measures provides method-robust validity evidence and strengthens discriminant validity by showing that different CAES domains relate differently to distinct objective indicators, rather than reflecting a single undifferentiated method-driven factor.
Biochemical and Biofeedback measurements (MTMM): eye-tracking analysis, and Salivary Cortisol)
In order to examine the quality and meaning of the measurement results, this study adopted two complementary analytic strategies: an MTMM (multi-trait multi-method) approach and follow-up regression analyses. For the MTMM component, performance was assessed using two different methods—(1) a behavioral assessment based on CAES (from the Social Communication and Emotion sections, extracting factors such as EI/EE/ER) and (2) a more objective physiological/biochemical approach combining eye-tracking (for EI) and salivary cortisol (for EE and ER). The core logic of MTMM is that if the constructs are measured properly, trait scores should show selective associations across methods (rather than uniformly strong correlations driven by a single method factor). In other words, discriminant validity is supported when the study can distinguish theoretically different traits based on the observed cross-method correlation pattern and when the overall MTMM model shows acceptable fit.
After establishing the measurement structure, regression analyses (MEACI → CAES/Social Communication) were conducted to explore whether parental communication/empathy-related behaviors are associated with children’s social communication outcomes. Specifically, MEACI subscales—Communication of Acceptance (CoA), Allowing Child Self Direction (ACSD), Adult Involvement (AI), and Total Empathy (TE)—were treated as predictors of CAES Social Communication (SC). By estimating the direction and statistical significance of these relationships, the regression analyses provided additional evidence about the practical interpretability of the constructs (i.e., whether the empathy and parenting-related variables relate meaningfully to children’s SC performance), while also quantifying effect sizes through explained variance (R²).
This combined strategy therefore supports a clearer interpretation of the results: MTMM evaluates whether different traits can be measured distinctly across different assessment modalities, and regression analysis clarifies how parent-related constructs are linked to children’s social communication performance.
Table 4.
Trait and Method Correlations for the MTMM model 2 (Correlated Traits-Correlated Methods).
| Method 1 (CAES) | Method 2 (Eye tracking/ Cortisol) | ||||||
|---|---|---|---|---|---|---|---|
| EI | EE | ER | EI (Eye tracking) | EE (Cortisol) | ER (Cortisol) | ||
| Method 1 (CAES) | EI | 1 | |||||
| EE | -0.284 | 1 | |||||
| ER | 0.006 | .a | 1 | ||||
| Method 2 (Eye tracking/ Cortisol) | EI (Eye tracking) |
0.213 (SS:48) |
1 | ||||
| EE (Cortisol) |
-.571** (SS:20) |
0.369 | 1 | ||||
| ER (Cortisol) |
-0.154 (SS:126) |
0.165 | .a | 1 | |||
Note. ** p<0.01, SS=Sample size, EI=Emotion Identification, EE=Emotion Expression, ER=Emotion Regulation.
Figure 3.
MTMM model 2 (Correlated Traits-Correlated Methods). Note. EI=Emotion Identification, EE=Emotion Expression, ER=Emotion Regulation.
Figure 3.
MTMM model 2 (Correlated Traits-Correlated Methods). Note. EI=Emotion Identification, EE=Emotion Expression, ER=Emotion Regulation.
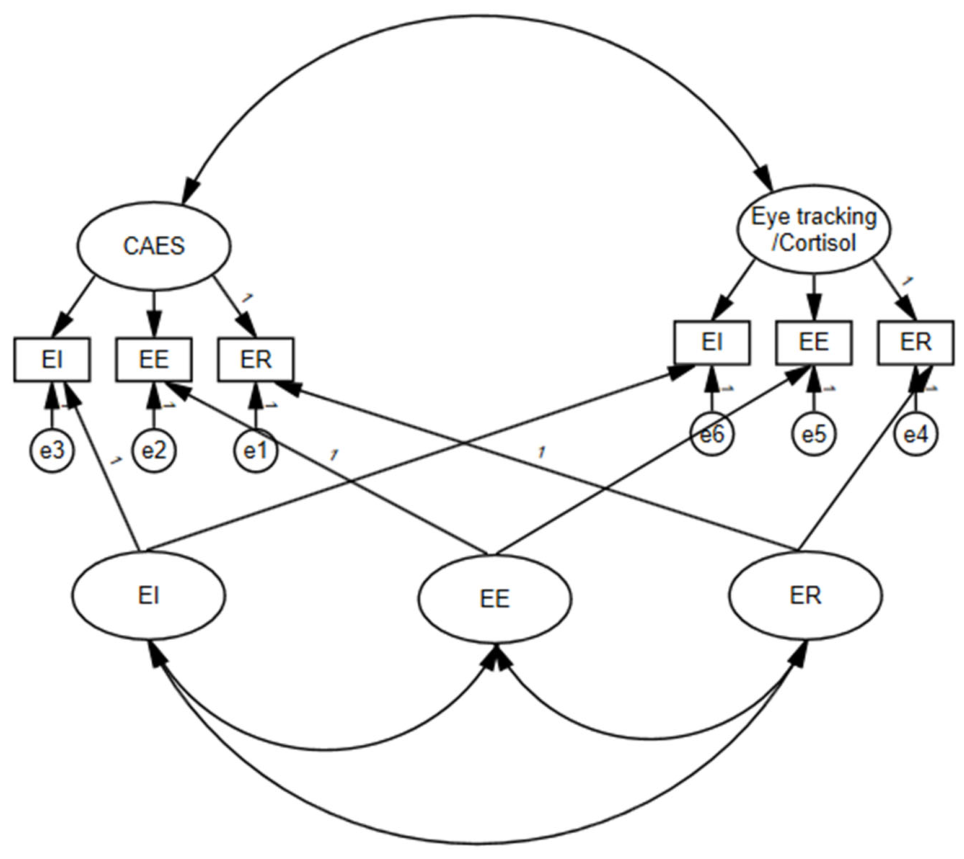
The “Emotional Performance” from the section of SO in the CAES was extracted. The “Emotional Performance” consists of EI, EE, and ER. Eye-tracking was used to assess EI. EE and ER were assessed by salivary cortisol. According to the results of the correlation analysis, only EE, as measured by CAES, and salivary cortisol showed a significant correlation.
There was no significant correlation between EI, EE, and ER measured by the same method. Only EE measured by cortisol and CAES correlated significantly.
In summary, Eye-tracking measures showed no statistically significant correlations with the three CAES factors (Emotion Identification, Emotion Expression, and Emotion Regulation). In contrast, salivary cortisol levels were significantly correlated with the CAES Emotion Expression factor.
Regression Analysis (MEACI)
Regression analysis is a statistical method used to examine the relationship between one dependent variable and one or more independent variables by fitting a mathematical model, typically estimating how changes in the predictors are associated with changes in the outcome.
REGRESSION ANALYSIS
Table 1.
Correlation coefficients between MEACI (Communication of Acceptance, Allowing Child Self Direction, Adult Involvement, Total Empathy) and CAES (Social Communication from the section of Social) (Sample size:128).
Table 1.
Correlation coefficients between MEACI (Communication of Acceptance, Allowing Child Self Direction, Adult Involvement, Total Empathy) and CAES (Social Communication from the section of Social) (Sample size:128).
| CoA | ACSD | AI | TE | SC | |
|---|---|---|---|---|---|
| CoA | 1 | ||||
| ACSD | .565** | 1 | |||
| AI | .478** | .490** | 1 | ||
| TE | .800** | .827** | .831** | 1 | |
| SC | -0.121 | -.195* | -0.150 | -.191* | 1 |
Note 1. CoA=Communication of Acceptance, ACSD=Allowing Child Self Direction, AI=Adult Involvement, TE=Total Empathy, SC=Social Communication. Note 2. According to the scoring direction of MEACI, a lower score indicates a better performance.
Table 2.
The model summary of the regression model (Model 1: IV=ACSD, DV=SC).
| R | R Square | Adjusted R Square | Std. Error of the Estimate | Durbin-Watson |
|---|---|---|---|---|
| 0.195 | 0.038 | 0.030 | 2.20259 | 1.464 |
Table 3.
ANOVA of Model 1.
| Sum of Squares | df | Mean Square | F | Sig. | |
|---|---|---|---|---|---|
| Regression | 24.065 | 1 | 24.065 | 4.960 | 0.028 |
| Residual | 611.275 | 126 | 4.851 | ||
| Total | 635.340 | 127 |
Table 4.
Coefficients of Model 1.
| Unstandardized Coefficients | Standardized Coefficients | t | Sig. | 95.0% Confidence Interval for B | |||
| B | Std. Error | Beta | Lower Bound | Upper Bound | |||
| (Constant) | 4.808 | 1.921 | 2.502 | 0.014 | 1.005 | 8.610 | |
| ACSD | -0.520 | 0.233 | -0.195 | -2.227 | 0.028 | -0.982 | -0.058 |
The results showed that a small but significant effect of ACSD on SC. 3% of variance was explained in SC. The regression equation is SC=4.808-0.520*ACSD.
There was a negative correlation between ACSD and SC, with a lower value of ACSD (better performance) and better performance in SC.
Table 5.
The model summary of the regression model (Model 2: IV=TE, DV=SC).
| R | R Square | Adjusted R Square | Std. Error of the Estimate | Durbin-Watson |
|---|---|---|---|---|
| 0.191 | 0.036 | 0.029 | 2.20437 | 1.420 |
Table 6.
ANOVA of Model 2.
| Sum of Squares | df | Mean Square | F | Sig. | |
|---|---|---|---|---|---|
| Regression | 23.077 | 1 | 23.077 | 4.749 | 0.031 |
| Residual | 612.263 | 126 | 4.859 | ||
| Total | 635.340 | 127 |
Table 7.
Coefficients of Model 2.
| Unstandardized Coefficients | Standardized Coefficients | t | Sig. | 95.0% Confidence Interval for B | |||
| B | Std. Error | Beta | Lower Bound | Upper Bound | |||
| (Constant) | 4.831 | 1.974 | 2.448 | 0.016 | 0.925 | 8.737 | |
| TE | -0.203 | 0.093 | -0.191 | -2.179 | 0.031 | -0.388 | -0.019 |
The results showed that a small but significant effect of TE on SC. 2.9% of variance was explained in SC. The regression equation is SC=4.831-0.203*TE. There was a negative correlation between TE and SC, with a lower value of TE (better performance) and better performance in SC.
In summary, the correlation among Communication of Acceptance, Allowing Child Self Direction, Adult Involvement, and Total Empathy showed strong significance. Based on the regression analysis, Allowing Child Self Direction domain of the MEACI and the Total Empathy showed a small but significant effect on Social Communication, indicating that the empathy level of parents was positively associated with the social communication level of children.
Discussion
Confirming the Discriminant, Convergent, and Construct Validity of CAES
The above results imply that CAES domain scores can be used with greater confidence for early intervention planning because, beyond reliability, the MTMM evaluation supports that CAES domains show meaningful validity-relevant structure. In particular, the evidence of convergent validity indicates that CAES domains are not merely internally consistent, but also relate appropriately to theoretically related constructs measured through the same method pathways, strengthening the interpretability of domain-based child profiles (Campbell & Fiske, 1959; Messick, 1995; van de Schoot et al., 2017).
In addition, the MTMM findings imply that CAES domains are sufficiently differentiated rather than reflecting a single undistinguished dimension. The observed discriminant validity—reflected in selective cross-method associations and improved model structure after refinement—suggests that CAES does not simply reproduce shared variance driven by reporting source or measurement format. Practically, this reduces the risk that intervention teams would target overly broad or potentially inaccurate needs based on measurement method effects, thereby supporting more precise identification of intervention priorities (Campbell & Fiske, 1959; van de Schoot et al., 2017).
Finally, the acceptable construct validity demonstrated by the overall MTMM model fit implies that the proposed measurement structure of CAES domains is empirically coherent and theoretically interpretable. This strengthens the argument that CAES domain scores represent the intended developmental constructs in a defensible way, supporting evidence-based decision-making, interprofessional communication, and future evaluation of intervention effectiveness (Messick, 1995; Marsh & Hocevar, 1985; van de Schoot et al., 2017).
Mapping CAES Domains onto Multiple Traits from Eye-Tracking, Salivary Cortisol, and AI-Assisted Dyadic Interaction Coding
Overall, the study suggests that CAES domains are only partially reflected in objective behavioral–physiological indicators. Using the MTMM logic, the results showed that cross-method correspondence was selective: among the CAES emotional performance components (EI, EE, ER), only Emotion Expression (EE) demonstrated a significant association with the physiological indicator (salivary cortisol). In contrast, Emotion Identification (EI) and Emotion Regulation (ER) did not show statistically meaningful alignment with the eye-tracking metrics used to represent attention-related processes. This pattern implies that some CAES subdomains may be more directly “observable” through biological stress/emotion expression signals, whereas other domains likely require different or more sensitive objective operationalizations to be captured reliably. This interpretation is consistent with the MTMM premise that convergent validity should be evidenced through selective cross-method associations, rather than uniformly strong correlations driven by a single method source (Campbell & Fiske, 1959; Eid et al., 2003).
In relation to eye-tracking, the lack of significant correlations between eye-tracking measures and CAES EI/ER suggests that the current eye-tracking indicators (as operationalized in this study) may not correspond closely to the cognitive/behavioral processes underlying CAES EI and ER. Eye-tracking typically indexes overt visual attention allocation (e.g., where gaze is directed), but EI/ER as rated in CAES may depend more on internal processing and response organization (e.g., interpretation of emotional cues and adaptive responding across interaction episodes), which may not be captured adequately by the specific eye-tracking metrics and timing windows used here. Therefore, the findings suggest a need to refine the mapping between CAES constructs and objective measures in future work—for example, by reconsidering the eye-tracking metrics, the temporal alignment of gaze features with CAES-scored episodes, and the behavioral coding features that more directly index identification and regulation processes (Campbell & Fiske, 1959; Eid et al., 2003).
The study also contributes substantively to understanding parent–child interaction traits and children’s social communication outcomes. The regression results (MEACI → CAES Social Communication) indicated that Allowing Child Self Direction (ACSD) and Total Empathy (TE) had small but significant predictive effects on Social Communication (SC). Although these predictors explained only a small proportion of variance (around 3%), the significant associations support the interpretation that parenting and empathy-related interaction qualities are related to children’s social communication performance, while also suggesting that multiple additional factors contribute to variability in SC. This is consistent with developmental research showing that parenting emotion-related behaviors and supportive interaction patterns are associated with children’s social-emotional competencies (Eisenberg et al., 1998).
Importantly, these findings align directly with the study’s framing—Mapping CAES Domains onto Multiple Traits from Eye-Tracking, Salivary Cortisol, and AI-Assisted Dyadic Interaction Coding—because they demonstrate that mapping is feasible but domain-dependent. The selective correspondence (e.g., EE mapping better onto cortisol) suggests that different CAES components may correspond more strongly to different objective data streams, and therefore multi-method strategies are valuable for improving construct coverage (Campbell & Fiske, 1959; Eid et al., 2003). In addition, cortisol is widely used as an index of stress-related physiological activation via the HPA axis, which may be more tightly linked to emotional arousal/expression than to purely cognitive components such as identification or regulation (Gunnar & Donzella, 2002). Thus, a multi-modal and AI-assisted approach remains promising for capturing complementary facets of CAES domains that may not be equally observable through any single objective modality.
Limitations of the Study
Selective construct–indicator mapping: Although CAES showed an interpretable domain structure, only some CAES components mapped well onto objective measures (e.g., EE with salivary cortisol). EI and ER showed weak or non-significant correspondence with the specific eye-tracking metrics used, limiting the extent to which all CAES domains are captured by the chosen objective channels.
Measurement match and sensitivity issues (especially for eye-tracking): The lack of correlations between eye-tracking variables and CAES EI/ER suggests that the eye-tracking operationalization (metrics, regions of interest, and/or timing windows) may not adequately reflect the cognitive/behavioral processes represented by EI and ER.
Restricted predictive power and correlational design: The regression effects on CAES Social Communication were statistically significant but small (≈3% variance explained), indicating limited explanatory coverage. In addition, the findings are largely correlational, which constrains causal interpretation and limits conclusions about intervention-related change over time.
Suggestions for Future Research
Apply CAES in a domain-specific way for intervention planning: Because CAES-to-objective mapping was selective across subdomains, future applications should interpret CAES domains in a domain-specific manner—recognizing that different developmental processes may be differentially observable across objective measurement channels.
Improve the mapping between CAES EI/ER and objective indicators: The lack of meaningful relations between eye-tracking metrics and CAES Emotion Identification (EI) and Emotion Regulation (ER) suggests a measurement mismatch. Future work should refine eye-tracking operationalizations (e.g., metrics, regions of interest) and strengthen temporal alignment between gaze features and CAES-scored episodes, while incorporating additional behavioral markers more directly linked to EI/ER.
Conclusion
This study provides construct validity evidence for the Child Assessment and Education System (CAES) by applying a Multitrait–Multimethod (MTMM) framework. Beyond confirming reliability, the results show that CAES domain scores exhibit a meaningful validity-relevant structure. Convergent validity is supported by significant associations between CAES domains and theoretically related constructs, while discriminant validity is supported by more selective relationships with conceptually distinct constructs and by refinement of the measurement model based on the observed association pattern. Together, these findings strengthen confidence that CAES domain profiles reflect intended developmental domains and are not merely artifacts of measurement format or informant/report pathways—thereby supporting defensible interpretation for early intervention planning and interprofessional communication.
The study also cross-validates CAES against objective behavioral–physiological indicators and finds domain-dependent correspondence. Among the emotional components, CAES Emotion Expression (EE) showed a significant association with salivary cortisol, whereas CAES Emotion Identification (EI) and Emotion Regulation (ER) did not show meaningful alignment with the eye-tracking metrics used to index attention-related processes. This suggests that some CAES subdomains may be more directly observable through specific physiological signals, while EI/ER likely require refined eye-tracking operationalizations, improved temporal alignment, and additional behavioral markers. Overall, CAES is supported for early intervention use, with clear directions for improving objective mapping and future longitudinal validation.
References
- Campbell, D. T.; Fiske, D. W. Convergent and discriminant validation by the multitrait-multimethod matrix. Psychol. Bull. 1959, 56(2), 81–105. [Google Scholar] [CrossRef]
- Eid, M.; Lischetzke, T.; Nussbeck, F. W.; Trierweiler, L. I. Separating trait effects from trait-specific method effects in multitrait-multimethod models: A multiple-indicator CT-C(M-1) model. Psychol. Methods 2003, 8(1), 38–60. [Google Scholar] [PubMed]
- Eisenberg, N.; Cumberland, A.; Spinrad, T. L. Parental Socialization of Emotion. Psychol. Inq. 1998, 9(4), 241–273. [Google Scholar] [CrossRef] [PubMed]
- Gunnar, M. R.; Donzella, B. Social regulation of the cortisol stress response in infants, children, and adolescents. Psychoneuroendocrinology 2002, 27(1–2), 199–220. [Google Scholar] [CrossRef] [PubMed]
- Gross, J. J. The emerging field of emotion regulation: An integrative review. Rev. General. Psychol. 1998, 2(3), 271–299. [Google Scholar] [CrossRef]
- Henderson, J. M.; Hayes, T. R. Meaning-based guidance of visual attention. In The Oxford Handbook of Attention; Nobre, A. C., Kastner, S., Eds.; Oxford University Press, 2014; pp. 371–392. [Google Scholar]
- Huang, J. C.; Li, C. M.; Huang, A. S.; Wu, C. G.; Lu, L. Communication and language screening test for birth to three Chinese-speaking infant-toddlers (CLST) [Manual]; Psychological Publishing Co, 2009. [Google Scholar]
- Leung, C.H. The Concurrent Validity of the Hong Kong Versions of the Penn Interactive Peer Play (PIPPS) and the Preschool Play Behavior Scale (PPBS). J. Res. Child. Educ. 2017. [Google Scholar] [CrossRef]
- Leung, C.H. Factor Structure of Preschool Play Behavior Scale (PPBS) with Chinese preschoolers from low-income families. Child Youths Serv. Rev. 2015. [Google Scholar] [CrossRef]
- Marsh, H. W.; Hocevar, D. Confirmatory factor analysis of multitrait-multimethod matrices. Behav. Res. Methods Instrum. 1983, 15(3), 361–373. Available online: https://eric.ed.gov/?id=ED206635.
- McEwen, B. S. Protective and damaging effects of stress mediators. N. Engl. J. Med. 1998, 338(3), 171–179. [Google Scholar] [CrossRef] [PubMed]
- Messick, S. Validity of psychological assessment: Validation of inferences from persons’ responses and performances as scientific inquiry into score meaning. Am. Psychol. 1995, 50(9), 741–749. [Google Scholar] [CrossRef]
- Celeghin, A.; Diano, M.; Bagnis, A.; Viola, M.; Tamietto, M. Basic emotions in human neuroscience: Neuroimaging and beyond. Front. Psychol. 2017, 8, 1432. [Google Scholar] [CrossRef] [PubMed]
- 兒童發展評量表研究小組., & 香港教育學院. (2007). 兒童發展評量表 (第3版.). 香港教育學院. Research Group on Child Development Assessment Scale ,&Hong Kong Institute of Education (2007). Child Development Assessment Scale (3rd edition) The Hong Kong Institute of Education.
- 黃惠玲(2000):零歲至六歲兒童發展篩檢量表 指導手冊。台北市:心理出版社。Huang Huiling (2000): Guidelines for the Development Screening Scale for Children Aged 0-6. Taipei City: Psychology Press.
Disclaimer/Publisher’s Note: The statements, opinions and data contained in all publications are solely those of the individual author(s) and contributor(s) and not of MDPI and/or the editor(s). MDPI and/or the editor(s) disclaim responsibility for any injury to people or property resulting from any ideas, methods, instructions or products referred to in the content. |
© 2026 by the authors. Licensee MDPI, Basel, Switzerland. This article is an open access article distributed under the terms and conditions of the Creative Commons Attribution (CC BY) license (http://creativecommons.org/licenses/by/4.0/).
Copyright: This open access article is published under a Creative Commons CC BY 4.0 license, which permit the free download, distribution, and reuse, provided that the author and preprint are cited in any reuse.


