

Submitted:
20 June 2026
Posted:
22 June 2026
You are already at the latest version
Abstract
Breastfeeding experiences are closely linked to postnatal mental health, yet population-level studies have largely treated mothers as a uniform group. This study applies an unsupervised machine learning approach to identify distinct maternal subgroups within a large UK breastfeeding and mental health dataset. Secondary analysis was conducted on the open-access survey dataset compiled by Braithwaite et al. (2025), comprising 2,010 postpartum mothers who had breastfed their first child. Thirty variables were selected across four domains: prenatal/postnatal social pressure, psychosocial breastfeeding impact (0–10 scale), demographic characteristics, and mental health outcomes (EPDS and GAD-7). After median imputation and StandardScaler normalisation, Principal Component Analysis (PCA) was applied for variance decomposition, followed by K-Means clustering. The optimal cluster count (k=4) was selected based on the elbow curve, Silhouette Score, and Davies-Bouldin Index, validated by Hierarchical Clustering (Ward linkage). Four clinically distinct subgroups emerged is High-Risk (n=303, EPDS M=11.45, 62.7% at-risk), Low-Pressure (n=663, longest breastfeeding duration), High-Healthcare-Professional Pressure (n=517, paradoxically shortest breastfeeding duration), and Resilient (n=527, EPDS M=7.98, mean duration=15.18 months). One-way ANOVA confirmed highly significant between-cluster differences across all psychosocial variables (F=34.59–787.55, p<0.001), with no significant age or education differences. PCA identified guilt impact and maternal identity as the primary axes of variation. Findings indicate that internal psychological burden not demographic profile is the principal differentiator, with direct implications for designing targeted postnatal mental health interventions.
Keywords:
breastfeeding
; postnatal mental health
; K-Means clustering
; PCA
; machine learning
Intisari—Pengalaman menyusui berkaitan erat dengan kesehatan mental ibu pasca melahirkan, namun sebagian besar studi berbasis populasi masih memperlakukan seluruh ibu sebagai kelompok yang homogen. Penelitian ini menerapkan pendekatan machine learning tanpa supervisi untuk mengidentifikasi subkelompok ibu yang berbeda secara klinis dalam dataset menyusui dan kesehatan mental berskala besar dari Inggris. Analisis sekunder dilakukan terhadap dataset open-access yang dikumpulkan oleh Braithwaite dkk. (2025), melibatkan 2.010 ibu pascamelahirkan yang pernah menyusui anak pertama mereka. Dipilih 30 variabel dari empat domain yaitu tekanan sosial prenatal/postnatal, dampak psikososial menyusui (skala 0–10), demografis, serta outcome kesehatan mental (EPDS dan GAD-7). Setelah imputasi median dan standardisasi, diterapkan Principal Component Analysis (PCA) dilanjutkan K-Means clustering. Jumlah kluster optimal (k=4) ditentukan melalui elbow curve, Silhouette Score, dan Davies-Bouldin Index, divalidasi dengan Hierarchical Clustering. Empat subkelompok teridentifikasi yaitu Risiko Tinggi (n=303, EPDS rerata=11,45), Tekanan Rendah (n=663, durasi menyusui terpanjang), Tekanan Nakes Tinggi (n=517, durasi menyusui paradoks terpendek meski tekanan tertinggi), dan Resilient (n=527, EPDS rerata=7,98, durasi rerata=15,18 bulan). ANOVA mengonfirmasi perbedaan sangat signifikan antarkluster pada seluruh variabel psikososial (F=34,59–787,55; p<0,001), sementara usia dan pendidikan tidak berbeda bermakna. PCA mengidentifikasi rasa bersalah dan identitas maternal sebagai dimensi variasi utama. Temuan ini menunjukkan beban psikologis internal bukan profil demografis sebagai pembeda utama antarsubkelompok, dengan implikasi langsung pada intervensi kesehatan mental postnatal yang lebih tertarget.
Kata Kunci: menyusui; kesehatan mental postnatal; K-Means clustering; PCA; machine learning
INTRODUCTION
Postpartum depression is consistently recorded as the most common mental disorder in the perinatal period. Research indicates that the overall prevalence of postpartum depression among mothers reaches 17.2%, though this figure varies across regions due to differences in social, economic, and healthcare access conditions [1]. The consequences of postpartum depression extend beyond the mother herself, affecting children’s long-term emotional, cognitive, and behavioural development [2]. Accordingly, early detection of mothers at risk of postnatal psychological distress has become a critical priority in prevention and mental health intervention efforts.
Among the many factors identified in the literature, breastfeeding difficulties stand out as a notable contributor to maternal depression. Although breastfeeding is widely recommended for its benefits to both mother and infant, the experience is far from universally straightforward. Many mothers encounter challenges such as excessive pain, latching difficulties, breast engorgement, mastitis, and inadequate milk supply [3]. These difficulties can generate feelings of anxiety, guilt, and a perceived failure of maternal identity. The relationship between breastfeeding and mental health is inherently complex: psychological distress can undermine breastfeeding success, while breastfeeding difficulties can, in turn, exacerbate the mother’s psychological condition [4].
This issue is particularly pronounced in the United Kingdom, where the breastfeeding initiation rate is relatively high at 81%, yet exclusive breastfeeding rates at six months remain as low as 1%. This stark disparity between initial intention and sustained practice places the UK among the countries with the lowest exclusive breastfeeding rates in the world [5].
Postpartum depression has traditionally been detected using self-report screening instruments such as the Edinburgh Postnatal Depression Scale (EPDS). While useful for identifying depressive symptoms during the postnatal period, such tools carry inherent limitations. Questionnaire-based screening generally captures a snapshot of the mother’s condition at the time of measurement and is not fully equipped to map more complex risk patterns before symptoms escalate [6]. Furthermore, screening results frequently require adequate clinical follow-up to ensure that mothers showing signs of psychological disturbance receive appropriate support in a timely manner.
In recent years, the advancement of machine learning (ML) has offered increasingly predictive approaches to detecting postpartum depression risk. Sibbald et al. demonstrated that a LASSO model using prenatal data could predict postpartum depression as early as the first trimester of pregnancy, achieving an AUC of 0.99 using variables routinely available in midwifery care [7]. Similarly, Lilihore et al. developed a hybrid CNN-Bi-LSTM deep learning model capable of classifying postpartum depression risk with accuracy exceeding 96% based on multimodal data comprising text and audio recordings [8].
Nevertheless, the majority of prior studies remain focused on prediction or classification based on predefined labels. Lin et al. noted that most existing machine learning models still require more than 20 input variables—including biomarkers and standardised psychological indicators—that are not routinely available in primary care settings [6]. In addition, pressure perceived by mothers from healthcare professionals has been found to worsen rather than improve their psychological state [9]. Rowles et al. further found that even among mothers with strong motivation to breastfeed, inability to meet those expectations can become a significant source of psychological distress [10].
Drawing on these gaps, this study proposes an unsupervised machine learning approach combining Principal Component Analysis (PCA) and K-Means Clustering. This approach enables the identification of naturally occurring subgroups without requiring predefined class labels [9,11]. Through this framework, the study aims to identify subgroups of breastfeeding mothers at high risk, defined by a combination of breastfeeding experience, social pressure, breastfeeding challenges, psychological impact, and mental health indicators such as the EPDS and GAD-7. The findings are expected to contribute to a more contextual mapping of breastfeeding mothers’ mental health risk, providing a basis for the development of more targeted and evidence-informed early detection and intervention strategies.
MATERIALS AND METHODS
This study utilised an open-access quantitative dataset compiled by Braithwaite et al. through a cross-sectional online survey conducted in October 2023, formally published in Data in Brief [12]. The same dataset was
previously employed in a published study by Rowles et al., which analysed its qualitative component to identify behavioural change intervention targets, thus confirming the validity and quality of the data through independent academic use [10]. The present analysis focused on the quantitative component of the imputed version of the dataset.
The survey was conducted online via the Prolific platform (www.prolific.com), which recruited participants according to the following eligibility criteria:
- Aged 18 years or older
- Had given birth to their first child within the preceding 10 years
- Singleton pregnancy (not multiple birth)
- Gestational age ≥37 weeks
- Had breastfed their first child, whether directly at the breast or through expressed milk
Of the total responses received, 294 incomplete and 40 duplicate responses were excluded, yielding a final sample of N=2,010 participants with complete data. Ethical approval for the original study was granted by the Manchester Metropolitan University Faculty of Health and Education Research Ethics Committee (REF 58254), and all participants provided written informed consent prior to participation [12].
The stages of this research are presented in the following figure:
Figure 1.
Research workflow: seven stages of analysis. Source: (Prasetyaningrum, Fanani, Prabowo, 2026).
Figure 1.
Research workflow: seven stages of analysis. Source: (Prasetyaningrum, Fanani, Prabowo, 2026).
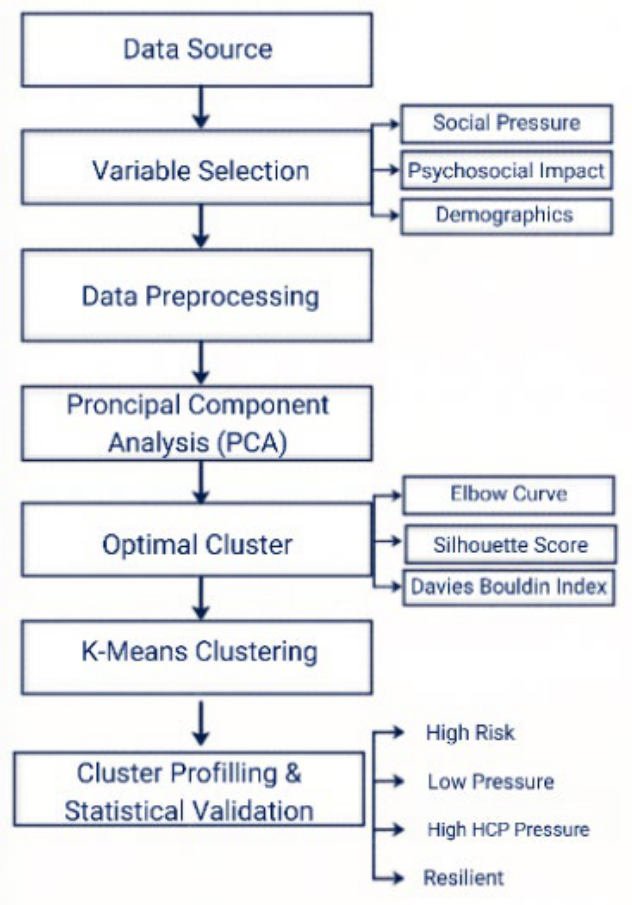
From the 140 variables available in the dataset, 30 were selected based on their theoretical and clinical relevance to the study objectives. These variables spanned four primary domains:
- Prenatal and postnatal social pressure from eight sources partner, family, friends, peer parents, midwife, health visitor, other healthcare professionals, and the wider community measured on a three-point Likert scale (1 = no pressure at all to 3 = very strong pressure)
- Psychosocial impact of breastfeeding difficulties, comprising 11 items on a 0–10 scale, covering impacts on socialisation, relationship with partner, guilt, and maternal identity
- Demographic characteristics, including maternal age, education level, and mode of delivery
- Primary outcomes: total EPDS score, total GAD-7 score, and breastfeeding duration in months. Variables with more than 90% missing values were excluded from the analysis.
The dataset had already undergone imputation by the original research team using multiple imputation in SPSS v29. However, exploratory analysis revealed remaining missing values in several selected variables, particularly breastfeeding duration (n=413; 20.5%) and a number of psychosocial impact items. These residual missing values were imputed using a median strategy via SimpleImputer (scikit-learn), selected because ordinal and psychological variable distributions tend to be right-skewed, making the median a more representative estimate than the mean. All features were subsequently standardised using StandardScaler to zero mean and unit standard deviation, ensuring that variables with differing scale ranges contribute equally to the Euclidean distance calculations during clustering.
All features were standardised prior to analysis. For each variable x with mean μ and standard deviation σ, the standardised value z is computed as shown in equation (1).
In equation (1), μ is the feature mean and σ is the standard deviation across all observations.
Ten components were extracted, and the proportion of variance explained by each component was examined through a scree plot.
PCA decomposes the standardised matrix into orthogonal components. The proportion of total variance explained by the k-th principal component is given by equation (2).
In equation (2), λₖ is the eigenvalue of the k-th component and p is the total number of features (p=30).
K-Means clustering was applied directly to the 30-dimensional standardised feature space rather than to the PCA-reduced output to retain all information from the original variables. The algorithm was run with n_init=50 and random_state=42 to ensure solution stability across 50 different random initialisations. Determining the optimal number of clusters considered three metrics simultaneously the elbow curve, Silhouette Score, and Davies-Bouldin Index, evaluated for k=2 through k=7. In addition to statistical metrics, clinical meaningfulness was also applied as a criterion that is, whether the resulting typology produced subgroup profiles that were interpretable and actionable in a clinical context.
K-Means partitions observations by minimising the within-cluster sum of squared distances. The objective function J is defined in equation (3).
In equation (3), K is the number of clusters, Cₖ is the set of observations assigned to cluster k, μₖ is the centroid of cluster k, and ‖⋅‖ denotes Euclidean distance.
The quality of cluster assignment for each observation i was evaluated using the Silhouette Score as shown in equations (4) and (5).
In equations (4) and (5), a(i) is the mean intra-cluster distance of observation i, b(i) is the mean distance from i to the nearest neighbouring cluster, and n is the total number of observations. Values of s̅ approaching 1 indicate well-separated clusters.
Cluster compactness and separation were further assessed using the Davies-Bouldin Index, defined in equation (6).
In equation (6), σₖ is the mean distance of points in cluster k to their centroid, and d(μₖ, μⱼ) is the Euclidean distance between centroids of clusters k and j. Lower values indicate more compact and well-separated clusters.
As an independent validation procedure, Hierarchical Clustering with Ward linkage was performed on a random subsample of 300 observations (random_state=42). Consistency in cluster size distribution between the two methods served as an indicator of segmentation stability. Following the assignment of final cluster labels, each subgroup was profiled based on the mean values of 13 key variables encompassing mental health scores, breastfeeding duration, psychosocial impact, and sources of pressure. One-way ANOVA was applied to test the significance of between-cluster differences, with thresholds set at α=0.05 (*), α=0.01 (**), and α=0.001 (***).
Between-cluster differences across profiling variables were tested using one-way ANOVA. The F-statistic is computed as in equation (7).
In equation (7), SSᵇᵉᵀʷᵉᵉⁿ is the sum of squares between clusters, SSᵂᴴᵀʰᴴⁿ is the sum of squares within clusters, K is the number of clusters (K=4), and n is the total sample size (n=2,010).
RESULTS AND DISCUSSION
The results of Principal Component Analysis (PCA) showed that the ten principal components collectively explained 71.5% of the total data variance (Table 1). The first component (PC1) contributed the largest share at 25.5%, indicating the presence of a dominant latent dimension in capturing the variation in respondent characteristics.
The variables with the highest loadings on PC1 included impact_maternal_identity (0.251), impact_feeling_not_good_enough (0.250), prenatal_pressure_healthcare_professional (0.250), and postnatal_pressure_midwife (0.247). Notably, these variables represent two distinct domains: internal psychological aspects and externally perceived pressure from healthcare professionals during both the prenatal and postnatal periods.
This pattern suggests that the two domains are not entirely separate in the data structure but rather tend to cluster within the same dimension. The finding indicates that the experience of pressure from healthcare professionals and mothers’ psychological responses may co-occur in certain subgroups. Accordingly, PC1 can be interpreted as a composite representation of psychosocial burden and external pressure experienced by mothers during the breastfeeding period.
The optimal number of clusters was determined by comparing Elbow, Silhouette Score, and Davies-Bouldin Index values across k=2 to k=7 (Table 2). Results showed that elbow declined continuously as the number of clusters increased, with steeper reductions at lower k values and a more gradual decrease beyond k=4. This pattern suggests that adding clusters beyond this point yields diminishing returns in terms of within-cluster homogeneity.
Based on the Silhouette Score, the highest value was obtained at k=2 (0.1876), indicating the most mathematically optimal cluster separation. However, a two-cluster configuration produces a relatively coarse segmentation that lacks the resolution to capture the full heterogeneity of respondents’ characteristics.
The selection of k=4 was made by balancing cluster separation quality against result interpretability. Although the Silhouette Score at k=4 (0.1012) is lower than at k=2, this configuration yielded four groups with more distinct characteristic patterns that were more meaningful for clinical interpretation. This approach is consistent with practice in health research, where cluster number selection is not based solely on numerical indicators but also accounts for the meaningfulness and utility of results in explaining variation across respondent profiles.
K-Means clustering with k=4 identified four respondent groups with distinct characteristics.

Table 3.
Cluster Distribution (k=4) of Breastfeeding Mothers.
| Cluster | Label | Description |
|---|---|---|
| k0 | High-Risk | Highest mental health burden, high social pressure, short breastfeeding duration |
| k1 | Low-Pressure | Lowest social pressure from all sources, moderate breastfeeding duration |
| k2 | High Healthcare Professional Pressure | Highest healthcare professional pressure, paradoxically shortest breastfeeding duration |
| k3 | Resilient | Lowest mental health burden, longest breastfeeding duration, minimal psychological impact |
Source: (Prasetyaningrum, Fanani, Prabowo, 2026)
Table 4.
Mean Profile of Key Variables per Cluster.
| Variable | C0 (n=303) | C1 (n=663) | C2 (n=517) | C3 (n=527) |
|---|---|---|---|---|
| EPDS total | 11.45 | 10.18 | 10.62 | 7.98 |
| EPDS ≥10 (%) | 62.7% | 51.6% | 53.4% | 31.1% |
| GAD-7 total | 7.85 | 6.66 | 7.03 | 4.59 |
| Duration (months) | 5.65 | 10.98 | 5.79 | 15.18 |
| Impact: guilt | 8.63 | 7.66 | 7.84 | 2.06 |
| Impact: not good enough | 8.78 | 7.57 | 8.07 | 2.08 |
| Postnatal HV pressure | 2.35 | 1.25 | 2.42 | 1.32 |
| Postnatal midwife pressure | 2.44 | 1.30 | 2.44 | 1.36 |
| Maternal age (years) | 34.58 | 35.09 | 35.53 | 35.26 |
Source: (Prasetyaningrum, Fanani, Prabowo, 2026)
Cluster k0 exhibited the least favourable mental health profile relative to other clusters, characterised by the highest mean EPDS score (11.45), an EPDS ≥10 proportion of 62.7%, and the highest GAD-7 score (7.85). This cluster also recorded elevated scores on psychological impact indicators, including feelings of guilt (8.63) and feeling insufficiently good as a mother (8.78), accompanied by relatively high levels of postnatal pressure from healthcare professionals.
Cluster k1 was characterised by lower healthcare professional pressure, with mean postnatal pressure from the health visitor at 1.25 and from the midwife at 1.30. Despite this, EPDS and GAD-7 scores in this group remained at a moderate level. The group also demonstrated longer breastfeeding duration than both k0 and k2.
Cluster k2 displayed a distinct pattern is high perceived pressure from healthcare professionals (health visitor pressure=2.42; midwife pressure=2.44), yet without the corresponding elevation in psychological symptom scores observed in k0. This finding suggests that perceived pressure from healthcare professionals does not necessarily correlate with higher levels of psychological symptoms.
By contrast, cluster k3 demonstrated a comparatively favourable profile across most indicators. This cluster had the lowest mean EPDS (7.98) and GAD-7 (4.59) scores, the lowest proportion of EPDS ≥10 (31.1%), the longest breastfeeding duration (15.18 months), and the lowest psychological impact scores relative to all other clusters.
Overall, the clustering results point to meaningful heterogeneity in breastfeeding experiences, shaped by a combination of psychological factors, perceived pressure from healthcare professionals, and sustained engagement with breastfeeding practice.
One-way ANOVA was applied to 13 variables to test the significance of between-cluster differences, with full results presented in Table 5. All psychological, social, and clinical variables demonstrated highly significant differences (p<0.001), while the demographic variables yielded non-significant values (p>0.001).
The highest F-values were observed for internal psychological impact variables: impact_feeling_not_good_enough (F=787.55), impact_guilt (F=765.10), and impact_maternal_identity (F=591.19). These values are approximately 17 times greater than those for total EPDS (F=46.51) and total GAD-7 (F=34.59), indicating that guilt and the threat to maternal identity are far more sensitive in differentiating maternal risk profiles than the clinical screening scales currently in widespread use.
Healthcare professional pressure variables also emerged as strong differentiators, with postnatal_pressure_health_visitor (F=667.70) and postnatal_pressure_midwife (F=617.85) ranking third and fourth highest, surpassing both breastfeeding outcomes (F=73.55) and formal mental health scores.
By contrast, maternal age (F=0.96; p=0.411) and education level (F=0.40; p=0.754) showed no significant between-cluster differences. This finding confirms that the segmentation reflects differences in psychological and social experiences rather than demographic stratification, and that demographic-based screening alone is insufficient to identify mothers in need of intervention.
Validation using Hierarchical Clustering (Ward linkage) produced a distribution consistent with the K-Means solution, reinforcing the stability of the segmentation. The relatively low Silhouette Score (0.101 at k=4) is expected for continuous, overlapping behavioural-psychological data, and is consistent with findings reported in cluster studies within psychiatric epidemiology. The PCA biplot (Figure 2A) shows clear spatial separation between k3 and k0 along PC1, consistent with the extreme differences in psychological impact profiles between the two clusters.
CONCLUSION
This study successfully identified four clinically distinct breastfeeding mother subgroups using K-Means clustering and PCA on a dataset of 2,010 mothers in the United Kingdom. Three key findings merit emphasis:
- Internal psychological burden particularly guilt and threats to maternal identity is the primary differentiator between subgroups, not demographic profile. This means that psychological variable based screening is more sensitive than approaches based on age or education.
- 15.1% of mothers in subgroup k0 are in a high-risk condition requiring priority psychosocial intervention.
- High pressure from healthcare professionals does not necessarily promote longer breastfeeding duration on the contrary, it appears associated with earlier cessation, calling for a re-evaluation of existing midwifery communication models.
Together, these findings affirm that the heterogeneity of breastfeeding experiences cannot be adequately captured through population-average analysis. By leveraging a data-driven approach integrating PCA and K-Means clustering, this study produces a subgroup typology that can serve as a foundation for developing postnatal mental health intervention strategies that are more personalised, targeted, and oriented toward the specific needs of each maternal group.
References
- Wang, Z.; et al. Mapping global prevalence of depression among postpartum women; 2021; pp. 1–24. [Google Scholar] [CrossRef] [PubMed]
- Rogers, A.; Obst, S.; Teague, S. J. Association Between Maternal Perinatal Depression and Anxiety and Child and Adolescent Development A Meta-analysis. JAMA Pediatr. 2020, 174, 1082–1092. [Google Scholar] [CrossRef] [PubMed]
- Alimi, R.; Azmoude, E.; Zamani, M. The Association of Breastfeeding with a Reduced Risk of Postpartum Depression: A Systematic Review and Meta-Analysis. Sage J. 2021, 17. [Google Scholar] [CrossRef]
- Nagel, E. M.; et al. Maternal psychological distress and lactation and breastfeeding outcomes: A narrative review. HHS Public Access 2023, 44, 215–227. [Google Scholar] [CrossRef] [PubMed]
- Quigley, M.; Harrison, S.; Levene, I.; McLeish, J.; Buchanan, P.; Alderdice, F. Breastfeeding rates in England during the Covid-19 pandemic and the previous decade: Analysis of national surveys and routine data. PLoS ONE 2023, 1–18. [Google Scholar] [CrossRef] [PubMed]
- Lin, H.; et al. A Clinically Practical Postpartum Depression Predictor: Machine Learning Model Based on Simplified Indicators. Res. Sq. 2025, 1–22. [Google Scholar]
- Sibbald, L.; et al. Identifying prenatal risk factors of postpartum depression with machine learning. Sci. Rep. 2025, 1–11. [Google Scholar] [CrossRef] [PubMed]
- Lilhore, U. K.; et al. Prevalence and risk factors analysis of postpartum depression at early stage using hybrid deep learning model. Sci. Rep. 2024, 1–24. [Google Scholar] [CrossRef] [PubMed]
- Wheeler, A.; Farrington, S.; Sweeting, F.; Brown, A.; Mayers, A. Perceived Pressures and Mental Health of Breastfeeding Mothers: A Qualitative Descriptive Study. Healthcare 2024, 12, 1794. [Google Scholar] [CrossRef] [PubMed]
- Rowles, G.; et al. Investigating the impact of breastfeeding difficulties on maternal mental health. Sci. Rep. 2025, 13572, 1–7. [Google Scholar] [CrossRef] [PubMed]
- Grant, R. W.; Mccloskey, J.; Hatfield, M.; Uratsu, C.; Ralston, J. D. Use of Latent Class Analysis and k-Means Clustering to Identify Complex Patient Profiles. JAMA Netw. 2020, 3, 1–13. [Google Scholar] [CrossRef] [PubMed]
- Braithwaite, E.; et al. A mixed-methods dataset on maternal reported experiences of breastfeeding difficulties and mental health in the UK. Data Br. 2025, 61. [Google Scholar] [CrossRef] [PubMed]
Figure 2.
Four-panel visualisation of K-Means clustering results: (A) PCA biplot, (B) cluster profile heatmap, (C) EPDS distribution, (D) breastfeeding duration distribution. Source: (Prasetyaningrum, Fanani, Prabowo, 2026).
Figure 2.
Four-panel visualisation of K-Means clustering results: (A) PCA biplot, (B) cluster profile heatmap, (C) EPDS distribution, (D) breastfeeding duration distribution. Source: (Prasetyaningrum, Fanani, Prabowo, 2026).
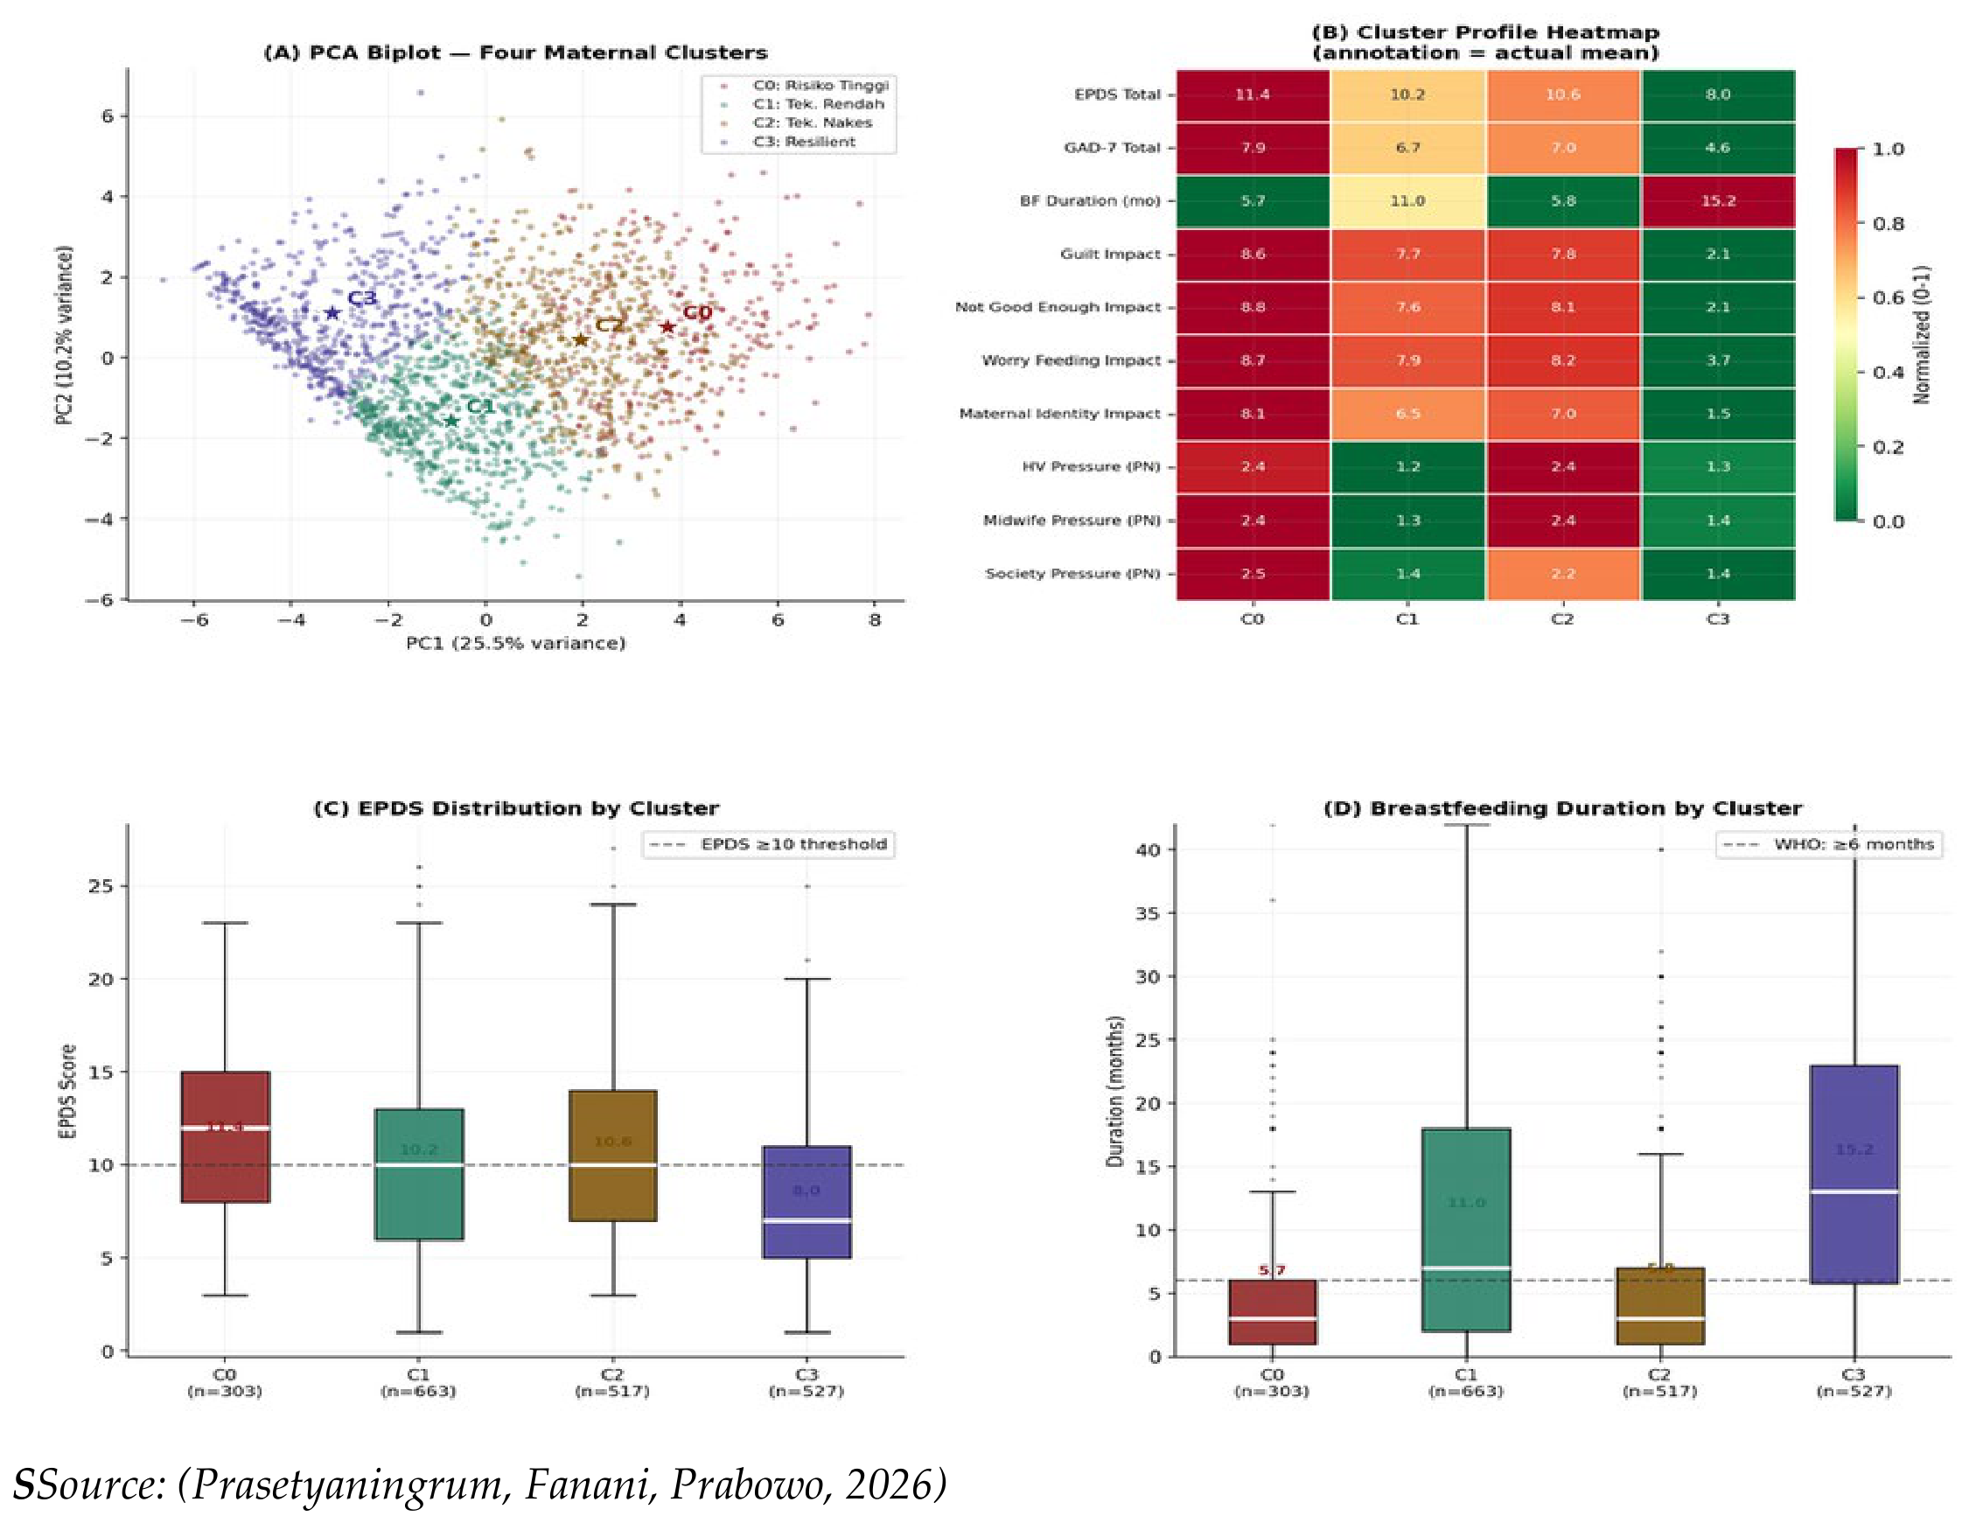
Table 1.
Variance Explained by PCA.
| PC | Var (%) | Cum. (%) | Primary Domain | Top Variable |
|---|---|---|---|---|
| 1 | 25.5% | 25.5% | Psychosocial + Healthcare | impact_maternal_identity |
| 2 | 10.2% | 35.7% | Midwife pressure | prenatal_pressure_midwife |
| 3 | 6.7% | 42.4% | Family pressure | postnatal_pressure_family |
| 4 | 5.5% | 47.9% | Demographics | maternal_age |
| 5 | 5.2% | 53.1% | Clinical outcomes | EPDS_total |
| 6–10 | — | 71.5% | Residual | — |
Source: (Prasetyaningrum, Fanani, Prabowo, 2026)
Table 2.
Cluster Metric Evaluation (k=2–7).
| k | Elbow | Silhouette | Davies-Bouldin |
|---|---|---|---|
| 2 | 49,810 | 0.1876 | 2.0706 |
| 3 | 45,995 | 0.1096 | 2.2990 |
| 4 | 43,927 | 0.1012 | 2.5502 |
| 5 | 42,053 | 0.1014 | 2.1095 |
| 6 | 40,676 | 0.0929 | 2.1706 |
| 7 | 39,585 | 0.0813 | 2.3037 |
Source: (Prasetyaningrum, Fanani, Prabowo, 2026).
Table 5.
ANOVA Test Results.
| Variable | F-Statistic | P-Value |
|---|---|---|
| Internal Psychological Impact | ||
| Feeling insufficiently good as a mother | 787.55 | 0.0000 |
| Guilt impact | 765.10 | 0.0000 |
| Maternal identity impact | 591.19 | 0.0000 |
| Feeding anxiety | 461.17 | 0.0000 |
| Sleep impact | 103.80 | 0.0000 |
| External Social Pressure | ||
| Postnatal midwife pressure | 617.85 | 0.0000 |
| Postnatal health visitor pressure | 667.70 | 0.0000 |
| Prenatal community pressure | 352.70 | 0.0000 |
| Mental Health and Breastfeeding Outcomes | ||
| Breastfeeding duration (months) | 73.55 | 0.0000 |
| Total EPDS score | 46.51 | 0.0000 |
| Total GAD-7 score | 34.59 | 0.0000 |
| Demographics | ||
| Maternal age | 0.96 | 0.4113 |
| Education level | 0.40 | 0.7537 |
Source: (Prasetyaningrum, Fanani, Prabowo, 2026)
Disclaimer/Publisher’s Note: The statements, opinions and data contained in all publications are solely those of the individual author(s) and contributor(s) and not of MDPI and/or the editor(s). MDPI and/or the editor(s) disclaim responsibility for any injury to people or property resulting from any ideas, methods, instructions or products referred to in the content. |
© 2026 by the authors. Licensee MDPI, Basel, Switzerland. This article is an open access article distributed under the terms and conditions of the Creative Commons Attribution (CC BY) license (http://creativecommons.org/licenses/by/4.0/).
Copyright: This open access article is published under a Creative Commons CC BY 4.0 license, which permit the free download, distribution, and reuse, provided that the author and preprint are cited in any reuse.


