

Submitted:
18 June 2026
Posted:
22 June 2026
You are already at the latest version
Abstract
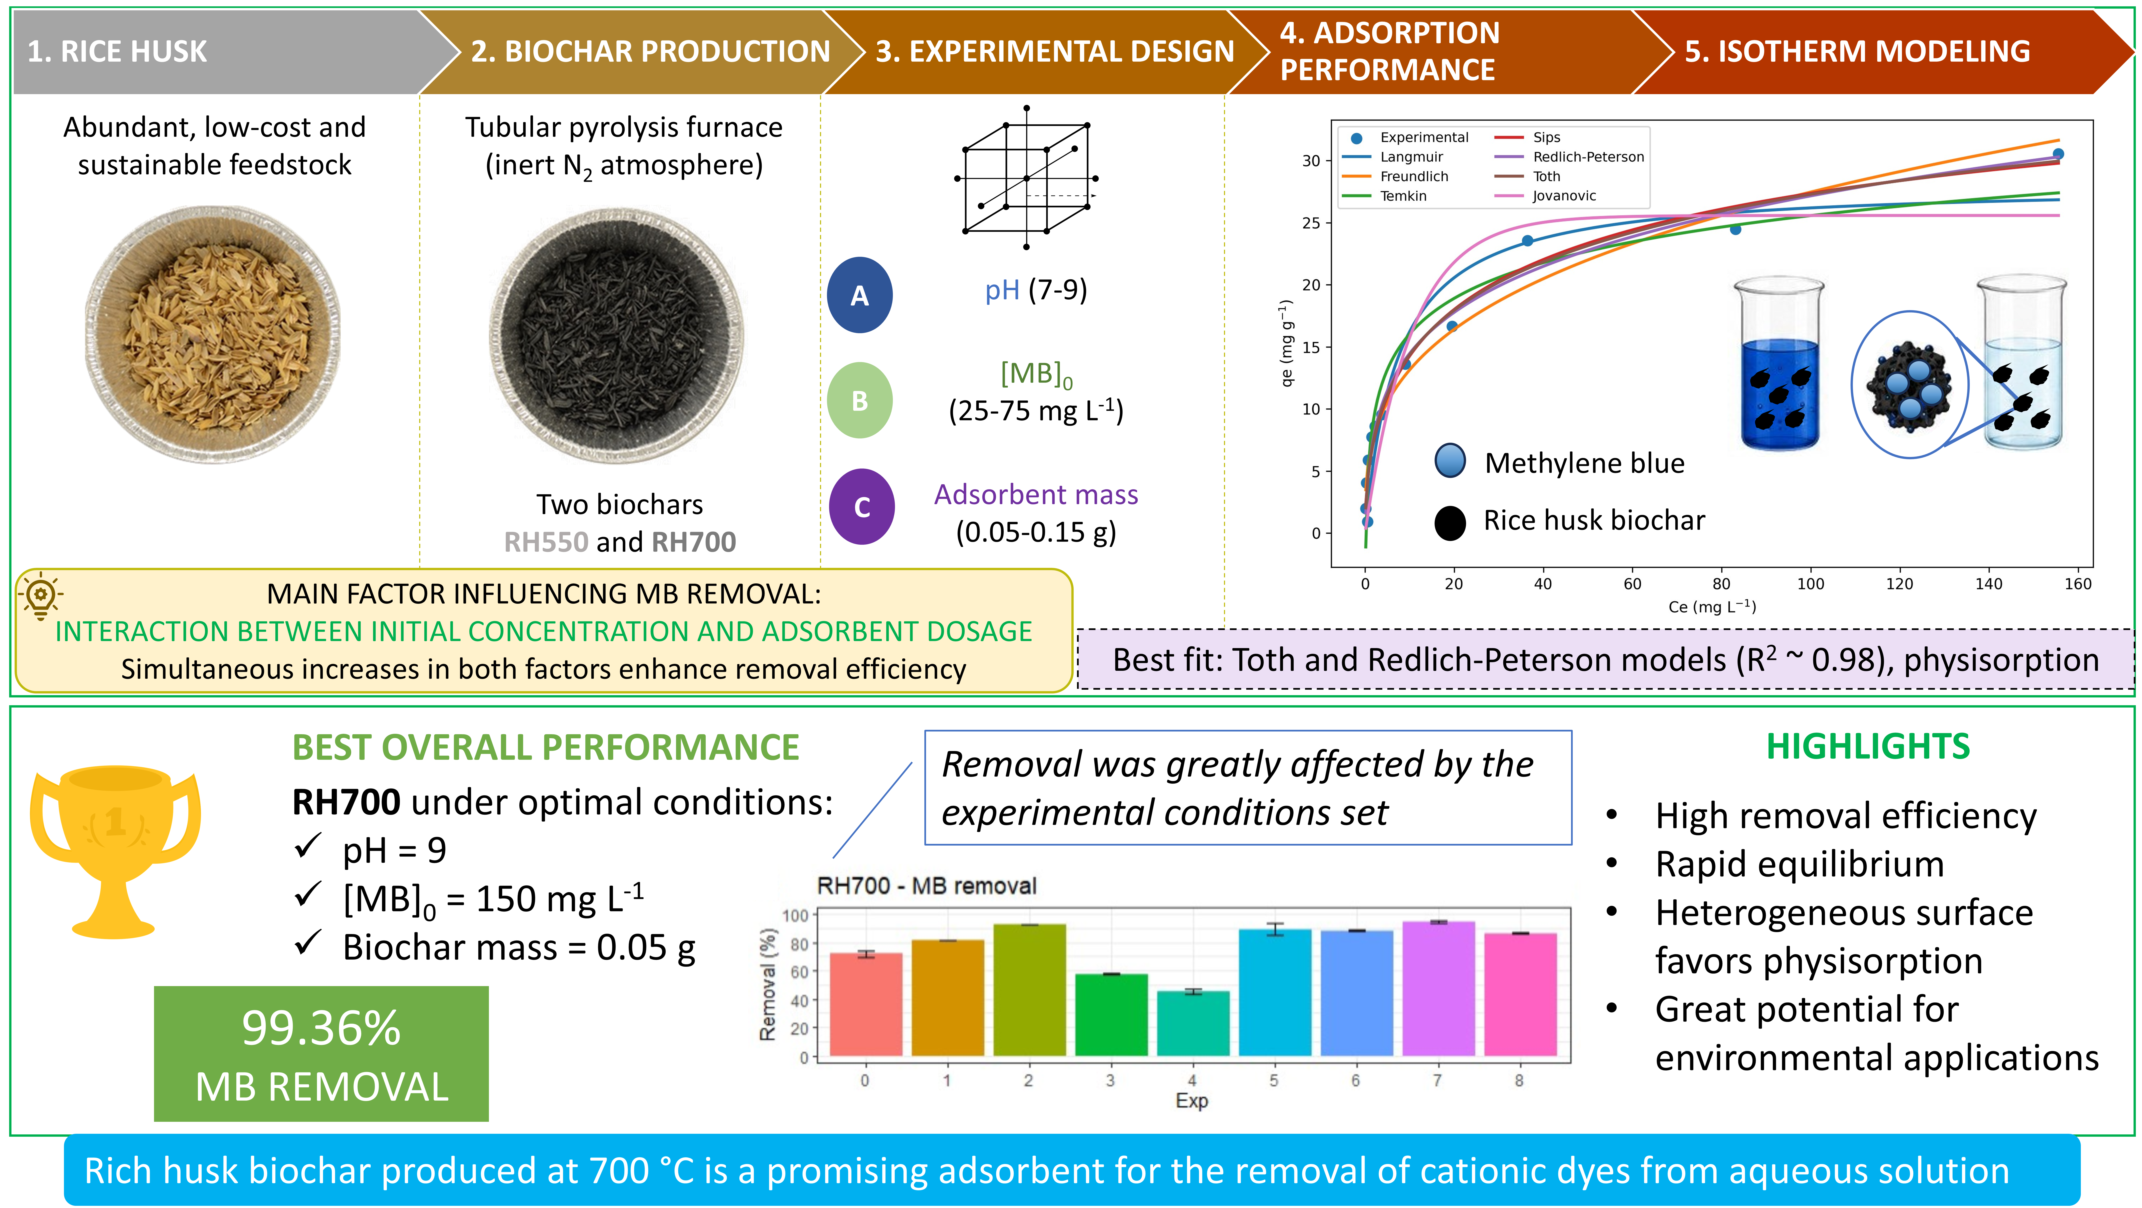
Rice husk–derived biochars produced at 550 °C and 700 °C were evaluated for methylene blue adsorption from aqueous solutions using a full factorial experimental design. The effects of pH (7–9), initial dye concentration (25–75 mg L-1), and adsorbent mass (0.05–0.15 g) and their interactions were systematically analyzed. Initial concentration and adsorbent mass were the most significant factors, followed by the pH–concentration interaction. Equilibrium time depended strongly on operating conditions and biochar type. For RH550, equilibrium times were 6 h at the central point and 8 h under conditions maximizing adsorption capacity. For RH700, equilibrium was reached in 6 h at the central point and reduced to 2 h under optimal conditions, indicating improved kinetics at higher pyrolysis temperature. Isotherm modeling indicated that Toth and Redlich–Peterson models best described the system, suggesting heterogeneous adsorption with mixed mono- and multilayer behavior. However, the Toth model overestimated adsorption capacity (70.8 mg g-1), whereas the Langmuir model provided a more realistic value (28.1 mg g-1), consistent with monolayer adsorption assumptions. Overall, rice husk biochars show strong potential as low-cost adsorbents for dye removal in aqueous systems.
Keywords:
dye
; factorial design
; adsorption
; response surface methodology
1. Introduction
Water pollution has become a major global environmental challenge, driven by rapid industrialization and the continuous discharge of untreated effluents. Industrial effluents containing residual dyes require proper treatment before discharge into aquatic systems. The release of untreated colored effluents can severely impact aquatic life [1]. Most synthetic dyes are non-biodegradable and reduce water transparency, limiting light penetration [2]. This interferes with photosynthesis and consequently decreases dissolved oxygen levels. As a result, such conditions compromise the sustainability of aquatic ecosystems [3].
Wastewaters containing dyes are difficult to treat, because not only are they stable to light, but they also are very resistant to biological degradation. Therefore, dyes can accumulate in water bodies and, as a result of their toxicity, they become an important contribution to water pollution. The conventional treatment methods include physicochemical, chemical, and biological methods, such as biodegradation [4], membrane separation [5], ultrafiltration [6], coagulation and flocculation [7], advanced oxidation processes [8,9], electrochemical techniques [10], fungal decolorization [11], forward osmosis membrane [12], and adsorption [13,14]. Among these, adsorption has been widely used for the removal of dyes from wastewater. This is due to its proven efficiency and feasibility, presenting a simple and, most of the time, low-cost solution to water treatment [15,16].
Anionic dyes are acid and reactive, whereas the nonionic ones are also known as disperse dyes and the cationic dyes are all basic [17]. Methylene blue (MB) is a basic aniline dye (cationic), extensively used as dyestuff in several textile industries, because it generates a deep blue solution when dissolved in water [18,19]. The consumption of MB-contaminated waters is reported to cause carcinogenic and mutagenic effects, as well as dermatological diseases, caused by acute exposure [20].
The most common adsorbents used for wastewater treatment are zeolites, resins, clay minerals [21] and activated carbons [22,23,24,25]. Bio-adsorbents derived from plant materials are proving to be very versatile. Because of its porous structure, charged surface and surface functional groups, biochar has gained significant interest in the last decade as a potential biosorbent for several applications. Several studies have reported successful treatment of dye-containing aqueous solutions by biochars [26,27,28].
Biochar is a carbon-rich material, obtained through the thermochemical decomposition of biomass in the absence or limited supply of oxygen [29,30]. Because the biomass sources are very abundant, inexpensive and renewable, biochars have added a sustainable appeal as biosorbents for water treatment. Many types of feedstocks can be used for biochar production, including wood [31], corn stover [32], rice straw [33], rice husks [34], bamboo [35], macauba endocarp [36], wheat straw [37], and peanut shells [38].
Most adsorption studies rely on a “one variable at a time” approach, assuming that process variables are independent. However, this assumption often fails to represent real systems, where interactions between variables can significantly influence adsorption performance. In this context, full factorial design is recommended, as it allows the simultaneous evaluation of factors and their interactions [39]. A preliminary adsorption study evaluating different adsorbent dosages, identified the most promising materials among ten standard biochars for MB removal from aqueous solutions.[34] Rice husk biochars produced at 550 °C (RH550) and 700 °C (RH700) highlighted the best performance, achieving removal efficiencies of 68.83% and 71.97%, respectively.
To gain a deeper understanding of the interactions between operational parameters in dye removal by biochar, this study investigates the optimization of solution pH, initial dye concentration, and adsorbent dosage for MB adsorption onto RH550 and RH700. A full factorial experimental design combined with analysis of variance (ANOVA) was applied. In addition, kinetic and equilibrium isotherm studies were conducted under selected experimental conditions. This approach enables a more comprehensive understanding of interaction effects, advancing beyond conventional methodologies that neglect such dependencies.
2. Materials and Methods
2.1. Reagents and solutions
The reagents used in this study were of analytical grade, supplied by Merck (Darmstadt, Germany) unless otherwise specified. All solutions were prepared using ultrapure water with 18.2 MΩ cm resistivity (Barnstead Thermolyne, USA).
2.2. Biochar samples
The biochar samples were provided by the UK Biochar Research Centre (UKBRC, School of Geosciences, The University of Edinburgh, UK), consisting of two rice husks standard biochars, prepared in a pilot-scale rotary kiln pyrolysis unit at 550 °C (RH550) and 700 °C (RH700). Both RH550 and RH700 were firstly ground in a cutting mill to obtain < 250-micron particle size. The powdered samples were stored in airtight bottles and identified accordingly.
2.3. Sorption experiments
Sorption experiments were conducted in triplicates using the batch technique. MB solutions were prepared at three different concentrations (25, 50, and 75 mg L-1) by dissolving pre-established amounts of MB in 500 mL of distilled water. These solutions were tested in different combinations of pH values and biochar dosages, according to the factorial design. The experiments were performed by placing the solutions on a Biotech BT400 (Piracicaba, Brazil) orbital shaker at 130 rpm at room temperature. The samples were shaken continuously for 24 h. After completion of each experiment, the supernatant solution was separated from the biochar by centrifugation at 6,000 rpm for 15 min (HT CM-610, Taiwan) and the MB concentration was quantified at 668 nm using a Pharmacia Biotech Ultrospec 3000 UV/Visible spectrophotometer (Uppsala, Sweden). The adsorption capacities (mg g-1) of the RH550 and the RH700 were calculated using Eq. (1):
where qt is the adsorbed amount of MB per gram of biochar at any time t, C0 and Ct the concentrations of MB in the initial solution and at any time t, respectively (mg L-1); V the volume of MB solution added (L) and m the amount of the biochar used (g). The extraction efficiency, R (%), was determined through the following equation:
where C0 (mg L-1) is the initial concentration of MB and Ct (mg L-1) represents the concentration of the MB at time t.
2.4. Factorial design and statistical analysis
The effect of a given experimental parameter on the results was evaluated using RH550 and RH700 adsorption capacities. A full-factorial two-level design on the key parameters was set up to systematically explore process operation options (Table 1).
Three parameters affecting MB adsorption were studied: solution pH, initial concentration (Ci) and adsorbate mass (m). The symbols of minus (-) and plus (+) were used to designate low and high levels, respectively. The experiments were run according to 23 factorial design with the addition of the central level, totaling nine different experimental conditions, and were done in triplicate. The experiments for the two-level factorial design were carried out in a set of 50 mL polyethylene beakers containing 10 mL MB solution of known pH, Ci and m according to the factorial design. The solutions were subjected to a 130-rpm agitation at 25 °C for 24 h. The central points were defined based on a previous study [34].
None of the three independent variables considered in this design is categorical, i.e., a variable that cannot be numerically adjusted. pH, Ci and m are numerical variables, allowing adjustments to any level. The experimental design results were processed using R [40] and the package “pid” [41] in the IDLE RStudio software to evaluate the effects as well as the statistical parameters and the statistical plots (Pareto chart, normal probability of the standardized effects, main effects and interaction plots).
The two-level factorial design was conducted in a set of eight different experiments conditions as a result of a parametric matrix (Table 1), developed according to each parameter’s low and high levels, represented by (-1) and (+1), respectively. The interactions between the independent variables were determined with the analysis of variance (ANOVA) and the main effects for MB adsorption were identified based on the p-value with > 95% of confidence level. The full codified equation (Eq. (3)) was used to explain the factorial design for MB removal by RH550 and RH700.
where Y is the predicted response, β0 represents the global mean, βi is the regression coefficient related to the interactions and the main variables A, the pH value, B, initial concentration (mg L-1), and C, the adsorbent mass (g). The effects of the interactions between the variables were calculated for RH550 and RH700 using a contrast matrix (Table S1). Variables A, B and C, each, represent a main effect, referring to the primary variables of interest. Variables AB, AC, BC and ABC represent the interactions effects.
Y= β0+ β1A+ β2B+ β3C+ β4AB+ β5AC+ β6BC+ β7ABC
2.5. Kinetic modelling
Kinetic experiments were conducted in batch-mode to determine the effect of the contact time. The same procedure of section 2.3 was herein applied, but with two different initial MB concentration, pH, mass of adsorbent, and several contact times. Three experimental conditions were selected, (1) the central level of the experimental design, and the best conditions related to (2) removal percentages and (3) adsorption capacities. The selected time intervals were 5, 15, and 30 min, 1, 2, 4, 6, 8, 10, and 24 h. The experiments were performed in duplicate. MB adsorption by both biochars were modeled by the non-linear kinetic models of pseudo-first order (PFO) [42,43] and pseudo-second order (PSO) [44], as expressed by Eqs. (4) and (5).
where t is the contact time (min), qt is the amount of adsorbate adsorbed at time (mg g-1), qe is the equilibrium adsorption capacity (mg g-1), k1 is the pseudo-first order rate constant (min-1) and k2 is the pseudo-second order rate constant (g mg-1 min-1).
2.6. Isotherm modelling
To evaluate the maximum adsorption capacity of the RH biochars for MB, a series of batch experiments were performed varying the initial MB concentration, while keeping all other parameters constant. Each assay was conducted at the equilibrium contact time previously established in the kinetic study (Section 2.5). After adsorption equilibrium was reached, the supernatant solutions were separated, and the residual MB concentration was quantified by UV–Vis spectrophotometry.
The equilibrium data were fitted to several classical and hybrid adsorption isotherm models — Langmuir, Freundlich, Temkin, Sips, Redlich–Peterson, Toth, and Jovanovic. Model parameters were determined by non-linear regression, and the goodness of fit was assessed using the coefficient of determination (R2), root mean square error (RMSE), and the Akaike (AIC) and Bayesian (BIC) information criteria. The mathematical forms of the models are given in the Supplementary Information, Text S1.
3. Results and Discussion
The removal efficiency and adsorption capacities for RH550 and RH700 under the experimental conditions evaluated are presented in Figure 1. The results include both the experimental data (A–D) and the comparison between average experimental values and those predicted by the proposed empirical models (E–H). The complete dataset is provided in Table S2.
The responses removal efficiency and adsorption capacities obtained for each experiment in the full factorial design and the Pantone color chart for RH550 and RH700 are shown in Table S3. The Pantone charts exhibit the color of the solution after the adsorption has taken place.
The main and interaction effects, coefficients of the model, standard deviation of each coefficient, regression coefficients, standard errors, and t and p-values for RH550 and RH700 are shown in Tables S4 to S7. The model equation establishes a correlation between the level of each parameter and their removal efficiency. This equation was derived by substituting the regression coefficients from Table S4 for RH550 and from Table S7 for RH770 into Eq. (3), as shown in Eqs.(6-9). The response surface models obtained for MB adsorption by RH550 and RH700 are presented in Table 2.
For RH550, variable A and the ABC interaction were insignificant when compared to other effects and, thus, they were not included in the final model equation. In contrast, for RH700, the ABC interaction was significant for both response variables and was retained, indicating a more complex interplay among the factors influencing the adsorption process.
3.1. Statistical analysis
The ANOVA (Tables S2 and S4) and the Pareto chart (Figure 2) reveal significant effects of the independent variables B and C, and their interactions B:C for most of the responses at the 95% confidence level (t or f-Fisher, p-value < 0.05). Depending on the response, B and C effects are seen as positive or negative, highlighting that the choice for higher removal rates or adsorption capacities should not follow the same strategy.
When the outcome is the removal of MB by using biochars and the effect of a variable is negative, it means that the removal efficiency decreases as the variable is changed from a lower level to a higher level of the same variable (as seen in initial MB concentration). Conversely, when the effect of a variable is positive, the removal efficiency increases from a lower level to a higher level of the same variable (as mainly seen in the adsorbent dosage)[45]. As depicted in Figure 2, the interaction between B:C and C alone highlighted the most important effects on the removal of MB by RH550 and RH700, respectively.
It is noteworthy that, as indicated by the Eqs. (6-9), the most significant interaction effect is B:C for the majority of the scenarios, with the exception of Y4. Consequently, B:C was employed for all responses in Figure 2(e-h), as it is regarded as the most representative contour plots of the uptake of MB by the biochars. As illustrated in Figure 2(e-h), the efficacy of removal (Y1 and Y3) is evident, with the interaction effects manifesting as the presence of curves in the contour plots. In the context of adsorption capacities (Y2 and Y4), the presence of curves is negligible, particularly for Y4. In the context of enhancing removal rates, it is advisable to seek lower values for B (< [MB] = 25 mg L-1) and higher values for C (m > 0.15 g). Conversely, the opposite is true for both materials if one aims at increasing adsorption capacities. The distribution of the data is apparently normal, as illustrated in Figure S1. For further insight into residual diagnostics, Q-Q plot analysis, and the relationship between residuals and fitted values, please refer to Figure S1. For the analysis of model performance, including absolute error distributions and statistical metrics, please refer to Figure S2.
3.2. Kinetics and isotherm modeling
The equilibrium adsorption capacity of the RH biochars for MB were evaluated by adsorption kinetic study. The effect of the contact time on the removal of MB by RH biochar is shown in Figure 3. For RH500, a minimum of 6 h was required to attain the adsorption equilibrium for N0 conditions (pH = 8, [MB]0 = 50 mg L-1, mass = 0.10 g), and 8 h for N2 conditions (pH = 9, [MB]0 = 25 mg L-1, mass = 0.05 g). For RH700, again a minimum of 6 h was required for N0 conditions, but 2 h was enough for N2 conditions. These results are similar to those obtained by Gülen et al. [46], which used sumac leaves for MB adsorption and found adsorption capacity values between 0.85 to 3.20 mg g-1. Equilibrium was reached at 30 min. Higher adsorption capacity for MB was achieved by using carbonized chestnut shell (5.13 mg g-1), but the equilibrium was only reached at 120 min [47].
The RH700 sample exhibits faster initial adsorption, suggesting higher accessibility of external or mesoporous sites. However, RH550 reaches a higher equilibrium capacity, which may indicate a larger contribution of microporous adsorption domains and stronger intraparticle diffusion limitations.

Table 3.
Kinetic parameters calculated for MB removal for RH550 and RH700.
| Experiment no. | Material | Model | Parameter | Value | MSE |
| N0 | RH550 | PFO | qe (mg g-1) k1 (h-1) |
3.15 3.38 |
0.17 |
| PSO | qe (mg g-1) k2 (g mg-1 h-1) |
3.39 1.58 |
0.08 | ||
| Elovich | α (mg g-1 h-1) β (g mg-1) |
90.59 1.97 |
0.02 | ||
| RH700 | PFO | qe (mg g-1) k1 (h-1) |
3.02 11.35 |
0.07 | |
| PSO | qe (mg g-1) k2 (g mg-1 h-1) |
3.18 5.34 |
0.02 | ||
| Elovich | α (mg g-1 h-1) | 6,441 | 0.003 | ||
| β (g mg-1) | 3.58 | ||||
| N2 | RH550 | PFO | qe (mg g-1) k1 (h-1) |
4.28 0.93 |
0.41 |
| PSO | qe (mg g-1) k2 (g mg-1 h-1) |
4.70 0.30 |
0.25 | ||
| Elovich | α (mg g-1 h-1) β (g mg-1) |
19.85 1.19 |
0.10 | ||
| RH700 | PFO | qe (mg g-1) k1 (h-1) |
2.40 14.56 |
0.06 | |
| PSO | qe (mg g-1) k2 (g mg-1 h-1) |
2.54 8.11 |
0.03 | ||
| Elovich | α (mg g-1 h-1) β (g mg-1) |
5,755 4.38 |
0.006 |
The equilibrium adsorption data for MB were fitted using several classical and hybrid isotherm models, including Langmuir, Freundlich, Temkin, Sips, Redlich–Peterson, Toth, and Jovanovic (Figure 4). The corresponding parameters and fitting statistics (R2, RMSE, AIC, and BIC) are summarized in Table 4.
Among the tested models, the Toth and Redlich–Peterson isotherms exhibited the best performance, with the highest correlation coefficients (R2 ≈ 0.976) and the lowest RMSE and AIC values. These results indicate that MB adsorption occurs predominantly on a heterogeneous surface with finite active sites, combining features of both monolayer and multilayer adsorption. The Toth model, with t = 0.262 (< 1), reflects a strong surface heterogeneity, which is typical for biochars produced from agricultural residues. Similar behavior has been reported for the adsorption of reactive dyes onto biochar derived from Turbinaria conoides biomass (t = 0.579), where varied pore sizes and diverse surface functionalities lead to non-ideal adsorption energies [48].
The applicability of the Toth model has also been confirmed for the removal of reactive red 22 using biochar, activated biochar, and commercial activated carbon, for which t values below 1 were obtained (0.92, 0.85, and 0.95, respectively), indicating heterogeneous adsorption sites [49]. However, this trend does not apply to all biochars. For instance, during the adsorption of the cationic dyes Basic Blue 41 and Basic Red 09 onto biochar produced from rice-husk agricultural waste, the parameter t was as high as ~2, and other isotherm models provided better fits [50].
The Redlich–Peterson model, which combines elements of both the Langmuir and Freundlich equations, also showed an excellent fit (R2 ≈ 0.976). The parameter g = 0.766 indicates that the adsorption process is dominated by chemisorption, and the closer the value is to 1, the closer it is to the Langmuir isotherm. The same value of g was reported for the adsorption of indigotine blue onto passion fruit peel biochar, where the model yielded a similar correlation coefficient (R2 = 0.973) [51].
In contrast, the Langmuir model produced a slightly lower correlation (R2 = 0.931), suggesting that although monolayer adsorption occurs at homogeneous sites, it does not fully represent the surface complexity of the studied biochar. The calculated maximum adsorption capacity (qmax = 28.1 mg g-1) is higher than values typically reported for biochars derived from pine wood (3.99 mg g-1), pig manure (16.30 mg g-1), and paper sludge (1.66 mg g-1); comparable to that of pig-manure microparticles (25 mg g-1); but lower than that obtained for activated carbon (48.30 mg g-1)[52]. The results obtained here for rice husk biochar are also superior to those for biochar derived from wheat straw (12.03 mg g-1) and for straw-sediment biochar, lanthanum-modified attapulgite biochar, and nano-zero-valent-iron-modified-biochar, which exhibited qmax values of 2.79, 3.36, and 3.70 mg g-1, respectively [53].
Modifications in biochar derived from wheat straw, however, have been shown to greatly enhance adsorption capacities—from qmax = 24.40 mg g-1 (biochar) to 112.66 mg g-1 (biochar with biomass fly ash) and up to 122.15 mg g-1 at a 9:1 biomass-to-fly-ash ratio [54]. Similarly, pure biochar (PBC) from corn straw exhibited qmax = 14.35 mg g-1, whereas ball-milled nano-silica-modified biochar without alkali activation (SBC) reached 81.32 mg g-1, the alkali-activated PBC (PBC-KOH) achieved 121.09 mg g-1, and the nano-silica-biochar composite with alkali activation (NSBC-30) reached 199.03 mg g-1 [55]. Depending on the modification method, ball-milling can also increase the adsorption capacity of rice-straw biochar to 40.66 mg g-1, and further to 50.27 mg g-1 when temperature rises from 20 to 40 ºC [56]. These results demonstrate that RH700 presents attractive performance even in its unmodified form, outperforming most unmodified biochars, yet it also holds strong potential for future modification to enhance its adsorption capacity.
The Freundlich model also provided a good fit (R2 = 0.961; n = 3.125), indicating favorable adsorption (1/n < 1) on a heterogeneous surface with sites of varying adsorption energy [57,58]. Values of n > 1 suggest cooperative interactions between adsorbed molecules and a high affinity between MB and the biochar surface [59]. This type of behavior has been reported for MB adsorption on sawdust-based biochar modified by ammonia and on ball-milled rice straw biochar, where oxygenated functional groups and aromatic domains promote electrostatic attraction and π–π interactions [59].
Overall, the comparison among these models reinforces that MB adsorption on the studied biochars is governed by heterogeneous physisorption, involving multiple types of active sites and interaction mechanisms. The convergence of the Toth and Redlich–Peterson models towards high accuracy demonstrates their versatility in describing real adsorption systems, where both monolayer coverage and energetic heterogeneity coexist.
5. Conclusions
The full factorial design based on two levels and three factors was used to determine the influence of the solution pH (7–9), the initial MB concentration (25–75 mg L-1) and the adsorbent mass (0.05–0.15 g) on removal efficiency (%). Based on the statistical analysis, the normal plot indicates that the predicted values of the percentage removal of MB and the experimental data were in good agreement. The most significant parameter affecting the removal efficiency (%) of MB by both biochars was found to be the interaction between the initial concentration and the adsorbent mass. This interaction exhibited a possible influence on the removal efficiency, meaning that simultaneous increases in both initial concentration and adsorbent dosage increase MB removal when compared to their individual effects.
The highest removal percentage of MB in this study was obtained for RH700 using a MB solution initially adjusted at a pH of 9 and an initial MB concentration of 150 mg L-1. Under these optimal conditions, the removal efficiency reached 99.36%, corresponding to a residual MB concentration of 0.16 mg L-1 in the treated solution.
Equilibrium studies revealed that the contact time required to reach adsorption equilibrium varied depending on the biochar type and experimental conditions. For RH550, equilibrium was attained after 6 h under the central condition (pH 8, [MB]0 = 50 mg L-1, m = 0.10 g) and 8 h under the most favorable adsorption conditions (pH 9, [MB]0 = 25 mg L-1, m = 0.05 g). For RH700, equilibrium was achieved after 6 h for the central condition and only 2 h for the best-performing condition.
Isotherm modeling indicated that the experimental data were best described by the Toth and Redlich–Peterson models (R2 ≈ 0.976), confirming the predominance of heterogeneous adsorption on surfaces with energetically diverse sites.
Overall, these results demonstrate that rice husk biochar, particularly RH700, is an efficient, low-cost, and sustainable adsorbent for MB removal, exhibiting rapid equilibrium, high adsorption capacity, and heterogeneous surface characteristics that favor the physisorption of cationic dyes.
Supplementary Materials
The following supporting information can be downloaded at the website of this paper posted on Preprints.org, Figure S1: title; Table S1: title; Video S1: title.
Author Contributions
Conceptualization, L.G.A. and S.N.G.; methodology, L.G.A. and S.N.G.; formal analysis, L.G.A. and T.T.S.; investigation, L.G.A. and T.T.S.; resources, J.T.M.; data curation, L.G.A. and T.T.S.; writing—original draft preparation, L.G.A., T.T.S. and S.N.G.; writing—review and editing, L.G.A. and S.N.G.; visualization, L.G.A.; supervision, S.N.G.; funding acquisition, S.N.G. All authors have read and agreed to the published version of the manuscript.
Funding
This research received no external funding.
Informed Consent Statement
Not applicable.
Data Availability Statement
The original contributions presented in this study are included in the article/supplementary material. Further inquiries can be directed to the corresponding author(s).
Acknowledgments
The authors gratefully acknowledge Dr. Ondrej Masek from the UK Biochar Research Centre (University of Edinburgh) for kindly providing the biochars samples used in this study.
Conflicts of Interest
The authors declare no conflicts of interest.
References
- Sudarshan, S.; Harikrishnan, S.; RathiBhuvaneswari, G.; Alamelu, V.; Aanand, S.; Rajasekar, A.; Govarthanan, M. Impact of Textile Dyes on Human Health and Bioremediation of Textile Industry Effluent Using Microorganisms: Current Status and Future Prospects. J. Appl. Microbiol. 2023, 134, lxac064. [Google Scholar] [CrossRef] [PubMed]
- Negi, A. Environmental Impact of Textile Materials: Challenges in Fiber–Dye Chemistry and Implication of Microbial Biodegradation. Polymers 2025, 17, 871. [Google Scholar] [CrossRef] [PubMed]
- Abbas, M.; Trari, M. Kinetic, Equilibrium and Thermodynamic Study on the Removal of Congo Red from Aqueous Solutions by Adsorption onto Apricot Stone. Process Saf. Environ. Prot. 2015, 98, 424–436. [Google Scholar] [CrossRef]
- Ogunlaja, A.; Nwankwo, I.N.; Omaliko, M.E.; Olukanni, O.D. Biodegradation of Methylene Blue as an Evidence of Synthetic Dyes Mineralization during Textile Effluent Biotreatment by Acinetobacter Pittii. Environ. Process. 2020, 7, 931–947. [Google Scholar] [CrossRef]
- Hou, J.; Chen, Y.; Shi, W.; Bao, C.; Hu, X. Graphene Oxide/Methylene Blue Composite Membrane for Dyes Separation: Formation Mechanism and Separation Performance. Appl. Surf. Sci. 2020, 505, 144145. [Google Scholar] [CrossRef]
- Saja, S.; Bouazizi, A.; Achiou, B.; Ouaddari, H.; Karim, A.; Ouammou, M.; Aaddane, A.; Bennazha, J.; Alami Younssi, S. Fabrication of Low-Cost Ceramic Ultrafiltration Membrane Made from Bentonite Clay and Its Application for Soluble Dyes Removal. J. Eur. Ceram. Soc. 2020, 40, 2453–2462. [Google Scholar] [CrossRef]
- Le, O.T.H.; Tran, L.N.; Doan, V.T.; Pham, Q.V.; Ngo, A.V.; Nguyen, H.H. Mucilage Extracted from Dragon Fruit Peel ( Hylocereus Undatus ) as Flocculant for Treatment of Dye Wastewater by Coagulation and Flocculation Process. Int. J. Polym. Sci. 2020, 2020, 1–9. [Google Scholar] [CrossRef]
- Dutta, K.; Mukhopadhyay, S.; Bhattacharjee, S.; Chaudhuri, B. Chemical Oxidation of Methylene Blue Using a Fenton-like Reaction. J. Hazard. Mater. 2001, 84, 57–71. [Google Scholar] [CrossRef] [PubMed]
- Elango, G.; Roopan, S.M. Efficacy of SnO 2 Nanoparticles toward Photocatalytic Degradation of Methylene Blue Dye. J. Photochem. Photobiol. B Biol. 2016, 155, 34–38. [Google Scholar] [CrossRef] [PubMed]
- Fadillah, G.; Saleh, T.A.; Wahyuningsih, S.; Ninda Karlina Putri, E.; Febrianastuti, S. Electrochemical Removal of Methylene Blue Using Alginate-Modified Graphene Adsorbents. Chem. Eng. J. 2019, 378, 122140. [Google Scholar] [CrossRef]
- Rizqi, H.D.; Purnomo, A.S. The Ability of Brown-Rot Fungus Daedalea Dickinsii to Decolorize and Transform Methylene Blue Dye. World J. Microbiol. Biotechnol. 2017, 33, 92. [Google Scholar] [CrossRef] [PubMed]
- Li, M.; Wang, X.; Porter, C.J.; Cheng, W.; Zhang, X.; Wang, L.; Elimelech, M. Concentration and Recovery of Dyes from Textile Wastewater Using a Self-Standing, Support-Free Forward Osmosis Membrane. Environ. Sci. Technol. 2019, 53, 3078–3086. [Google Scholar] [CrossRef] [PubMed]
- Guilhen, S.N.; Silva, T.T.; De Sousa, G.E.Z.; Borrely, S.I.; De Araujo, L.G. Integrated Experimental and Machine Learning Approach for Reactive Black 5 Removal Using Straw-Derived Biochars. Int. J. Env. Res. 2026, 20, 49. [Google Scholar] [CrossRef]
- Sutar, S.; Patil, P.; Jadhav, J. Recent Advances in Biochar Technology for Textile Dyes Wastewater Remediation: A Review. Environ. Res. 2022, 209, 112841. [Google Scholar] [CrossRef] [PubMed]
- Toor, M.; Jin, B. Adsorption Characteristics, Isotherm, Kinetics, and Diffusion of Modified Natural Bentonite for Removing Diazo Dye. Chem. Eng. J. 2012, 187, 79–88. [Google Scholar] [CrossRef]
- Shehata, A.M.A. Removal of Methylene Blue Dye from Aqueous Solutions by Using Treated Animal Bone as a Cheap Natural Adsorbent. Int. J. Emerg. Technol. Adv. Eng. 2013, 3, 507–513. [Google Scholar]
- Mishra, G.; Tripathy, M. A Critical Review of the Treatment for Decolorization of Dye Wastewater. Colourage 1993, 40, 35–38. [Google Scholar]
- Eren, E. Investigation of a Basic Dye Removal from Aqueous Solution onto Chemically Modified Unye Bentonite. J. Hazard. Mater. 2009, 166, 88–93. [Google Scholar] [CrossRef] [PubMed]
- Ghasemi, J.; Asadpour, S. Thermodynamics’ Study of the Adsorption Process of Methylene Blue on Activated Carbon at Different Ionic Strengths. J. Chem. Thermodyn. 2007, 39, 967–971. [Google Scholar] [CrossRef]
- Bleicher, R.J.; Kloth, D.D.; Robinson, D.; Axelrod, P. Inflammatory Cutaneous Adverse Effects of Methylene Blue Dye Injection for Lymphatic Mapping/Sentinel Lymphadenectomy. J. Surg. Oncol. 2009, 99, 356–360. [Google Scholar] [CrossRef] [PubMed]
- Liu, Y.; Kang, Y.; Mu, B.; Wang, A. Attapulgite/Bentonite Interactions for Methylene Blue Adsorption Characteristics from Aqueous Solution. Chem. Eng. J. 2014, 237, 403–410. [Google Scholar] [CrossRef]
- Roosta, M.; Ghaedi, M.; Daneshfar, A.; Sahraei, R. Experimental Design Based Response Surface Methodology Optimization of Ultrasonic Assisted Adsorption of Safaranin O by Tin Sulfide Nanoparticle Loaded on Activated Carbon. Spectrochim. Acta Part A Mol. Biomol. Spectrosc. 2014, 122, 223–231. [Google Scholar] [CrossRef] [PubMed]
- Roosta, M.; Ghaedi, M.; Daneshfar, A.; Sahraei, R.; Asghari, A. Optimization of the Ultrasonic Assisted Removal of Methylene Blue by Gold Nanoparticles Loaded on Activated Carbon Using Experimental Design Methodology. Ultrason. Sonochemistry 2014, 21, 242–252. [Google Scholar] [CrossRef] [PubMed]
- Ghaedi, M.; Larki, H.A.; Kokhdan, S.N.; Marahel, F.; Sahraei, R.; Daneshfar, A.; Purkait, M.K. Synthesis and Characterization of Zinc Sulfide Nanoparticles Loaded on Activated Carbon for the Removal of Methylene Blue. Environ. Prog. Sustain. Energy 2013, 32, 535–542. [Google Scholar]
- Ghaedi, M.; Ghaedi, A.M.; Hossainpour, M.; Ansari, A.; Habibi, M.H.; Asghari, A.R. Least Square-Support Vector (LS-SVM) Method for Modeling of Methylene Blue Dye Adsorption Using Copper Oxide Loaded on Activated Carbon: Kinetic and Isotherm Study. J. Ind. Eng. Chem. 2014, 20, 1641–1649. [Google Scholar] [CrossRef]
- Parshetti, G.K.; Chowdhury, S.; Balasubramanian, R. Hydrothermal Conversion of Urban Food Waste to Chars for Removal of Textile Dyes from Contaminated Waters. Bioresour. Technol. 2014, 161, 310–319. [Google Scholar] [CrossRef] [PubMed]
- Zhang, X.; Wang, H.; He, L.; Lu, K.; Sarmah, A.; Li, J.; Bolan, N.S.; Pei, J.; Huang, H. Using Biochar for Remediation of Soils Contaminated with Heavy Metals and Organic Pollutants. Environ. Sci. Pollut. Res. 2013, 20, 8472–8483. [Google Scholar] [CrossRef] [PubMed]
- Mohan, D.; Sarswat, A.; Ok, Y.S.; Pittman, C.U. Organic and Inorganic Contaminants Removal from Water with Biochar, a Renewable, Low Cost and Sustainable Adsorbent—A Critical Review. Bioresour. Technol. 2014, 160, 191–202. [Google Scholar] [CrossRef] [PubMed]
- Sohi, S.P.; Krull, E.; Lopez-Capel, E.; Bol, R. A Review of Biochar and Its Use and Function in Soil; 2010; pp. 47–82. [Google Scholar]
- Jamaludin, N.; Rashid, S.A.; Tan, T. Natural Biomass as Carbon Sources for the Synthesis of Photoluminescent Carbon Dots. In Synthesis, Technology and Applications of Carbon Nanomaterials; Elsevier, 2019; pp. 109–134. [Google Scholar]
- Maroušek, J.; Trakal, L. Techno-Economic Analysis Reveals the Untapped Potential of Wood Biochar. Chemosphere 2022, 291, 133000. [Google Scholar] [CrossRef] [PubMed]
- Lin, T.; Meng, F.; Zhang, M.; Liu, Q. Effects of Different Low Temperature Pretreatments on Properties of Corn Stover Biochar for Precursors of Sulfonated Solid Acid Catalysts. Bioresour. Technol. 2022, 357, 127342. [Google Scholar] [CrossRef] [PubMed]
- Liu, Y.; Wang, M.; Yin, S.; Xie, L.; Qu, X.; Fu, H.; Shi, Q.; Zhou, F.; Xu, F.; Tao, S.; et al. Comparing Photoactivities of Dissolved Organic Matter Released from Rice Straw-Pyrolyzed Biochar and Composted Rice Straw. Environ. Sci. Technol. 2022, 56, 2803–2815. [Google Scholar] [CrossRef] [PubMed]
- Guilhen, S.N.; Watanabe, T.; Silva, T.T.; Rovani, S.; Marumo, J.T.; Tenório, J.A.S.; Mašek, O.; Araujo, L.G. de Role of Point of Zero Charge in the Adsorption of Cationic Textile Dye on Standard Biochars from Aqueous Solutions: Selection Criteria and Performance Assessment. Recent Prog. Mater. 2022, 4, 1–1. [Google Scholar] [CrossRef]
- Chen, D.; Zhuang, X.; Gan, Z.; Cen, K.; Ba, Y.; Jia, D. Co-Pyrolysis of Light Bio-Oil Leached Bamboo and Heavy Bio-Oil: Effects of Mass Ratio, Pyrolysis Temperature, and Residence Time on the Biochar. Chem. Eng. J. 2022, 437, 135253. [Google Scholar] [CrossRef]
- Guilhen, S.N.; Rovani, S.; de Araujo, L.G.; Tenório, J.A.S.; Mašek, O. Uranium Removal from Aqueous Solution Using Macauba Endocarp-Derived Biochar: Effect of Physical Activation. Environ. Pollut. 2021, 272, 116022. [Google Scholar] [CrossRef] [PubMed]
- Xu, J.; Zhang, Y.; Li, B.; Fan, S.; Xu, H.; Guan, D.-X. Improved Adsorption Properties of Tetracycline on KOH/KMnO4 Modified Biochar Derived from Wheat Straw. Chemosphere 2022, 296, 133981. [Google Scholar] [CrossRef] [PubMed]
- Gul, S.; Whalen, J.K.; Thomas, B.W.; Sachdeva, V.; Deng, H. Physico-Chemical Properties and Microbial Responses in Biochar-Amended Soils: Mechanisms and Future Directions. Agric. Ecosyst. Environ. 2015, 206, 46–59. [Google Scholar] [CrossRef]
- Echeverría, J.C.; Zarranz, I.; Estella, J.; Garrido, J.J. Simultaneous Effect of pH, Temperature, Ionic Strength, and Initial Concentration on the Retention of Lead on Illite. Appl. Clay Sci. 2005, 30, 103–115. [Google Scholar] [CrossRef]
- R Core Team R: A Language and Environment for Statistical Computing. R Foundation for Statistical Computing, 2025.
- Dunn, K. Pid: Process Improvement Using Data 2026. [CrossRef]
- De Araujo, L.G.; Martins, G.F.; Campera, A.A.A.; Marumo, J.T.; Guilhen, S.N. Biosorption of Methylene Blue by Bone Meal: Experimental and Modeling with Machine Learning and Full Factorial Design. Front. Environ. Chem. 2024, 5, 1451051. [Google Scholar] [CrossRef]
- Lagergren, S. Zur Theorie Der Sogenannten Adsorption Geloster Stoffe. K. Sven. Vetenskapsakad. Handl. 1898, 24, 1–39. [Google Scholar]
- Ho, Y.S.; McKay, G. Pseudo-Second Order Model for Sorption Processes. Process Biochem. 1999, 34, 451–465. [Google Scholar] [CrossRef]
- Ponnusami, V.; Krithika, V.; Madhuram, R.; Srivastava, S.N. Biosorption of Reactive Dye Using Acid-Treated Rice Husk: Factorial Design Analysis. J. Hazard. Mater. 2007, 142, 397–403. [Google Scholar] [CrossRef] [PubMed]
- Gülen, J.; Akın, B.; Özgür, M. Ultrasonic-Assisted Adsorption of Methylene Blue on Sumac Leaves. Desalin. Water Treat. 2016, 57, 9286–9295. [Google Scholar] [CrossRef]
- Gülen, J.; İskeçeli, M. Removal of Methylene Blue by Using Porous Carbon Adsorbent Prepared from Carbonized Chestnut Shell. MP 2017, 59, 188–194. [Google Scholar] [CrossRef]
- Vijayaraghavan, K.; Ashokkumar, T. Characterization and Evaluation of Reactive Dye Adsorption onto Biochar Derived from Turbinaria Conoides Biomass. Env. Prog. Sustain Energy 2019, 38, 13143. [Google Scholar] [CrossRef]
- Mongkollertlop, S.; Sookkheo, B. Specific Investigation for Adsorption Nature of Iodine, Reactive Dye or Wastewater Model over Low-Priced Bio-Char Derived from Biomass Waste. Res. Chem. Intermed. 2024, 50, 1013–1032. [Google Scholar] [CrossRef]
- Saravanan, P.; Josephraj, J.; Thillainayagam, B.P.; Ravindiran, G. Evaluation of the Adsorptive Removal of Cationic Dyes by Greening Biochar Derived from Agricultural Bio-Waste of Rice Husk. Biomass Conv. Bioref. 2023, 13, 4047–4060. [Google Scholar] [CrossRef]
- Cabral, L.L.; Bottini, R.C.R.; Gonçalves, A.J.; Junior, M.M.; Rizzo-Domingues, R.C.P.; Lenzi, M.K.; Nagalli, A.; Passig, F.H.; Dos Santos, P.M.; De Carvalho, K.Q. Food Dye Adsorption in Single and Ternary Systems by the Novel Passion Fruit Peel Biochar Adsorbent. Food Chem. 2025, 464, 141592. [Google Scholar] [CrossRef] [PubMed]
- Lonappan, L.; Rouissi, T.; Das, R.K.; Brar, S.K.; Ramirez, A.A.; Verma, M.; Surampalli, R.Y.; Valero, J.R. Adsorption of Methylene Blue on Biochar Microparticles Derived from Different Waste Materials. Waste Manag. 2016, 49, 537–544. [Google Scholar] [CrossRef] [PubMed]
- Liu, Y.; Zhao, X.; Li, J.; Ma, D.; Han, R. Characterization of Bio-Char from Pyrolysis of Wheat Straw and Its Evaluation on Methylene Blue Adsorption. Desalin. Water Treat. 2012, 46, 115–123. [Google Scholar] [CrossRef]
- Li, H.; Kong, J.; Zhang, H.; Gao, J.; Fang, Y.; Shi, J.; Ge, T.; Fang, T.; Shi, Y.; Zhang, R.; et al. Mechanisms and Adsorption Capacities of Ball Milled Biomass Fly Ash/Biochar Composites for the Adsorption of Methylene Blue Dye from Aqueous Solution. J. Water Process Eng. 2023, 53, 103713. [Google Scholar] [CrossRef]
- Liu, J.; Lin, Q.; Gao, J.; Jia, X.; Cai, M.; Liang, Q. Adsorption Properties and Mechanisms of Methylene Blue and Tetracycline by Nano-Silica Biochar Composites Activated by KOH. Chemosphere 2023, 337, 139395. [Google Scholar] [CrossRef] [PubMed]
- Wang, J.; Tan, Y.; Yang, H.; Zhan, L.; Sun, G.; Luo, L. On the Adsorption Characteristics and Mechanism of Methylene Blue by Ball Mill Modified Biochar. Sci. Rep. 2023, 13, 21174. [Google Scholar] [CrossRef] [PubMed]
- Huang, L.; Zeng, G.; Huang, D.; Li, L.; Du, C.; Zhang, L. Biosorption of Cadmium(II) from Aqueous Solution onto Hydrilla Verticillata. Env. Earth Sci. 2010, 60, 1683–1691. [Google Scholar] [CrossRef]
- Kujawska, J.; Wasag, H. Biochar: A Low-Cost Adsorbent of Methylene Blue from Aqueous Solutions. J. Phys. Conf. Ser. 2021, 1736, 012002. [Google Scholar] [CrossRef]
- Hassaan, M.A.; Yılmaz, M.; Helal, M.; El-Nemr, M.A.; Ragab, S.; El Nemr, A. Isotherm and Kinetic Investigations of Sawdust-Based Biochar Modified by Ammonia to Remove Methylene Blue from Water. Sci. Rep. 2023, 13, 12724. [Google Scholar] [CrossRef] [PubMed]
Figure 1.
MB removals and adsorption capacities for RH550 and RH700 (A-D) experimental data; (E-H) average experimental data versus predicted data from the proposed empirical models.
Figure 1.
MB removals and adsorption capacities for RH550 and RH700 (A-D) experimental data; (E-H) average experimental data versus predicted data from the proposed empirical models.
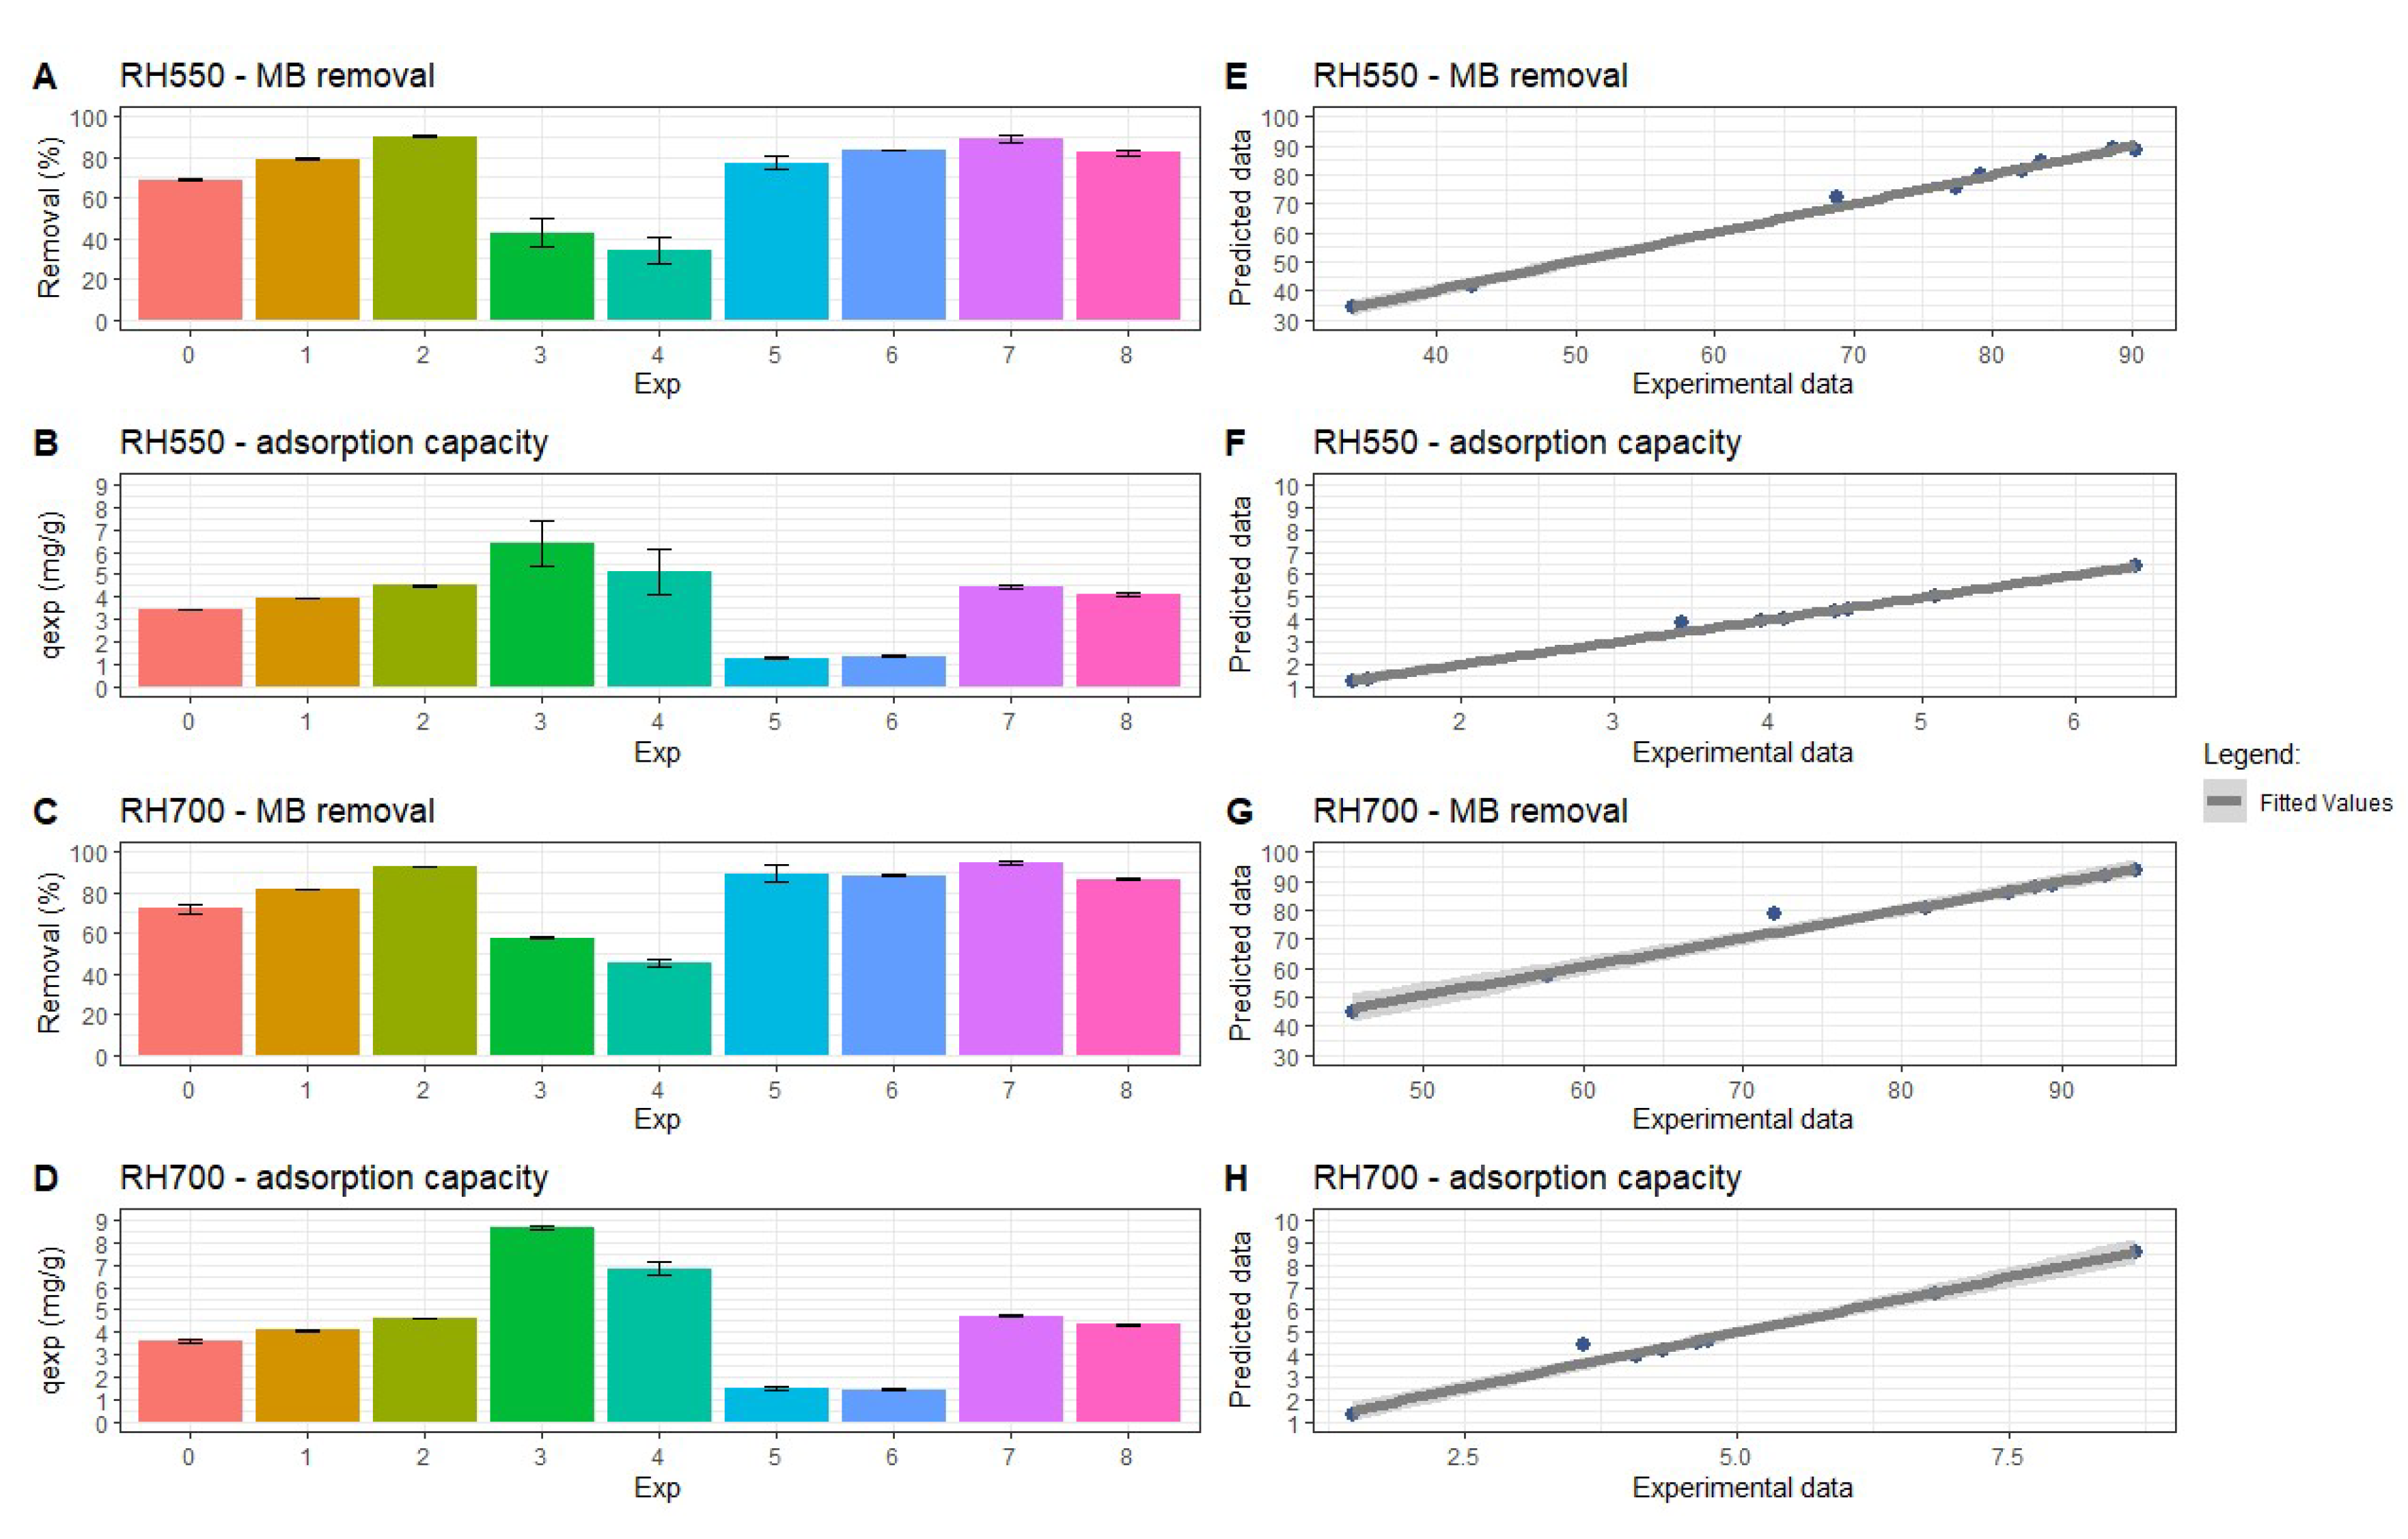
Figure 2.
Pareto plot from the removal of MB by (A) RH550 and (B) RH700 (all effects labeled) Contour plot of the main interaction (B:C) of the adsorption of MB by the RH550 biochar.
Figure 2.
Pareto plot from the removal of MB by (A) RH550 and (B) RH700 (all effects labeled) Contour plot of the main interaction (B:C) of the adsorption of MB by the RH550 biochar.
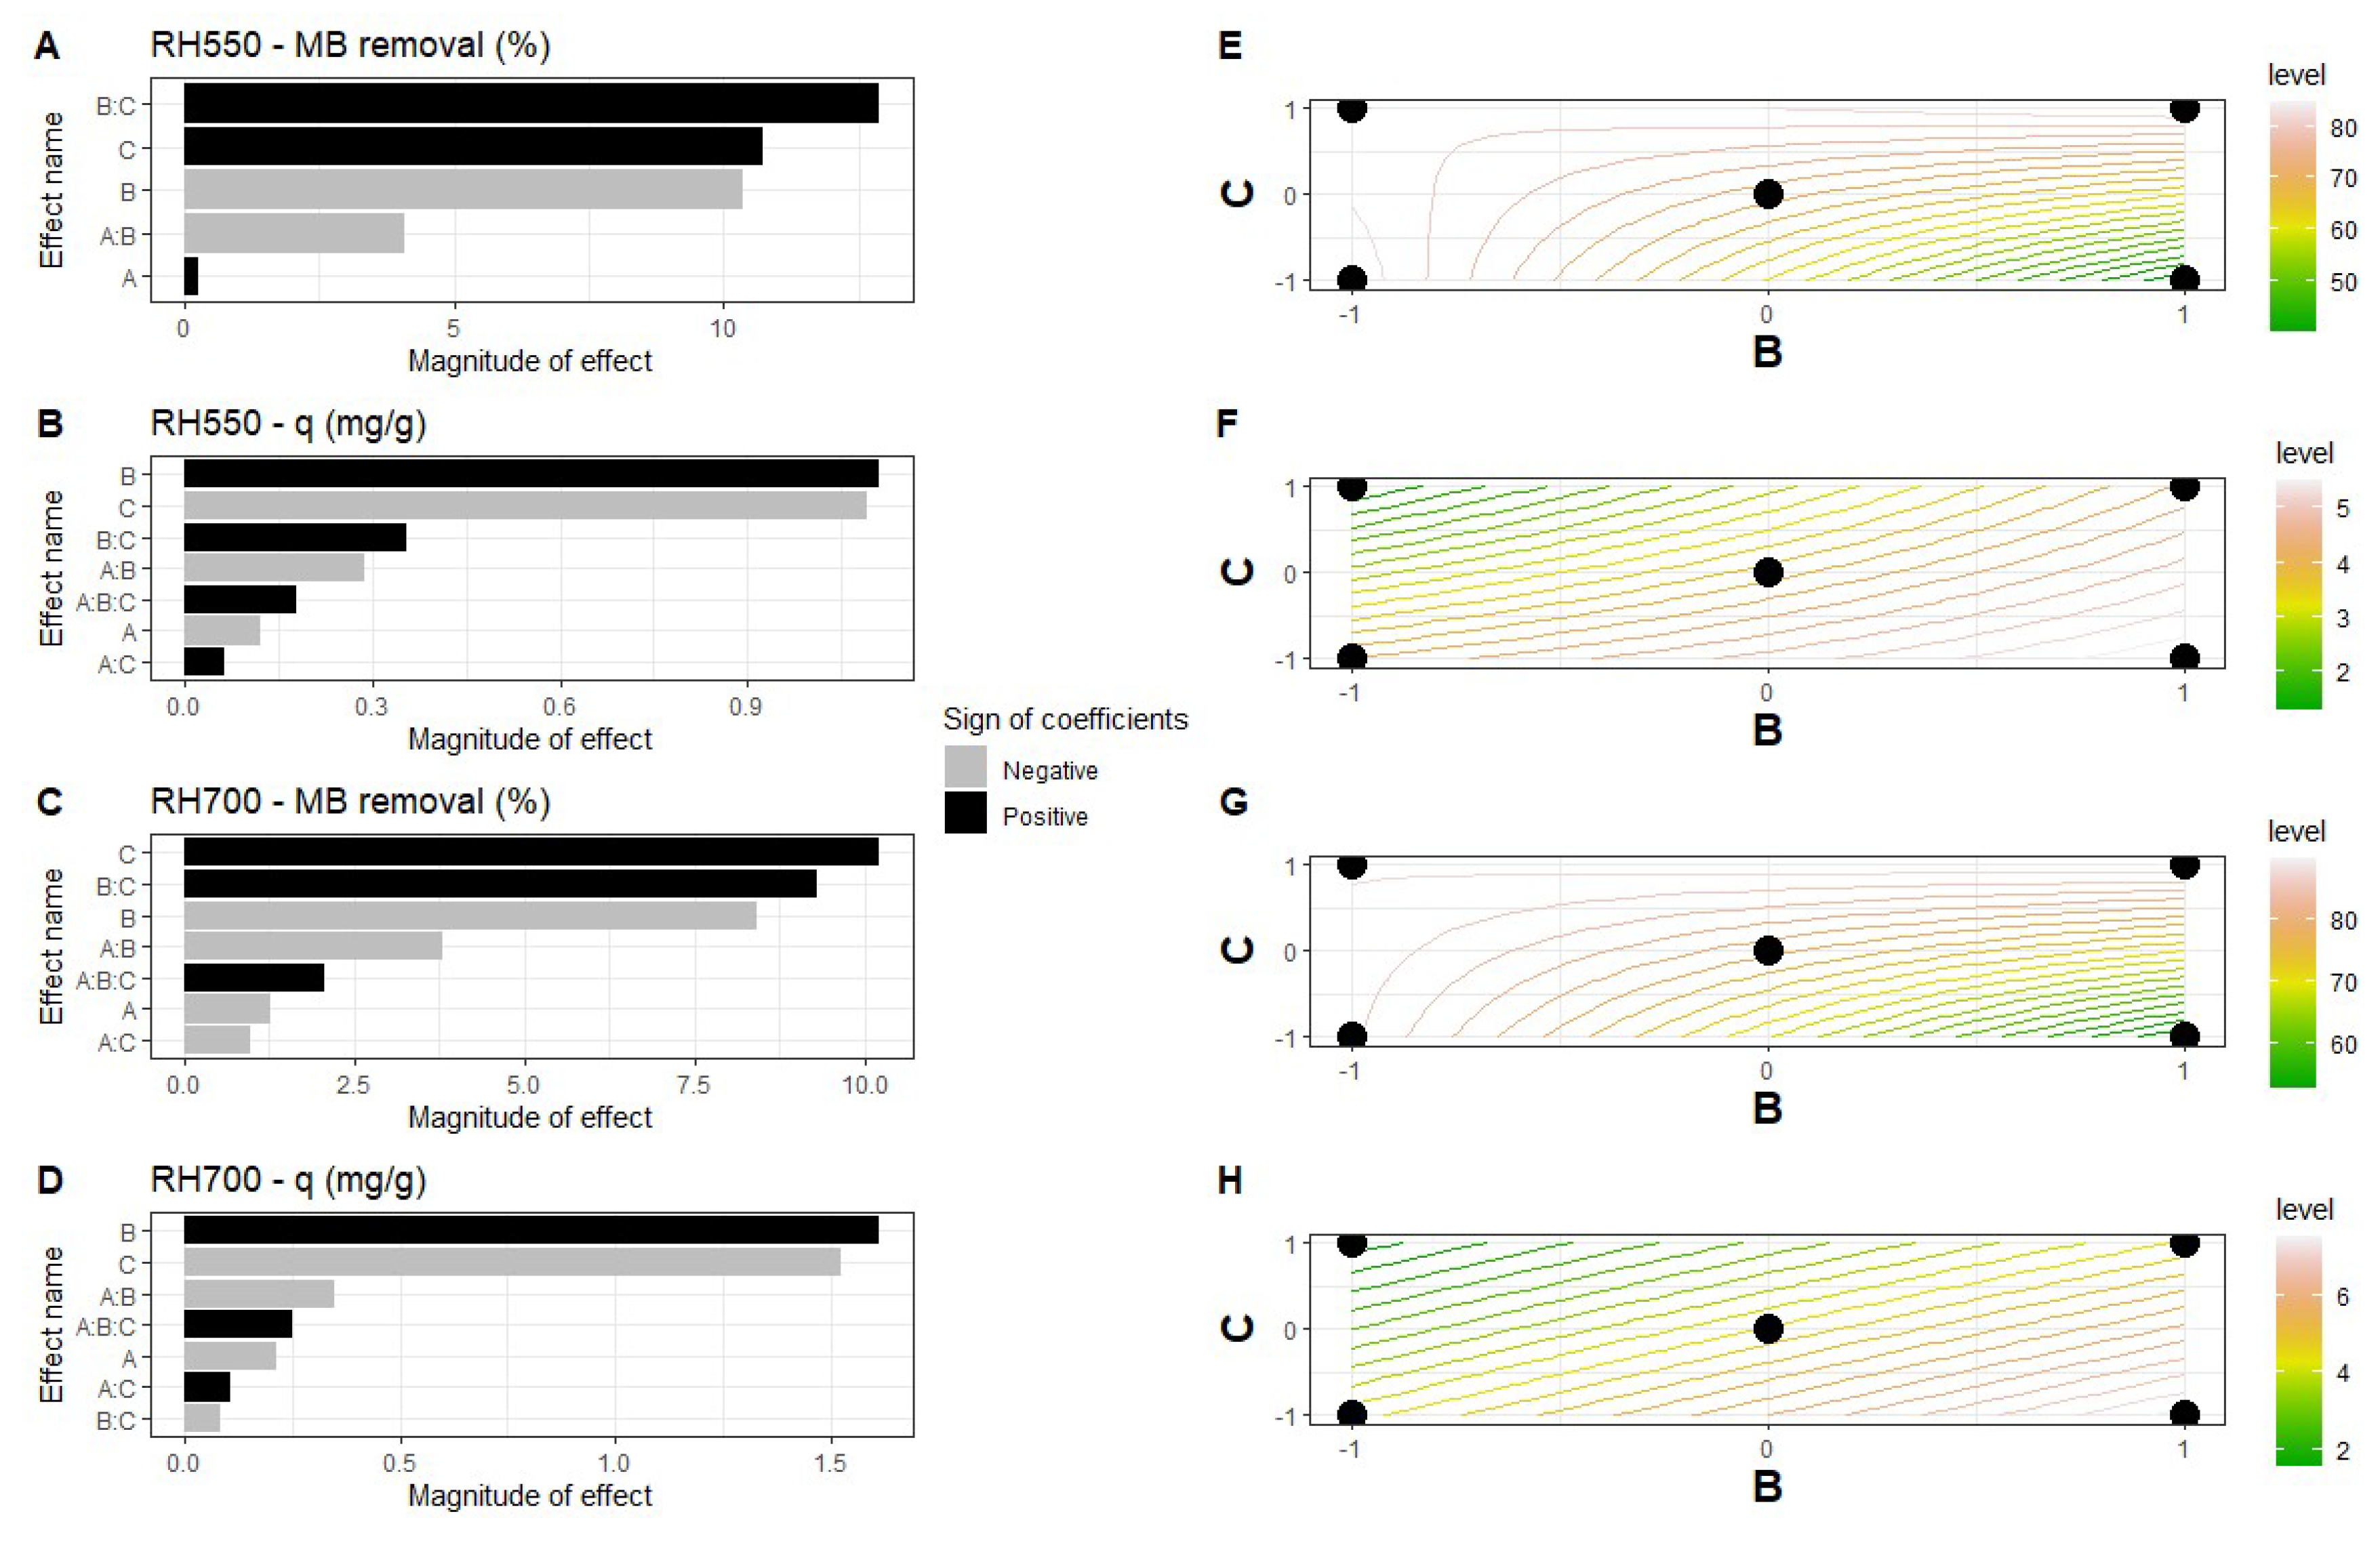
Figure 3.
Experimental kinetics for the removal of methylene blue from aqueous solutions onto (a, b) RH550 and (c, d) RH700.
Figure 3.
Experimental kinetics for the removal of methylene blue from aqueous solutions onto (a, b) RH550 and (c, d) RH700.
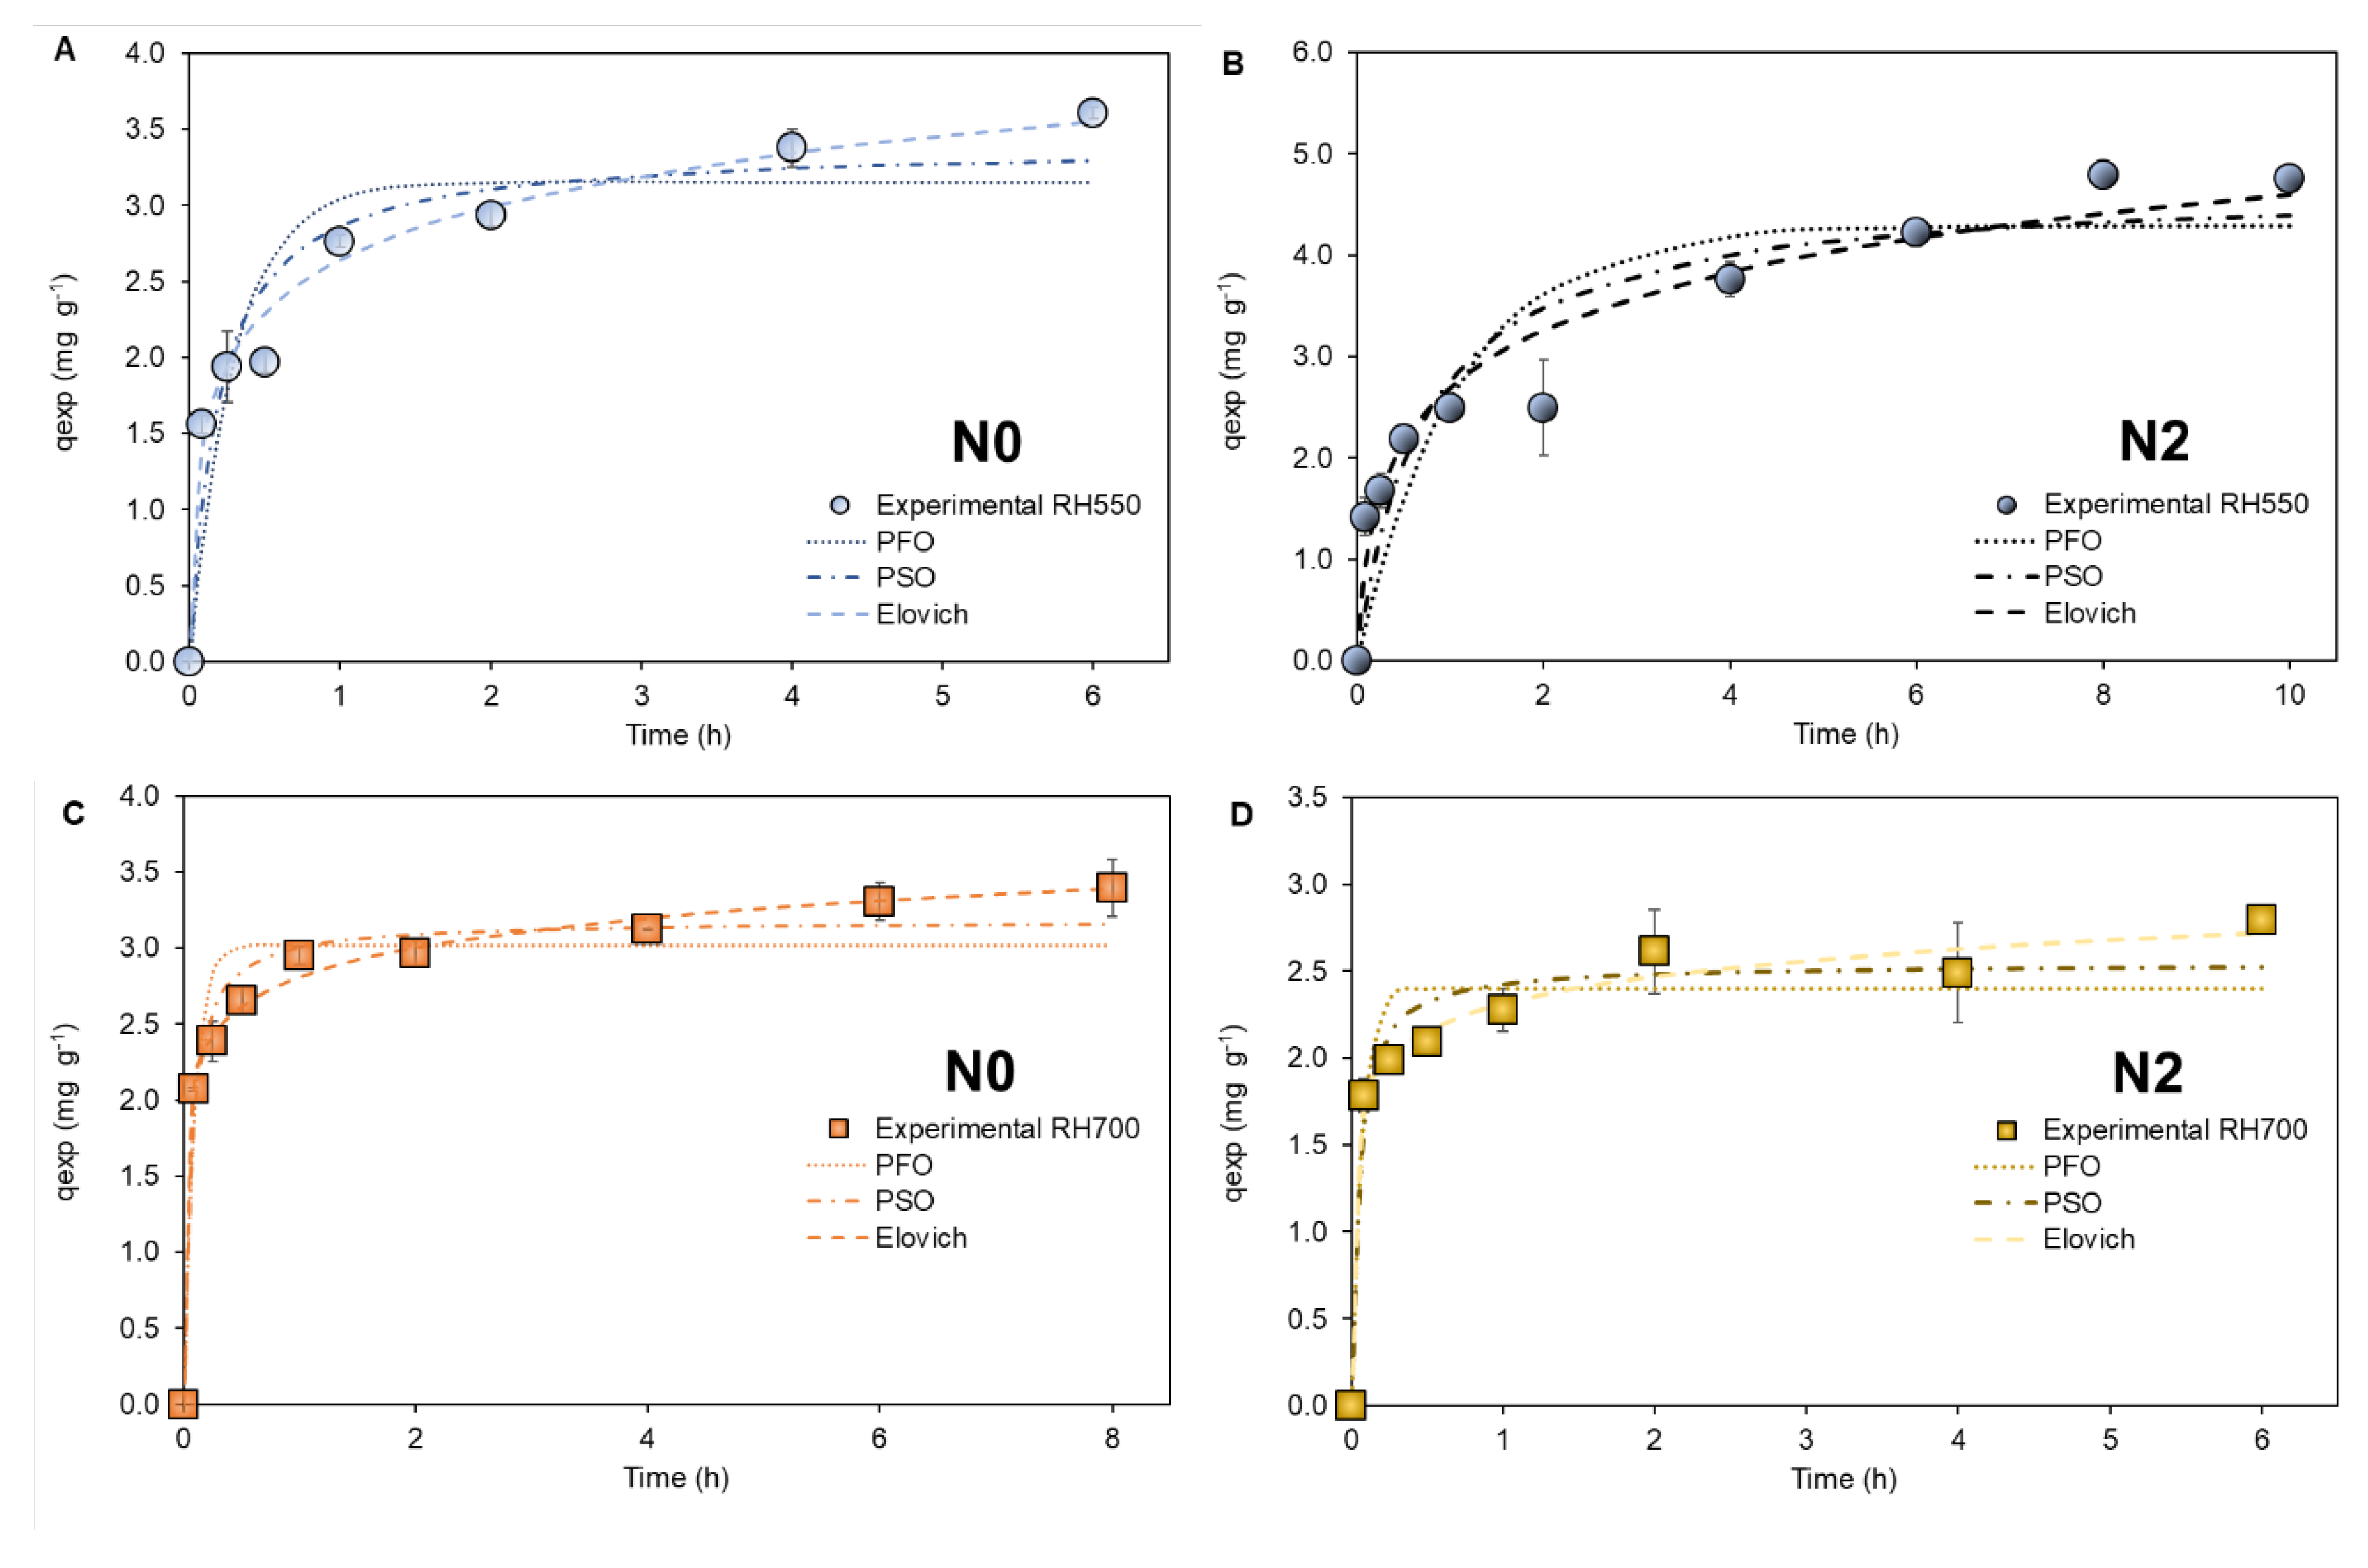
Figure 4.
Experimental and fitted adsorption isotherms for MB removal onto RH700.
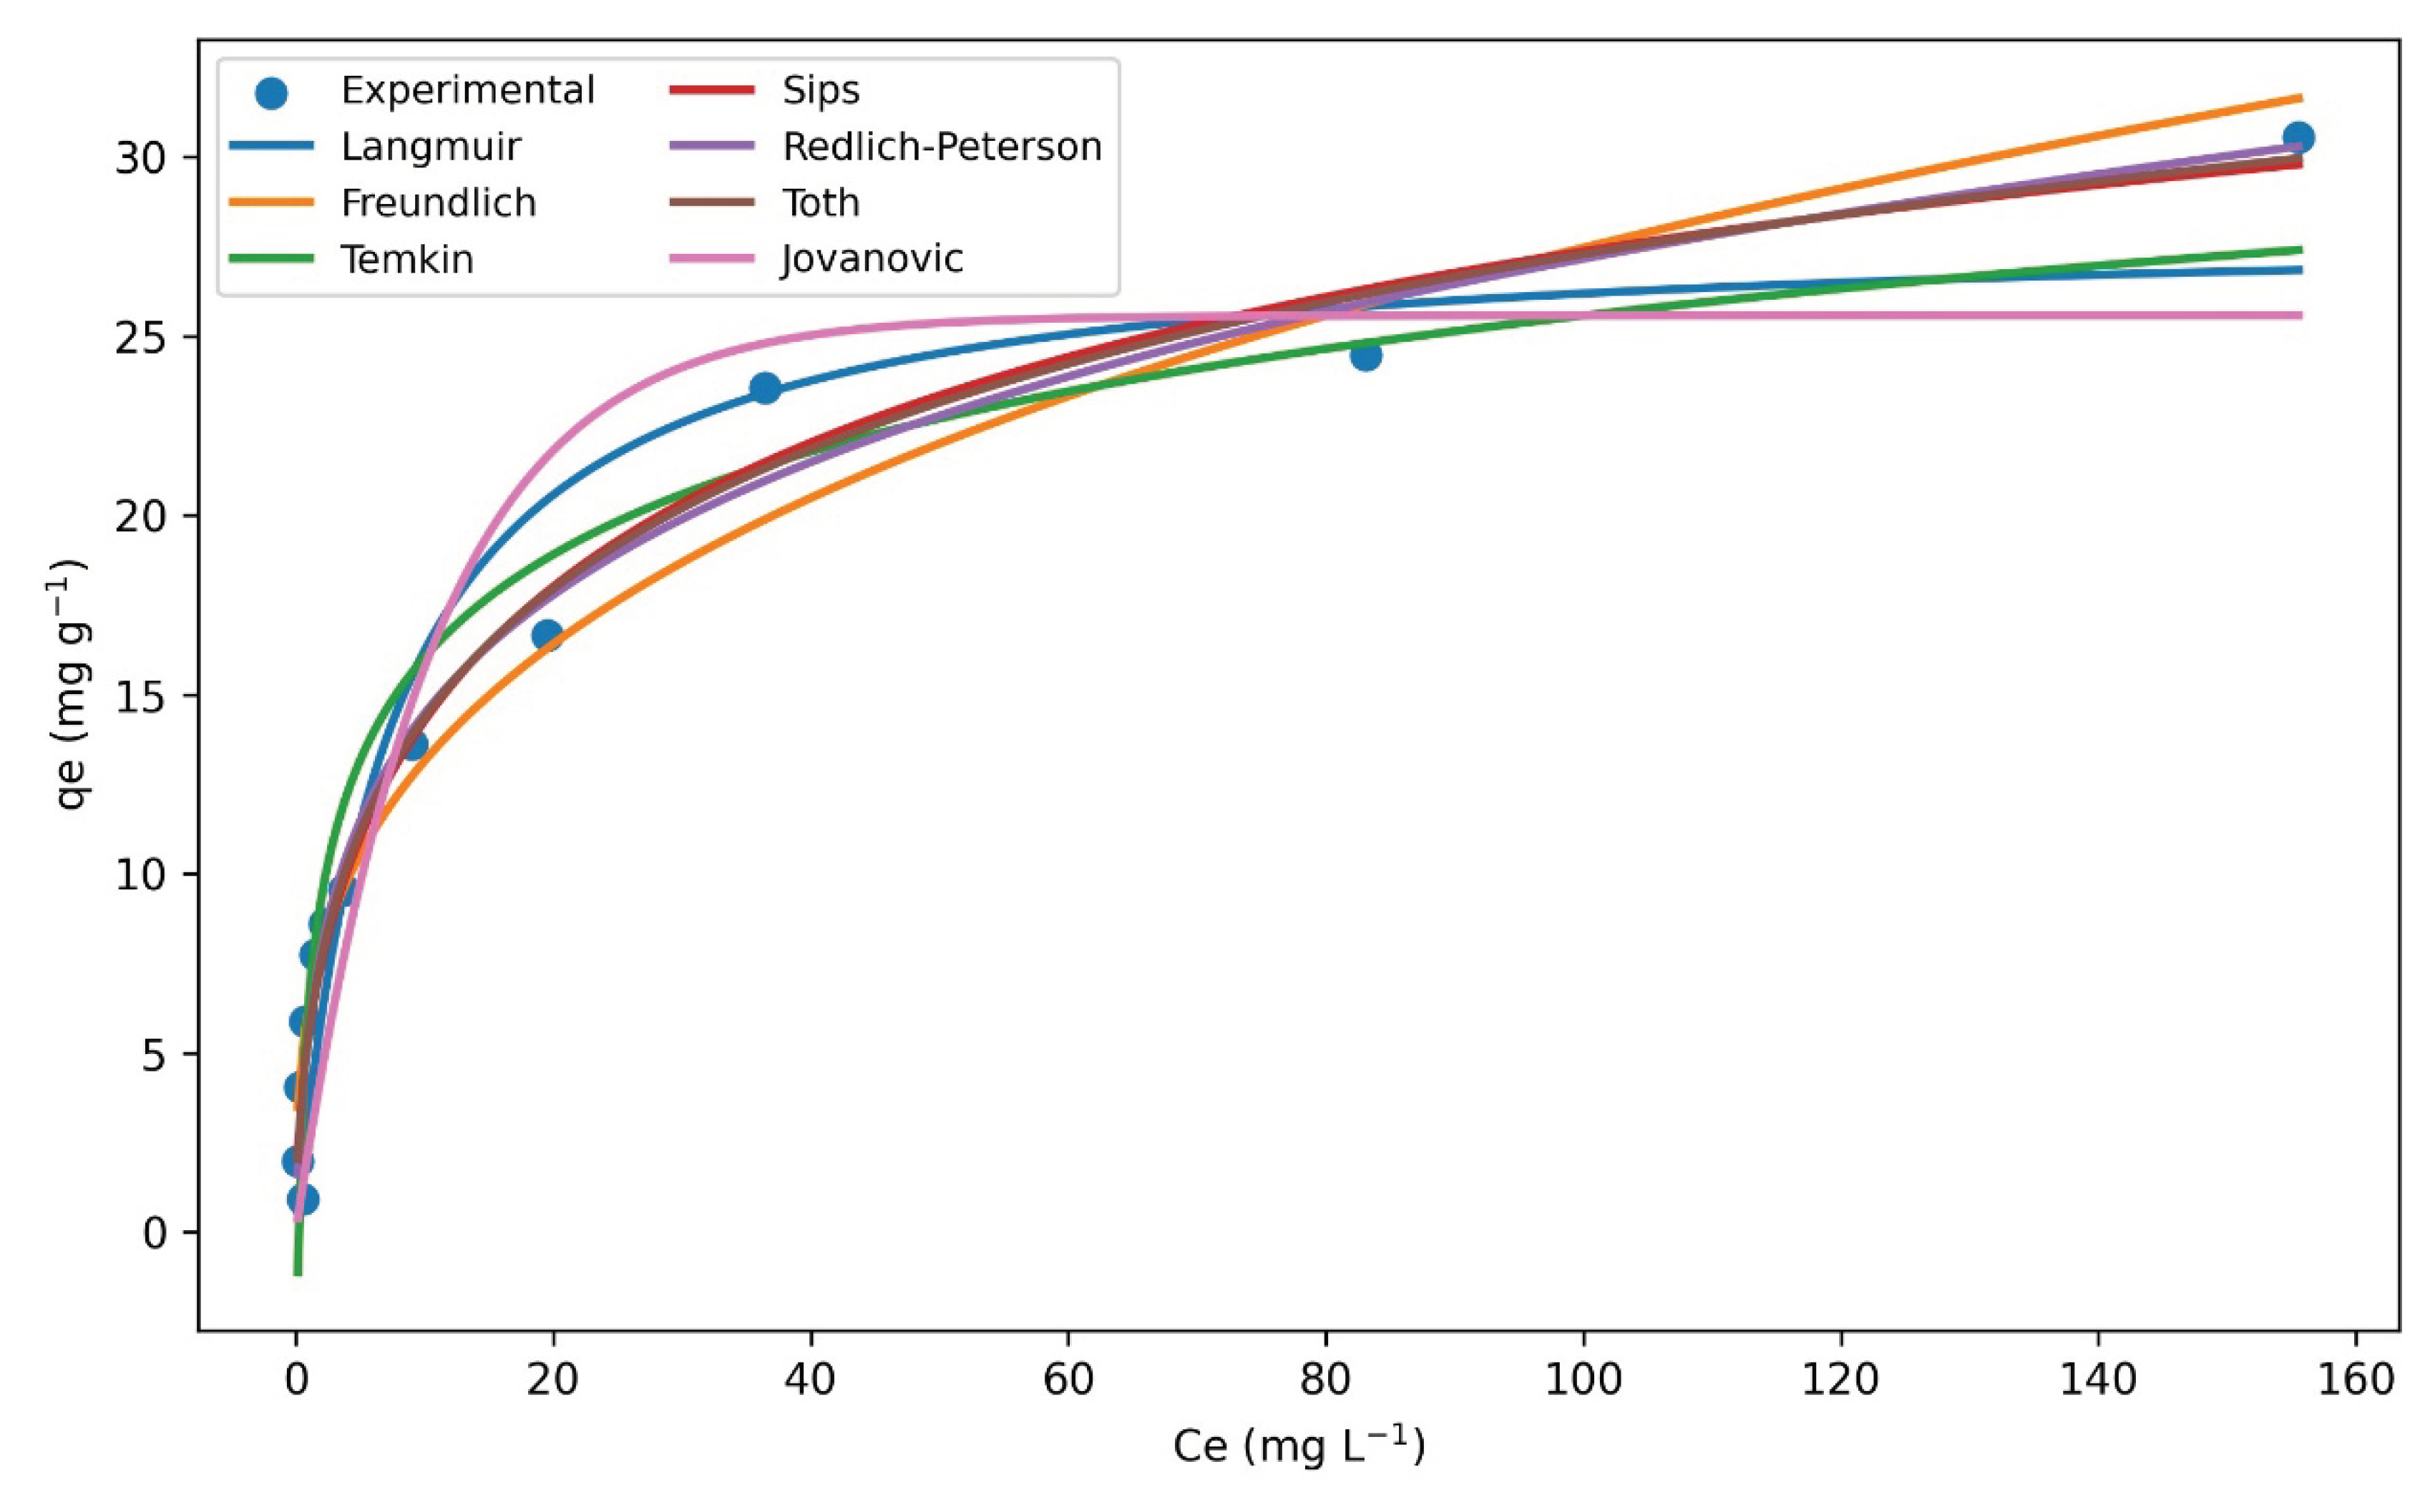
Table 1.
Actual and coded levels for pH, Ci and m in the design matrix.
| Test | pH | Ci (mg L-1) | m (g) |
| 0 | 8 (0) | 50 (0) | 0.10 (0) |
| 1 | 7 (-1) | 25 (-1) | 0.05 (-1) |
| 2 | 9 (+1) | 25 (-1) | 0.05 (-1) |
| 3 | 7 (-1) | 75 (+1) | 0.05 (-1) |
| 4 | 9 (+1) | 75 (+1) | 0.05 (-1) |
| 5 | 7 (-1) | 25 (-1) | 0.15 (+1) |
| 6 | 9 (+1) | 25 (-1) | 0.15 (+1) |
| 7 | 7 (-1) | 75 (+1) | 0.15 (+1) |
| 8 | 9 (+1) | 75 (+1) | 0.15 (+1) |
Table 2.
Response surface models obtained for MB adsorption by RH550 and RH700 with their respective units. Y1: MB removal by RH550, Y2: adsorption capacity for RH550, Y3: MB removal by RH700, Y4: adsorption capacity for RH700. A = pH, B = Ci (mg L-1), C = m (g).
Table 2.
Response surface models obtained for MB adsorption by RH550 and RH700 with their respective units. Y1: MB removal by RH550, Y2: adsorption capacity for RH550, Y3: MB removal by RH700, Y4: adsorption capacity for RH700. A = pH, B = Ci (mg L-1), C = m (g).
| Material | Model equations | |
| RH550 | (6) | |
| (7) | ||
| RH700 | (8) | |
| (9) |
Table 4.
Isotherm model parameters and statistical fitting indicators for the adsorption of MB onto rice husk biochars.
Table 4.
Isotherm model parameters and statistical fitting indicators for the adsorption of MB onto rice husk biochars.
| Model | Parameters | Units | R2 | RMSE | AIC | BIC |
| Langmuir | qmax = 28.111; KL = 0.136 | mg g-1; L mg-1 | 0.931 | 2.416 | 25.176 | 26.145 |
| Freundlich | KF = 6.293; n = 3.125 | (mg g-1)(L mg-1)1/n; dimensionless | 0.961 | 1.812 | 18.264 | 19.234 |
| Temkin | B = 4.141; A = 4.808 | mg g-1; L mg-1 | 0.943 | 2.196 | 22.884 | 23.854 |
| Sips | qmax = 45.369; Ks = 0.022; n = 0.520 | mg g-1; L mg-1; dimensionless | 0.975 | 1.444 | 14.826 | 16.281 |
| Redlich-Peterson | A = 13.882; B = 1.474; g = 0.766 | L g-1; (L mg-1)g; dimensionless | 0.976 | 1.440 | 14.753 | 16.208 |
| Toth | qmax = 70.844; KT = 1.223; t = 0.262 | mg g-1; L mg-1; dimensionless | 0.976 | 1.431 | 14.593 | 16.048 |
| Jovanovic | qm = 25.582; Kj = 0.096 | mg g-1; L mg-1 | 0.881 | 3.176 | 31.735 | 32.705 |
Disclaimer/Publisher’s Note: The statements, opinions and data contained in all publications are solely those of the individual author(s) and contributor(s) and not of MDPI and/or the editor(s). MDPI and/or the editor(s) disclaim responsibility for any injury to people or property resulting from any ideas, methods, instructions or products referred to in the content. |
© 2026 by the authors. Licensee MDPI, Basel, Switzerland. This article is an open access article distributed under the terms and conditions of the Creative Commons Attribution (CC BY) license.
Copyright: This open access article is published under a Creative Commons CC BY 4.0 license, which permit the free download, distribution, and reuse, provided that the author and preprint are cited in any reuse.


