
Submitted:
17 June 2026
Posted:
22 June 2026
You are already at the latest version
Abstract
Lake Sevan, 1242 km² large, is the largest lake in the Caucasus and also Armenia. This mountain lake serves as a natural water reservoir for the Hrazdan River, which is critical for the water supply to the capital Yerevan, and the Ararat Valley, the most important agricultural region of Armenia. The annual outflow from the lake shall not exceed 170 million m³. Agriculture is an important economic sector within the lake’s basin, whereby summer and perennial crops depend on irrigation. This study used remote sensing to map the evapotranspiration of agriculture and other vegetation types to assess, in how far agriculture poses a pressure on the water balance of the lake. From 2023 to 2025, the evapotranspiration averaged across all cropland ranged between 204 mm and 307 mm, which coincides with the low yields of agriculture. During the growing season, evapo-transpiration of summer and permanent crops exceeded precipitation by 4.2 to 4.5 mil-lion m³, which is small compared to the annual outflow of 170 million m³. The annual precipitation exceeded evapotranspiration of cropland, including irrigated cropland. The findings suggest that, under current land use and climatic conditions, agriculture around Lake Sevan does not pose significant pressure on the lake’s water balance and ability to sustain its inflow into Hrazdan River.
Keywords:
mountain lake
; agriculture
; irrigation
; remote sensing
; evapotranspiration
; water resource management
1. Introduction
Globally, mountain regions play a critical role for water supply to neighboring lowlands, as 23% of mountain areas world-wide play an essential role for downstream water supply [1]. In particular, areas with irrigated agriculture often depend on mountain regions for their water supply [2]. Within mountain regions, lakes play a critical role in this water supply from mountain regions to lowlands by storing water and thus regulating the water supply [3].
Lake Sevan, with an area of 1242 km², is the largest lake in the Caucasus and the largest water body of Armenia. The lake sits in the center of Armenia’s Gegharkunik Province, and its watershed boundaries largely coincide with the boundaries of that province. Situated on an elevation of approximately 1900 m above sea level, it serves as a natural water reservoir for the Hrazdan River, which is critical for the water supply to the capital Yerevan, and the Ararat Valley, which is the most important agricultural region of Armenia. Hence, a maximal annual outflow of 170 million m³ shall be released downstream into the Hrazdan River to ensure the water supply for the capital and contribute to the water supply needed in the Ararat Valley, while preserving the water level of the lake. The inflow into Lake Sevan stems from 28 rivers, two springs, the Arpa-Sevan Tunnel, precipitation onto the lake surface, and groundwater inflow, which amounts to approximately 1400-1800 million m³ per year (2002–2017). The average annual evaporation averaged at 1093 million m³ (during 1992–2003) [4,5,6].
In the Basin of Lake Sevan itself, agriculture is an important sector of the economy, too, contributing 12.7 % to the economic output. Agricultural land occupy about 56 % (264,360 ha) of the Lake Sevan Basin, with grasslands and pastures covering 224,200 ha and 40,170 ha cropland [4]. In 2023, the total sown area in Gegharkunik Province was 33,833 ha [7], which largely corresponds to the sown area within the Lake Sevan Basin. The major crops are winter wheat (10,241 ha), spring barley (7768 ha), potatoes (5691 ha), and perennials (6945 ha). Thereby, potatoes and perennials are at least occasionally irrigated. The crop yields of those major crops are listed in Table 1.
Winter wheat and spring barley are rainfed crops, while potatoes and perennials are at least partly irrigated. The water consumption of crops, in particular of irrigated crops, reduces the inflow of water into Lake Sevan so that a high water consumption of crops could compromise the stipulated annual outflow from the lake. The aim of this study therefore is to estimate the water consumption, synonym to actual evapotranspiration (ETa), of the cropland and other major vegetation types around Lake Sevan, in order to provide an indication whether the current water consumption of crops substantially impacts the water inflow into the lake.
2. Materials and Methods
The crop water consumption was estimated through a remote sensing approach that follows the basic concept of the Simplified Surface Energy Balance operational (SSEBop) approach with Landsat OLI 8 and 9 satellite images (path 169 and row 32) as data source. Though, adjustments to the local conditions had to be made, which are explained below.
2.1. Study Area
This remote sensing approach was applied on the area between the lake coastline up to 2100 m above sea level (Figure 1). This ETa area contains most of the cropland and all of the wetlands and forests within the basin of Lake Sevan. The forests and wetlands at the lake shore belong to the Lake Sevan National Park.
The climate is classified as warm summer humid continental climate (Dfb) after the Köppen-Geiger Classification [8]. Monthly climate data from 1991-2019 are available from [9] and listed in Table 2. The growing season was defined as 1st of May till 31st of October, because the air temperature is above 5°C from May till October. The precipitation maximum was in the months April, May, and June with more than 70 mm precipitation each month, followed by monthly precipitations of below 50 mm in August and September.
The vegetation in the Lake Sevan Basin is dominated by grasslands and pastures, which mostly are located outside the ETa area and cover the slopes up to the boundaries of the Lake Sevan Basin. Cropland is unevenly distributed and is concentrated primarily on relatively low-lying terrain around the lake and along the main river valleys so that most of the cropland is captured by the ETa area. Approximately 52% of the basin’s arable land are located in the Masrik sub-basin, followed by the Argichi sub-basin (17.5%), and the Gavaraget (8.6%) sub-basin. Forests and wetlands occupy smaller areas, including lakeshore and locally wetter zones.
Agricultural lands are characterized by challenging soil conditions that influence crop productivity and water management practices. Large areas of uncultivated arable land remain rocky and are often used as hay meadows due to limited resources for land improvement. Soils are dominated by heavy and light clay textures with generally alkaline conditions and low levels of essential nutrients, particularly nitrogen and phosphorus. Despite low salinity levels, improving soil fertility through integrated nutrient management remains important for increasing agricultural productivity and optimizing crop water consumption in the region.
For this study, cropland and forests as of 2024 were visually digitized. Thereby, the digitized croplands include every feature that resembles crop field structures regardless of the actual cultivation status, because former cropland overgrown by a grassy vegetation and sown cropland, in particular non-irrigated, could be reliably distinguished. The resulting cropland area was intersected with a geo-dataset that represents the area around Lake Sevan where cropland is equipped with irrigation infrastructure, including outdated infrastructure. The cropland inside the area equipped with irrigation infrastructure, was divided by a threshold of the Normalized Difference Vegetation Index (NDVI) in late summer into cropland that is harvested in autumn (summer crops) and perennial cultures (NDVI >= 0.2) versus crops that are harvested before late summer, i.e. winter crops (NDVI < 0.2). These NDVI thresholds were taken from NDVIs from satellite images of 22-Aug-2023, 1-Sep-2024, and 19-Aug-2025. The threshold of 0.2 was used, because an NDVI below 0.2 indicates an area free of vegetation or with very low productivity [10].
This resulted in three cropland classes: cropland outside irrigation area, winter crop inside irrigation area, and summer crop inside irrigation area.
2.2. Assessment of Water Consumption of the Cropland and Other Major Vegetation Types
The SSEBop approach [11] is listed as one approach under the OpenET Project [12] to assess evapotranspiration (water consumption) of crops and other vegetation. The SSEBop approach calculates an evaporative fraction (ETf) for each pixel of a given satellite image, which is multiplied with the potential evapotranspiration to yield the actual evapotranspiration (ETa) for each pixel of the respective satellite image. Thereby, the SSEBop approach is similar to the Simplified Surface Energy Balance Index (S-SEBI) [13,14,15,16]; Surface Energy Balance System (SEBS) [17], and the Simplified Surface Energy Balance (SSEB) [18]. All those approaches rest on the thermal differences between areas that exhibit different evapotranspiration rates recorded by the land surface temperature channels of satellites [19]. Thereby, areas from which large amounts of water evaporate or are transpired record a low temperature with the land surface temperature channels, because a high proportion of the energy of the incoming solar net radiation is used for evapotranspiration and hence directed into the latent heat flux. In contrast, low evapotranspiration corresponds to higher temperature, because more energy from the incoming solar net radiation is directed into the sensible heat flux so that the ambient temperature increases. This is expressed by the equation below:
Thereby, Rn, LE, H, and G refer to the net radiation, latent heat flux, the sensible heat flux, and the soil heat flux. The remote sensing approaches listed here refer to daily time steps and assume G = 0. The latent heat flux, i.e. water consumption, is calculated as:
where LEd, ETf, and Rnd refer to the daily latent heat flux sum [MJ d-1], the dimensionless daily evaporative fraction, and the daily net radiation sum [MJ d-1], respectively.
If the daily net radiation (Rnd) is converted into evapotranspiration, i.e. the potential evapotranspiration (ETpot), ETa can be calculated as follows:
Thereby, the evaporative fraction (ETf) is the share of ETpot which is actually realized as ETa. Hence, over well-watered vegetation, such as wetlands, ETf ≈ 1 and ETa ≈ ETpot. There, the land surface temperature (LST), recorded from the LST channel of the respective satellite, is low because the energy of the incoming radiation is consumed by the ongoing evapotranspiration. In contrast, ETf and ETa are zero at places without any vegetation or other moisture.
The evaporative fraction ETf is calculated as follows:
where TH and TC refer to the average LST of the hot anchor pixels and cold anchor pixels of a given satellite image, respectively, while Tx refers to the LST of the pixel, for which ETf is calculated. Cold anchor pixels must show a low LST due to their high evapotranspiration and not due to simply being cold objects, e.g. deeper water bodies. The SSEBop approach uses vegetation areas with an NDVI > 0.8 as locations for the cold anchor pixels. The study area around Lake Sevan, though, did not contain any areas of NDVI > 0.8 so that the cold anchor pixels were located manually in wetlands.
Hot pixels must not exhibit any evapotranspiration and are, therefore, selected in areas without vegetation. The SSEBop approach suggests a calculation to retrieve the hot anchor pixel LST for a smooth operationalization. Test calculations for the study region here resulted in ETf of up to 0.5 for sparsely vegetated areas so that hot anchor pixels were selected manually following the guideline of [20].
As Landsat OLI images were used for this study, ETf only was available every eight to forty days, depending on the availability of good quality satellite images (see Appendix A1 for the list of the satellite images used in this study). Cloudy areas were masked on each satellite image and excluded from the calculation of ETf. The evaporative fraction hence was linearly interpolated for each pixel for the days between the available satellite images and their cloud free areas.
As the cold anchor pixels (ETf = 1 and hence ETa = ETpot) were located in wetlands (reed vegetation) on the lake shore, ETpot was calculated as the crop evapotranspiration (ETc) of wetland vegetation according to [21]. For this calculation the daily reference evapotranspiration (ETo) was computed with daily climate data from the station Gavar retrieved from the website [22]. In a second step, ETo was converted ETc of wetland through crop coefficients given by [21].
All remote sensing analyses were done in Q-GIS, version 3.44.9.
3. Results
Cropland, as visually digitized within the Lake Sevan Basin, was 59,235 ha, forests in that basin covered an area of 6882 ha. The cropland area within the irrigation area covered 43669 ha. Within the ETa area, which had a size of 141,627 ha, the cropland and forests covered 48617 ha and 6875 ha, respectively, whereby the areas of the cropland types within the ETa area are listed in Table 3.
The three years covered by this study show differences regarding precipitation during the growing seasons, as shown in Table 4, whereby all three years show annual precipitations below the average value for the period 1991-2019 shown in Table 2. The growing season 2024 was the rainiest one, in particular in comparison to the growing season of 2025, which received more than 100 mm less precipitation than the growing season in 2024. The reference ET (ETo) behaved inversely to the precipitation, with 2024 showing the lowest ETo. Though, the difference between ETo of 2023 and 2025 was less stark than the precipitation over those two growing seasons. The low precipitation and high ETo in 2025 correspond to the Global Water Monitor 2025 [23], which stated that Armenia recorded its lowest precipitation and rivers basins of the Caucasus received low amounts of precipitation in 2025.
The average ETa of the cropland – cropland outside irrigation area, winter crop inside irrigation area, and summer crop inside irrigation area taken together – was lowest in 2025, the same year with the lowest precipitation during the growing season, and highest in 2023 (Table 5).
Wetlands at the lakeshore and forests, which are located at the lakeshore, too, showed the highest ETa throughout the three growing seasons 2023, 2024, and 2025, followed by inland wetlands (Table 6, Figure 1). ETa of those three land cover types exceeded the precipitation within each growing season, which is shown in Table 7 as negative water balances. ETa of those three land cover types was lowest during the growing season 2024, mirroring ETo, which was lowest in 2024, too. In contrast, grassland showed the highest ETa during 2024 and a significantly lower ETa in 2025, thereby resembling the precipitation pattern of those three years. The cropland outside irrigation area and winter crop inside irrigation area behaved like grassland in so far as ETa in 2025 was clearly lower than in 2024, while summer crop inside irrigation area behaved like forests and wetlands. The summer crop inside irrigation had a negative water balance in the three growing seasons when comparing ETa with the precipitation during the growing season. Areas within the cropland that showed ETa values close to the maxima of Table 5 were mainly located adjacent to wetlands or forests and partly were mixed pixels of cropland and forests or wetlands.
Assuming the winter crop inside irrigation area corresponds to winter wheat, then the water productivity for winter wheat was 8.75 kg ha-1 mm-1 and 7.76 kg ha-1 mm-1 in 2023 and 2024, respectively. The water productivity for potatoes was 54.1 kg ha-1 mm-1 and 65.4 kg ha-1 mm-1 in 2023 and 2024, respectively.
The monthly ETa of wetlands, forests, and summer crop inside irrigation area follow the monthly pattern of ETo, which is an increase from May till July, a plateau from July to August, followed by a steep decrease till end of the growing season in October (Figure 2 and Appendix A1). Grasslands, winter crop inside irrigation area, and cropland outside irrigation area have their ETa maximum earlier, in June or July, which coincides with the respective maximum precipitation.
The overall water consumption among the cropland land cover types was highest with winter crop inside irrigation area (Table 7), which corresponds to the large area of this cropland type (Table 1). Though, the winter crop inside irrigation area does not show a negative water balance so that infiltration into the soil and groundwater takes place under that cropland type. Due to their high ETa (Table 6), forests, which are concentrated along the lakeshore, are the second largest water consumer listed in Table 8, despite their small area.
Forests also showed a negative water balance in all three years of -14.7 million m³, -11.7 million m³, and -22.1 million m³ in 2023, 2024, and 2025, respectively, which is the largest negative water balance compared to the cropland types. The cropland land cover types did not consume more water than the precipitation delivered during the growing season. The summer crop inside irrigated area showed a negative water balance in 2023 and 2025 of -4.5 million m³ and -4.2 million m³, respectively. In 2025, also the cropland outside irrigated area showed a negative water balance of -3.9 million m³.
4. Discussion
The yield and water use efficiency of between 7.4 kg ha-1 mm-1 and 9.1 kg ha-1 mm-1 as found in this study for winter crop inside irrigation area, which largely corresponds to wheat, are in the range of the figures published by [24], who studied rainfed wheat in the Loess Plateau in China. Crop water consumption of wheat during the growing season averaged 342.6 ± 84.29 (220.5 ~ 586.6 mm) in that study in China so that the ETa of winter crop inside irrigation area around Lake Sevan falls into this range albeit into the lower part. This difference can be explained by the higher elevation and therefore colder climate at Lake Sevan compared with the study site in China. Compared to the data from [25], also from the Loess Plateau in China, the wheat yields, ETa, and water use efficiency found in this study at Lake Sevan were within the ranges, though towards the lower boundaries, of the corresponding data across different treatments by [25]. This also can be explained by differences in elevation, climate, as well as management practices, because the experimental sites by [25] were managed more intensively than wheat around Lake Sevan. Furthermore, the winter crop inside irrigation area also contains cropland not sown in the given growing seasons. On those not sown croplands a grassy vegetation will grow, which may exhibit a lower ETa than wheat. ETa of potatoes at Lake Sevan correspond to the values found by [26] and [27].
The land cover types grassland, winter crop inside irrigation area, and cropland outside irrigation area are all rainfed and hence their monthly ETa’s are lower during the second half of the growing season, when the precipitation is also lower than during the first half of the growing season. This is in accordance with the findings by [28] from USA, China, and Australia. Therefore, ETa of these rainfed land cover types was lowest in 2025, the growing season with the lowest precipitation. In 2024 and 2025, the precipitation maximum occurred in July after a June with significantly lower precipitation. This high precipitation in July did not translate into a significantly higher ETa of those three land cover types, because winter crops and the grassland vegetation are adapted to bear fruits and dry up in June and July.
In contrast, the ETa of wetlands, forests, and summer crop inside irrigation area follows ETo rather than precipitation. This can be explained by their access to water independent of precipitation, which is groundwater for wetlands and forests and irrigation water for summer crop inside irrigation. This is also reflected by the negative water balance of those land cover types. ETa of wetlands, forests, and summer crop inside irrigation is lowest in 2024, because ETo is lowest during the growing season 2024, too.
The rainfed land cover types grassland, winter crop inside irrigation area, and cropland outside irrigation have a positive water balance (except for cropland outside irrigation in 2025) so that those three land cover types allow water to infiltrate into the groundwater or to add to surface runoff, hence contribute to runoff into Lake Sevan. In contrast, wetlands, forests, and summer crop inside irrigation consume more water than they receive through precipitation, which is shown by their negative water balances. The water consumed by those land cover types therefore is withheld from the lake.
The negative water balance of -4.5 million m³ and -4.2 million m³ by summer crop inside irrigated area is small compared to the legally allowed maximum amount of 170 million m3 that can be released from Lake Sevan downstream each year. Also the negative water balance of forests, which peaked in 2025 with -22.1 million m³ is small compared to the planned annual water release and it is very small compared to the precipitation over the lake surface, which was between 400 million m³ and 700 million m³ during the years 2002 and 2017 [4]. This finding is in accordance with [29] who found that anthropogenic activities at Qinghai Lake in China were not the main driver for lake level changes, but climate change was the main driver.
For Lake Sevan the main effect of climate change is temperature increase and consequently an increase in evapotranspiration [30,31]. A modelling approach predicts an increase in evapotranspiration by 10% to 25% by end of this century depending on climate change scenarios [31]. This increase affects both, evapotranspiration from agriculture and other vegetation types and from the lake water surface. Therefore, the water consumption by rainfed agriculture and grassland will increase as much as the precipitation allows so that those areas will contribute less to the groundwater and river runoff into the lake. Wetlands, forests, and summer crop inside irrigation area will consume more water and increase their negative water balance, but this negative water balance will remain small compared to the evaporation from the lake surface. Reduced river runoffs may impact the irrigated agriculture as less water will be available from the rivers, which would counter the increase of water consumption by irrigated agriculture.
5. Conclusions
The results indicate that current agricultural evapotranspiration around Lake Sevan does not appear to substantially compromise the overall water balance of the lake. Most cropland categories showed seasonal water balances close to neutral or positive, suggesting that crop water consumption is largely compensated by precipitation inputs, either as precipitation onto the croplands or via groundwater inflow.
The findings therefore suggest that, under current land use and climatic conditions, agriculture around Lake Sevan is not the dominant driver of reductions in lake inflow. There are also no significant areas within the cropland that consume high amounts of water. Instead, natural ecosystems such as wetlands and lakeshore forests account for large evaporative losses. However, these ecosystems are integral components of the natural hydrological and ecological functioning of the lake basin and provide important ecosystem services, including biodiversity conservation, nutrient retention, mediation of flood events, and shoreline stabilization.
In the course of climate change, evapotranspiration is expected to increase. This will strain all crops and vegetation types and also will increase the evaporation from the lake surface. Compared to the evaporation from the lake surface as predicted the water consumption of agriculture, in particular irrigated agriculture, will remain small. Agriculture has even to be considered a victim of climate change rather than a significant burden for the lake’s water balance.
This article reflects the personal opinions of the authors.
Author Contributions
Conceptualization, N.T.; methodology, N.T.; validation, E.P., M.J., V.S., and K.O.; formal analysis, M.J.; investigation, N.T.; data curation, N.T., E.P., M.J., V.S., and K.O.; writing—original draft preparation, N.T.; writing—review and editing, E.P., M.J., V.S., and K.O.; visualization, N.T.; All authors have read and agreed to the published version of the manuscript.
Funding
This research received no external funding.
Conflicts of Interest
The authors declare no conflicts of interest.
Abbreviations
The following abbreviations are used in this manuscript:
| DOY | nth day of the year |
| ETa | Actual evapotranspiration |
| ETc | Crop evapotranspiration |
| ETf | Evaporative fraction |
| ETo | Reference evapotranspiration |
| ETpot | Potential evapotranspiration |
| G | Soil heat flux |
| H | Sensible heat flux |
| LE | Latent heat flux |
| LST | Land surface temperature |
| NDVI | Normalized Difference Vegetation Index |
| Rn | Net radiation |
| S-SEBI | Simplified Surface Energy Balance Index |
| SEBS | Surface Energy Balance System |
| SSEB | Simplified Surface Energy Balance |
| SSEBop | Simplified Surface Energy Balance operational |
Appendix A

Table A1.
List of Landsat images used for this study. DOY refers to nth day of the year.
| Date | DOY | Sensor |
| 19.06.2023 | 170 | LC9 |
| 13.07.2023 | 194 | LC8 |
| 06.08.2023 | 218 | LC9 |
| 14.08.2023 | 226 | LC8 |
| 22.08.2023 | 234 | LC9 |
| 15.09.2023 | 258 | LC8 |
| 09.10.2023 | 282 | LC9 |
| 05.06.2024 | 157 | LC9 |
| 21.06.2024 | 173 | LC9 |
| 23.07.2024 | 205 | LC9 |
| 24.08.2024 | 237 | LC9 |
| 01.09.2024 | 245 | LC8 |
| 03.10.2024 | 277 | LC8 |
| 07.05.2025 | 127 | LC9 |
| 31.05.2025 | 151 | LC8 |
| 08.06.2025 | 159 | LC9 |
| 24.06.2025 | 175 | LC9 |
| 10.07.2025 | 191 | LC9 |
| 18.07.2025 | 199 | LC8 |
| 03.08.2025 | 215 | LC8 |
| 19.08.2025 | 231 | LC8 |
| 04.09.2025 | 247 | LC8 |
| 28.09.2025 | 271 | LC9 |
| 14.10.2025 | 287 | LC9 |
Table A2.
Monthly ETa and precipitation [mm] over the growing seasons 2023, 2024, and 2025.
| Year and month | Precipitation | Wetland )lake shore) | Wetland (inland) | Grassland | Forest | Cropland outside irrigation area | Winter crop inside irrigation area | Summer crop inside irrigation area |
| 2023 | ||||||||
| May | 64 | 100 | 83 | 52 | 92 | 60 | 58 | 59 |
| Jun | 87 | 124 | 102 | 64 | 113 | 73 | 70 | 74 |
| Jul | 64 | 144 | 113 | 68 | 123 | 66 | 68 | 88 |
| Aug | 43 | 144 | 111 | 28 | 110 | 43 | 44 | 76 |
| Sep | 43 | 84 | 54 | 13 | 66 | 37 | 29 | 41 |
| Oct | 18 | 41 | 32 | 12 | 30 | 24 | 19 | 22 |
| 2024 | ||||||||
| May | 92 | 79 | 70 | 30 | 76 | 51 | 43 | 39 |
| Jun | 71 | 125 | 106 | 58 | 122 | 85 | 74 | 74 |
| Jul | 100 | 116 | 81 | 62 | 112 | 56 | 53 | 69 |
| Aug | 14 | 113 | 90 | 46 | 103 | 51 | 47 | 65 |
| Sep | 31 | 71 | 57 | 40 | 67 | 34 | 31 | 40 |
| Oct | 38 | 39 | 28 | 26 | 37 | 26 | 23 | 24 |
| 2025 | ||||||||
| May | 55 | 109 | 71 | 33 | 91 | 52 | 40 | 40 |
| Jun | 35 | 129 | 94 | 48 | 122 | 61 | 56 | 64 |
| Jul | 81 | 148 | 118 | 30 | 127 | 65 | 53 | 79 |
| Aug | 2 | 145 | 104 | 25 | 115 | 47 | 41 | 76 |
| Sep | 38 | 83 | 58 | 15 | 66 | 30 | 23 | 40 |
| Oct | 28 | 47 | 25 | 14 | 40 | 19 | 17 | 19 |
References
- Viviroli, D.; Archer, D.R.; Buytaert, W.; Fowler, H.J.; Greenwood, G.B.; Hamlet, A.F.; Huang, Y.; Koboltschnig, G.; Litaor, M.I.; López-Moreno, J.I.; Lorentz, S.; Schädler, B.; Schreier, H.; Schwaiger, K.; Vuille, M.; Woods, R. Climate change and mountain water resources: overview and recommendations for research, management and policy. Hydrol. Earth Syst. Sci. 2011, 15, 471–504. [Google Scholar] [CrossRef]
- Viviroli, D.; Kummu, M.; Meybeck, M.; Kallio, M.; Wada, Y. Increasing dependence of lowland populations on mountain water resources. Nat. Sustain. 2020, 3, 917–928. [Google Scholar] [CrossRef]
- Williamson, C.E.; Dodds, W.; Kratz, T.K.; Palmer, M.A. Lakes and streams as sentinels of environmental change in terrestrial and atmospheric processes. Front. Ecol. Environ. 2008, 6, 247–254. [Google Scholar] [CrossRef]
- European Union Water Initiative Plus for the Eastern Partnership Countries (EUWI+). Draft River Basin Management Plan for Sevan River Basin District in Armenia; 2020. [Google Scholar]
- Wilkinson, I.P. Lake Sevan: Evolution, Biotic Variability and Ecological Degradation, in Large Asian Lakes in a Changing World: Natural State and Human Impact; Mischke, S., Ed.; Springer International Publishing: Cham, 2020; pp. 35–63. [Google Scholar]
- Babayan, A.; Hakobyan, S.; Jenderedjian, K.; Muradyan, S.; Voskanov, M. Experience and Lessons Learned Brief concerning Lake Sevan. 2003. Available online: https://gull-research.org/armenicus/march2011/Sevan_12.16.03.pdf.
- ARMSTAT. Marz Gegharkunik of RA in Figures 2025; Statistical Committee Republic of Armenia.
- Worldbank. Köppen-Geiger Climate Classification - Country Overview Armenia. Climate Change Knowledge Portal. 2021. Available online: https://climateknowledgeportal.worldbank.org/country/armenia.
- Deutscher Wetterdienst. Klimatafel von Sewan, See ("Ozero") / Armenien 2020. Available online: https://www.dwd.de/DWD/klima/beratung/ak/ak_377170_kt.pdf.
- Analytics, EOS Data. NDVI Explained: How The Index Helps Monitor Crop Health. 2026. Available online: https://eos.com/blog/normalized-difference-vegetation-index-or-ndvi/.
- Senay, G.B.; Bohms, S.; Singh, R.K.; Gowda, P.H.; Velpuri, N.M.; Alemu, H.; Verdin, J.P. Operational Evapotranspiration Mapping Using Remote Sensing and Weather Datasets: A New Parameterization for the SSEB Approach. JAWRA J. Am. Water Resour. Assoc. 2013, 49, 577–591. [Google Scholar] [CrossRef]
- OpenET. Filling the Biggest Data Gap in Water Management. 2025. Available online: https://etdata.org/.
- Sobrino, J.A.; Gómez, M.; Jiménez-Muñoz, J.C.; Olioso, A.; Chehbouni, G. A simple algorithm to estimate evapotranspiration from DAIS data: Application to the DAISEX campaigns Original Research Article. J. Hydrol. 2005, 315, 117–125. [Google Scholar]
- Roerink, G.J.; Su, Z.; Menenti, M. S-SEBI: A simple remote sensing algorithm to estimate the surface energy balance. Phys. Chem. Earth Part B Hydrol. Ocean. Atmos. 2000, 25, 147–157. [Google Scholar] [CrossRef]
- Gowda, P.H.; Chavez, J.L.; Colaizzi, P.D.; Evett, S.R.; Howell, T.A.; Tolk, J.A. ET mapping for agricultural water management: Present status and challenges. Irrig. Sci. 2008, 26, 223–237. [Google Scholar]
- H. Gowda, P.; Chavez, J.L.; Colaizzi, P.D.; Evett, S.R.; Howell, T.A.; Tolk, J.A. Remote sensing based energy balance algorithms for mapping ET: Current status and future challenges. Am. Soc. Agric. Biol. Eng. 2007, 50, 1639–1644. [Google Scholar] [CrossRef]
- Su, Z. The Surface Energy Balance System (SEBS) for estimation of turbulent heat fluxes. Hydrol. Earth Syst.Sci. 2002, 6, 85–99. [Google Scholar] [CrossRef]
- Senay, G.B.; Budde, M.; Verdin, J.P.; Melesse, A.M. A coupled remote sensing and simplified surface energy balance approach to estimate actual Evapotranspiration from irrigated fields. Sensors 2007, 7, 979–1000. [Google Scholar] [CrossRef]
- Bastiaanssen, W.G.M.; et al. A remote sensing surface energy balance algorithm for land (SEBAL). 1. Formulation. J. Hydrol. 1998, 212–213, 198–212. [Google Scholar] [CrossRef]
- Waters, R.; Allen, R.G.; Tasumi, M.; Trezza, R.; Bastiaanssen, W.G.M. SEBAL Surface Energy Balance Algorithms for Land – Idaho Implementation – Advanced Training and Users Manual 2002: University of Idaho, USA.
- Allen, R.G.; Pereira, L.S.; Raes, D.; Smith, M. Crop Evapotranspiration—Guidelines for Computing Crop Water Requirements; FAO Irrigation and Drainage Paper 56; FAO: Rome, Italy, 1998. [Google Scholar]
- Real Prognose. Wetter für 243 Länder weltweit. 2026. Available online: https://rp5.ru/.
- Van Dijk, A.I.J.M.; Beck, H.E.; Boergens, E.; de Jeu, R.A.M.; Dorigo, W.A.; Edirisinghe, C.; Forootan, E.; Guo, E.; Güntner, A.; Haas, J.; Hou, J.; Mo, S.; Preimesberger, W.; Rahman, J.; Rozas Larraondo, P. Global Water Monitor, 2025; Global Water Monitor Consortium, 2026. [Google Scholar]
- Pan, Q.; Pan, X.; Yang, F.; Wen, X.; Pei, F.; Pan, S.; Pan, T.; Shi, Y. Water Use Efficiency and Eco-Niche-Yield Prediction of Rainfed Wheat in China’s Loess Plateau. J. Agric. Sci. 2012, 4, 143–153. [Google Scholar]
- Zhang, S.; Sadras, V.; Chen, X.; Zhang, F. Water use efficiency of dryland wheat in the Loess Plateau in response to soil and crop management. Field Crops Res. 2013, 151, 9–18. [Google Scholar] [CrossRef]
- Phungula, N.P.; Hadebe, S.T.; Schulte-Geldermann, E.; Sithole, L.; Ngobese, N.Z. “Low-Hanging Fruit” Practices for Improving Water Productivity of Rainfed Potatoes Using Integration of Cultivar Selection, Mulch Application, and Different Agroecological Zones in Sub-Tropical, Semi-Arid Regions. Water 2024, 16, 3422. [Google Scholar] [CrossRef]
- Islam, T.; Sarker, H.; Alam, J.; Harun Ur, R. Water use and yield relationships of irrigated potato. Agric. Water Manag. 1990, 18, 173–179. [Google Scholar] [CrossRef]
- Sun, G.; Alstad, K.; Chen, J.; Chen, S.; Ford, C.R.; Lin, G.; Liu, C.; Lu, N.; McNulty, S.G.; Miao, H.; Noormets, A.; Vose, J.M.; Wilske, B.; Zeppel, M.; Zhang, Y.; Zhang, Z. A general predictive model for estimating monthly ecosystem evapotranspiration. Ecohydrology 2010, 4, 245–255. [Google Scholar] [CrossRef]
- Fang, J.; Li, G.; Rubinato, M.; Ma, G.; Zhou, J.; Jia, G.; Yu, X.; Wang, H. Analysis of Long-Term Water Level Variations in Qinghai Lake in China. Water 2019, 11, 2136. [Google Scholar] [CrossRef]
- Worldbank. The Country Climate and Development Report for Armenia. 2025. [Google Scholar] [PubMed]
- Rohini, K. Monitoring, Modelling, and Managing of Water Resources in the Lake Sevan basin (MMM4SEVAN); UFZ: Leipzig, 2024. [Google Scholar]
Figure 1.
ETa [mm] of the growing season 2023, 2024, and 2025.
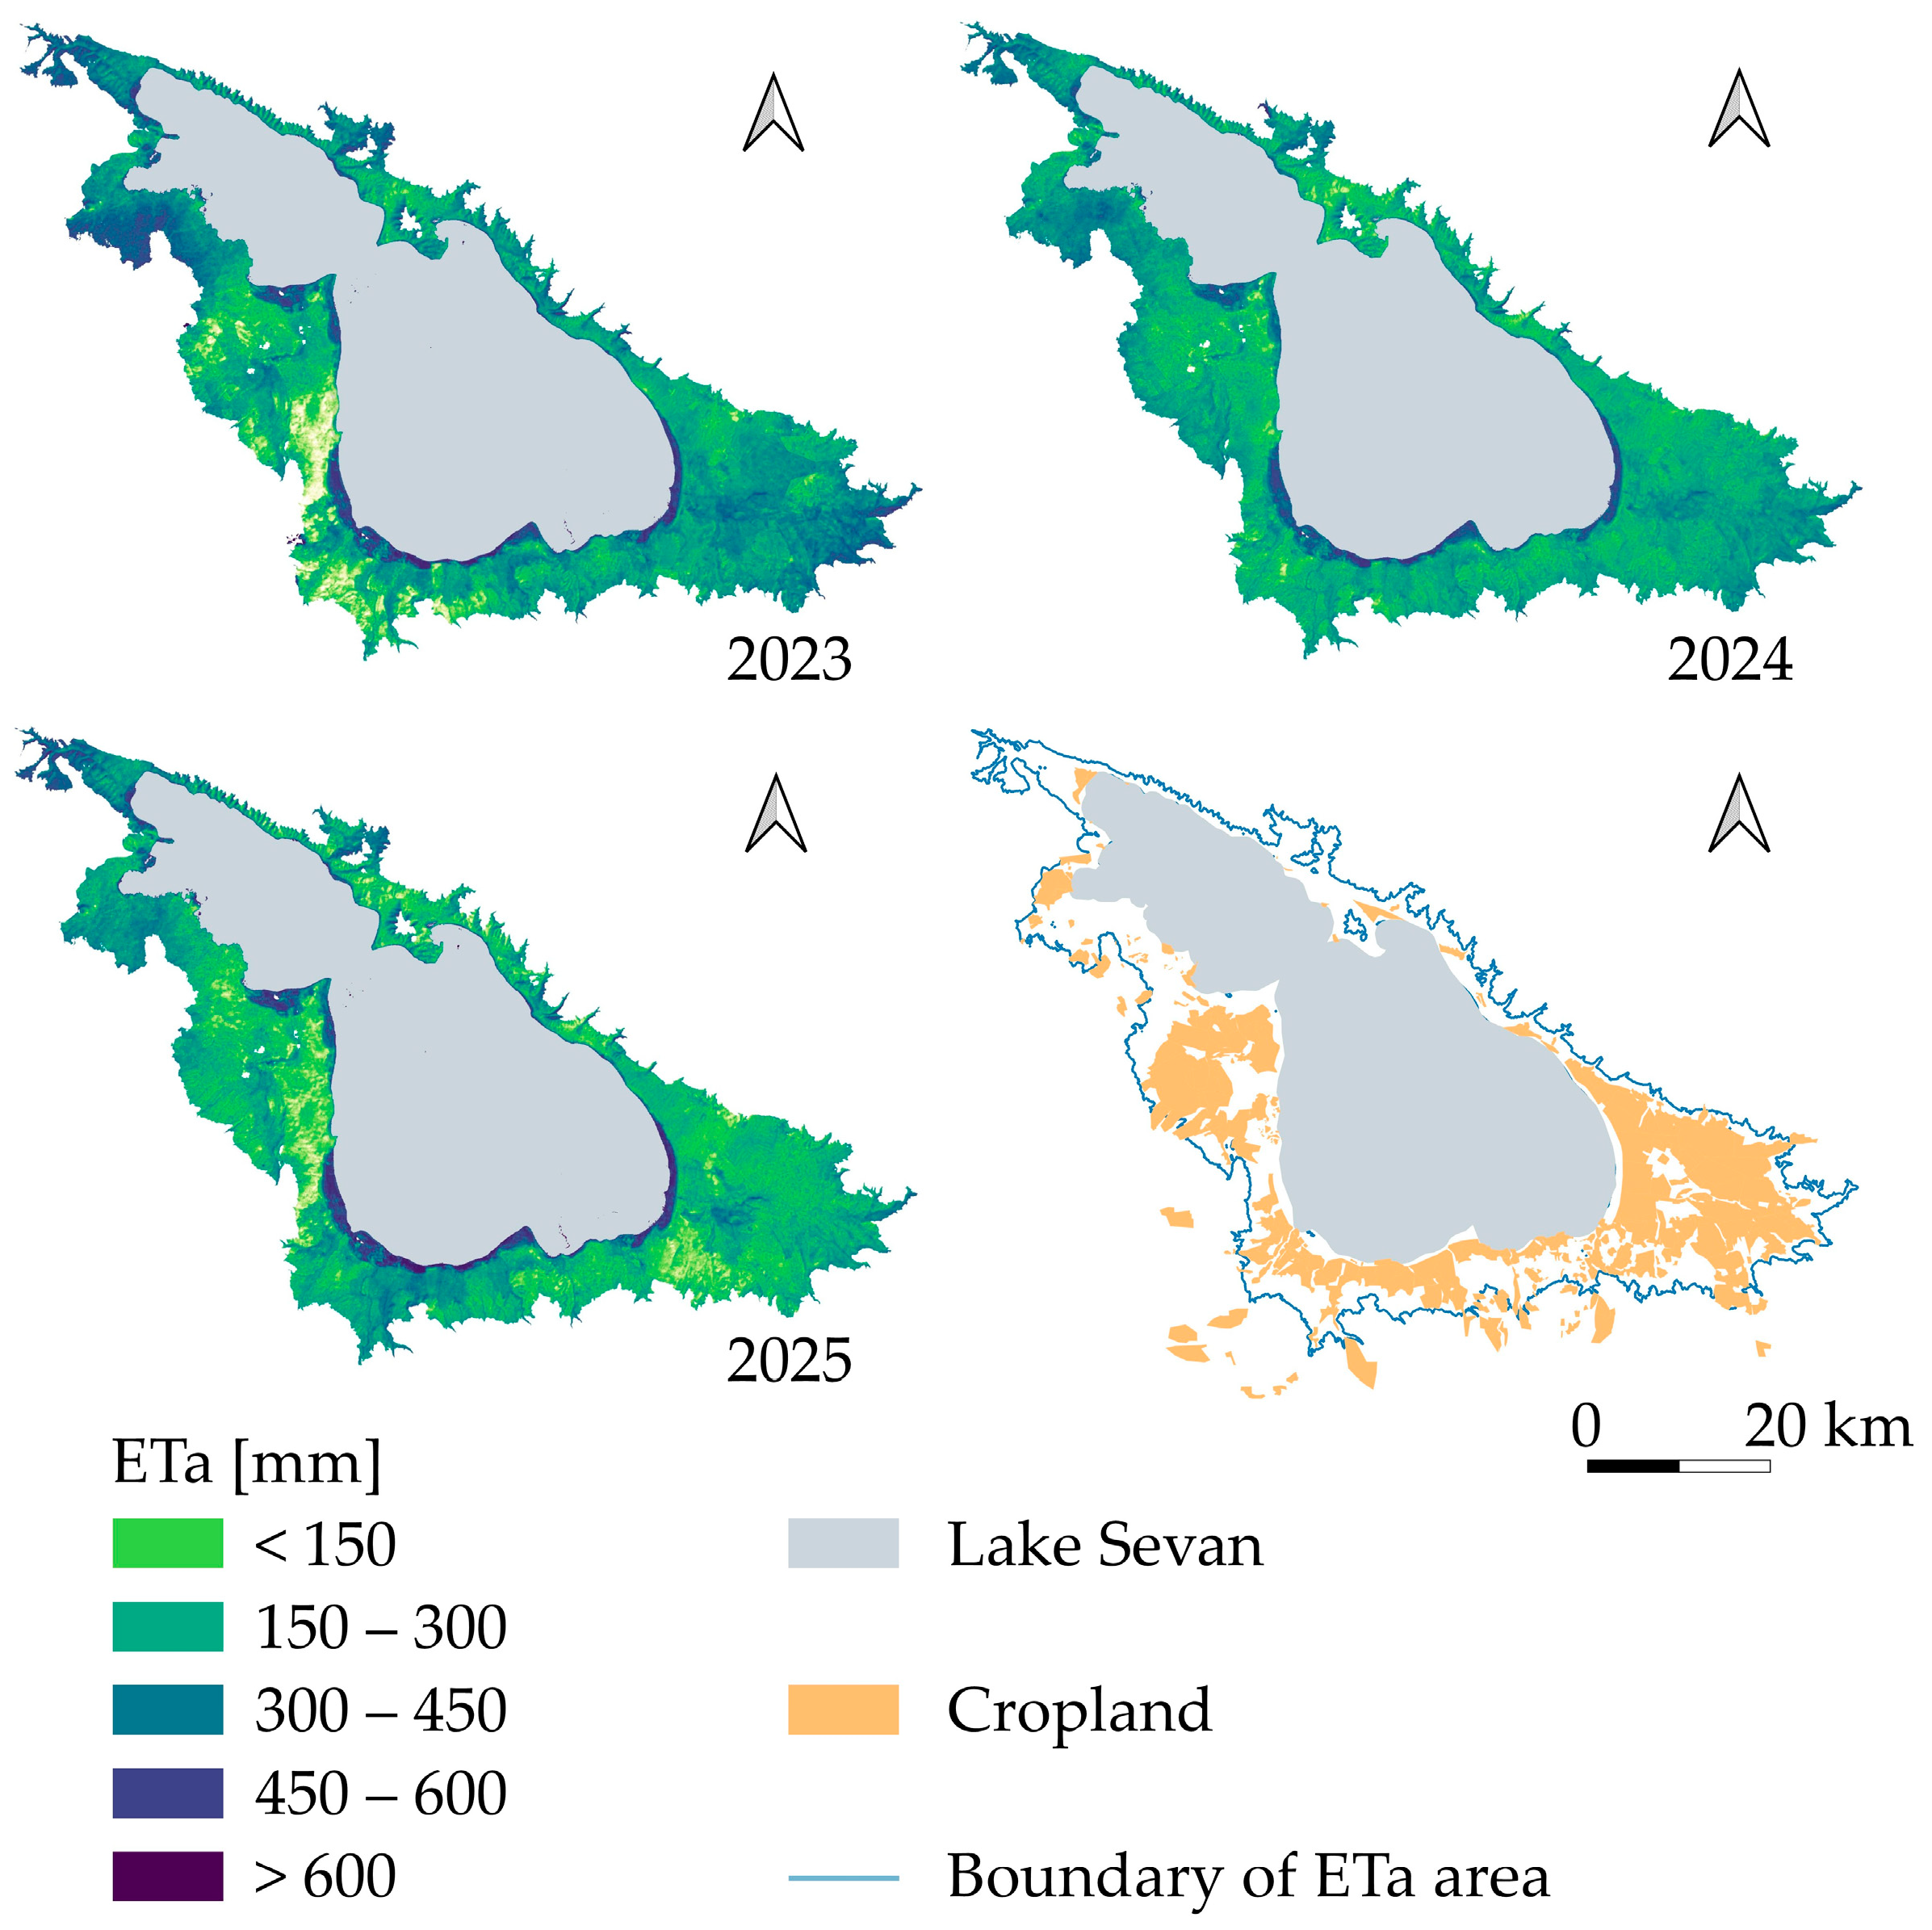
Figure 2.
Monthly precipitation, ETo, and ETa of the different land cover types [mm] for the growing seasons 2023, 2024, and 2025.
Figure 2.
Monthly precipitation, ETo, and ETa of the different land cover types [mm] for the growing seasons 2023, 2024, and 2025.
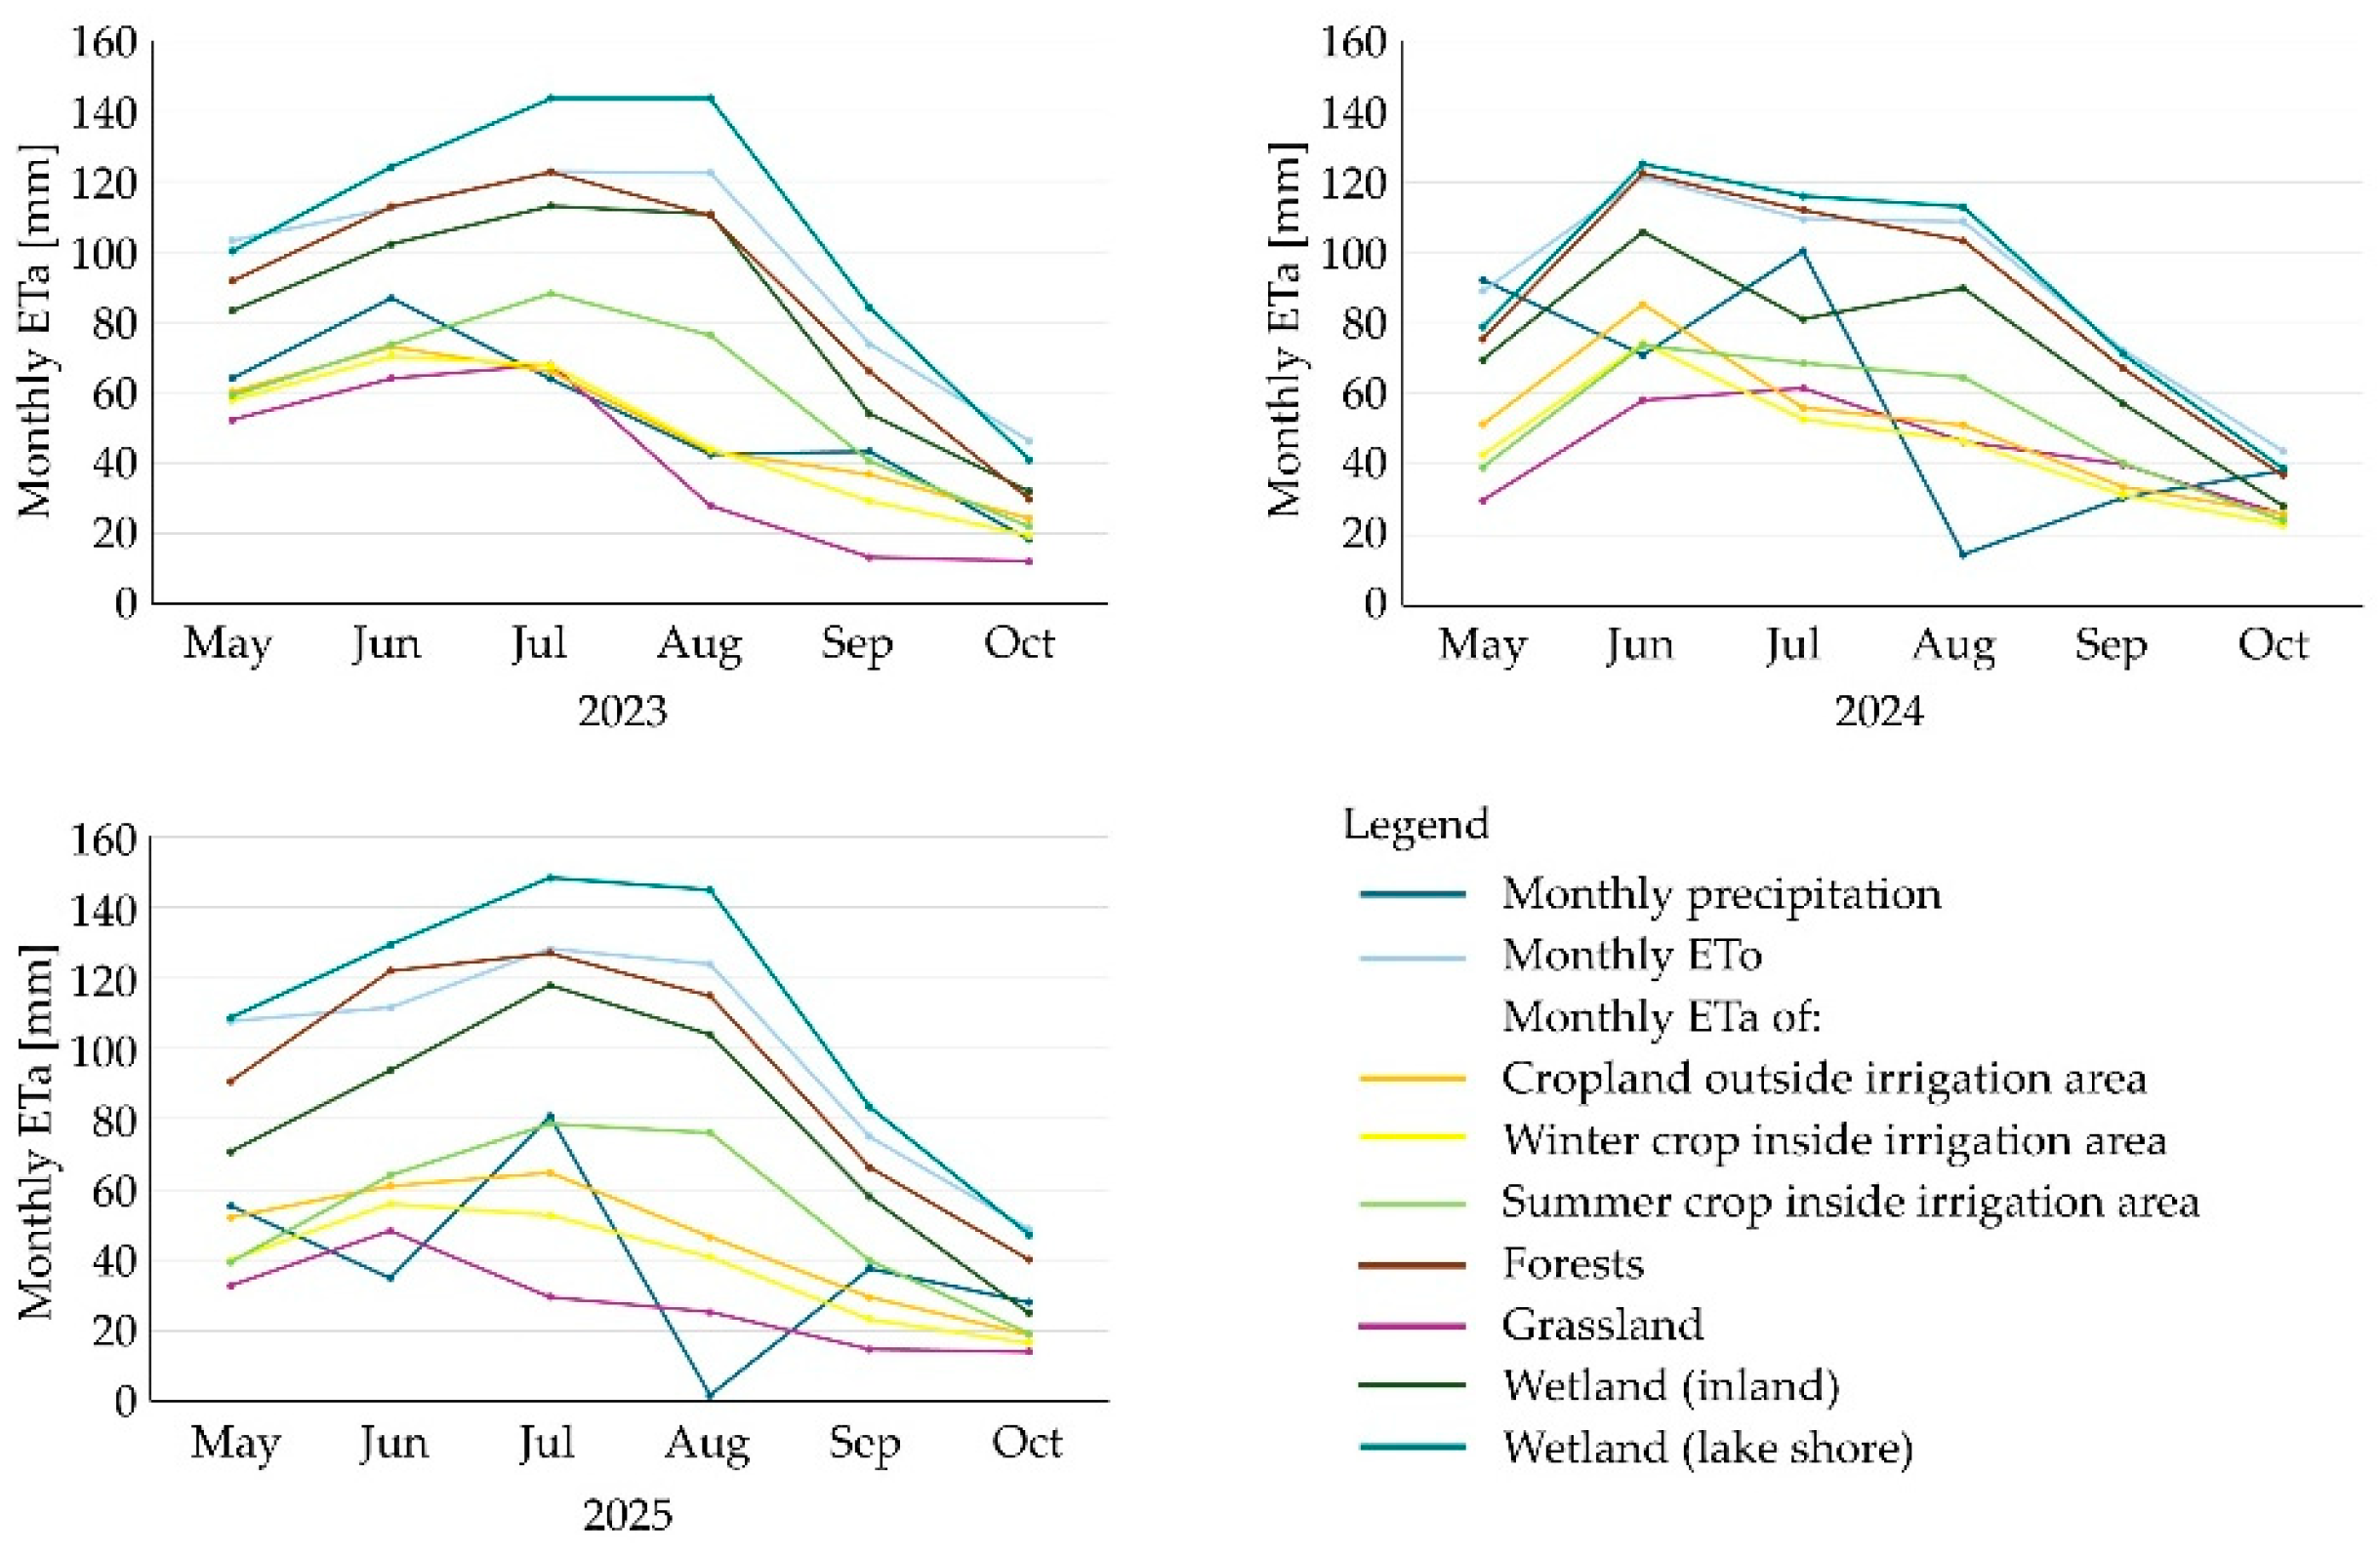
Table 1.
Crop yields [t ha-1] of major crops of Gegharkunik Province and corresponding yields in Türkiye, EU average, and global average in 2023 and 2024.
Table 1.
Crop yields [t ha-1] of major crops of Gegharkunik Province and corresponding yields in Türkiye, EU average, and global average in 2023 and 2024.
| Crop | Gegharkunik | Türkiye | EU average | Global average |
|---|---|---|---|---|
| 2023 | ||||
| Winter wheat | 2.53 | 3.2 | 5.5 | 3.6 |
| Spring barley | 2.13 | 2.8 | 4.5 | 3.1 |
| Potato | 19.47 | 37.7 | 36.2 | 22.8 |
| 2024 | ||||
| Winter wheat | 2.15 | 3.2 | 4.57 | 3.6 |
| Spring barley | 1.73 | 2.8 | 5.5 | 3.15 |
| Potato | 20.67 | 37.8 | 36.7 | 22.9 |
Source: [7].
Table 2.
Climate data for Sevan from 1991-2019 [9].
Table 2.
Climate data for Sevan from 1991-2019 [9].
| Climate parameter | Value |
| Average annual temperature [°C] | 6.2 |
| Average January temperature [°C] | -4.9 |
| Average July temperature [°C] | 16.8 |
| Annual precipitation [mm] | 617 |
Table 3.
Area of cropland and forest [ha] within the ETa area in 2023, 2024, and 2025.
| Land cover | 2023 | 2024 | 2025 |
| Cropland outside irrigation area | 11417 | 11417 | 11417 |
| Winter crop inside irrigation area | 26196 | 25582 | 31852 |
| Summer crop inside irrigation area | 11001 | 11622 | 5352 |
| Forests | 6876 | 6876 | 6876 |
Table 4.
ETo [mm] and precipitation [mm] over the growing seasons of 2023, 2024, and 2025 at the station Gavar.
Table 4.
ETo [mm] and precipitation [mm] over the growing seasons of 2023, 2024, and 2025 at the station Gavar.
| 2023 | 2024 | 2025 | |
| ETo (May-Oct) | 581 | 544 | 595 |
| Precipitation (May-Oct) | 319 | 347 | 239 |
| Annual ETo | 751 | 730 | 759 |
| Annual precipitation | 439 | 506 | 361 |
Table 5.
Average, standard deviation, minimum, and maximum values of ETa [mm] for all cropland within the ETa area for2023, 2024 and 2025.
Table 5.
Average, standard deviation, minimum, and maximum values of ETa [mm] for all cropland within the ETa area for2023, 2024 and 2025.
| ETa | 2023 | 2024 | 2025 |
| Average | 307 | 243 | 204 |
| Standard deviation | 69 | 123 | 114 |
| Maximum | 607 | 663 | 702 |
| Minimum | 0 | 0 | 0 |
Table 6.
ETa over the whole growing season by land cover / land use.
| Land cover | 2023 | 2024 | 2025 |
| Cropland outside irrigation area | 304 | 307 | 273 |
| Winter crop inside irrigation area | 289 | 277 | 230 |
| Summer crop inside irrigation area | 363 | 316 | 318 |
| Forests | 533 | 511 | 561 |
| Grassland | 238 | 267 | 165 |
| Wetland (inland) | 495 | 434 | 469 |
| Wetland (lake shore) | 636 | 602 | 662 |
Table 7.
Balance between ETa and precipitation during the growing seasons 2023, 2024, and 2025.
| Land cover | 2023 | 2024 | 2025 |
| Cropland outside irrigation area | 15 | 43 | -34 |
| Winter crop inside irrigation area | 30 | 76 | 9 |
| Summer crop inside irrigation area | -41 | 36 | -79 |
| Forests | -214 | -171 | -322 |
| Grassland | 81 | 85 | 74 |
| Wetland (inland) | -176 | -85 | -231 |
| Wetland (lake shore) | -317 | -196 | -423 |
Table 8.
Total water consumption [million m³] by cropland and forest over growing seasons 2024 and 2025.
Table 8.
Total water consumption [million m³] by cropland and forest over growing seasons 2024 and 2025.
| Land cover | 2023 | 2024 | 2025 |
| Cropland outside irrigation area | 34.7 | 35.1 | 31.2 |
| Winter crop inside irrigation area | 75.7 | 71 | 73.1 |
| Summer crop inside irrigation area | 39.6 | 36.8 | 17 |
| Forests | 36.7 | 35.6 | 38.6 |
Disclaimer/Publisher’s Note: The statements, opinions and data contained in all publications are solely those of the individual author(s) and contributor(s) and not of MDPI and/or the editor(s). MDPI and/or the editor(s) disclaim responsibility for any injury to people or property resulting from any ideas, methods, instructions or products referred to in the content. |
© 2026 by the authors. Licensee MDPI, Basel, Switzerland. This article is an open access article distributed under the terms and conditions of the Creative Commons Attribution (CC BY) license (http://creativecommons.org/licenses/by/4.0/).
Copyright: This open access article is published under a Creative Commons CC BY 4.0 license, which permit the free download, distribution, and reuse, provided that the author and preprint are cited in any reuse.


