

Submitted:
17 June 2026
Posted:
18 June 2026
You are already at the latest version
Abstract
This study investigated the spatiotemporal dynamics of climate potential productivity and its correlation with changes in maize productivity in four agroclimatic zones of the Democratic Republic of the Congo (DRC) using Thornthwaite Memorial models and Mann–Kendall Trend Analysis from 1960 to 2024. Climate potential productivity showed contrasting trends between agroclimatic zones. In the Haut-Katanga and Tchuapa zones, the precipitation showed a strong positive relationship with climate potential productivity, emphasizing that water availability from rainfall is the primary driver of agricultural productivity. In Kongo Central and South Kivu zones, both precipitation and temperature indicated a positive relationship with climate potential productivity, highlighting that agricultural productivity in these zones, is highly sensitive to tropical climate variability. The climate resource utilization efficiency demonstrates markedly divergent trends across agroclimatic zones, possibly due to distinct agroclimatic conditions. Climate resource utilization efficiency indicated a fluctuating positive relationship with per-unit maize yield in the four agroclimatic zones. During the studied period, maize yield declined by 19.68%, 17.48%, 13.40%, and 15.65% in the agroclimatic zones of Haut-Katanga, Kongo Central, South Kivu, and Tchuapa, respectively. These findings can help in mitigating climate-related risks and contributing to agricultural resilience and food security.
Keywords:
climate change
; climate potential productivity
; agricultural sustainability
; agroclimatic zone
; maize
1. Introduction
The global temperatures in 2024 reached approximately 1.54 ˚C above pre-industrial average, marking the warmest year on record [1]. The sector of agriculture is one of the most climate-vulnerable, and the change in climate has substantial effects on agricultural production and food systems, especially through decreasing of precipitation and the increasing of global temperatures [2,3]. Climate change is increasingly seen as the major threat to the food security and sustainability of agriculture in diverse context, including sub-Saharan African
The Intergovernmental Panel on Climate Change (IPCC) Working Group II highlights that greenhouse gas-induced changes of climate would have an important effect on agriculture, with the most severe negative impacts occurring in regions that are least able to adjust technologically such as the Democratic Republic of the Congo (DRC) [4]. Given that DRC’s agriculture is predominately rain-fed, climate change poses a serious threat to national food security, considering that more than 70% of population are rural inhabitant mainly depending on agriculture [5,6]. As a result, the impact of climate change on agricultural productivity has become a critical issue for researchers, governments, and policymakers worldwide [7].
The DRC includes four major climatic zones [8,9]. An equatorial climate located near the Equator, with high temperatures and year-round rainfall. A tropical climate in the north and south of the equatorial zone characterized by the wet and dry seasons. The eastern highlands have cooler temperatures and high rainfall with mountainous. The far south is semi-arid and experience low rainfall and prolonged dry periods. The DRC has an exceptional varied topography, including dry rainforests, open woodland forests, savannahs, mountains, as well as cloud and gallery forests, which supports à rich and diverse natural ecosystems, biomes, and habitats, making the country among the most sub-Saharan African ecologically rich regions [10]. Regarding the global warming, climate change not only affects the patterns of temperature and precipitation but also impacts the structure and function of the ecosystems like forests, wetlands and vegetation growth. The changes in the structure and function of the ecosystems lead to environmental variations in a region and have influence on agricultural production.
In the DRC, agriculture is a vital sector for the economy, providing employment to approximately 80% of the population and contributing significantly to food security [11,12]. Major staple crops include cassava, plantains, maize, sweet potato, beans, groundnut, and mangoes [11,13]. Crop production varies by region, but maize is a major cereal staple supported by most of areas. The DRC should promote agricultural development aiming to improve agricultural productivity, support the application of agricultural science and technology, organizational capacities of farmers, and climate smart approach to support production [14]. Climate change may affect at different level the agroecosystems [15]. Assessing the climate potential productivity in the agroclimatic zones of the DRC can provide a scientific foundation and insights for improving yield and agricultural planning basis in the era of climate change.
Climate potential productivity refers to the maximum agricultural yield that crops can achieve per unit area of land when temperature, precipitation and others climate resources are fully utilized [16,17,18]. Agriculture is among the sectors that are most sensitive to climate change. Thus, studying the climate potential productivity aids to assess crops production capacity and provides insight in agricultural trends under climate change, that is important for resources utilization planning [16]. Given that the DRC relies strongly on agriculture with limited economic diversification and predominantly farming population, climate change poses an important treat to livelihoods and food security. Studying the dynamics of climate potential productivity in the DRC may contribute to guiding climate adaptation strategies, increasing agricultural and forestry production, and supporting ecological and socio-economic development across the country.
Several previous studies investigated the effect of climate change on climate potential productivity and crops productivity in different agroclimatic conditions. Bi et al. [18,19], recently investigated the effect of climate change on climate potential productivity in North and Central Africa. Using bioclimatic zones approach, Berg et al. [20] projected the impacts of climate change on potential C4 crop productivity over tropical regions. Stige et al. [21] predicted that the productivity of crops, livestock, and pastures in Africa is associated with climate events in the region. More recently it was found that the impact of climate change on soybean yield depend on the adoption level of climate-resilience practices [22]. Shi et al. [17] studied the effect of climate change on grain production in Liaoning Province, Northeast China. Al Mamun et al. [23], and Abera et al., [24], recently analyzed spatial and temporal impact of climatic factors to crops productivity across regions of Bangladesh and Ethiopia, respectively.
This study aimed (1) to compare the impact of climate change on the climate potential productivity based on meteorological data from 1960 to 2024 among the agroclimatic zones of the DRC using the Miami and Thornthwaite Memorial models, (2) to assess the potential for maize productivity and evaluate the yield gap between actual and potential yields in the four agroclimatic zones, thus, detect and compare opportunities for maize production enhancement. This study can help climate-resource utilization, maize yield optimization, and mitigation of climate related risk, contributing to food security and agricultural resilience in the DRC.
2. Materials and Methods
2.1. Study Area
2.2. Data Source
Dataset for this research includes meteorological data, maize yield per unit area from each agroclimatic zone. Meteorological data comprise annual precipitation, annual average temperature were derived from the fifth generation ECMWF (European Centre for Medium Range Weather Forecasts) atmospheric reanalysis (ERA5, https://climateknowledgeportal.worldbank.org/country/congo-dem-rep/era5-historical, accessed on 12 January 2026). This Copernicus climate store data is globally used with the resolution of 0.25° x 0.25°, or about 25 km close to the equator [25,26,27,28]. This research utilized 1960–2024 annual precipitation and annual average temperature data for the DRC. Maize yield per unit area data for each selected agroclimatic zone were collected from the National Agricultural Statistics Department, Ministry of Agriculture of the DRC. We processed for in site collection of maize yield records at the National Agricultural Statistics Department office. The maize yield per unit area, that represent the actual harvest per unit of cultivated land, were converted from the original national statistical unit (tone/hm²) to g/m² using a conversion factor of 1 tone/hm² = 100 g/m² to ensure consistency in measurement.
2.3. Miami and Thornthwaite Memorial Models
2.3.1. Temperature and Precipitation Potential Productivity
Temperature and precipitation are the two main factors that induce plant development, growth and biomass production. Though climate production potential is measured to establish the potential productivity related to temperature and precipitation [29]. The Miami model, an empirical method that derives relationships between annual mean temperature and annual precipitation, can be applied to agricultural ecosystems [30]. Although the mechanistic processes of the model are not much detailed, its simplicity and accuracy make it valuable. The Miami model has recently been used in several ecological and agricultural studies [22,31]. The temperature potential productivity and precipitation potential productivity are calculated as in Equations (1) and (2).
Where t refers to the annual average temperature (˚C); r denotes the annual precipitation (mm); Yt and Yr denote the temperature-related and precipitation-related production potentials (g/m².a), respectively; and 3000 represents the maximum annual dry matter yield (g/m²) of natural vegetation per unit area
2.3.2. Evapotranspiration Potential Productivity
To assess the evapotranspiration potential productivity (Ye), the widely used Thornthwaite Memorial model were applied [32,33,34]. The main advantage of the model is the integration into its formulas the key and multiple climatic variables including actual and potential evapotranspiration, solar radiation, saturation deficits, wind speed, temperature and precipitation. The corresponding equations are as follow [19,35]:
where the unit of Ye refers to the evapotranspiration potential productivity (g/m².a), V is the average annual evapotranspiration (mm), L is the average annual evaporation (mm), T is average annual temperature (˚C) and r is the annual precipitation (mm), 1.05 is a correction coefficient relating for precipitation-evapotranspiration relationship, constants 300, 25, and 0.05 represent empirical parameters employed to estimate maximum evapotranspiration based on temperature.
2.3.3. Standard Climate Potential Productivity
The minimum value between temperature-related, precipitation-related, and evapotranspiration-related climatic potential productivities is considered as the standard climate potential productivity (Yb). Liebig’s Law of the Minimum [16], suggests that the climatic potential productivity of a region is defined by the lowest value between the calculated temperature production potential, precipitation production potential, and evapotranspiration production potential. The relevant calculation formula is denoted in Equation (6).
2.3.4. Climate Resource Utilization Efficiency
Climate resource utilization efficiency (CRUE) denotes the ratio of the actual maize yield per unit area in a given region to the climate potential productivity, expressed as a percentage [16]. The CRUE is calculated as in Equation (7).
where CRUE refers to the climate resource utilization efficiency (expressed as a percentage), Amy is actual maize yield per unit area, calculated from statistical yearbook records collected at the Ministry of agriculture; and Yb represents climate potential productivity.
CRUE = 100 × Amy/Yb
2.3.5. Estimation of Potential for Maize Production Increase
Climate potential productivity denotes the maximum yield that cultivated land can achieve under optimal conditions, e.g. the optimal utilization of available resources including sunlight, water, soil and terrain conditions [36,37]. The present research estimates the potential for maize production increase using the formula presented in equation (8) [38,39]:
where Y represents the total potential for increased production (in g/m²); Yb refers to the standard climate potential productivity (in g/m²); and AP refers to the actual productivity.
Y = Yb - AP
2.4. Mann–Kendall Trend Analysis
The Mann–Kendall (MK) trend analysis is commonly used in hydrometeorological researches when study temporal pattens in climate and water resource data. The MK test has been widely used to analyze temporal trends in diverse climatic and hydrological variables [40,41,42], and can be calculated using the following Equations (9)–(11).
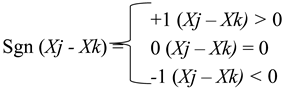
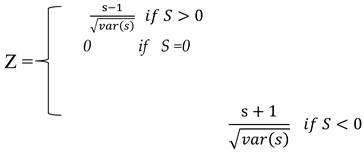
Before the Mann–Kendall (MK) test, we performed Trend-Free Pre-Whitening (TFPW) to avoid inflated significance due to serial correlation in annual climate series. Autocorrelation function (ACF) in Microsoft® Excel® 2019 MSO (Version 2508 Build 16.0.19127.20302) 64-bit was applied to assess autocorrelation. Where autocorrelated series were detected, linear trend was removed thereafter residual autocorrelation were eliminated using an AR (1) model. Then, TFPW-processed data were used to conduct MK test. In addition, Sen’s slope estimator was performed to assess the magnitude of trends in each series. The MK test Z-value (Ze) and a 95% confidence interval (CI: [-1.96, +1.96]) were used to interpret the results.
3. Results
3.1. Spatio-Temporal Variation Patterns of the Climate
The annual average temperature variation in the four agroclimatic zones of DRC between 1960 and 2024 ranged from 22.18 ˚C to 20.51 ˚C in Haut-Katanga, 24.98 ˚C to 22.93 ˚C in Kongo Central, 22.72 ˚C to 19.68 ˚C in South-Kivu and 27.07 ˚C to 23.67 ˚C in Tchuapa. The highest temperature (27.07 ˚C) was recorded in 2024 in Tchuapa province, the lowest (19.68 ˚C) in 1962 in South-Kivu, yielding à difference of 7.39 ˚C (Figure 2). Significant interannual variability is observed among agroclimatic zones, with annual average temperature curve showing the peak and lowest points in 2005 and 1974, respectively for Haut-Katanga province, in 2020 and 1961 for Kongo Central, 2024 and 1962 for Tchuapa and South-Kivu (Figure 2). Similarly, as shown in annual precipitation curve (Figure 3), the annual precipitation ranged from 1,823.04 mm to 1,113.31 mm in Haut-Katanga, 1555.18 mm to 684.36 mm in Kongo Central, 3,617.59 mm to 2,211.90 mm in South-Kivu and 2,472.55 mm to 1,006.13 mm in Tchuapa. The peak precipitation was observed in 1962 in South-Kivu and the minimum in 1978 in Kongo Central. Overall, linear trend analysis of annual precipitation, reveals a fluctuating downward trend for three of the four agroclimatic zones. Kongo Central showed an upward but not consistent trend (Figure 3).
3.2. Spatio-Temporal Variation of Climate Potential Productivity
The multi-year average of the temperature-based climate potential productivity (Yt) was 231.95 g/m².a in Haut-Katanga, 243.32 g/m².a in Kongo Central, 228.73 g/m².a in South-Kivu and 250.55 g/m².a in Tchuapa. The increasing growth rates were 1.14 g/m².10a, 1.28 g/m².10a, 1.98 g/m².10a and 1.55 g/m².10a for Haut-Katanga, Kongo Central, South-Kivu and Tchuapa, respectively (Table 1). The cumulative anomaly curve indicates an upward trend in all the agroclimatic zones (Figure S1).
The potential productivity of climatic precipitation (Yr) exhibited a decreasing trend in three agroclimatic zones, with negative mean decadal growth rates of -2.97 g/m².10a, -4.39 g/m².10a and -9.70 g/m².10a for Haut-Katanga, South-Kivu and Tchuapa, respectively (Table 1). The precipitation potential productivity for Kongo Central indicates an increasing trend with a positive decadal growth rate of 2.72 g/m².10a. The cumulative anomaly curve of Kongo Central shows a fluctuating decline trend from 1960 to 1981, followed by à fluctuating increase from 1982 to 2024 (Figure S2). The cumulative anomaly in the Haut-Katanga, South-Kivu and Tchuapa shows à sustained decline trend from 1960 to 2024 (Figure S2).
The overall means of the evapotranspiration climate potential productivity (Ye) in the four agroclimatic zones of DRC ranged from 208.33 g/m².a to 182.29 g/m².a (Figure S3), with the highest recorded in Tchuapa and the lowest in Haut-Katanga, resulting in difference of 26.04 g/m².a. The cumulative anomaly curve indicates four phases in Haut-Katanga: a fluctuating decline from 1961 to 1976, a slow recovery from 1977 to 1979, followed by subsequent decline from 1980 to 2016 and finally a fluctuating upward trend from 2017 to 2024 (Figure S3). In Kongo Central the cumulative curve shows two distinct phases, a fluctuating downward trend from 1961 to 1983 followed by a fluctuating upward trend from 1984 to 2024. The cumulative curves of South-Kivu and Tchuapa zones exhibits a fluctuating upward and a sustained declining trend from 1960 to 2024, respectively (Figure S3). The mean decadal growth rate growth rates were negative in Haut-Katanga and Tchuapa (Table 1).
The linear regression analysis of the standard climate potential productivity (Yb) indicated an overall decreasing trend in Haut-Katanga and Tchuapa. The linear regression analysis in South-Kivu and Kongo Central showed an increasing trend during 1960-2024 (Figure 4). The multi-year average of the standard climate potential productivity was 179.63 g/m².a in Haut-Katanga, 167.16 g/m².a in Kongo Central, 200.42 g/m².a in South-Kivu and 203.39 g/m².a in Tchuapa. The average decadal growth rates were negative in Haut-Katanga (-1.29 g/m².10a), and Tchuapa (-6.74 g/m².10a). Kongo Central and South-Kivu showed positive average decadal growth rate of 2.72 g/m².10a and 1.09 g/m².10a, respectively (Table 1). The cumulative anomaly curve patterns of Kongo Central and South-Kivu are consistent with those indicated by the evapotranspiration climate potential productivity. The cumulative anomaly curve of Tchuapa showed the same patterns with those observed in precipitation climate potential productivity (Figure 4).
3.3. Mann-Kendall Sneyers Analysis
The study used the Mann–Kendall non-parametric test to analyze temporal trends in climate productivity (Yb) in the four agroclimatic zones of the DRC (Figure 5). In Haut-Katanga zone, the UF statistics remained above zero from 1960 to 1965, then went below zero after 1965 (with short transient above zero from 1980 to 1981) and surpassed the critical threshold of ±1.96 in 1990, exhibiting a significant declining trend.
The UF and UB curves intersected in 1992 and 1993 below the critical threshold suggesting definitive mutation points (Figure 5a). The UF statistics values in Kongo Central were below zero during 1960 to 1972 and 1976 to 1989, exceeding the critical value of ±1.96 between 1981 and 1984 (indicating a significant decrease), then stabilized above zero after 1990, exceeding the critical value after 1999. The intersection of the UF and UB curves reveals a climate change-induced shift in Yb under global warming in 1993 (Figure 5b). In South-Kivu zone, the UF statistics values were below zero from 1960 to 1965 and 1975 to 1977, then remained above zero after 1978 surpassing the critical threshold after 1982. The UF and UB intersection curves indicates a climate change-induced shift in Yb under global warming. 2005 (95% confidence level) was identified as à change point showing significant trends before and after this year, which means the Yb of South-Kivu underwent a change in 2005 (Figure 5c). In Tchuapa agroclimatic zone the UF statistics values were below zero from 1962 to 1978, then went above zero without exceeding the critical threshold from 1979 to 2000 after stabilized below zero exceeding the critical value of ±1.96 after 2005 (Figure 5d). The intersection of the UF and UB curves indicates a climate change-induced shift in Yb under global warming. Sliding t-test statistics analysis (95% confidence level) identifies 1993 as a change point, with values showing significant trends only after this year, which indicates that the Yb of Tchuapa agroclimatic zone underwent a sudden change in that year.
After TFPW preprocessing and Holm-Bonferroni correction, the Mann-Kendall analysis indicated the following trend for standard climate potential productivity: In Haut-Katanga Sen’s slope was -0.159 g/·m².a with a Z-statistic of -0.662 (|Z| < 1.96), indicating a non-significant decreasing trend. In Kongo Central Sen’s slope was -0.035 g/·m².a with a Z-statistic of -0.356 (|Z| < 1.96), indicating a non-significant decreasing trend. In South-Kivu Sen’s slope was 0.008 g/·m².a with a Z-statistic of 0.469 (|Z| < 1.96), indicating a statistically non-significant increasing trend. In Tchuapa Sen’s slope was -0.039 g/·m².a with a Z-statistic of -1.129 (|Z| < 1.96), indicating a non-significant decreasing trend.
3.4. Response of Climate Potential Productivity to Climate Change
A time series trend study was conducted to compare the relationship between the climate potential productivity, temperature and precipitation among different agroclimatic zones of the DRC. In Haut-Katanga and Tchuapa, the precipitation indicated a significant positive correlation with climate potential productivity (Yb) (R² = 0.8316 and R² = 0.8773, p < 0.05, respectively) and a significant negative relationship with temperature, indicating that climate potential productivity (Yb) increased with the increase of precipitation but decreased with the increase of temperature in these agroclimatic zones (Figure 6ad). In contrast, the temperature showed a significant positive correlation with the climate potential productivity in South-Kivu (R² = 0.7413, p < 0.05), with à non-significant positive correlation with precipitation (R² = 0.0794, p > 0.05), revealing that climate productivity is influenced by both temperature and precipitation in the zone (Figure 6c). Similarly, in Kongo Central climate potential production is influenced by both meteorological factors with precipitation showing a significant positive correlation (R² = 0.9928, p < 0.05) and a non-significant positive correlation with the temperature (R² = 0.1241, p > 0.05) (Figure 6b).
To study the synergistic impacts of meteorological factors on climate potential productivity, we analyzed the quantitative relationships among the climate potential and two climate key variables including the annual average temperature and annual precipitation and developed, for each agroclimatic zone, a multiple regression model (Table 2). All the four agroclimatic zones studied exhibited à significance probability of p < 0.001 with a coefficient of correlation (R²) varying between 0.8344 and 0.9722, indicating that the regression equations are statistically significant with strong correlation. The regression analysis indicated a lowest AICc value (-89.2741) in South-Kivu, revealing the strongest positive correlation among the two meteorological factors and climate potential productivity in this zone as compared to Haut-Katanga, Kongo Central and Tchuapa agroclimatic zones (Table 2). These results may be used for future climate scenario studies investigating the effects of climate factors to agricultural production.
3.5. Comparison of Potential for Maize Production Increase in the Agroclimatic Zones of the DRC
The study compared the climate resource utilization efficiency, standard climate potential productivity (Yb), maize yield per unit area and the potential for maize production growth among the agroclimatic zones of the DRC from 1960 to 2024. In Haut-Katanga, the climate resource utilization efficiency, climate potential productivity and maize yield per unit area indicated a fluctuating trend with average decadal decreasing rates of -0.84%, -1.29 g/m².10a and -1.99 g/m².10a, respectively. The potential for maize production increase showed fluctuating trends with an average increasing rate of 0.64 g/m².10a per decade (Figure 7a and Table 3). In Kongo Central and South-Kivu, the climate resource utilization efficiency, and maize yield per unit area showed fluctuating decreasing trend with decadal average growth rates of (-1.63% and -1.33 g/m².10a) and (-1.81% and -3.14 g/m².10a), respectively (Figure 7bc and Table 3). The Tchuapa agroclimatic zone exhibited fluctuating increasing trend for the climate resource utilization efficiency with à decadal growth rate of 0.36%. Climate potential productivity, maize yield per unit area and potential for maize production increase indicated fluctuating declining trend with average decreasing rate of -6.26 g/m².10a, -1.97 g/m².10a and -4.29 g/m².10a, respectively (Figure 7d).
The correlation coefficient between climate resource utilization efficiency and standard climate potential productivity (Yb) indicated a negative relationship in all the four agroclimatic zones (Figure 8), however, the relationship was statistically insignificant for Haut-Katanga (R² = 0.0724, p >0.05) and South-Kivu (R² = 0.2904, p >0.05). Conversely, the correlation coefficient between climate resource utilization efficiency and maize yield per unit area showed a strong and statistically significant positive relationship in Haut-Katanga, Kongo Central and South-Kivu. the correlation coefficient between climate resource utilization efficiency and grain yield per unit area in Tchuapa exhibited a positive but not statistically strong relationship (R² = 0.2905, p >0.05) (Figure 8).
4. Discussion
Comparing the spatial and temporal variability and trends of climatic factors and their impact on crop yields, is critical for understanding effective adaptation strategies by specific zone, especially in regions like the DRC, with a diverse agroclimatic zones, where agriculture is mainly rainfed [5,9]. The present study emphasizes the temporal and spatial variability in climate factors including precipitation, temperature, and evapotranspiration. This variability highlights the importance of understanding local climate patterns to make agricultural decision. The fluctuating increase or decrease in temperature observed in the agroclimatic zones of the DRC is a concerning trend. High temperature can be responsible of crop wilting and sterility, while low temperatures can cause cold injury and reduction of plant growth and development [43,44]. In addition, increased temperatures with decreased rainfall and without irrigation water may cause drought, crop loss, and migration of insects and human generation [23,45,46]. The results demonstrate significant warming trend in all the agroclimatic zones, accompanied by decreasing precipitation in most of the studied zones, showing the pattern toward warmer and drier conditions, consistent with previous observations in the Central Africa, region shared by the DRC [18].
The linear regression analysis indicates contrasting trend in the standard climate potential productivity between agroclimatic zones. The Kongo Central and South-Kivu zones reveal an overall increasing trend of the Yb during 1960-2024 (Slope = 0.37, R² = 0.19 and Slope = 0.09, R² = 0.36, respectively) while the Haut-Katanga and Tchuapa indicate an overall decreasing trend during the same period (Slope = -0.14, R² = 0.17 and Slope = -0.68, R² = 0.66, respectively). The varied climate potential productivity patterns across agroclimatic zones of the DRC are most likely related to their distinct climatic regimes and ecological sensitivity. Situated on the periphery of the Central Congo Basin, the South-Kivu and Kongo Central are characterized by rainy seasons and prolonged dry seasons, experiencing rising temperatures, late onset of rains, and unusual drought conditions, which disrupt agricultural cycles [47]. Both zones are identified as having less stable forest ecosystems, significant pressure from human activity, particularly the demand for charcoal (wood fuel) and agriculture, compared to Tchuapa zone situated in the Central Congo Basin [47], making them highly susceptible to drought, heat stress, and shifts in ecosystem functions. Tchuapa zone lies in the heart of the Congo Basin, experiencing a hot, humid, and equatorial climate with high, relatively consistent rainfall throughout the year and two main rainy seasons, dominated by dense tropical moist forests (lowland forests) ecosystems. Located in the southeast, Haut-Katanga has a tropical, dry-subhumid climate with a more distinct "Congolese winter" (dry season from June to August), characterized by Miombo woodlands, a combination of tropical grasslands, savannahs, and open canopy forests [48]. These differences among agroclimatic zones emphasize how the same global climate factors, including warming and rising CO2 concentrations, can impact productivity differently based on sensitivity of local ecosystem drivers.
The results indicated a strong positive correlation between the standard climate potential productivity and the precipitation in Haut-Katanga and Tchuapa, revealing that water availability from rainfall is the primary driver of ecosystem productivity in these regions. Despite difference vegetation types (savanna versus forest) between the two regions, the correlation is strong because both regions rely on timely rainfall to prevent water stress and maintain optimal soil moisture for vegetation growth [18]. In Kongo Central and South-Kivu, the climate potential productivity positively correlated with both temperature and precipitation. The correlation between climate potential productivity and both key climate factors is strong because agriculture in these regions is heavily reliant on rain-fed systems and highly sensitive to tropical climate variability. The climate potential productivity—defined as the maximum biological yield possible under optimal climate conditions—fluctuates in tandem with these variables because they determine the availability of moisture and the metabolic rate of crops [49,50]. These findings are in line with earlier studies demonstrating that precipitations is the key limiting factor on climatic potential production, emphasizing that the difference in water availability would be the main climatic driver of agriculture development for a specific region [19,51,52].
This study compared climate resource utilization efficiency among four agroclimatic zones of the DRC using standard climate potential productivity and the actual maize yield. From 1960 to 1998, climate resource utilization efficiency consistently decreased in South-Kivu and Tchuapa regions, followed by a stable and consistent increase trend after 1999 in South-Kivu and Tchuapa regions, respectively. In Haut-Katanga the decreasing trend was observed from 1960 until 1982, followed by a relatively stable fluctuating trend. In Kongo Central, the climate resource utilization efficiency showed a decreasing trend from 1978 to 2016. Climate resource utilization efficiency exhibits significantly different trends across regions due to variations in climate conditions, economic development, technological capabilities, and agricultural management practices [53]. A study [54] has shown that without adaptation, water use efficiency for crops like maize is set to decrease due to increasing temperatures and erratic rainfall in South-Kivu region. However, the use of soil and water conservation practices, such as tied ridges, has shown to increase maize yield by 48.2%. in the Tchuapa region the climate modeling indicates that temperature increases and agricultural activities, may affect its long-term resource efficiency and improve the suitability of some crops [55].
Since 1980s decades maize yield per unit area showed a fluctuating decline trend in all the agroclimatic zones of the DRC. For example, maize yield in Haut-Katanga decreased from 69.35 g/m² in 1960s to 55.70 g/m² in 1980s, in Kongo Central maize yield decreased from 80.31 g/m² to 66. 27 g/m², in South-Kivu maize yield declined from 104.96 g/m² to 90.89 g/m² and in Tchuapa maize yield decreased from 88.56 g/m² to 74.70 g/m² has for the same periods. Representing a reduction of 19.68%, 17.48%, 13.40% and 15.65% respectively for Haut-Katanga, Kongo Central, South-Kivu and Tchuapa. This stagnation since 1980s is primarily driven by the deterioration of agricultural infrastructure, lack of improved inputs, attack of pest and diseases mainly fall armyworm and stem borers and climate variability. Other study conducted in the savannah region of Eastern Kasai, observed that maize yields decreased significantly over time, with reported figures falling from 1.6 t/ha in 1999 to 0.75 t/ha by 2004 [56]. Climate resource utilization efficiency showed a negative correlation with standard climate potential productivity (Yb) in the four agroclimatic zones of the DRC. Conversely, climate resource utilization efficiency exhibited a positive relationship with per-unit maize yield in the four agroclimatic zones. This indicates that improving the maize yield is a crucial strategy for increasing climate resource utilization efficiency. However, the standard climate potential productivity (Yb) has declined from 1960s to 2010s in Haut-Katanga, Kongo Central and Tchuapa zones, reflecting a gap between actual yields and climatic potential. In the South-Kivu zone, the standard climate potential productivity (Yb) has increased from 198.39 g/m² in 1960s to 203.84 g/m² in 2010s, suggesting future potential for boosting maize production only through favorable climatic conditions.
In summary, improving the maize yield is the key pathway for increasing climate resource utilization efficiency, although constraints vary across agroclimatic zones. Regarding the spatial distribution of the climate potential productivity, zone-based strategies should be implemented to improve yield potential by addressing specific limiting factors in each of the agroclimatic zone. In the zones like South-Kivu and Tchuapa characterized by rainfed agriculture, effort should focus on soil erosion control due to hilly terrain and high acidity in some areas, use intercropping maize with peanuts or cassava to maximize smallholder land, climate-smart agriculture practices including minimum tillage, mulching crop rotation, adjusting the plating time [50,57,58]. In the savannah area of Haut-Katanga, the mechanization, use of drought-tolerant varieties of seeds and fertilizers should be prioritized [59,60]. In the agroclimatic zone of Kongo central where soil acidity is a significant problem; measures including soil acidity management (liming), improved nutrient and moisture availability management, as this region has high rainfall that leaches nutrients; can boost maize yield [57,61]. In response to the agroclimatic zone-based trends of increasing temperatures and changes in growing seasons, maize planting calendar are being shifted in some agroclimatic zones like the South-Kivu zone and this measure should be implemented in others zones to avoid peak heat during times especially in savannah zone of Haut-Katanga and coastal area of Kongo central [50,62].
Consequently, subsequent initiatives should focus on promoting specific actions for each agroclimatic zone like integrated soil fertility management practices including combining and optimizing organic with inorganic fertilizers, use improved varieties, soil amendment in some area, conservation agriculture techniques and climate smart agriculture practices. These efforts are important for ensuring the sustainable development of agriculture in different agroclimatic zones of the DRC facing future climate change scenarios and for increasing the climate resource utilization efficiency.
This research presents some drawbacks. Firstly, the Thornthwaite Memorial model does not consider different types of crops, land cover heterogeneity and soil properties. Describing the climate production potential as a generalized metric may neglect the distinct response of each type of crop to climatic conditions. Secondly, although the results underscored the relationship between temperature and photosynthesis in different zones of the DRC, we recognize the necessity to investigate altitudinal gradients in each agroclimatic zone. Further study in some zones like the mountainous South-Kivu and the Kongo Central characterized by a transition from a narrow coastal plain to a hilly interior, should integrate the influence of elevation on the relationships between temperature and crop yield, as topography-dependent thermal regimes may significantly affect the climate potential productivity responses. And lastly, The Thornthwaite method predicts evapotranspiration solely based on temperature and precipitation. This generalization generates substantial bias, particularly in tropical and rainfall-variable zones including agroclimatic zones of the DRC, compromising the reliability of climate production potential trend identification at the local level. Our future investigation will focus on how to incorporate other meteorological parameters like solar radiation, relative humidity, and wind speed, coupling satellite-derived evapotranspiration products; like MOD16 (MODIS), GLEAM, SSEBop, WaPOR (FAO) or FLDAS; for validation where data permit.
5. Conclusions
This study investigated the dynamic of climate potential productivity and its effects on maize yield in four agroclimatic zones of the DRC from 1960-2024 using the Miami and Thornthwaite Memorial models. The findings indicate a varied climate potential productivity pattern across agroclimatic zones mostly attributed to their distinct climatic regimes and ecological sensitivity. While the precipitation showed a strong limiting climate factor in Haut-Katanga and Tchuapa, emphasizing that water availability from rainfall is the primary driver of agricultural productivity in these regions; in Kongo Central and South-Kivu both precipitation and temperature indicated strong correlation with climate production potential highlighting that agricultural productivity in these zones, heavily reliant on rain-fed systems, is highly sensitive to tropical climate variability. In addition, climate resource utilization efficiency exhibits significantly different trends across regions possibly due to distinct agroclimatic conditions. Overall, maize yield per unit area showed a fluctuating decline trend in the four agroclimatic zones of the DRC. climate resource utilization efficiency exhibited a positive relationship with per-unit maize yield in the four agroclimatic zones. These results advocate for the incorporation of climatic features and socioeconomic factors in the DRC to improve climate resilience via broad interventions, such as the strengthening of early warning systems, the improvement of water resource management, and the advancement of climate-smart agriculture, as well as the promotion of local and regional collaboration and policy integration.
Supplementary Materials
The following supporting information can be downloaded at the website of this paper posted on Preprints.org, Figure S1: Interannual variation in Temperature climate potential productivity in (a)Haut-Katanga, (b) Kongo Central, (c) South-Kivu and (d) Tshuapa Provinces from 1960 to 2024; Figure S2: Interannual variation in Precipitation climate potential productivity in (a)Haut-Katanga, (b) Kongo Central, (c) South-Kivu and (d) Tshuapa Provinces from 1960 to 2024; Figure S3: Interannual variation in Evapotranspiration climate potential productivity in (a)Haut-Katanga, (b) Kongo Central, (c) South-Kivu and (d) Tshuapa Provinces from 1960 to 2024.
Author Contributions
Conceptualization, M.J.M.; methodology, M.J.M., D.M.S. and M.M.B.; software, M.J.M. and D.M.S.; formal analysis, M.J.M.; investigation, M.J.M.; resources, M.J.M.; data curation, M.J.M.; writing—original draft preparation, M.J.M.; writing—review and editing, M.J.M., D.M.S. and M.M.B.; visualization, M.J.M. and D.M.S.; supervision, M.J.M.; project administration, M.J.M. All authors have read and agreed to the published version of the manuscript.
Funding
This research received no external funding. This research was supported by the Centre for Agriculture and Environment, the internal research unit of the faculty of Geomatic and environnement engineering, Institut Supérieure Pédagogique et Technique de Kinshasa (ISPT-KIN), Kinshasa, Democratic Republic of the Congo.
Data Availability Statement
The meteorological were derived from the fifth generation ECMWF (European Centre for Medium Range Weather Forecasts) atmospheric reanalysis (ERA5, https://climateknowledgeportal.worldbank.org/country/congo-dem-rep/era5-historical, accessed on 12 January 2026). Agricultural datasets analyzed in this study were obtained from the Department of National Agricultural Statistics, Ministry of Agriculture, Government of the DRC. Due to restrictions set by Department of National Agricultural Statistics, the authors are not permitted to publicly share these compiled datasets; access requires direct permission from the data producer.
Acknowledgments
We would like to thank the Department of National Agricultural Statistics, Ministry of Agriculture, Government of the DRC, for providing the maize yield data.
Conflicts of Interest
The authors declare no conflicts of interest.
References
- World Meteorological Organization. WMO Confirms 2024 as Warmest Year on Record at about 1.55°C above Pre-Industrial Level. Available online: https://wmo.int/news/media-centre/wmo-confirms-2024-warmest-year-record-about-155degc-above-pre-industrial-level#:~:text. (accessed on 17 December 2025).
- Habib-ur-Rahman, M.; Ahmad, A.; Raza, A.; Hasnain, M.U.; Alharby, H.F.; Alzahrani, Y.M.; Bamagoos, A.A.; Hakeem, K.R.; Ahmad, S.; Nasim, W.; et al. Impact of Climate Change on Agricultural Production; Issues, Challenges, and Opportunities in Asia. Front. Plant Sci. 2022, 13. [Google Scholar] [CrossRef] [PubMed]
- dos Santos, C.V.; de Oliveira, A.F.; Filho, J.B.D.S.F. Potential Impacts Of Climate Change On Agriculture And The Economy In Different Regions of Brazil. Rev. De Econ. E Sociol. Rural 2022, 60, 1–24. [Google Scholar] [CrossRef]
- The Intergovernmental Panel on Climate Change; W. group I. Policymaker Summary of Working Group II ( Potential Impacts of Climate Change ); 1988. [Google Scholar]
- Nsombo, Blandine M.; Thomas, Timothy S.; Kyotalimye, Miriam; Democratic Republic of Congo, M.W. Mining Law and Economic Policy: Critical Perspectives and Challenges for Mining in Africa 2022, 19–35.
- Huggins, C.; Governance, L.; Security, F.; Governance, L.; Investment, C.; The, A.; Africa, S.; Governance, L. Land-Grabbing, Agricultural Investment and Land Reform. Univ. Otawa 2014, 36, 231–238. [Google Scholar]
- Kotir, J.H. Climate Change and Variability in Sub-Saharan Africa: A Review of Current and Future Trends and Impacts on Agriculture and Food Security. Environ. Dev. Sustain. 2011, 13, 587–605. [Google Scholar] [CrossRef]
- Hales, S.; Tadross, M. Climate Science Basis: In: Annex II. Country Case Studies Developing the Climate Science Basis for Climate Action. Dev. Clim. Sci. Basis Clim. Action 2021, 184. [Google Scholar]
- Bangelesa, F.; Abel, D.; Pollinger, F.; Rai, P.; Ziegler, K.; Ebengo, D.; Tshimanga, R.M.; Mala Ali, M.; Knight, J.; Paeth, H. Projected Changes in Rainfall Amount and Distribution in the Democratic Republic of Congo – Evidence from an Ensemble of High-Resolution Climate Simulations. Weather Clim. Extrem. 2023, 42, 100620. [Google Scholar] [CrossRef]
- Dove, M.; Lang, Y.; Zermoglio, F.; Johnston, J. Climate Risk Profile: Congo, Democratic Republic; Washington, WA, USA, 2021. [Google Scholar]
- Jeníček, V.; Grófová, Š. The Least Developed Countries – the Case of the Congo D.R. Agric. Econ. 2015, 61, 135–148. [Google Scholar] [CrossRef]
- Sonwa, D.J.; Nkem, J.N.; Idinoba, M.E.; Bele, M.Y.; Jum, C. Building Regional Priorities in Forests for Development and Adaptation to Climate Change in the Congo Basin. Mitig. Adapt. Strateg. Glob. Change 2012, 17, 441–450. [Google Scholar] [CrossRef]
- Lubanda1, J.-P.E.; L. Smutka1, R.S. Agricultural Production and Trade Structure Profile in Democratic Republic of Congo (DRC) Introduction. AgEcon Search 2016, VIII, 18. [Google Scholar] [CrossRef]
- Georges, B.S. Plan National de Developpement Economique de La Republique Democratique Du Congo ( RDC ) a Moyen Terme ( 2025 – 2029 ): Problemes et Defis. Glob. Sci. J. (GSJ) 2025, 13, 1858–1873. [Google Scholar]
- Olowoyeye, T.; Abegunrin, G.; Sojka, M. Are Agroecosystem Services Under Threat? Examining the Influence of Climate Externalities on Ecosystem Stability. Atmosphere 2024, 15. [Google Scholar] [CrossRef]
- Zhao, H.Y.; Tian, B.X.; Gong, L.J.; Qu, H.H.; Ji, S.T.; Li, X.F.; Zhang, X. Climate-Induced Potential Productivity of Forest Vegetation during the Past 308 Years in Northern Da Hinggan Mountain Region, China. Acta Ecol. Sin. 2017, 37. [Google Scholar] [CrossRef]
- Shi, D.; Wang, S.; Zhuang, Q.; Yang, Z.; Wang, Y.; Jin, X. Spatiotemporal Dynamics of Climate Potential Productivity of Agricultural Ecosystems in Liaoning Province, China, During 1950–2023. Agronomy 2025, 15, 1–24. [Google Scholar] [CrossRef]
- Bi, M.; Ren, F.; Xu, Y.; Guo, X.; Zhou, X.; Bersselaar; Van Den, D.; Li, X. Impact Assessment of Climate Change on Climate Potential Productivity in Central Africa Based on High Spatial and Temporal Resolution Data. Land 2025, 1–16. [Google Scholar]
- Bi, M.; Wan, L.; Zhang, Z.; Zhang, X.; Yu, C. Spatio-Temporal Variation Characteristics of North Africa’s Climate Potential Productivity. Land 2023, 12. [Google Scholar] [CrossRef]
- Berg, A.; De Noblet-Ducoudré, N.; Sultan, B.; Lengaigne, M.; Guimberteau, M. Projections of Climate Change Impacts on Potential C4 Crop Productivity over Tropical Regions. Agric. For. Meteorol. 2013, 170, 89–102. [Google Scholar] [CrossRef]
- Stige, L.C.; Stave, J.; Chan, K.S.; Ciannelli, L.; Pettorelli, N.; Glantz, M.; Herren, H.R.; Stenseth, N.C. The Effect of Climate Variation on Agro-Pastoral Production in Africa. Proceedings of the National Academy of Sciences of the United States of America 2006, 103, 3049–3053. [Google Scholar] [CrossRef] [PubMed]
- MacCarthy, D.S.; Traore, P.S.; Freduah, B.S.; Adiku, S.G.K.; Dodor, D.E.; Kumahor, S.K. Productivity of Soybean under Projected Climate Change in a Semi-Arid Region of West Africa: Sensitivity of Current Production System. Agronomy 2022, 12. [Google Scholar] [CrossRef]
- Al Mamun, M.A.; Nihad, S.A.I.; Sarkar, M.A.R.; Sarker, M.R.; Skalicka, J.; Skalicky, M. Spatio-Temporal Variability of Climatic Variables and Its Impacts on Rice Yield in Bangladesh. Front. Sustain. Food Syst. 2023, 7. [Google Scholar] [CrossRef]
- Abera, K.; Gayler, S.; Piepho, H.P.; Streck, T. Spatiotemporal Climatic Signals in Cereal Yield Variability and Trends in Ethiopia. Sci. Rep. 2025, 15, 1–21. [Google Scholar] [CrossRef] [PubMed]
- Wollburg, P.; Bentze, T.; Lu, Y.; Udry, C.; Gollin, D. Agricultural Productivity Growth in Africa: New Evidence from Microdata. World Bank. Econ. Rev. 2023, undefined–undefined. [Google Scholar]
- Soci, C.; Hersbach, H.; Simmons, A.; Poli, P.; Bell, B.; Berrisford, P.; Horányi, A.; Muñoz-Sabater, J.; Nicolas, J.; Radu, R.; et al. The ERA5 Global Reanalysis from 1940 to 2022. Q. J. R. Meteorol. Soc. 2024, 150, 4014–4048. [Google Scholar] [CrossRef]
- Gleixner, S.; Demissie, T.; Diro, G.T. Did ERA5 Improve Temperature and Precipitation Reanalysis over East Africa? Atmosphere 2020, 11, 1–19. [Google Scholar] [CrossRef]
- Rolle, M.; Tamea, S.; Claps, P. Climate-Driven Trends in Agricultural Water Requirement: An ERA5-Based Assessment at Daily Scale over 50 Years. Environ. Res. Lett. 2022, 17. [Google Scholar] [CrossRef]
- Lieth, H.; Box, E. Evapotranspiration and Primary Productivity! C.w Thornthwaite Memorial Model. Climatology 1972, 25, 35–46. [Google Scholar]
- Adams, B.; White, A.; Lenton, T.M. An Analysis of Some Diverse Approaches to Modelling Terrestrial Net Primary Productivity. Ecol. Model. 2004, 177, 353–391. [Google Scholar] [CrossRef]
- Tao, F.; Zhang, Z.; Yokozawa, M. Dangerous Levels of Climate Change for Agricultural Production in China. Reg. Environ. Change 2011, 11, 41–48. [Google Scholar] [CrossRef]
- Redmann, R.E. Primary Productivity. Nat. Grassl. 1992, 75–93. [Google Scholar] [CrossRef]
- Schulze, R.E.; Kiker, G.A.; Kunz, R.P. Global Climate Change and Agricultural Productivity in Southern Africa. Glob. Environ. Change 1993, 3, 330–349. [Google Scholar] [CrossRef]
- Barrios, S.; Ouattara, B.; Strobl, E. The Impact of Climatic Change on Agricultural Production: Is It Different for Africa? Food Policy 2008, 33, 287–298. [Google Scholar] [CrossRef]
- Sneyers, R. On the Statistical Analysis of Series of Observations. World Meteorol. Organ. (WMO) 1990, Technical, 192. [Google Scholar]
- Liu, W.; Sang, T. Potential Productivity of the Miscanthus Energy Crop in the Loess Plateau of China under Climate Change. Environ. Res. Lett. 2013, 8. [Google Scholar] [CrossRef]
- Lijuan, Gong; Dan, Liu; Lanqi, Jiang; Xiufen, Li; Jiajia, L. Distribution Characteristics of Climate Potential Productivity of Soybean in Frigid Region and Its Response to Climate Change. Environ. Sci. Pollut. Res. 2022, 29, 1–13. [Google Scholar] [CrossRef]
- Kliengchuay, W.; Mingkhwan, R.; Kiangkoo, N.; Suwanmanee, S.; Sahanavin, N.; Kongpran, J.; Aung, H.W.; Tantrakarnapa, K. Analyzing Temperature, Humidity, and Precipitation Trends in Six Regions of Thailand Using Innovative Trend Analysis. Sci. Rep. 2024, 14, 1–9. [Google Scholar] [CrossRef] [PubMed]
- Lobell, D.B.; Cassman, K.G.; Field, C.B. Crop Yield Gaps: Their Importance, Magnitudes, and Causes. Annu. Rev. Environ. Resour. 2009, 34, 179–204. [Google Scholar] [CrossRef]
- Oladipo, E.O. Drought in Northern Nigeria: An Indication of Abrupt Climatic Change ? Weather Clim. 13 34–39. [CrossRef]
- Yila, K.M.; Gboku, M.L.S.; Lebbie, M.S.; Kamara, L.I. Changes in Rainfall and Temperature and Its Impact on Crop Production in Moyamba District, Southern Sierra Leone. Atmos. Clim. Sci. 2023, 13, 19–43. [Google Scholar] [CrossRef]
- Yue, S.; Pilon, P.; Phinney, B.; Cavadias, G. The Influence of Autocorrelation on the Ability to Detect Trend in Hydrological Series. Hydrol. Process. 2002, 16, 1807–1829. [Google Scholar] [CrossRef]
- Atayee, A.R.; Noori, M.S. Alleviation of Cold Stress in Vegetable Crops. J. Sci. Agric. 2020, 4, 38–44. [Google Scholar] [CrossRef]
- Hasanuzzaman, M.; Fujita, M.; Oku, H.; Nahar, K.; Hawrylak-Nowak, B. Plant Nutrients and Abiotic Stress Tolerance. Plant Nutr. Abiotic Stress Toler. 2018, 1–590. [Google Scholar] [CrossRef]
- Malekera, M.J.; Acharya, R.; Hwang, H.S.; Lee, K.Y. Effect of Cold Acclimation and Rapid Cold-Hardening on the Survival of Spodoptera Frugiperda (J.E. Smith) (Lepidoptera: Noctuidae) under Cold Stress. J. Asia-Pac. Entomol. 2022, 25, 101862. [Google Scholar] [CrossRef]
- Parrish, R.; Colbourn, T.; Lauriola, P.; Leonardi, G.; Hajat, S.; Zeka, A. A Critical Analysis of the Drivers of Human Migration Patterns in the Presence of Climate Change: A New Conceptual Model. Int. J. Environ. Res. Public Health 2020, 17, 1–20. [Google Scholar] [CrossRef] [PubMed]
- Beekmann, M.; Gallois, S.; Rondinini, C. Uncertain Future for Congo Basin Biodiversity: A Systematic Review of Climate Change Impacts. Biol. Conserv. 2024, 297, 110730. [Google Scholar] [CrossRef]
- Useni Sikuzani, Y.; Bogaert, J. The Evolution of Landscape Ecology in the Democratic Republic of the Congo (2005–2025): Scientific Advances, Methodological Challenges, and Future Directions. Earth 2025, 6, 1–26. [Google Scholar] [CrossRef]
- Galushko, V.; Gamtessa, S. Impact of Climate Change on Productivity and Technical Efficiency in Canadian Crop Production. Sustainability 2022, 14. [Google Scholar] [CrossRef]
- Mondo, J.M.; Chuma, G.B.; Matiti, H.M.; Kihye, J.B.; Bagula, E.M.; Karume, K.; Kahindo, C.; Egeru, A.; Majaliwa, J.G.M.; Agre, P.A.; et al. Crop Calendar Optimization for Climate Change Adaptation in Yam Farming in South-Kivu, Eastern D.R. Congo. PLoS ONE 2024, 19, 1–26. [Google Scholar] [CrossRef] [PubMed]
- Campos, M.N.; Sevilla, P.M.; Montoya, J.M.; Llanes, O. Rainfall Potential and Consequences on Structural Soil Degradation of the Most Important Agricultural Region of Mexico; 2024. [Google Scholar]
- Bommaraboyina, P.R.; Daniel, J.; Abbhishek, K. Book Review: Climate Change and Agriculture in India: Impact and Adaptations. 2020, 2, 1–2. [Google Scholar] [CrossRef]
- Wu, W.; Zhang, L.; Chu, Z.; Yue, W.; Xu, Y.; Peng, C.; Chen, X.; Jing, L.; Ma, W.; Wang, S. Improvement of Climate Resource Utilization Efficiency to Enhance Maize Yield through Adjusting Planting Density. 2023. [Google Scholar] [CrossRef]
- Bagula, E.M.; Majaliwa, J.G.M.; Mushagalusa, G.N.; Basamba, T.A.; Tumuhairwe, J.; Mondo, J.M.; Musinguzi, P.; Mwimangire, C.B.; Chuma, G.B.; Egeru, A.; et al. Climate Change Effect on Water Use Efficiency under Selected Soil and Water Conservation Practices in the Ruzizi Catchment. 2022. [Google Scholar] [CrossRef]
- Abedi, J.O.; Kafuti, B.M.; Okitayela, A.A.; Muchukiwa, O.; Yusufu, E.K.; Kachaka, C.S.; Bolaluembe, P.B. Revue Congolaise Des Sciences & Technologies Modeling the Current and Future Spatial Distribution of Pericopsis Elata ( Afrormosia ) under Climate Change Scenarios in the Democratic Republic of The. 2026, 05, 271–283. [Google Scholar] [CrossRef]
- Lufuluabo, M.M.; Kizungu, R. V.; Nkongolo, K.K. Maize Production under Climate Change in a Savannah Region in DR-Congo. 2016, 14, 1–10. [Google Scholar] [CrossRef]
- Karume, K.; Mondo, J.M.; Chuma, G.B.; Ibanda, A.; Bagula, E.M.; Aleke, A.L.; Ndjadi, S.; Ndusha, B.; Ciza, P.A.; Cizungu, N.C.; et al. Current Practices and Prospects of Climate-Smart Agriculture in Democratic Republic of Congo: A Review. Land 2022, 11. [Google Scholar] [CrossRef]
- Alene, A.D.; Menkir, A.; Ajala, S.O.; Badu-apraku, B. The Economic and Poverty Impacts of Maize Research in West and Central Africa. 2009, 40, 535–550. [Google Scholar] [CrossRef]
- Muyayabantu, M.G.; Kadiata, B.D.; Nkongolo, K.K. Evaluation of Biological Soil Fertility Management Practices for Corn Production in Oxisols. Am. J. Plant Sci. 2012, 03, 1654–1660. [Google Scholar] [CrossRef]
- Tshiabukole, J.P.K.; Khonde, G.P.; Phongo, A.M.; Ngoma, N.; Vumilia, R.K.; Kankolongo, A.M. Liming and Mineral Fertilization of Acid Soils in Maize Crop within the Savannah of Southwestern of Democratic Republic of Congo. OALib 2022, 09, 1–10. [Google Scholar] [CrossRef]
- Asmamaw, D.K.; Walraevens, K.; Assaye, H.; Nigate, F.; Adgo, E.; Cornelis, W.M. Management Strategies for Improving Maize Yield and Water Productivity under Water Deficit and Soil Acidity. Exp. Agric. 2025, 61, 1–19. [Google Scholar] [CrossRef]
- Leitner, S.; Pelster, D.E.; Werner, C.; Merbold, L.; Baggs, E.M.; Mapanda, F.; Butterbach-Bahl, K. Closing Maize Yield Gaps in Sub-Saharan Africa Will Boost Soil N2O Emissions. Curr. Opin. Environ. Sustain. 2020, 47, 95–105. [Google Scholar] [CrossRef]
Figure 1.
Map of the research area.
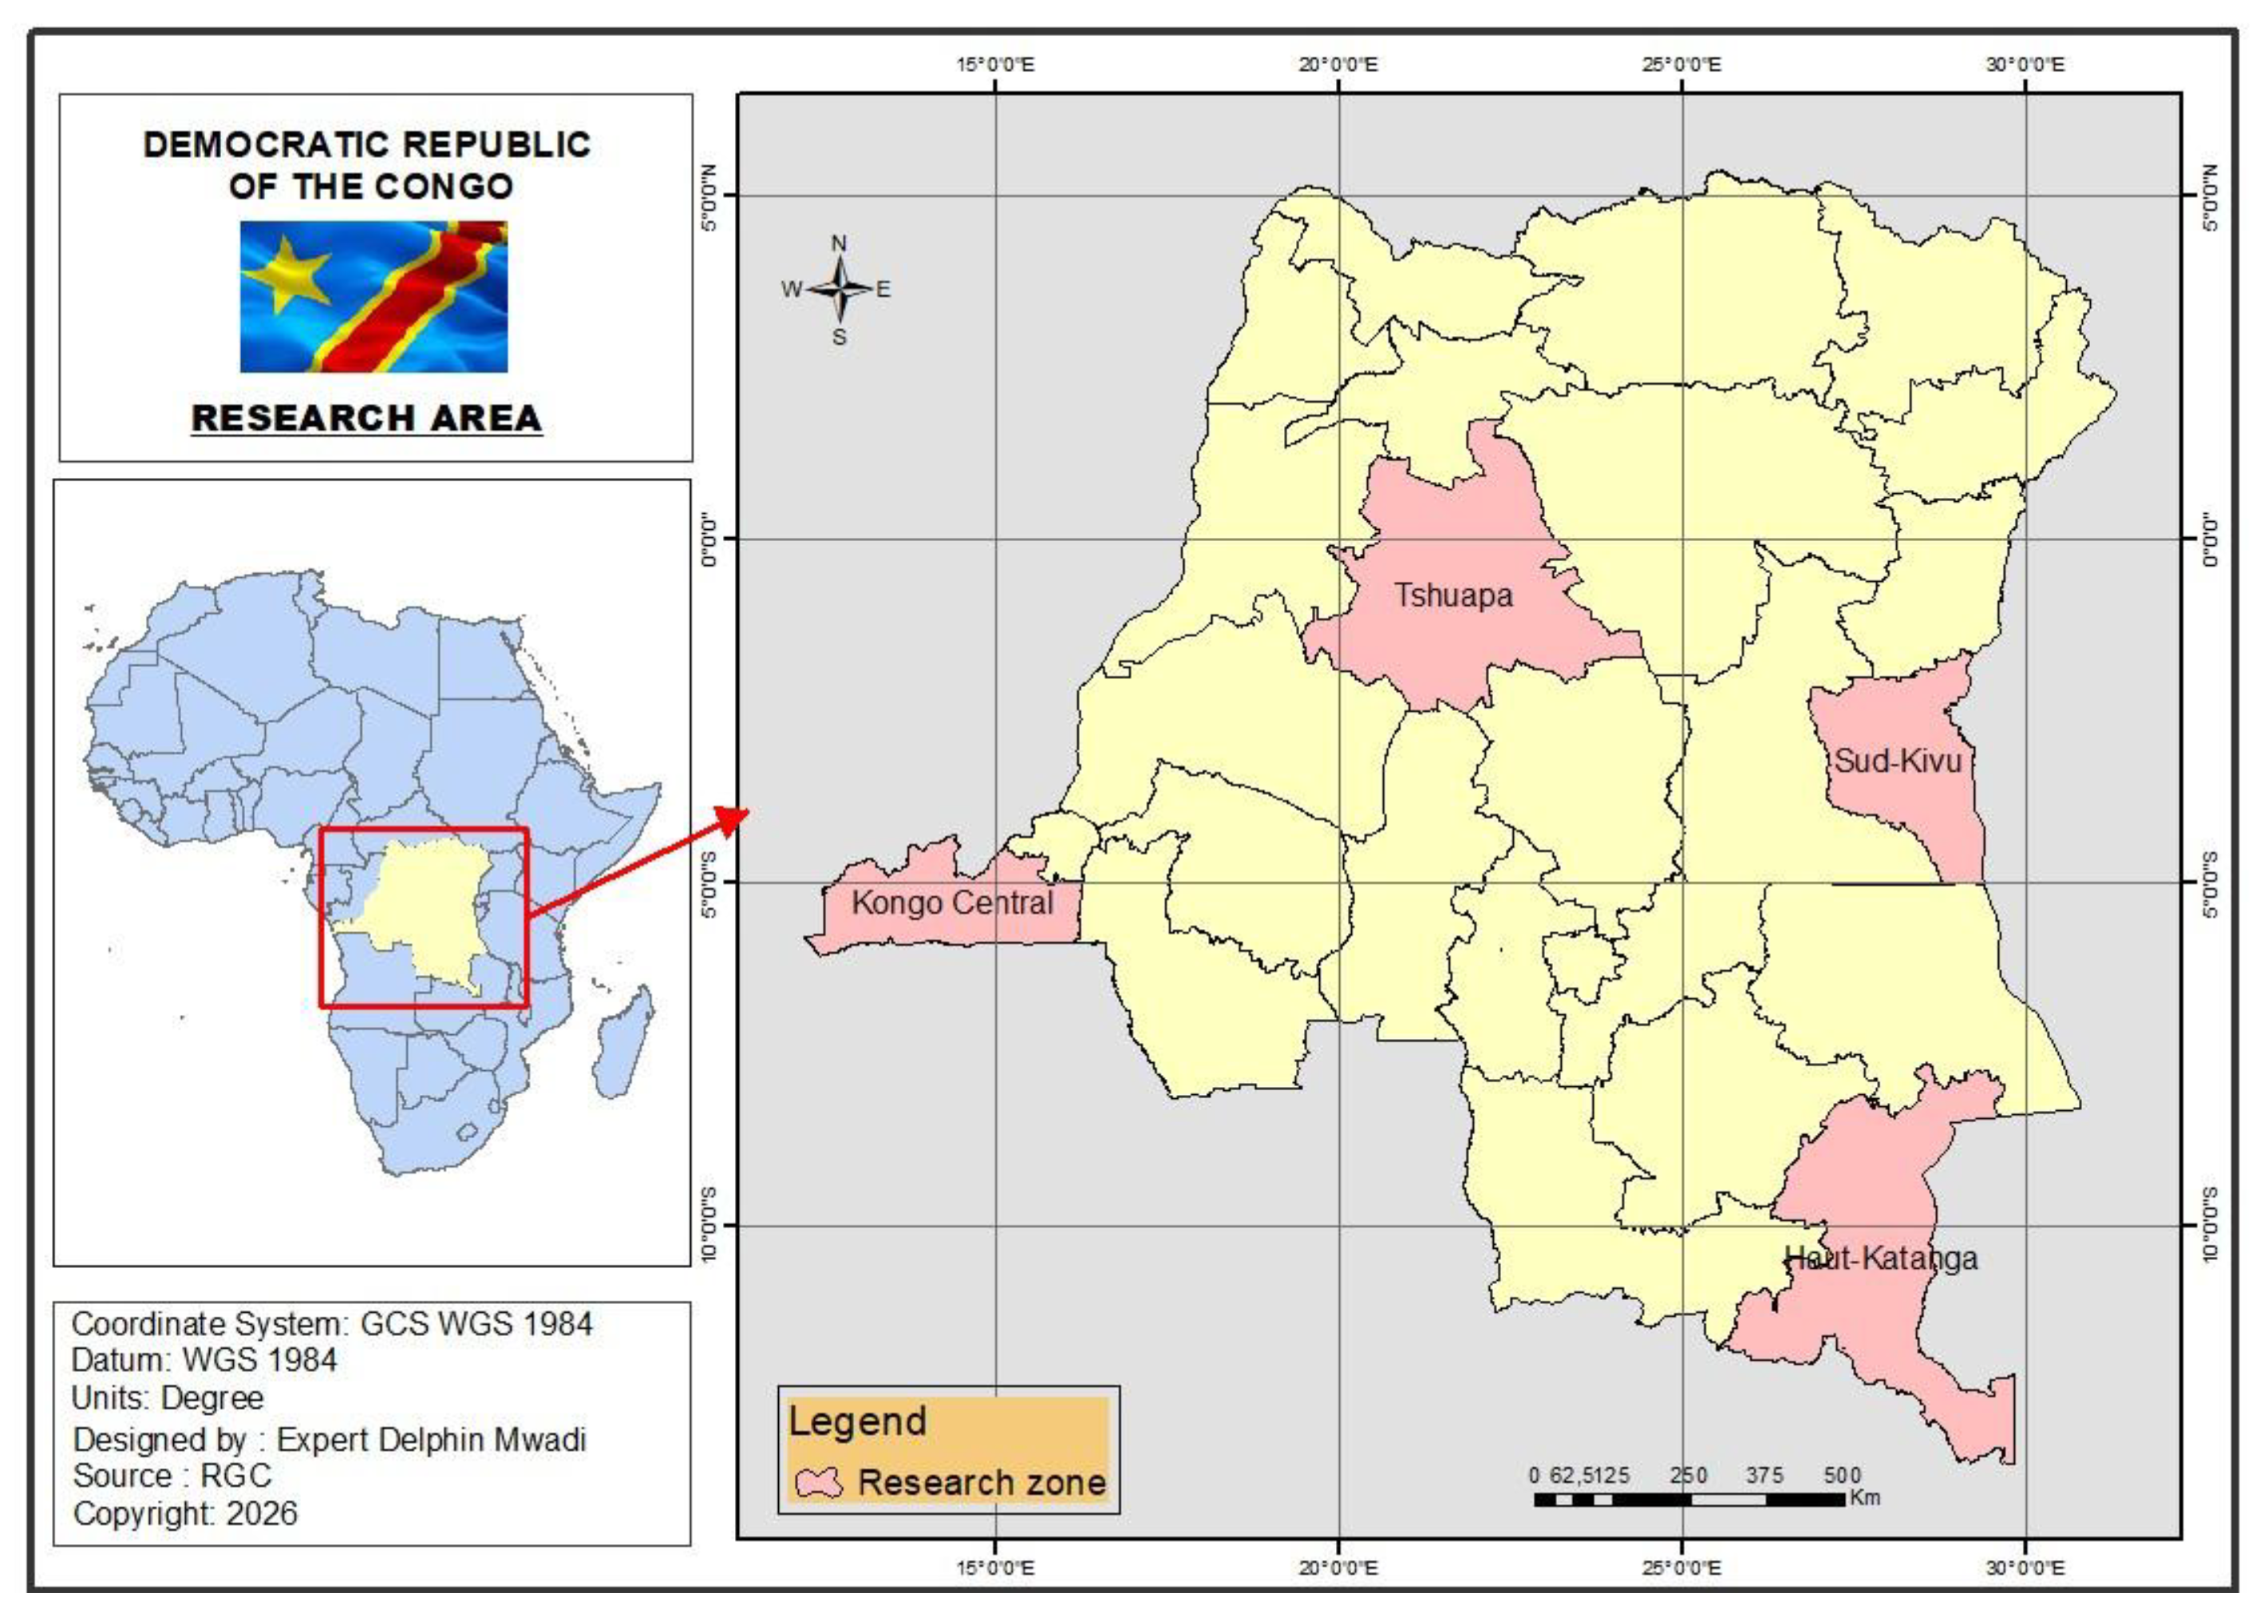
Figure 2.
Interannual variations in temperature in (a)Haut-Katanga, (b) Kongo Central, (c) South-Kivu and (d) Tshuapa Provinces from 1960 to 2024.
Figure 2.
Interannual variations in temperature in (a)Haut-Katanga, (b) Kongo Central, (c) South-Kivu and (d) Tshuapa Provinces from 1960 to 2024.
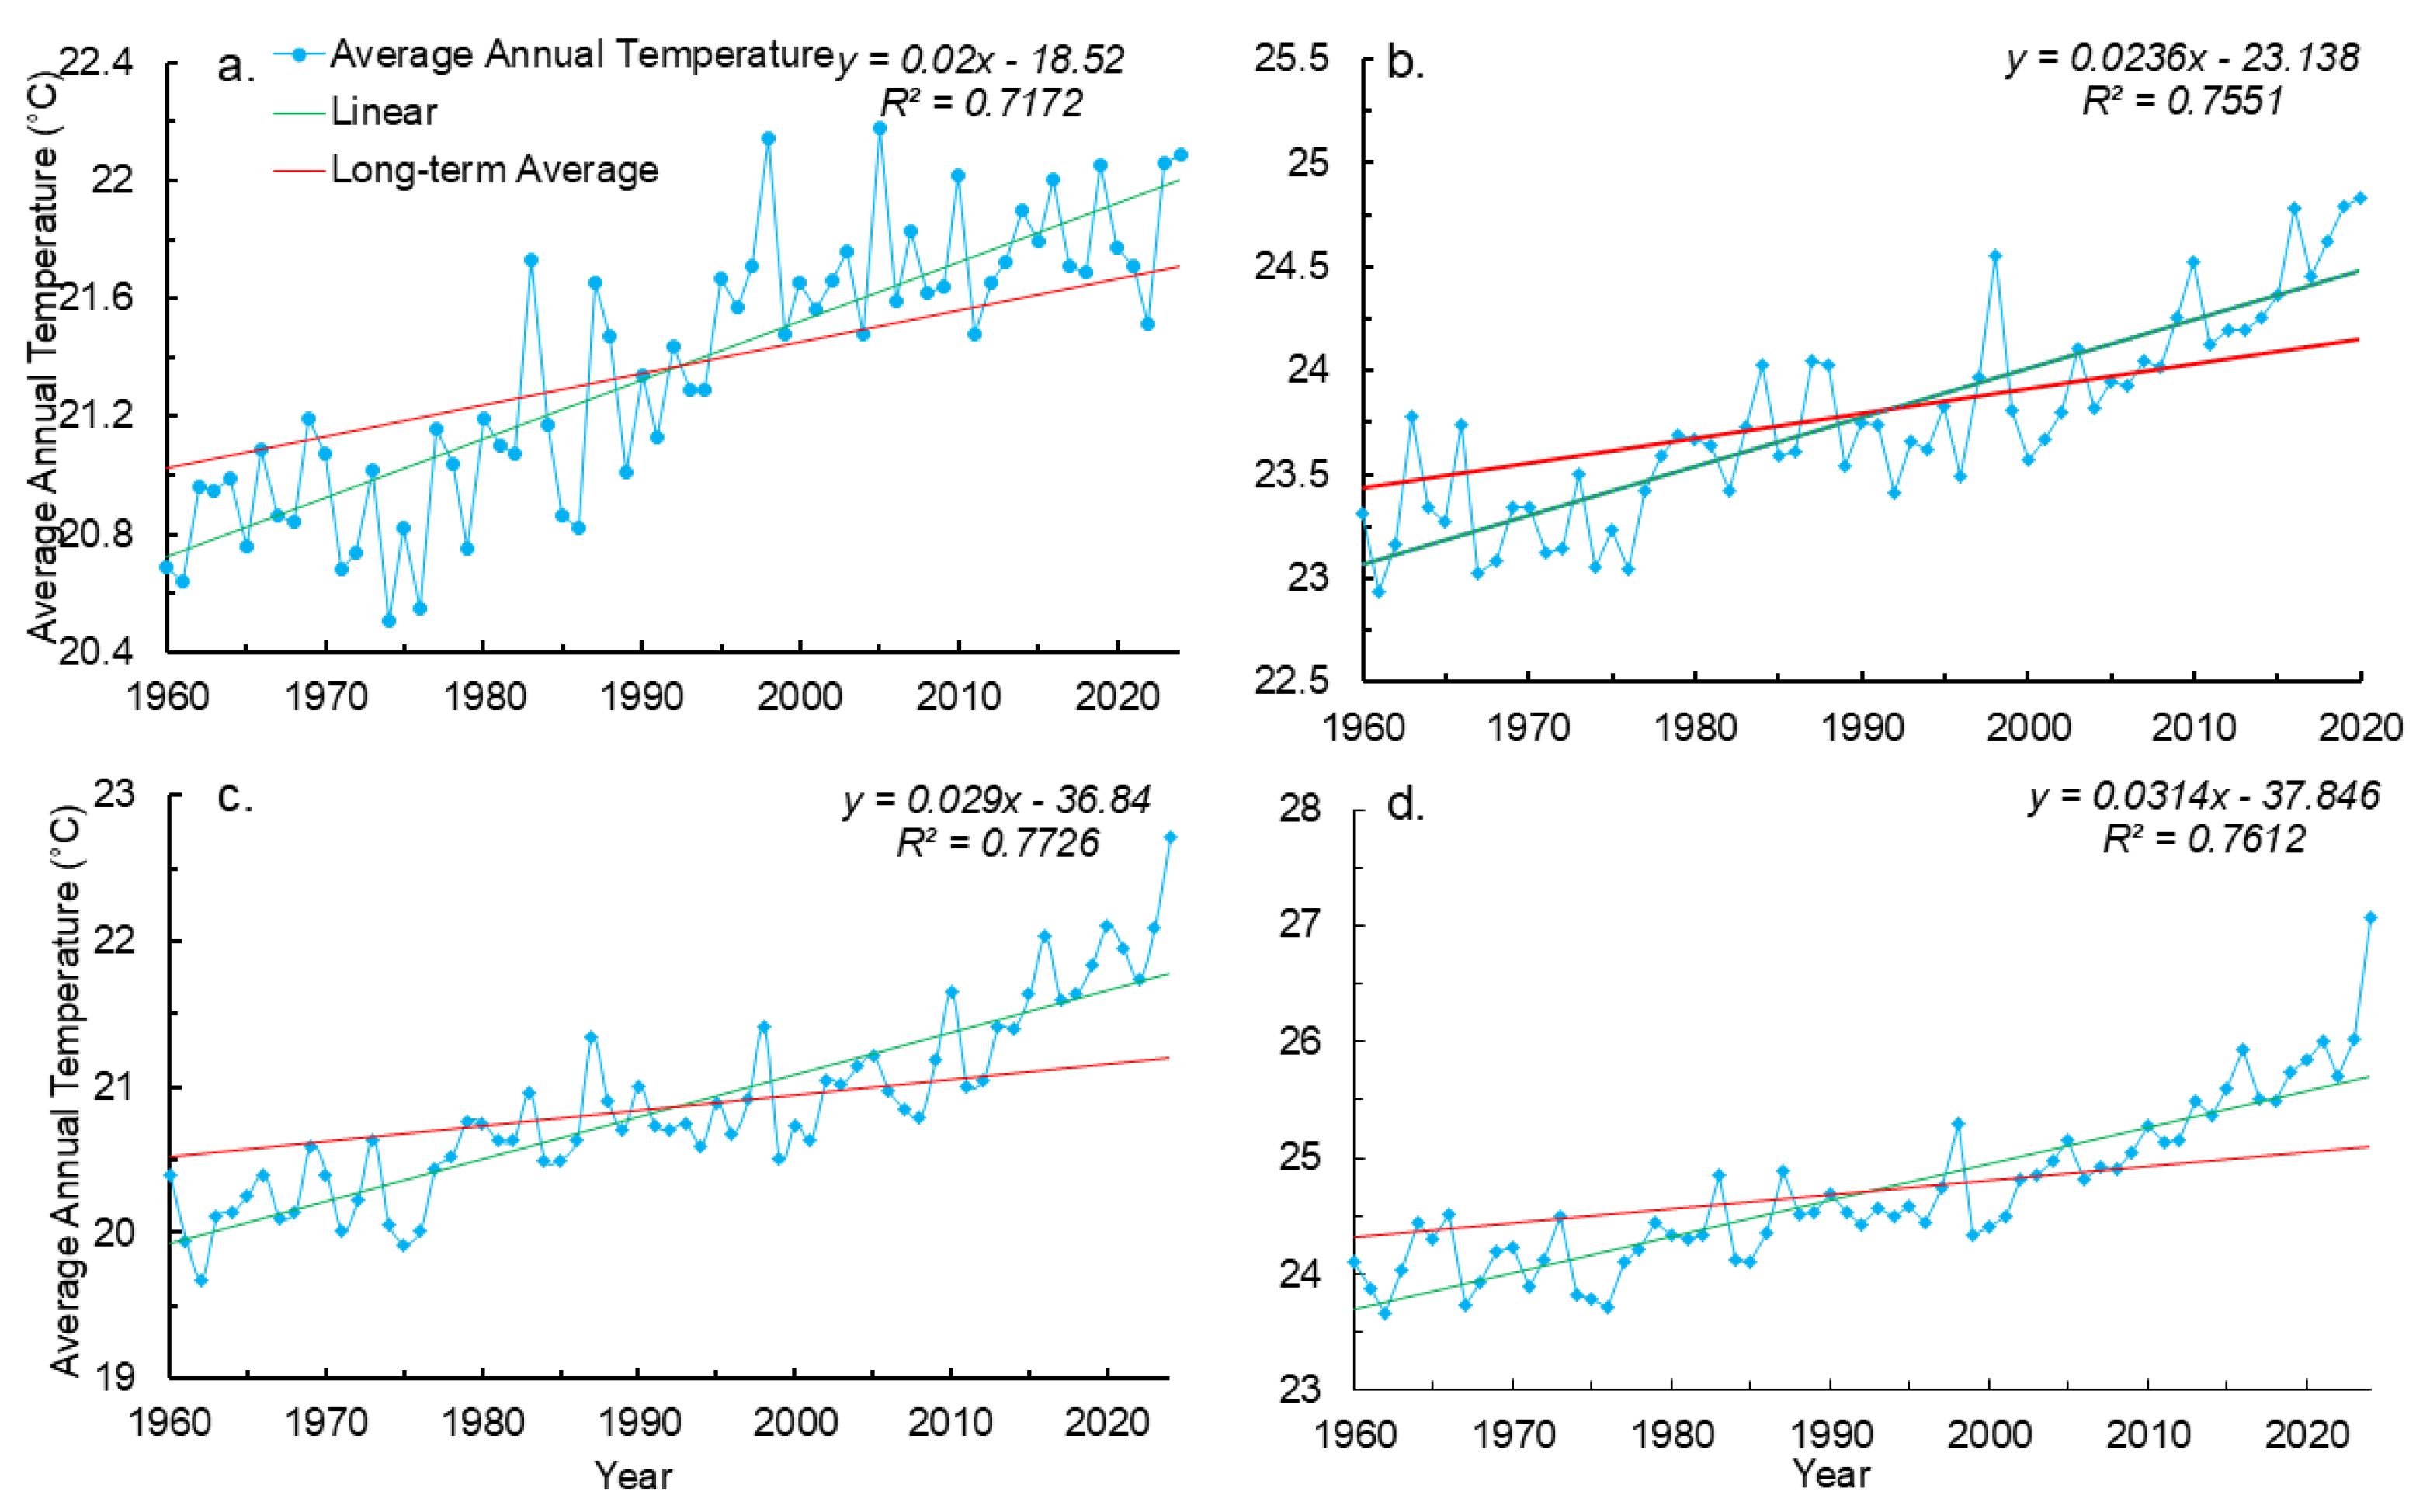
Figure 3.
Interannual variations in precitation in (a)Haut-Katanga, (b) Kongo Central, (c) South-Kivu and (d) Tshuapa Provinces from 1960 to 2024.
Figure 3.
Interannual variations in precitation in (a)Haut-Katanga, (b) Kongo Central, (c) South-Kivu and (d) Tshuapa Provinces from 1960 to 2024.
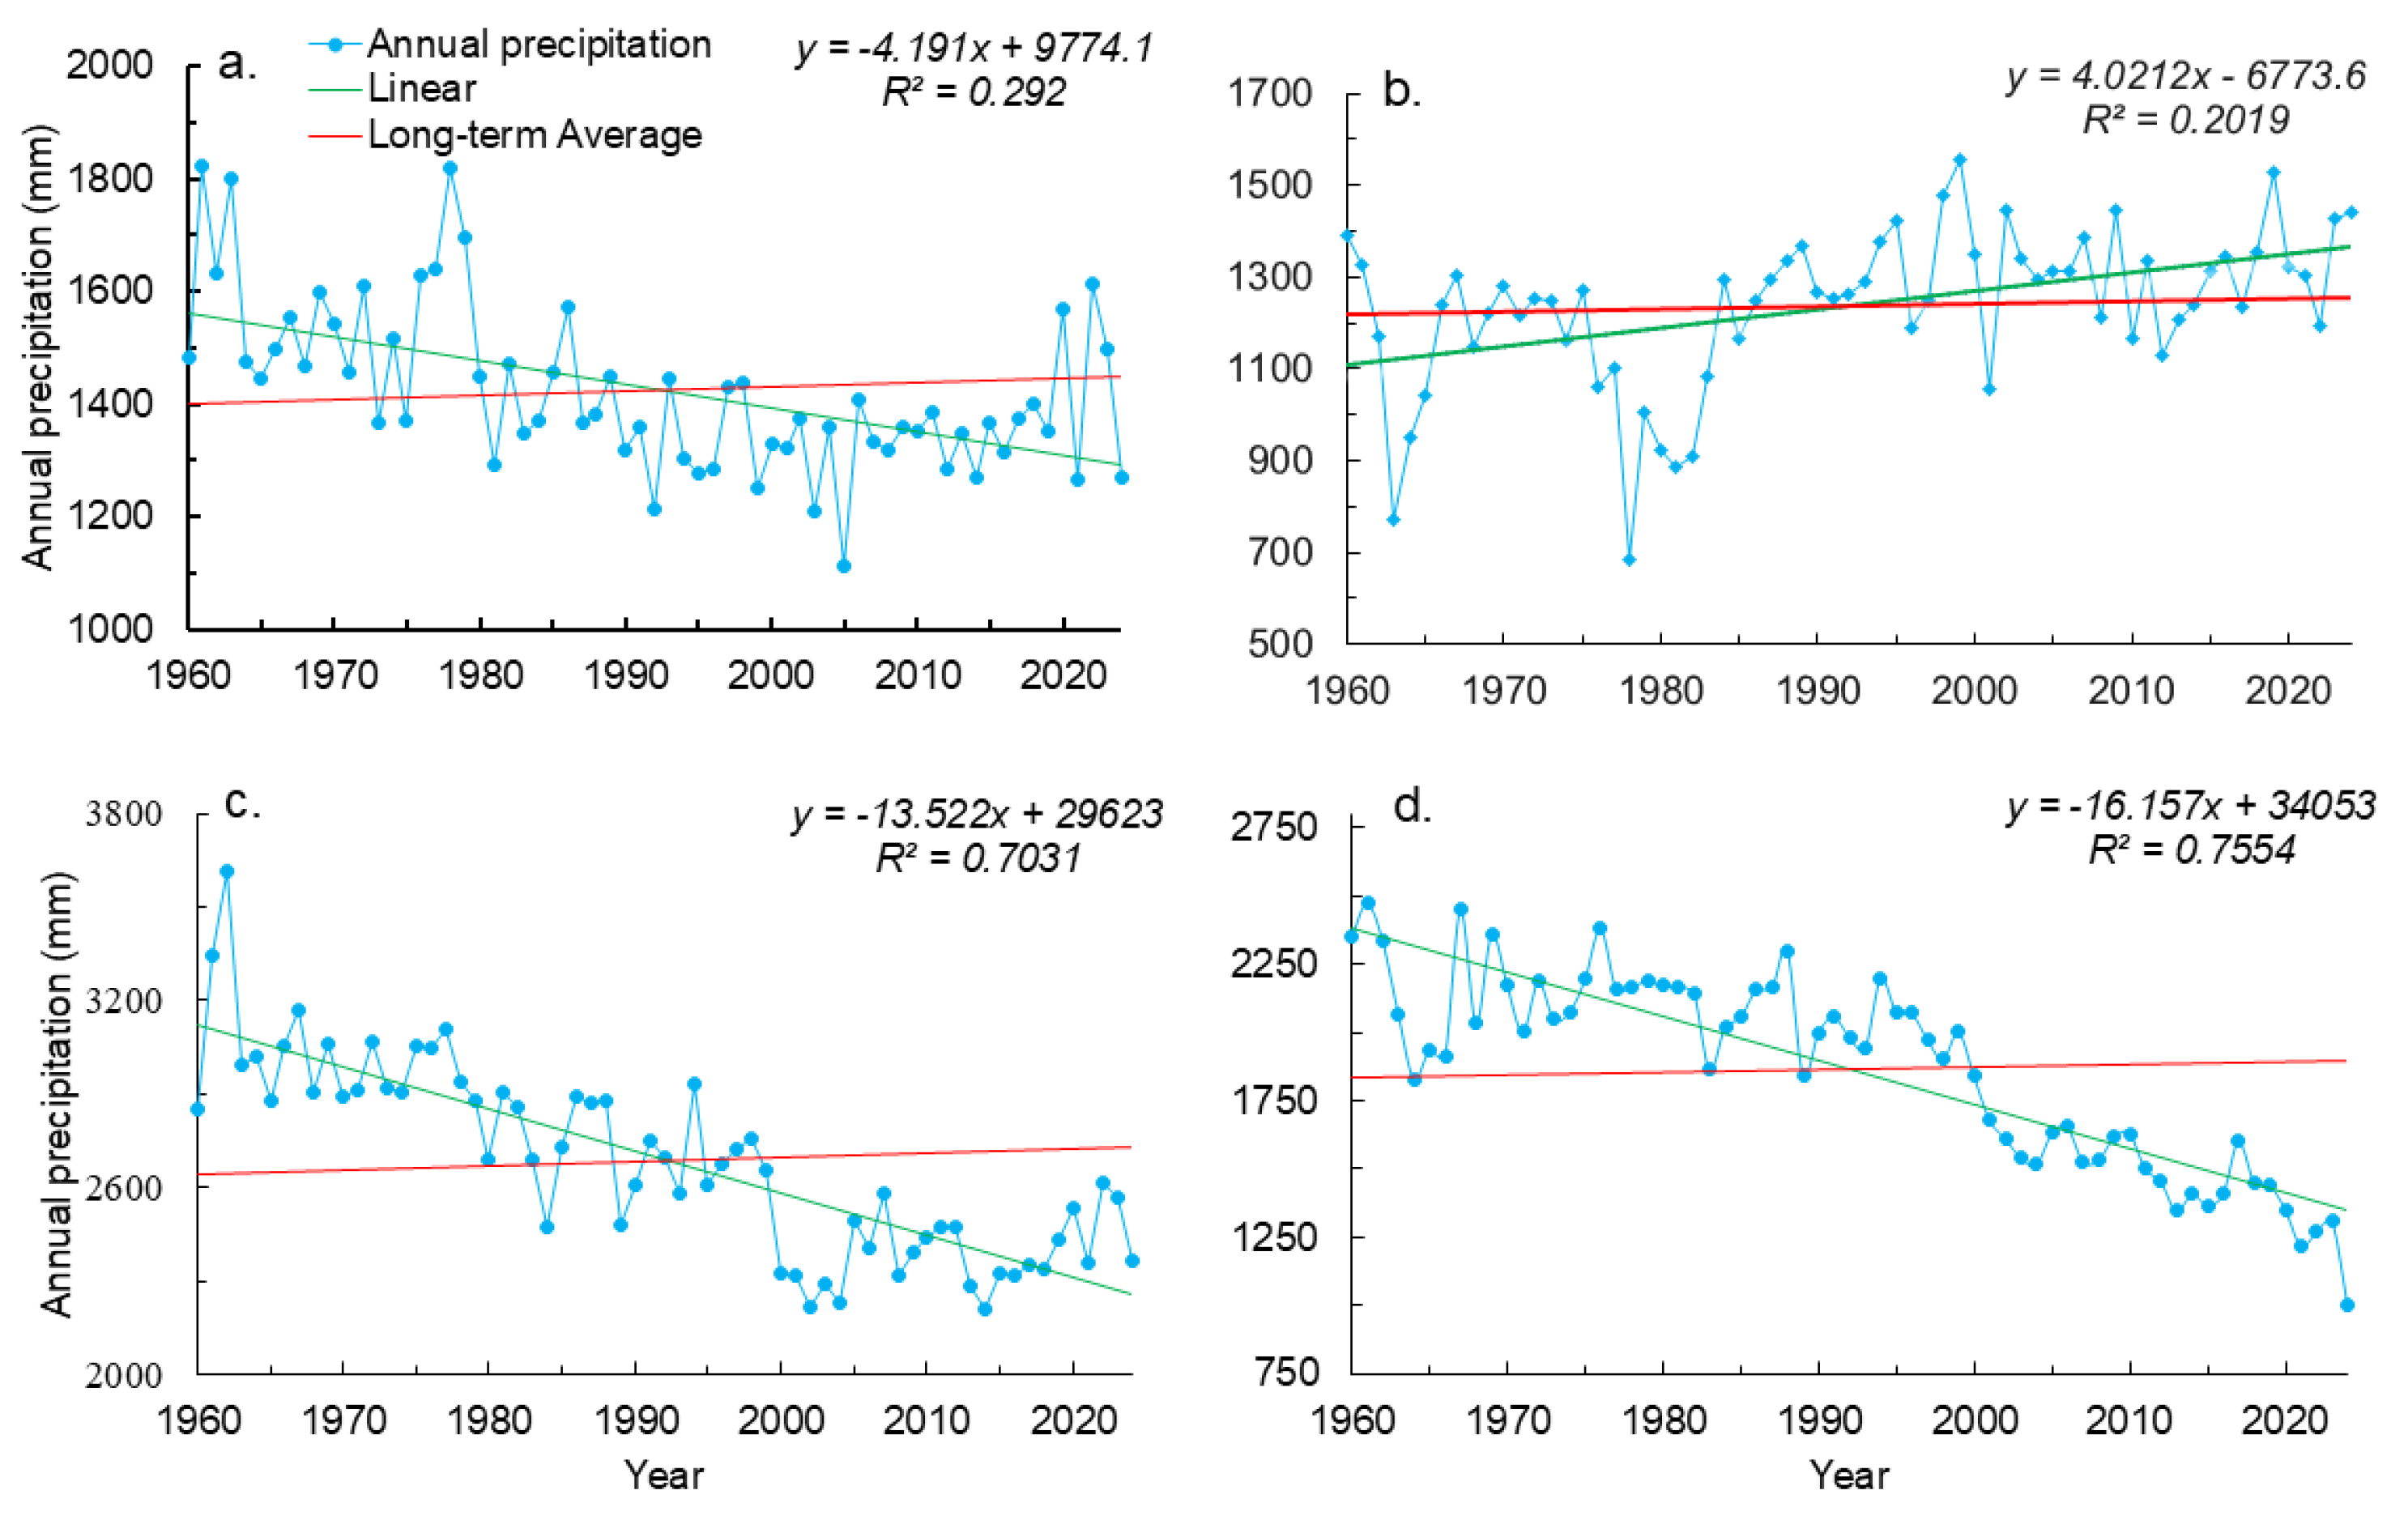
Figure 4.
Interannual variation in standard climate potential productivity in (a)Haut-Katanga, (b) Kongo Central, (c) South-Kivu and (d) Tshuapa Provinces from 1960 to 2024.
Figure 4.
Interannual variation in standard climate potential productivity in (a)Haut-Katanga, (b) Kongo Central, (c) South-Kivu and (d) Tshuapa Provinces from 1960 to 2024.
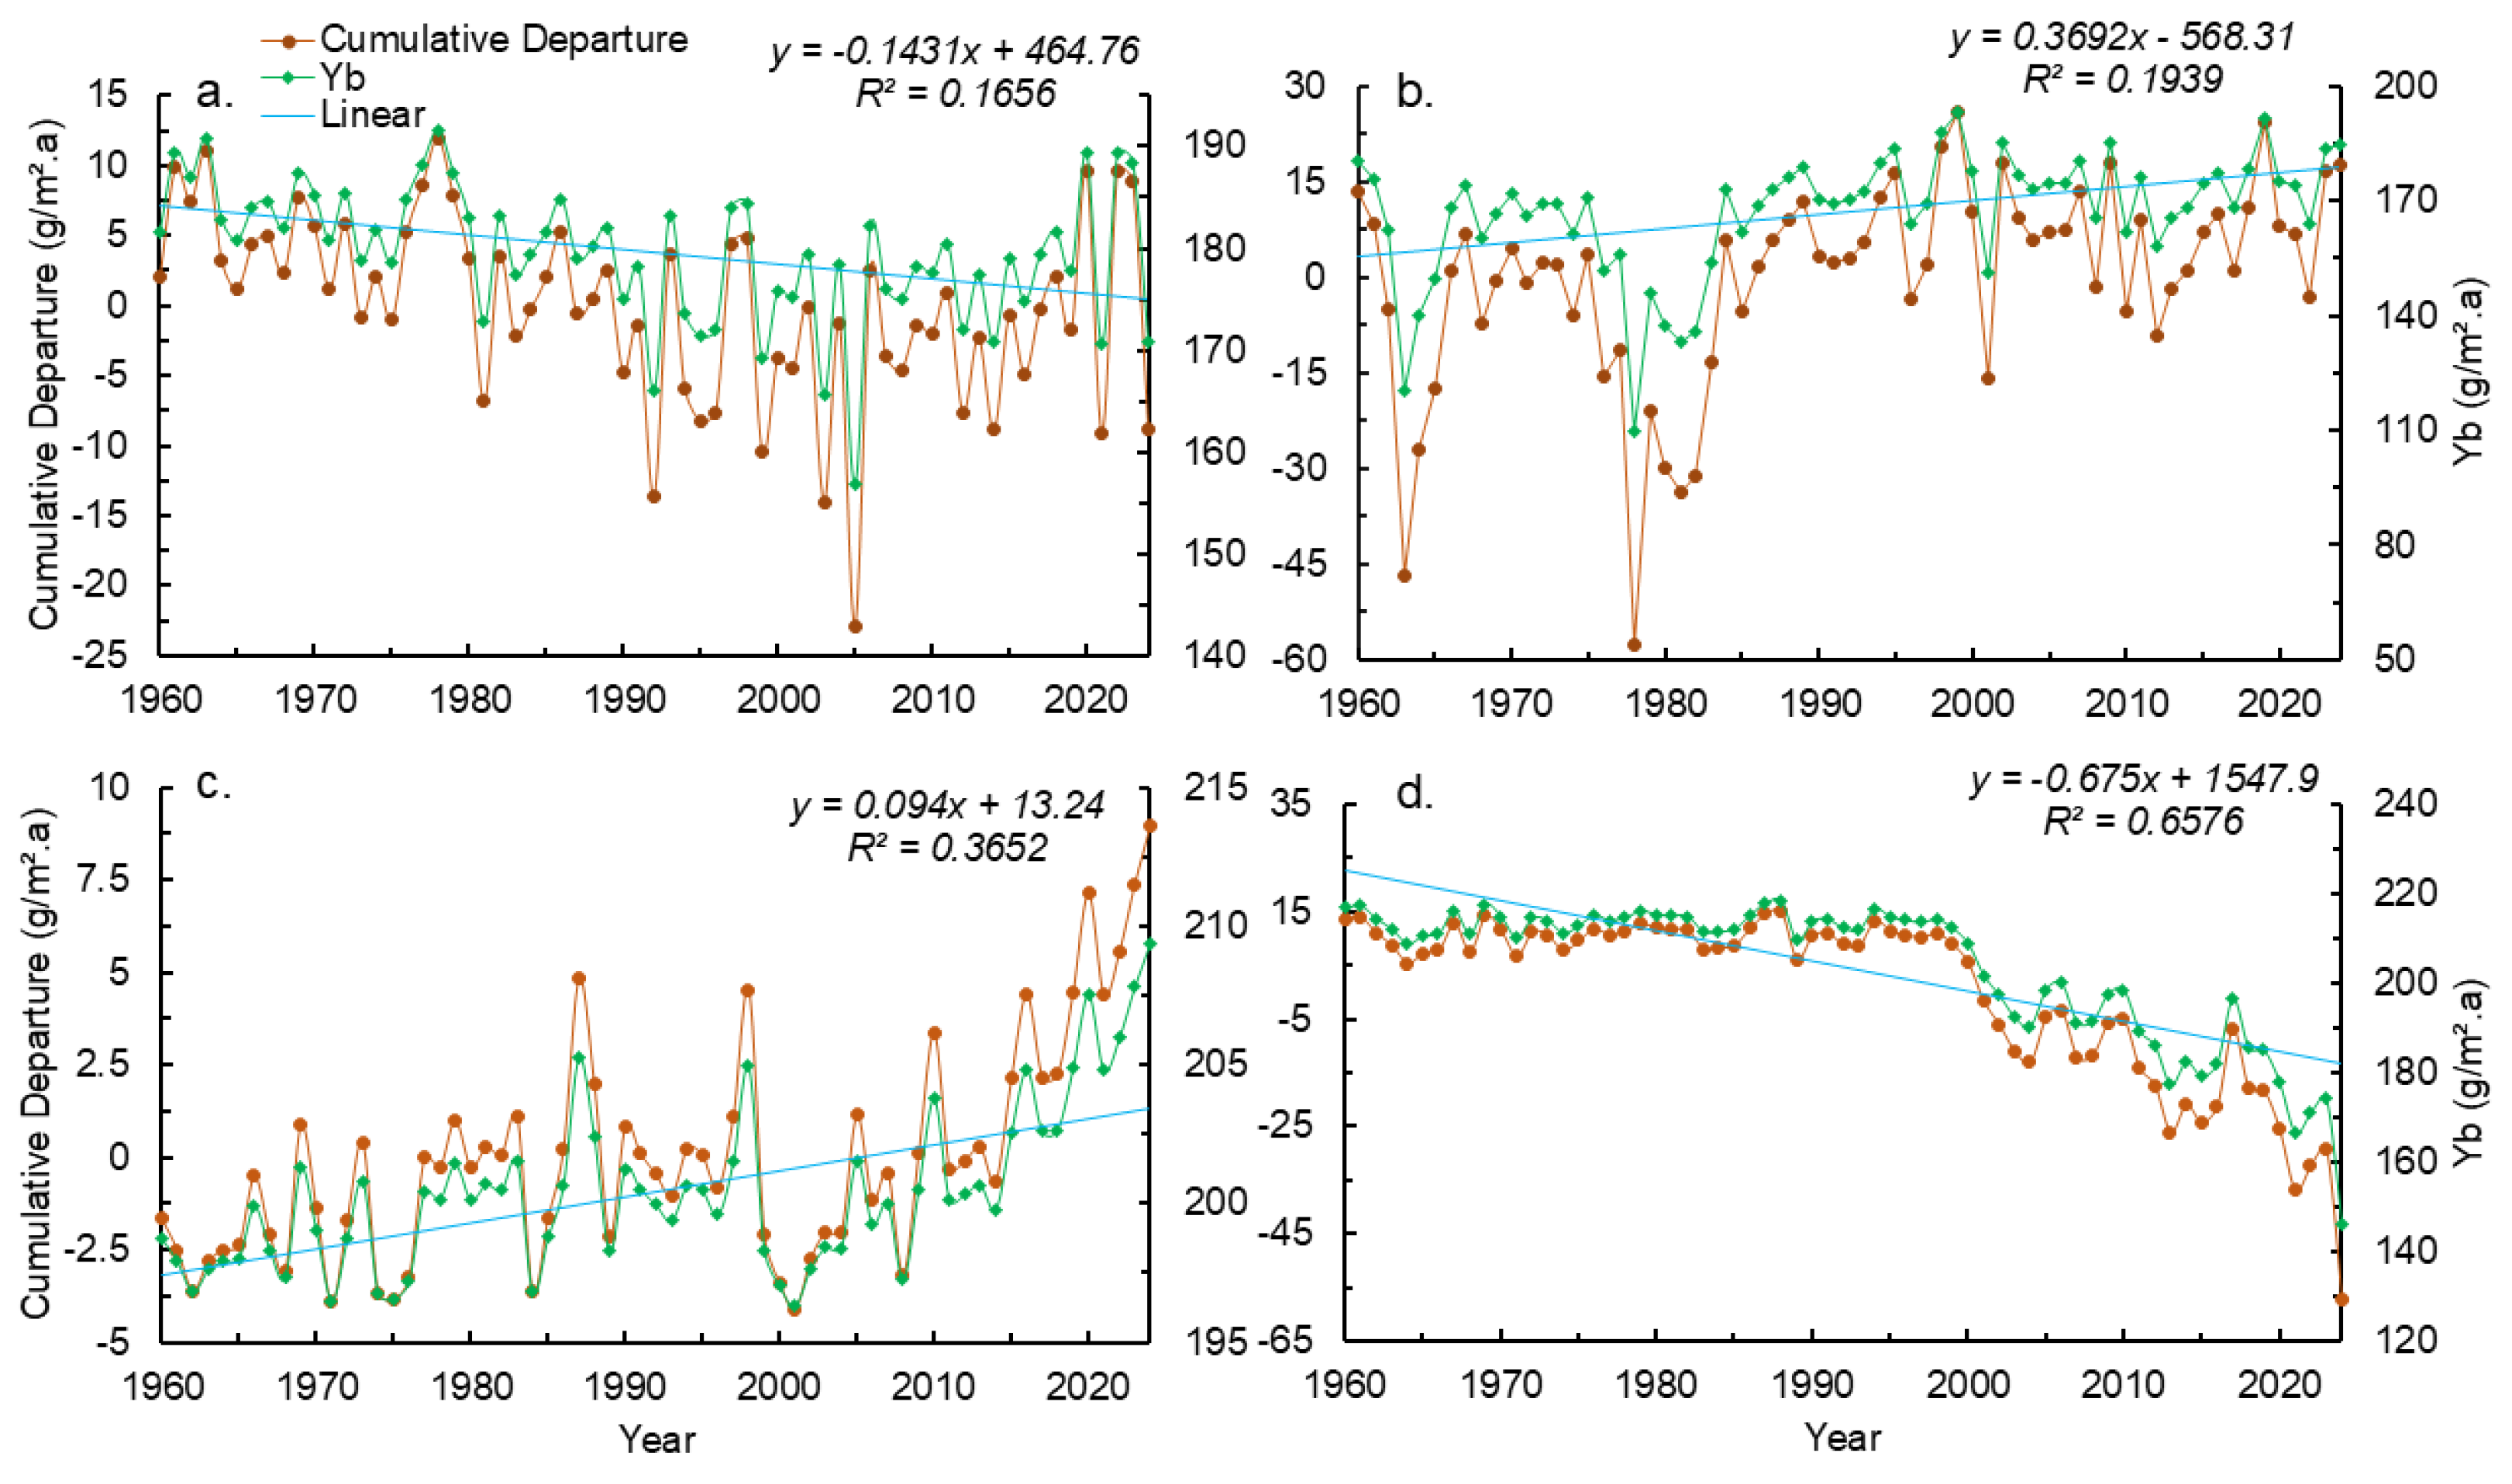
Figure 5.
Mann–Kendall–Sneyers trend test for CPP in Figure 6. Relationship between the standard climate potential productivity and temperature and precipitation in (a) Haut-Katanga (b) Kongo central (c) South-Kivu and (d) Tshuapa from 1960 to 2024.
Figure 5.
Mann–Kendall–Sneyers trend test for CPP in Figure 6. Relationship between the standard climate potential productivity and temperature and precipitation in (a) Haut-Katanga (b) Kongo central (c) South-Kivu and (d) Tshuapa from 1960 to 2024.
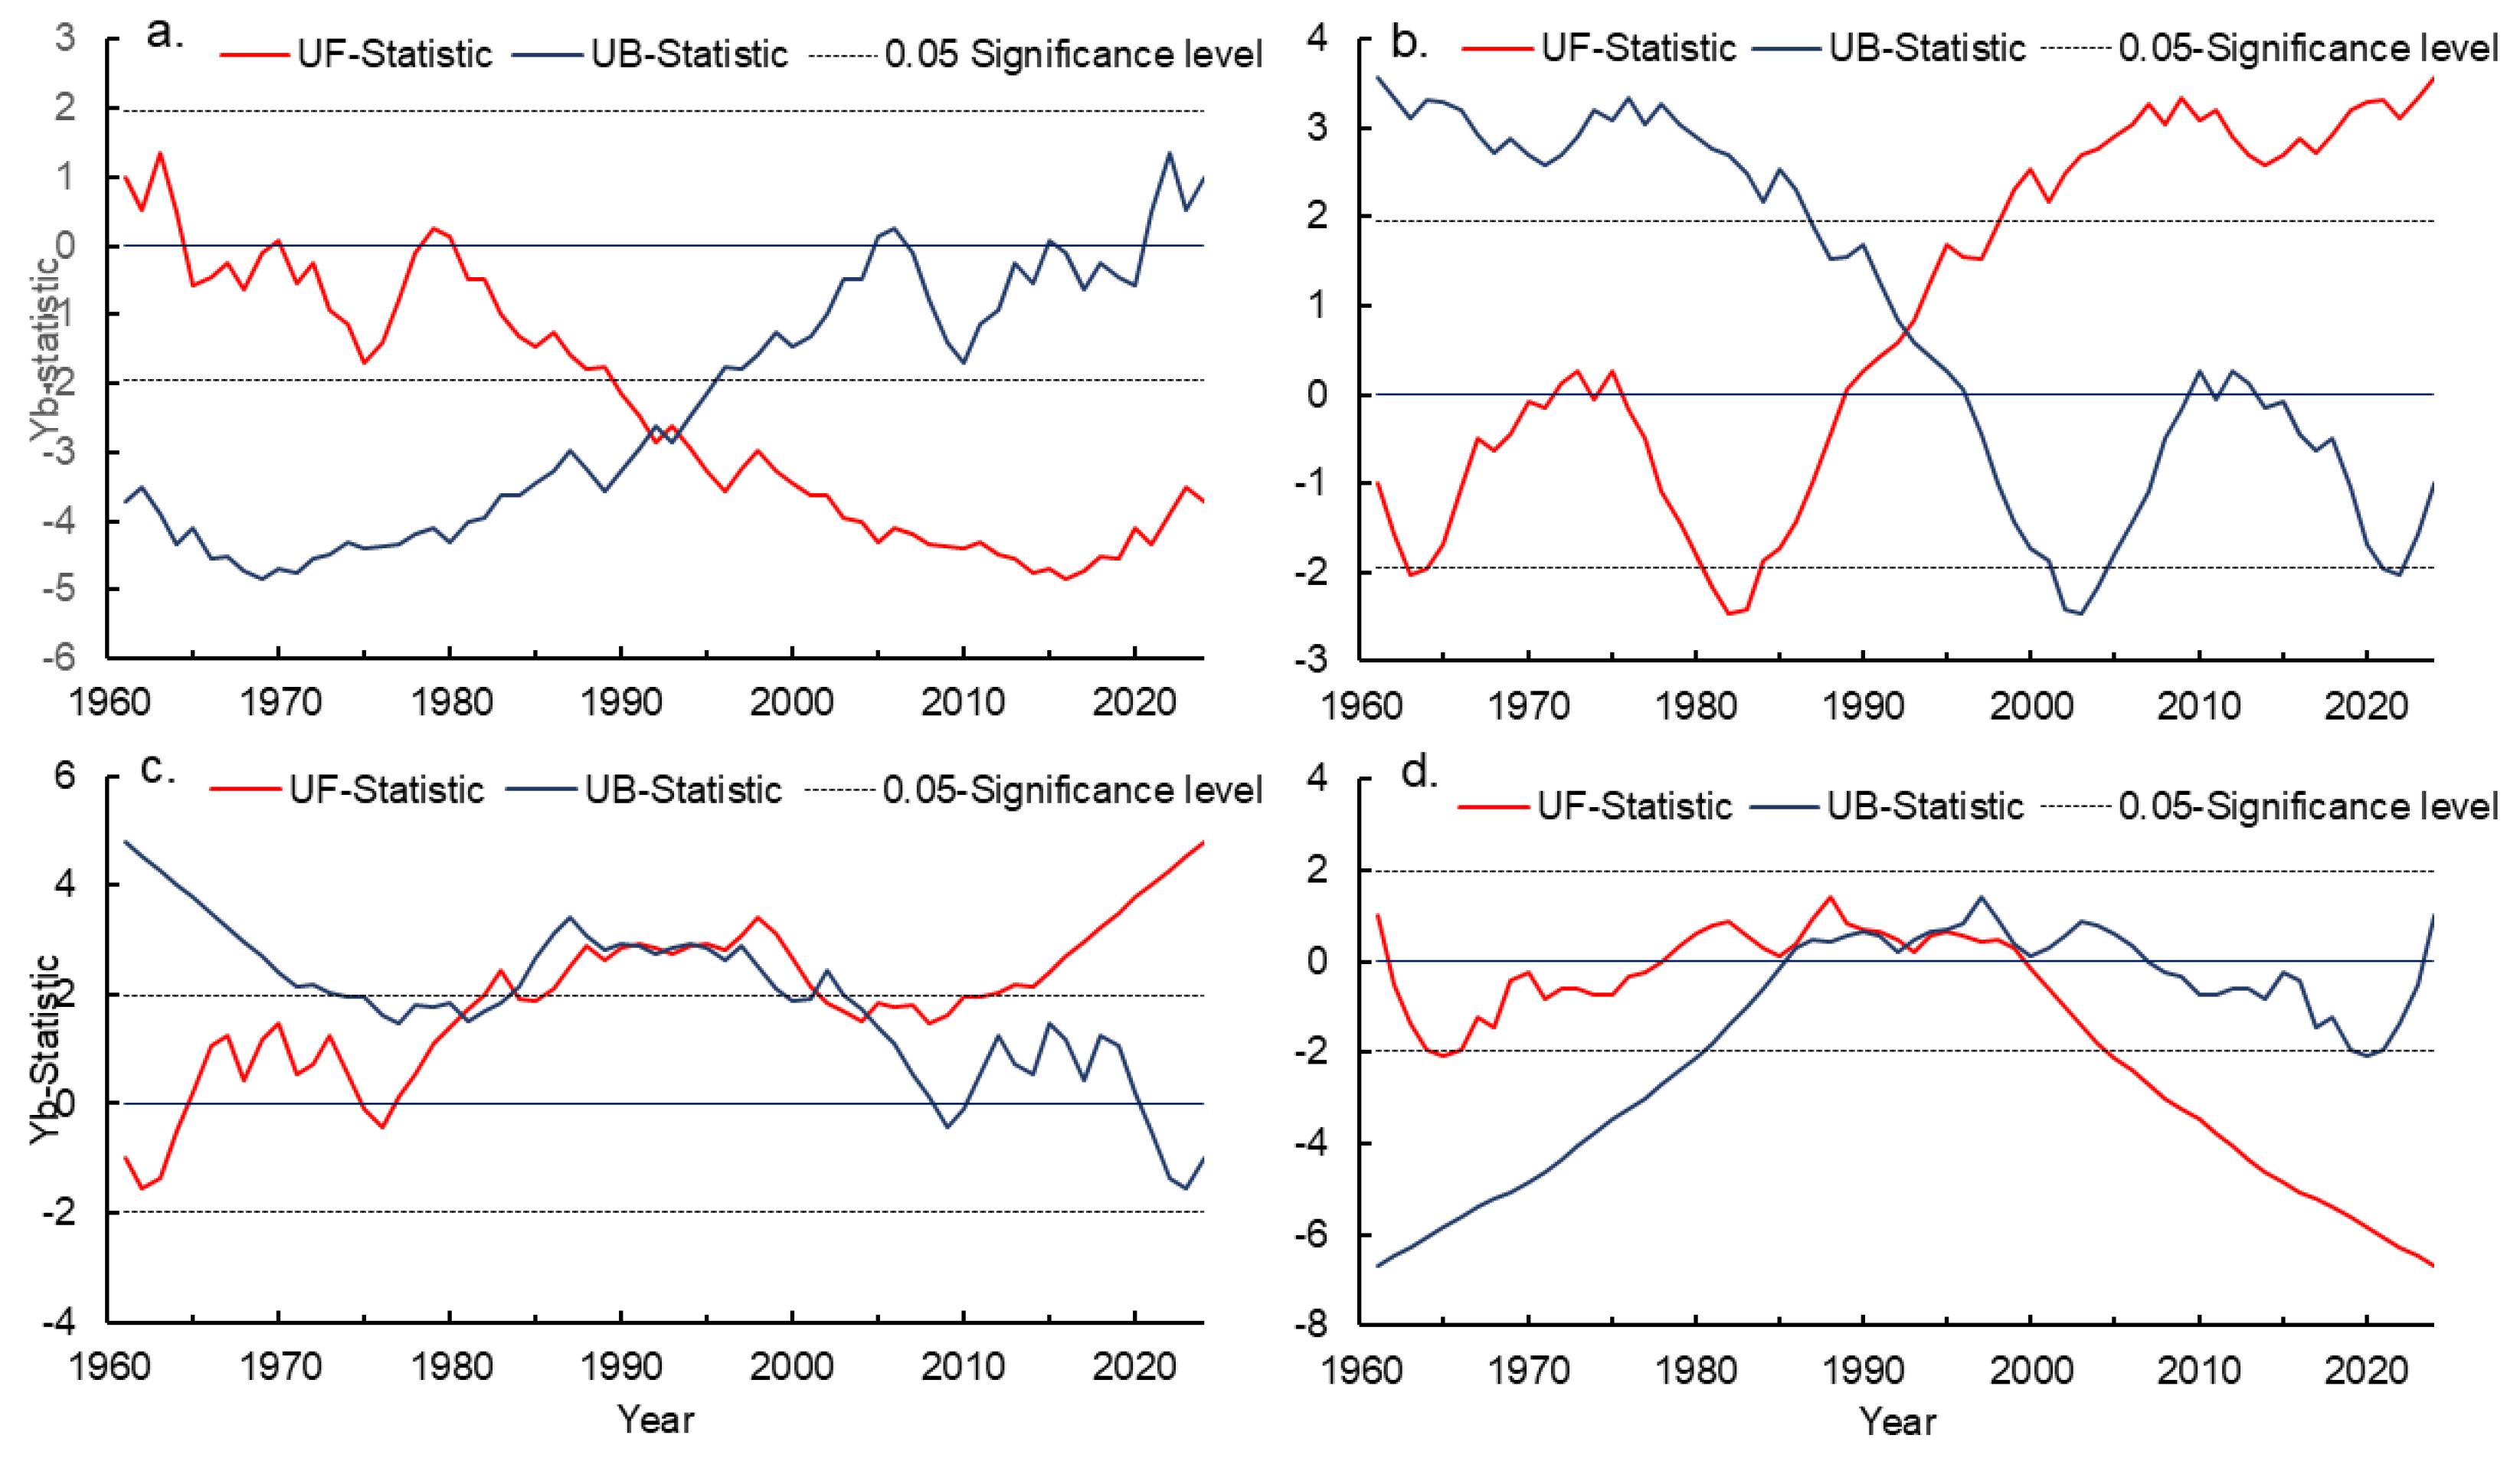
Figure 6.
Relationship between the standard climate potential productivity and temperature and precipitation in (a) Haut-Katanga (b) Kongo central (c) South-Kivu and (d) Tshuapa from 1960 to 2024.
Figure 6.
Relationship between the standard climate potential productivity and temperature and precipitation in (a) Haut-Katanga (b) Kongo central (c) South-Kivu and (d) Tshuapa from 1960 to 2024.
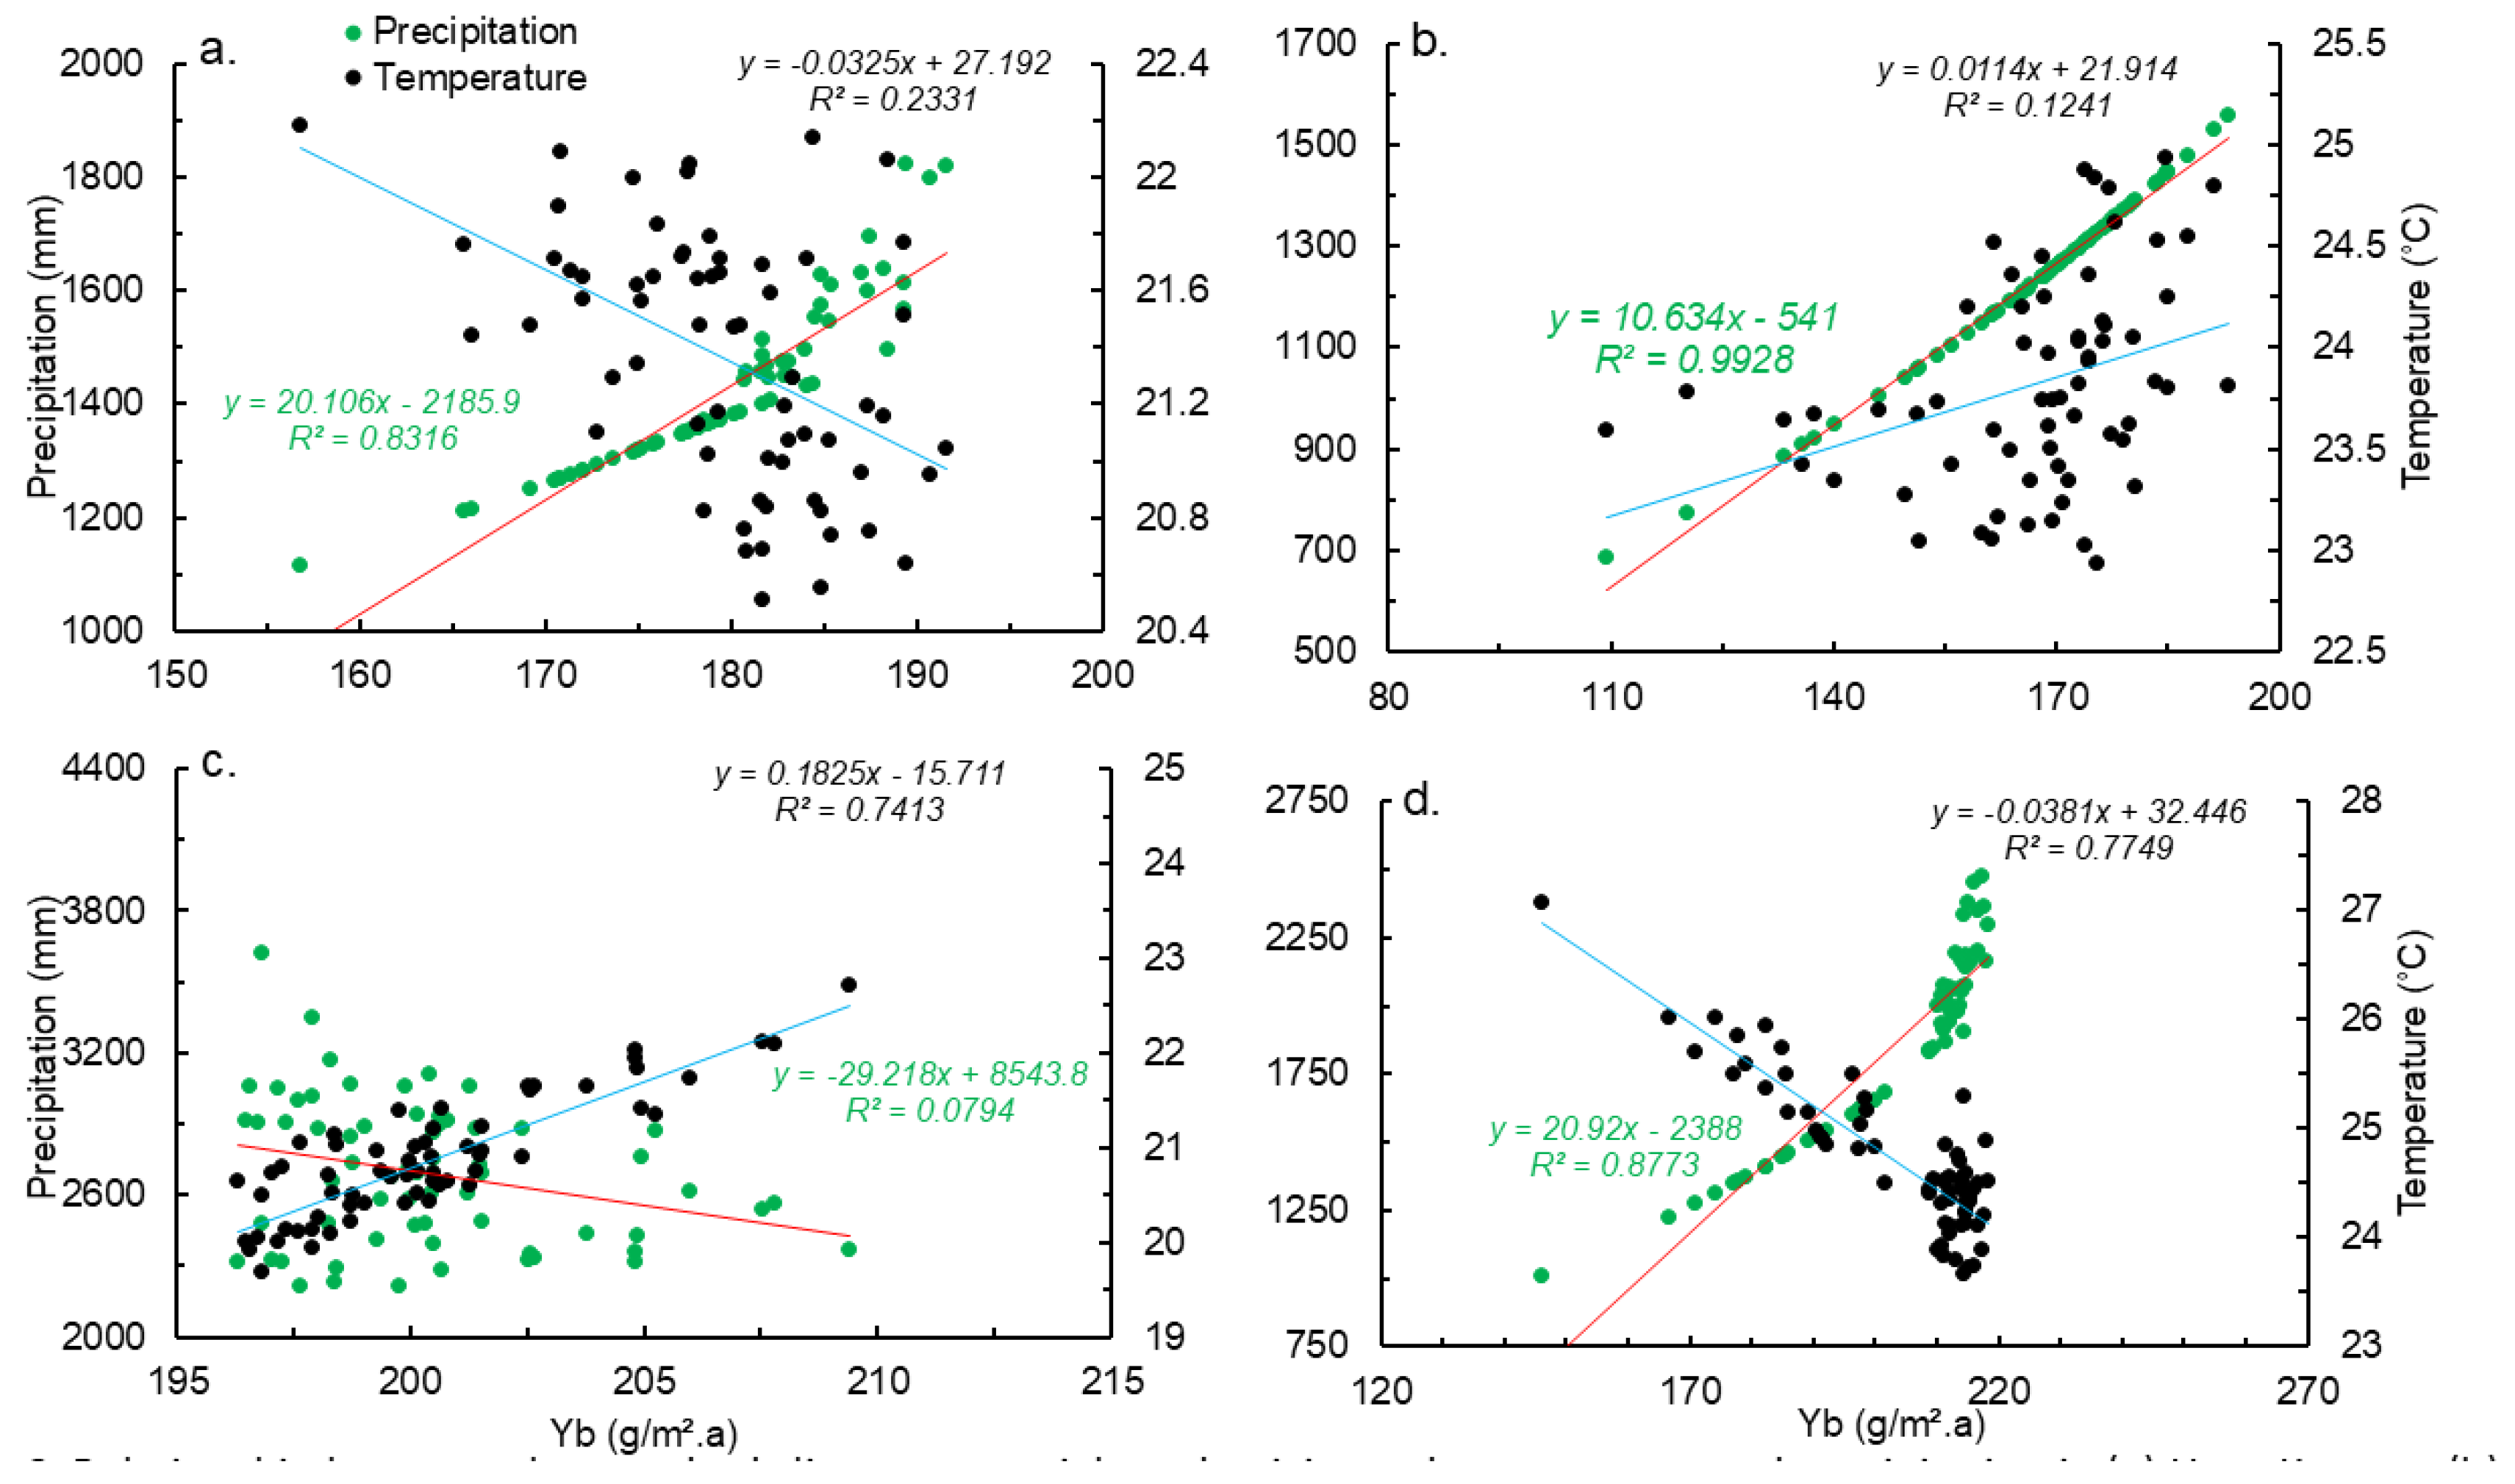
Figure 7.
Standard climate potential productivity, potential for grain increase, climate resource utilization efficiency and interannual variation in grain yield per unit area from 1960 to 2024 in (a) Haut-Katanga (b) Kongo central (c) South-Kivu and (d) Tshuapa.
Figure 7.
Standard climate potential productivity, potential for grain increase, climate resource utilization efficiency and interannual variation in grain yield per unit area from 1960 to 2024 in (a) Haut-Katanga (b) Kongo central (c) South-Kivu and (d) Tshuapa.
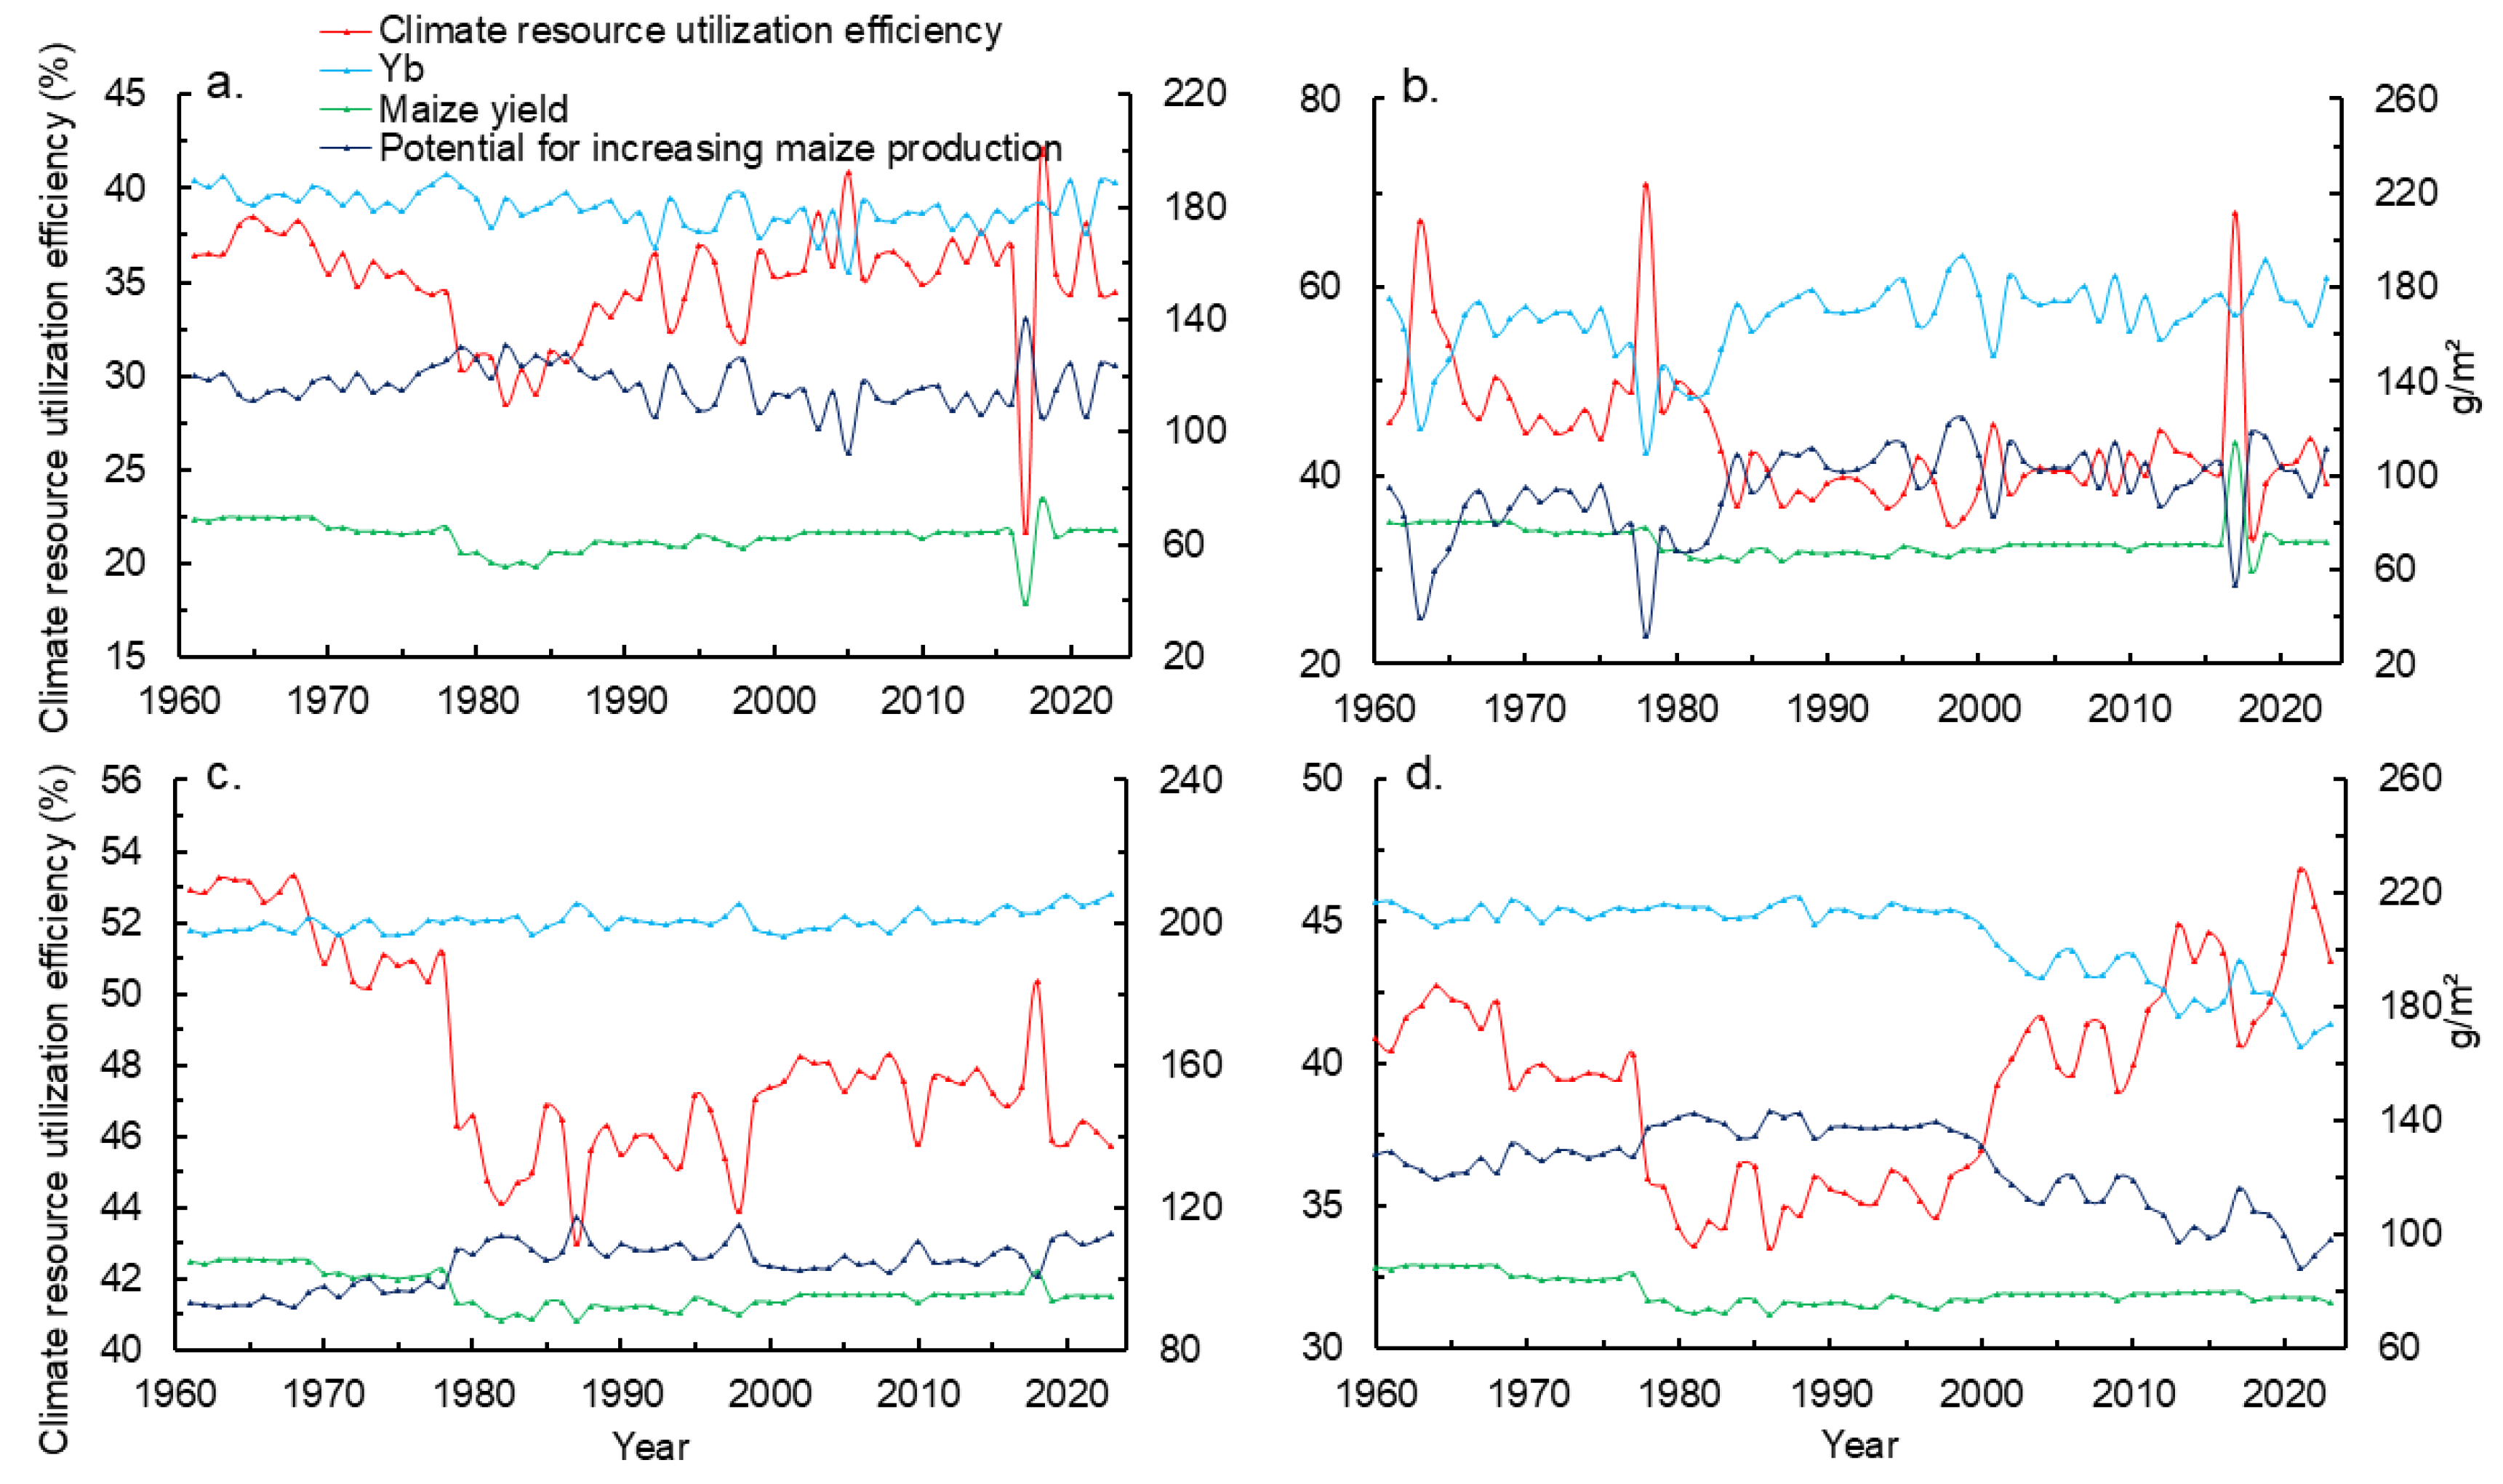
Figure 8.
Analysis of the correlation among climate resource utilization, standard climate potential productivity and maize yield in (a) Haut-Katanga (b) Kongo central (c) South-Kivu and (d) Tshuapa from 1960 to 2024.
Figure 8.
Analysis of the correlation among climate resource utilization, standard climate potential productivity and maize yield in (a) Haut-Katanga (b) Kongo central (c) South-Kivu and (d) Tshuapa from 1960 to 2024.
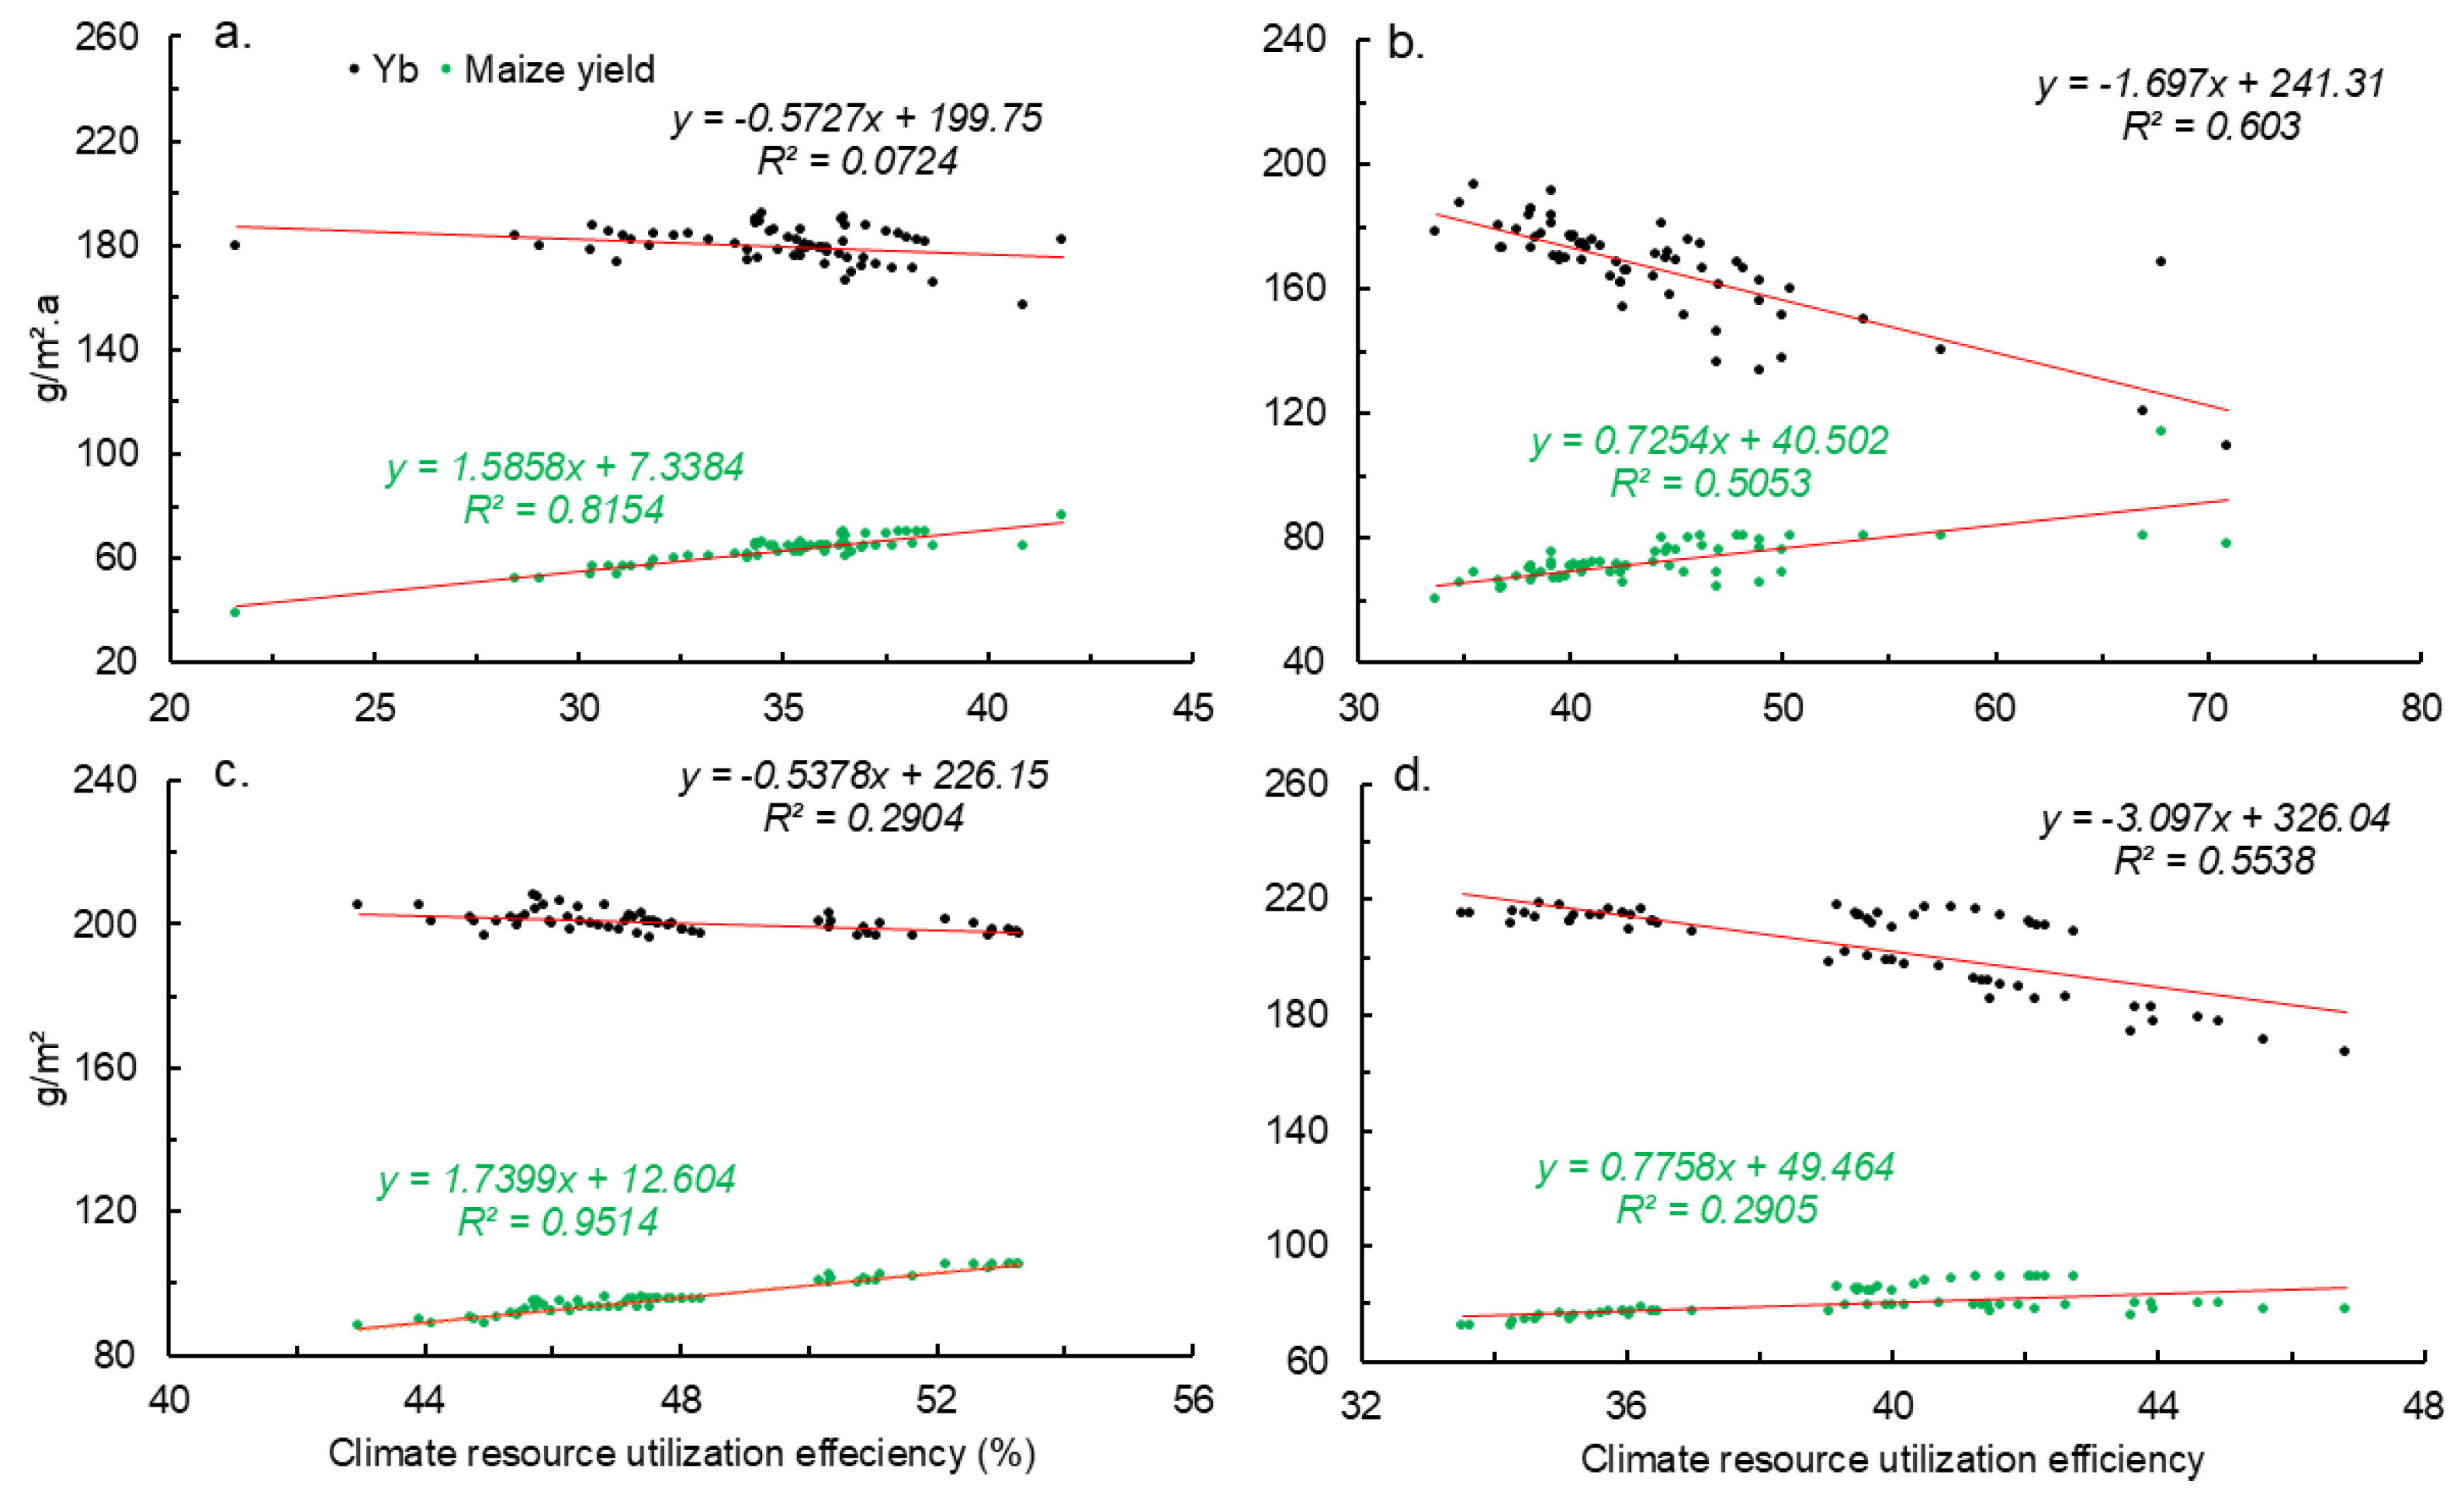

Table 1.
Decadal growth rate of climate potential productivity in the agroclimatic zones of the DRC.
Table 1.
Decadal growth rate of climate potential productivity in the agroclimatic zones of the DRC.
| Decade | Yt (g·m⁻²) | Yr (g·m⁻²) | Ye (g·m⁻²) | Yb (g·m⁻²) | ||||||||||||
|---|---|---|---|---|---|---|---|---|---|---|---|---|---|---|---|---|
| HK | KC | SK | TC | HK | KC | SK | TC | HK | KC | SK | TC | HK | KC | SK | TC | |
| 1960-1969 | ||||||||||||||||
| 1970-1979 | -0.41 | 0.09 | 0.80 | 0.01 | -0.95 | -2.59 | -2.77 | -0.12 | -0.71 | 0.45 | 0.36 | 0.20 | -0.75 | -2.59 | 0.36 | 0.20 |
| 1980-1989 | 2.37 | 2.25 | 3.03 | 1.79 | -10.72 | 2.12 | -6.93 | -3.54 | -2.62 | 2.77 | 1.75 | 0.40 | -3.95 | 2.12 | 1.75 | 0.40 |
| 1990-1999 | 1.88 | 0.27 | 0.43 | 0.88 | -6.79 | 16.70 | -1.41 | -3.26 | -1.85 | 5.65 | 0.15 | -0.36 | -4.63 | 16.70 | 0.15 | -0.36 |
| 2000-2009 | 1.18 | 0.71 | 0.89 | 1.11 | -1.63 | -1.58 | -12.79 | -24.21 | -0.11 | 0.14 | -2.02 | -9.91 | -1.45 | -1.58 | -2.02 | -16.84 |
| 2010-2024 | 0.69 | 3.08 | 4.77 | 3.97 | 5.23 | -1.03 | 1.97 | -17.39 | 3.06 | 2.37 | 5.20 | -7.21 | 4.36 | -1.03 | 5.20 | -17.11 |
| Mean | 1.14 | 1.28 | 1.98 | 1.55 | -2.97 | 2.72 | -4.39 | -9.70 | -0.45 | 2.28 | 1.09 | -3.38 | -1.29 | 2.72 | 1.09 | -6.74 |
Note:HK = Haut Katanga, KC = Kongo Central, SK = South-Kivu, TC = Tchuapa.
Table 2.
Relationships between Yb and key meteorological factors in agroclimatic zones of the DRC.
| Haut-Katanga | Kongo Central | South-Kivu | Tshuapa | |
|---|---|---|---|---|
| Equation | Yb = 1.6802t + 0.0445r + 80.3333 | Yb = -0.4943t + 0.0937r + 22.9640 | Yb = 6.3993t + 0.0066r + 49.0198 | Yb = -5.2989t + 0.0328r + 273.0185 |
| R-Square | 0.8344 | 0.8948 | 0.9722 | 0.8847 |
| AICc | 233.0190 | 216.4486 | -89.2741 | 221.4460 |
| p-value | < 0.001 | < 0.001 | < 0.001 | < 0.001 |
Note: Yb is the standard climate production potential (g·m-2), t represents the average annual temperature (˚C), and r denotes the annual precipitation (mm), AICc represents the Akaike Information Criterion corrected.
Table 3.
Climate productivity trends based on annual average and anomaly in the agroclimatic zones of the DRC from 1960 to 2024.
Table 3.
Climate productivity trends based on annual average and anomaly in the agroclimatic zones of the DRC from 1960 to 2024.
| Decade | Haut-Katanga | Kongo Central | Sud-Kivu | Tshuapa | ||||||||||||
|---|---|---|---|---|---|---|---|---|---|---|---|---|---|---|---|---|
| Yb (g/m²) | Yield (g/m²) | CRUE (%) | PIMP (g/m²) | Yb (g/m²) | Yield (g/m²) | CRUE (%) | PIMP (g/m²) | Yb (g/m²) | Yield (g/m²) | CRUE (%) | PIMP (g/m²) | Yb (g/m²) | Yield (g/m²) | CRUE (%) | PIMP (g/m²) | |
| 1960-1969 | 185.04 | 69.35 | 37.42 | 116.06 | 159.73 | 80.31 | 50.98 | 79.43 | 198.39 | 104.95 | 52.92 | 93.39 | 213.56 | 88.56 | 41.48 | 124.99 |
| 1970-1979 | 184.28 | 65.27 | 35.43 | 119.00 | 157.14 | 75.47 | 48.85 | 81.67 | 198.75 | 100.09 | 50.369 | 98.66 | 213.76 | 83.27 | 38.96 | 130.49 |
| 1980-1989 | 180.88 | 55.70 | 30.79 | 125.18 | 159.26 | 66.27 | 42.10 | 92.99 | 200.50 | 90.89 | 45.34 | 109.61 | 214.15 | 74.70 | 34.88 | 139.45 |
| 1990-1999 | 176.99 | 60.51 | 34.24 | 116.48 | 175.96 | 67.33 | 38.36 | 108.62 | 200.65 | 91.95 | 45.83 | 108.70 | 213.79 | 76.11 | 35.59 | 137.69 |
| 2000-2009 | 173.35 | 63.46 | 36.67 | 109.89 | 174.38 | 70.29 | 40.41 | 104.09 | 198.64 | 94.91 | 47.78 | 103.73 | 196.96 | 78.88 | 40.08 | 118.08 |
| 2010-2024 | 178.60 | 59.36 | 33.16 | 119.24 | 172.55 | 73.67 | 42.83 | 98.88 | 203.84 | 89.24 | 43.87 | 114.60 | 182.25 | 78.73 | 43.28 | 103.51 |
Disclaimer/Publisher’s Note: The statements, opinions and data contained in all publications are solely those of the individual author(s) and contributor(s) and not of MDPI and/or the editor(s). MDPI and/or the editor(s) disclaim responsibility for any injury to people or property resulting from any ideas, methods, instructions or products referred to in the content. |
© 2026 by the authors. Licensee MDPI, Basel, Switzerland. This article is an open access article distributed under the terms and conditions of the Creative Commons Attribution (CC BY) license (http://creativecommons.org/licenses/by/4.0/).
Copyright: This open access article is published under a Creative Commons CC BY 4.0 license, which permit the free download, distribution, and reuse, provided that the author and preprint are cited in any reuse.