

Submitted:
13 June 2026
Posted:
16 June 2026
You are already at the latest version
Abstract
The concentration of olive tree pollen in the atmosphere is likely to vary from one region to another, owing to the fluctuations in meteorological and climatic factors. Furthermore, particulate matter (PM) has been shown to interact with olive tree pollen, as airborne particles can adhere to pollen grains, altering their allergenicity and enhancing their ability to trigger respiratory pathologies. This interaction between PM and olive pollen may intensify the health impact on sensitive populations, particularly in areas with high levels of both air pollution and olive tree cultivation. The town of sig (located between mascara and oran) in Algeria is representative of this phenomenon, due to the vast fields of olive trees that surround the town. Significant correlations were recorded between the prevalence of olive tree pollen allergy and meteorological data as well as fine particle air pollution estimated from Sentinel5P satellite images during the years 2018 and 2019. The application of SVR, RFR and MLR Machine Learning methods made it possible to create models that could explain the prevalence of olive pollen allergy. The best result was obtained with the SVR algorithm, whose performance is expressed by R2=0.92, RMSE=2.27 and MAE=0.66. The model developed in this study could therefore contribute to the elaboration of more effective strategies aimed at minimizing the adverse effects of olive pollen allergens within the investigated region.
Keywords:
air pollution
; pollen
; prevalence
; machine learning
; Algeria
1. Introduction
Generally, the pollen grain can have an average size of 21 μm for Betula and 35 μm for Phleumpratense [1]. Olive tree pollen grains vary in diameter from 20 to 25 microns [2]. with production ranging from 2 to 4 million grains per inflorescence in table fruit varieties and up to 8 million in oil varieties [3].The size of the raw pollen grain means that it cannot reach the human upper airways.However, allergens are contained in micrometric subpollen particles capable of reaching the lungs [4]. Pollen particles can thus be found among fine particles, as shown in the study by Wang [5], where the major allergen Cry j 1 was found predominantly in the PM1.1 fraction during atmospheric particle sampling carried out near a road in a residential area during Asian desert dust transport episodes occurring just after rainfall. Figure 1 [6], shows a pollen grain from the olive tree Olea europaea with spherical elements with a diameter of 0.5 to 1 μm that can be observed between the pollen trabeculae. The prevalence of allergy to olive tree pollen is around 25% in the general population [7]. It is promoted by two main factors, including the HLA class II, IL-4RAand also IL-13 genes [8]. It manifests as allergic rhinitis and conjunctivitis. Severe allergic reactions are also common, such as asthma, urticaria and anaphylaxis [9].
Airborne pollen is an important constituent of bioaerosols [10]. It thus makes a significant contribution to the composition of fine particle pollution [11], which can be assessed by analyzing aerosol indices derived from satellite imagery [12].
This study aims to investigate the influence of fine particle pollution and meteorological parameters on the prevalence of allergy related to olive pollen in the Sig region of Algeria, which is widely known to be home to this type of crop. The use of Machine Learning tools enables the development of a model that can help plan the development of strategies to mitigate the health challenges associated with allergic diseases caused by olive tree pollen.
2. Materials and Methods
Study area
The town of Sig is located in the northwest region of Algeria at latitude 35° 32′ 00″ North and longitude: 0° 11′ 00″ West, with an estimated population of 70,000 and a growth rate of 2%. It is part of the wilaya of Mascara and lies 30 km from the Mediterranean Sea. Its climate is Mediterranean, characterized by semi-arid and temperate aridity, with rainfall not exceeding 400 mm per year. It has a dynamic industrial zone, but its primary vocation remains agriculture, where olive growing occupies a primordial place with a surface area of 4490 ha counting 481570 olive trees and generating an annual socio-economic activity estimated at more than 10000 jobs [13]. These vast agricultural fields surround the city, as shown in Figure 2, and contribute to fine particle pollution.
Sentinel 5P tropomi images
Sentinel 5P tropomi images have been available for free download from the https://disc.gsfc.nasa.gov/ website since April 30, 2018. They have a spatial resolution of 5.50 km x 3.50 km and a temporal resolution of 101.5 minutes. They include aerosol index data in the wavelength interval between 354 and 388 nm as well as in the wavelength interval between 340 and 380 nm as shown in Figure 3.
Data description
Machine learning techniques require a diverse set of input variables in order to deliver adequate results. The prevalence of pollen allergy is considered the variable to be explained. Five specific variables were selected as input factors. These are minimum temperature, humidity, wind speed, and aerosol index in the wavelength interval between 340 and 380 nm and 354-388. Monthly averages for the years 2018 and 2019 were used to run the methods of Machine learning in order to predict the prevalence of olive tree pollen allergy.
Machine Learning Methods Used
The methods of Machine learning used in this work are as follows.
- Support Vector Regression (SVR): is an analytical method used to examine the relationship between one or more predictor variables and a continuous (real-valued) dependent variable. As a machine learning technique, it allows a model to learn the significance of each variable in defining the relationship between the inputs and the output [14]. The SVR model was proposed by Vapnik [15] and is a supervised Machine learning algorithm. Typically, the SVR model is utilized in cases where the training dataset is particularly complex [16].
- Random forest (RF): The random forest method, introduced by Breiman [17], is a machine learning algorithm that employs multiple decision trees. This technique has demonstrated significant success in both regression and classification tasks in recent years, making it one of the top machine learning algorithms across various domains [18,19,20].
The RF algorithm is more powerful than other machine learning algorithms because it can randomly select subsets of training data and train trees using a randomized method [21,22].
- Multiple Linear Regression (MLR): Linear regression analysis is arguably the simplest and most common method for measuring relationships between continuous variables [23]. The multiple linear regression (MLR) model is used when there is one dependent variable and two or more independent variables. This method is effective when each independent variable has a linear relationship with the dependent variable, and the correlation between the independent variables is low [24]. In machine learning, linear regression is a model that identifies the parameter weights (w1, w2,..., wn) and the bias (b) that minimize the cost function (loss function) in a linear relationship. The cost function minimizes the loss by iteratively calculating the cost of the predicted outcome, updating the model by adjusting the parameters, and recalculating the cost. The least squares method, which calculates the mean square error (MSE), is often used for this purpose [25].
Model evaluation
We evaluated the performance of the models built using three evaluation measures widely used in machine learning. These are correlation coefficient (R2), root mean square error (RMSE) and mean absolute error (MAE). The R2 correlation coefficient assesses the model's linearity and feasibility. The mean absolute error (MAE) measures the average magnitude of the errors between predicted and actual values. Lastly, the root mean square error (RMSE) indicates the square root of the average squared differences between predicted and observed values.
- Methodology Flowchart
The flowchart describing the methodology implementation process is shown in Figure 4, and comprises the following main stages:
• Data collection on the prevalence of olive tree pollen allergy in the city of Sig for the years 2018 and 2019.
• Acquisition of Sentinel5P satellite images available daily with maximum cloudiness ⩽ 10% for the years 2018 and 2019.
• Extraction of the λ354_388 and λ340_380 values with a Python language program that reads the NetCDF files of the Sentinel5P images and extracts the data, according to the coordinates of the Sig city study area.
•Acquisition of meteorological data from the Ghriss weather station, located in the Sig city area, for the years 2018 and 2019. Extraction of temperature, humidity and wind speed.
• Data collected for the city of Sig during 2018 and 2019 are processed using 3 machine learning methods: Random forest (RF), Support Vector Regression (SVR), and Multiple Linear Regression (MLR). The Python language was used to call these methods from the machine learning library.
3. Results
The size of the olive groves around the town of Sig has caused the prevalence of olive pollen allergy to be higher than in the general population, as shown in Figure 5.
This prevalence increases especially in spring and summer. The same is true for particle pollution which experiences high rates during the same seasons. Indeed, these results are shown by satellite data. The Sentinel 5P-Tropomi images were processed as NetCDF files and a Python program was used to calculate the daily average aerosol indices for the Sig region for the years 2018 and 2019, as shown in Figure 6.
The monthly averages of the aerosol indexes λ354_388 and λ340_380, were calculated from the daily data, and shows that the highest values occur in particular during the months of June and July in the years 2018 and 2019.
Weather parameters also influence the prevalence of allergic diseases, so data for minimum temperature, humidity and wind speed in the Sig area for the years 2018 and 2019 were collected as shown in Figure 7.
4. Discussion
The input parameters represented by the satellite data shown in Figure 6 as well as the meteorological parameters presented in Figure 7 are compared to the output parameter presented in Figure 5 concerning the prevalence of olive pollen allergy.
A correlation matrix is used to assess the dependency between the input and output parameters used in this study, as shown in Figure 8. Among the input variables, the highest correlation was found between aerosol indexes λ354_388 and λ340_380 followed by the correlation between minimum temperature and index λ354_388. In terms of input and output variables, the correlation between the prevalence of olive pollen allergy and parameters such as minimum temperature, aerosol indexes λ354_388 and λ340_380 and humidity were broadly equivalent. On the other hand, the correlation of prevalence with speed was very weak.
Comparing the coefficient of determination (R2) and the error distribution of the SVR model with those of the RFR and MLR models, the SVR model appears to be more accurate in predicting the prevalence of allergy to olive tree pollens. Nevertheless, the performance values of the RFR model are within an acceptable range, indicating satisfactory prediction of results. On the other hand, the MLR model's performance is the weakest. Table 1 provides a summary of the obtained performance values.
In Figure 9 shows the comparison between the prevalence of olive pollen allergy recorded in the Sig region and the values simulated using the SVR model. The results of the comparison are satisfactory overall, but to get a clearer idea of the validity of this methodology, it is necessary to use data over a much longer period.
This study did not take into account the influence of air pollution on pollen such as NO2 or O3 [27]. Indeed, the weakening of the pollen grain by atmospheric pollution results in the dispersion of allergens in the respirable fraction of atmospheric aerosols [1,28]. Additionally, the amount of allergens per pollen grain has been shown to correlate with atmospheric CO2 concentration [29].
5. Conclusions
Populations living in agricultural areas face an increased risk of pollen allergy prevalence, as is the case in the town of Sig, Algeria, a region widely recognized for its extensive olive groves, whose pollen constitutes the central focus of this study. The methodology employed in this work leverages Machine Learning techniques to construct a predictive model capable of explaining the prevalence of olive tree pollen allergy, using aerosol data from the Sentinel-5P satellite combined with meteorological parameters. The model, built upon the SVR algorithm, could significantly contribute to the development of more effective strategies aimed at mitigating the health risks associated with allergic diseases triggered by olive tree pollen in the investigated region.
Funding
“This research received no external funding”
Institutional Review Board Statement
“Not applicable” for studies not involving humans or animals.
Acknowledgments
The authors have reviewed and edited the output and take full responsibility for the content of this publication.”
Abbreviations
The following abbreviations are used in this manuscript:
| MDPI | Multidisciplinary Digital Publishing Institute |
| DOAJ | Directory of open access journals |
| TLA | Three letter acronym |
| LD | Linear dichroism |
References
- Choël, M.; Visez, N. Altérations du grain de pollen par la pollution atmosphérique. Rev. Française D'allergologie 2019, 59(8), 555–562. [Google Scholar] [CrossRef]
- Pesson, P.; Louveaux, J.L. Pollinisation et production végétale; INRA: Paris, 1984; Volume isbn13, pp. 168–172. ISBN 978-2-8534-0481-5. [Google Scholar]
- Breton, C.; Bervillé, A. Histoire de l'olivier; Quae, 2012; ISBN isbn: 2759218228, 9782759218226. [Google Scholar]
- Taylor, P. E.; Flagan, R. C.; Miguel, A. G.; Valenta, R.; Glovsky, M. M. Birch pollen rupture and the release of aerosols of respirable allergens. Clin. Exp. Allergy 2004, 34(10), 1591–1596. [Google Scholar] [CrossRef] [PubMed]
- Wang, Q.; Nakamura, S.; Lu, S.; Xiu, G.; Nakajima, D.; Suzuki, M.; Miwa, M. Release behavior of small sized daughter allergens from Cryptomeria japonica pollen grains during urban rainfall event. Aerobiologia 2012, 28, 71–81. [Google Scholar] [CrossRef]
- Brito, F. F.; Gimeno, P. M.; Carnés, J.; Martín, R.; Fernández-Caldas, E.; Lara, P.; Guerra, F. Olea europaea pollen counts and aeroallergen levels predict clinical symptoms in patients allergic to olive pollen. Ann. Allergy Asthma Immunol. 2011, 106(2), 146–152. [Google Scholar] [CrossRef] [PubMed]
- Batanero, E.; Villalba, M. Olive pollen allergens: an insight into clinical, diagnostic, and therapeutic concepts of allergy. In Olives and olive oil in health and disease prevention; Academic Press, 2021; pp. 359–375. [Google Scholar] [CrossRef]
- Zaim, F. A.; Feddi, N.; Zaher, H.; Bouraddane, M.; Guennouni, M.; Admou, B. L’olivier, une richesse méditerranéenne au prix d’une allergie complexe. Rev. Française d'Allergologie 2023, 63(5), 103667. [Google Scholar] [CrossRef]
- Sayah, W.; Guermache, I.; Berkane, I.; Kaci, A. A.; Djidjik, R. Profil clinique et allergologique des pollinoses dans la région d’Alger. Rev. Algérienne D’allergologie Et. D’immunologie Clin. 2021, 6, 2543–3555. [Google Scholar]
- Selvaggi, R.; Tedeschini, E.; Pasqualini, S.; Moroni, B.; Petroselli, C.; Cappelletti, D. A New Technique for the Passive Monitoring of Particulate Matter: Olive Pollen Grains as Bioindicators of Air Quality in Urban and Industrial Areas. Appl. Sci. 2023, 13(17), 9541. [Google Scholar] [CrossRef]
- Lippmann, M. Toxicological and epidemiological studies of cardiovascular effects of ambient air fine particulate matter (PM2. 5) and its chemical components: coherence and public health implications. Crit. Rev. Toxicol. 2014, 44(4), 299–347. [Google Scholar] [CrossRef] [PubMed]
- Han, S.; Kundhikanjana, W.; Towashiraporn, P.; Stratoulias, D. Interpolation-based fusion of Sentinel-5P, SRTM, and regulatory-grade ground stations data for producing spatially continuous maps of PM2. 5 concentrations nationwide over Thailand. Atmosphere 2022, 13(2), 161. [Google Scholar] [CrossRef]
- Bouras, N. Faisabilite de mise en place d’une indication géographique sur l’olive de table variété «Sigoise» de Sig W.mascara. Mémoire de magistère.ENSA. 2015. Available online: http://dspace.ensa.dz:8080/jspui/bitstream/123456789/1857/1/BOURAS_NAIMA.
- Zhang, F.; O'Donnell, L. J. Support vector regression. In Machine learning; Academic Press, 2020; pp. 123–140. [Google Scholar] [CrossRef]
- Vapnik, V.; Golowich, S.; Smola, A. Support vector method for function approximation, regression estimation and signal processing. Advances in neural information processing systems. 1996, 9. Available online: https://papers.nips.cc/paper/1187-support-vector-method-for-function-approximation-regression-estimation-and-signal-processing.
- Saha, A.; Pal, S. C.; Arabameri, A.; Blaschke, T.; Panahi, S.; Chowdhuri, I.; Arora, A. Flood susceptibility assessment using novel ensemble of hyperpipes and support vector regression algorithms. Water 2021, 13(2), 241. [Google Scholar] [CrossRef]
- Breiman, L. Random forests. Mach. Learn. 2001, 45, 5–32. [Google Scholar] [CrossRef]
- Pourghasemi, H. R.; Pouyan, S.; Heidari, B.; Farajzadeh, Z.; Shamsi, S. R. F.; Babaei, S.; Sadeghian, F. Spatial modeling, risk mapping, change detection, and outbreak trend analysis of coronavirus (COVID-19) in Iran (days between February 19 and June 14, 2020). Int. J. Infect. Dis. 2020, 98, 90–108. [Google Scholar] [CrossRef] [PubMed]
- Jeung, M.; Baek, S.; Beom, J.; Cho, K. H.; Her, Y.; Yoon, K. Evaluation of random forest and regression tree methods for estimation of mass first flush ratio in urban catchments. J. Hydrol. 2019, 575, 1099–1110. [Google Scholar] [CrossRef]
- Izquierdo-Verdiguier, E.; Zurita-Milla, R. An evaluation of Guided Regularized Random Forest for classification and regression tasks in remote sensing. Int. J. Appl. Earth Obs. Geoinf. 2020, 88, 102051. [Google Scholar] [CrossRef]
- Panov, P.; Džeroski, S. Combining bagging and random subspaces to create better ensembles. In international symposium on intelligent data analysis; Springer Berlin Heidelberg: Berlin, Heidelberg, September 2007; pp. 118–129. [Google Scholar] [CrossRef] [PubMed]
- Yeşilkanat, C. M. Spatio-temporal estimation of the daily cases of COVID-19 in worldwide using random forest machine learning algorithm. Chaos Solitons Fractals 2020, 140, 110210.10. [Google Scholar] [CrossRef] [PubMed]
- Hope, T. M. Linear regression. In Machine Learning; 2020; pp. 67–81. [Google Scholar] [CrossRef]
- Kim, S. J.; Bae, S. J.; Jang, M. W. Linear regression machine learning algorithms for estimating reference evapotranspiration using limited climate data. Sustainability 2022, 14(18), 11674. [Google Scholar] [CrossRef]
- Kang, M. J. Comparison of gradient descent for deep learning. J. Korea Acad.-Ind. Coop. Soc. 2020, 21(2), 189–194. [Google Scholar] [CrossRef]
- Bengoudira, M. A. A.; Sakloun Bensoltana, I.; Yahiaoui, F. Effet de la pollution de l’air par les matières particulaires les PM10 et les PM2,5. Mémoire de Master. Université Mustapha Stambouli Mascara, 2021. [Google Scholar]
- Frank, U.; Ernst, D. Effects of NO2 and ozone on pollen allergenicity. Front. Plant Sci. 2016, 7, 179392. [Google Scholar] [CrossRef] [PubMed]
- Capone, P.; Lancia, A.; D’Ovidio, M. C. Interaction between Air Pollutants and Pollen Grains: Effects on Public and Occupational Health. Atmosphere 2023, 14(10), 1544. [Google Scholar] [CrossRef]
- Choi, Y. J.; Oh, H. R.; Oh, J. W.; Kim, K. R.; Kim, M. J.; Kim, B. J.; Baek, W. G. Chamber and field studies demonstrate differential Amb a 1 contents in common ragweed depending on CO2 levels. Allergy Asthma Immunol. Res. 2018, 10(3), 278. [Google Scholar] [CrossRef] [PubMed]
Figure 1.
Oleaeuropaea pollen grain with spherical elements 0.5 to 1 μm in diameter.
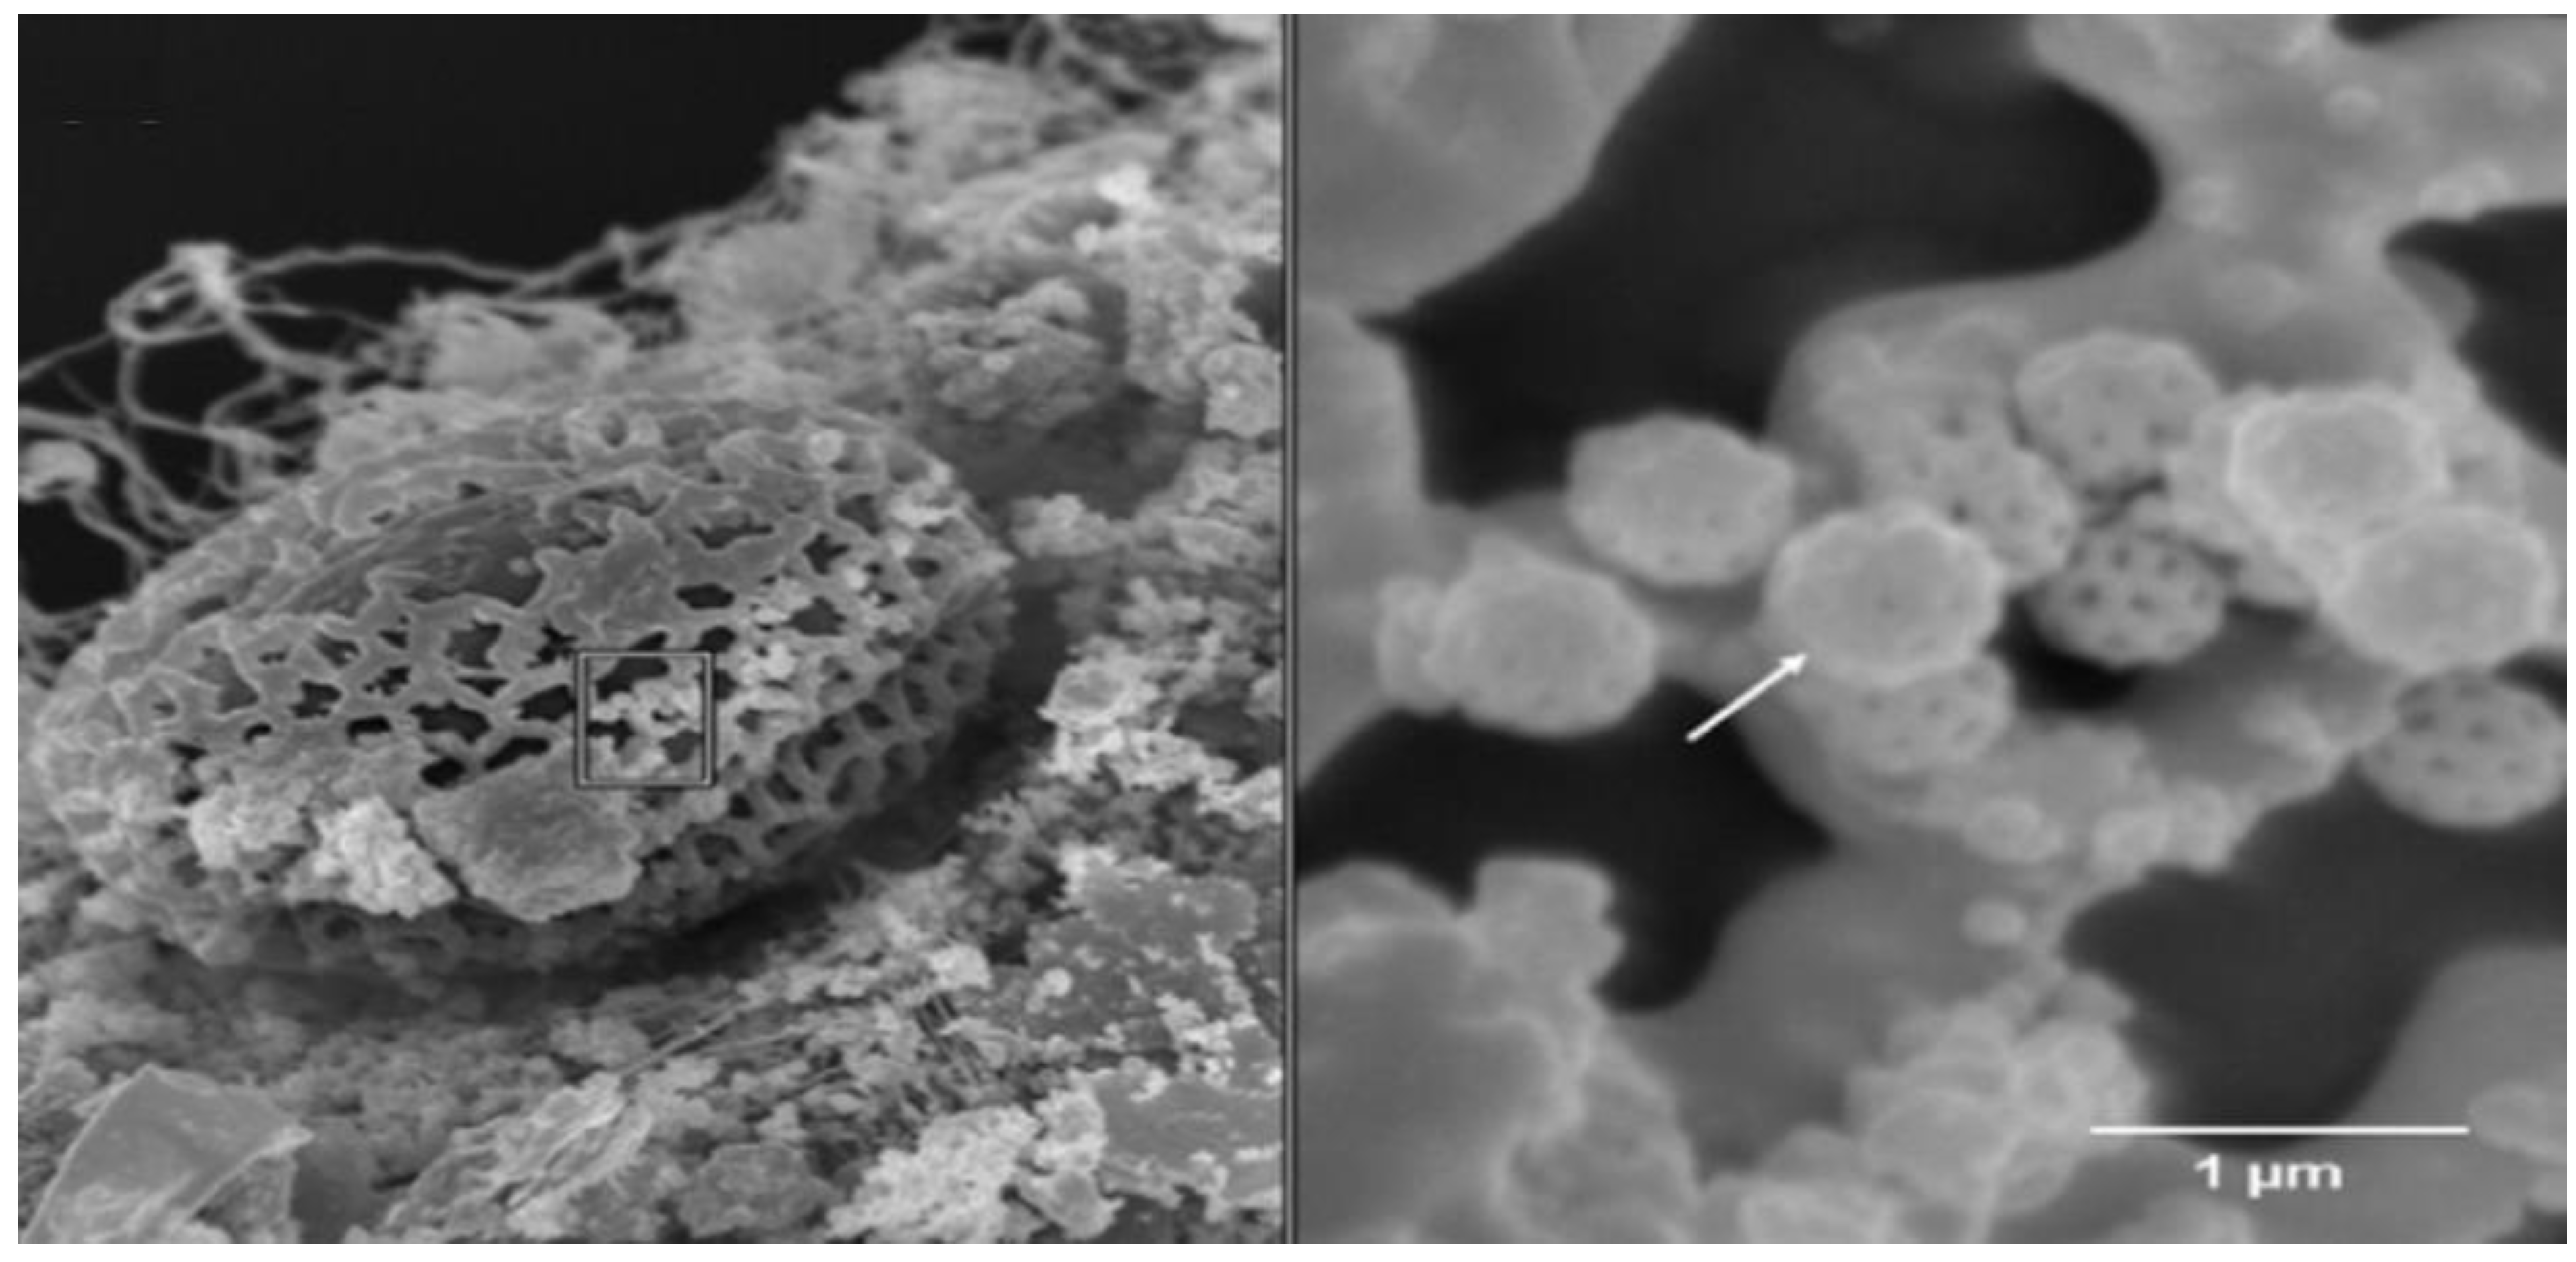
Figure 2.
Geographical position of the city of SIG in Algeria. Source: Authors.
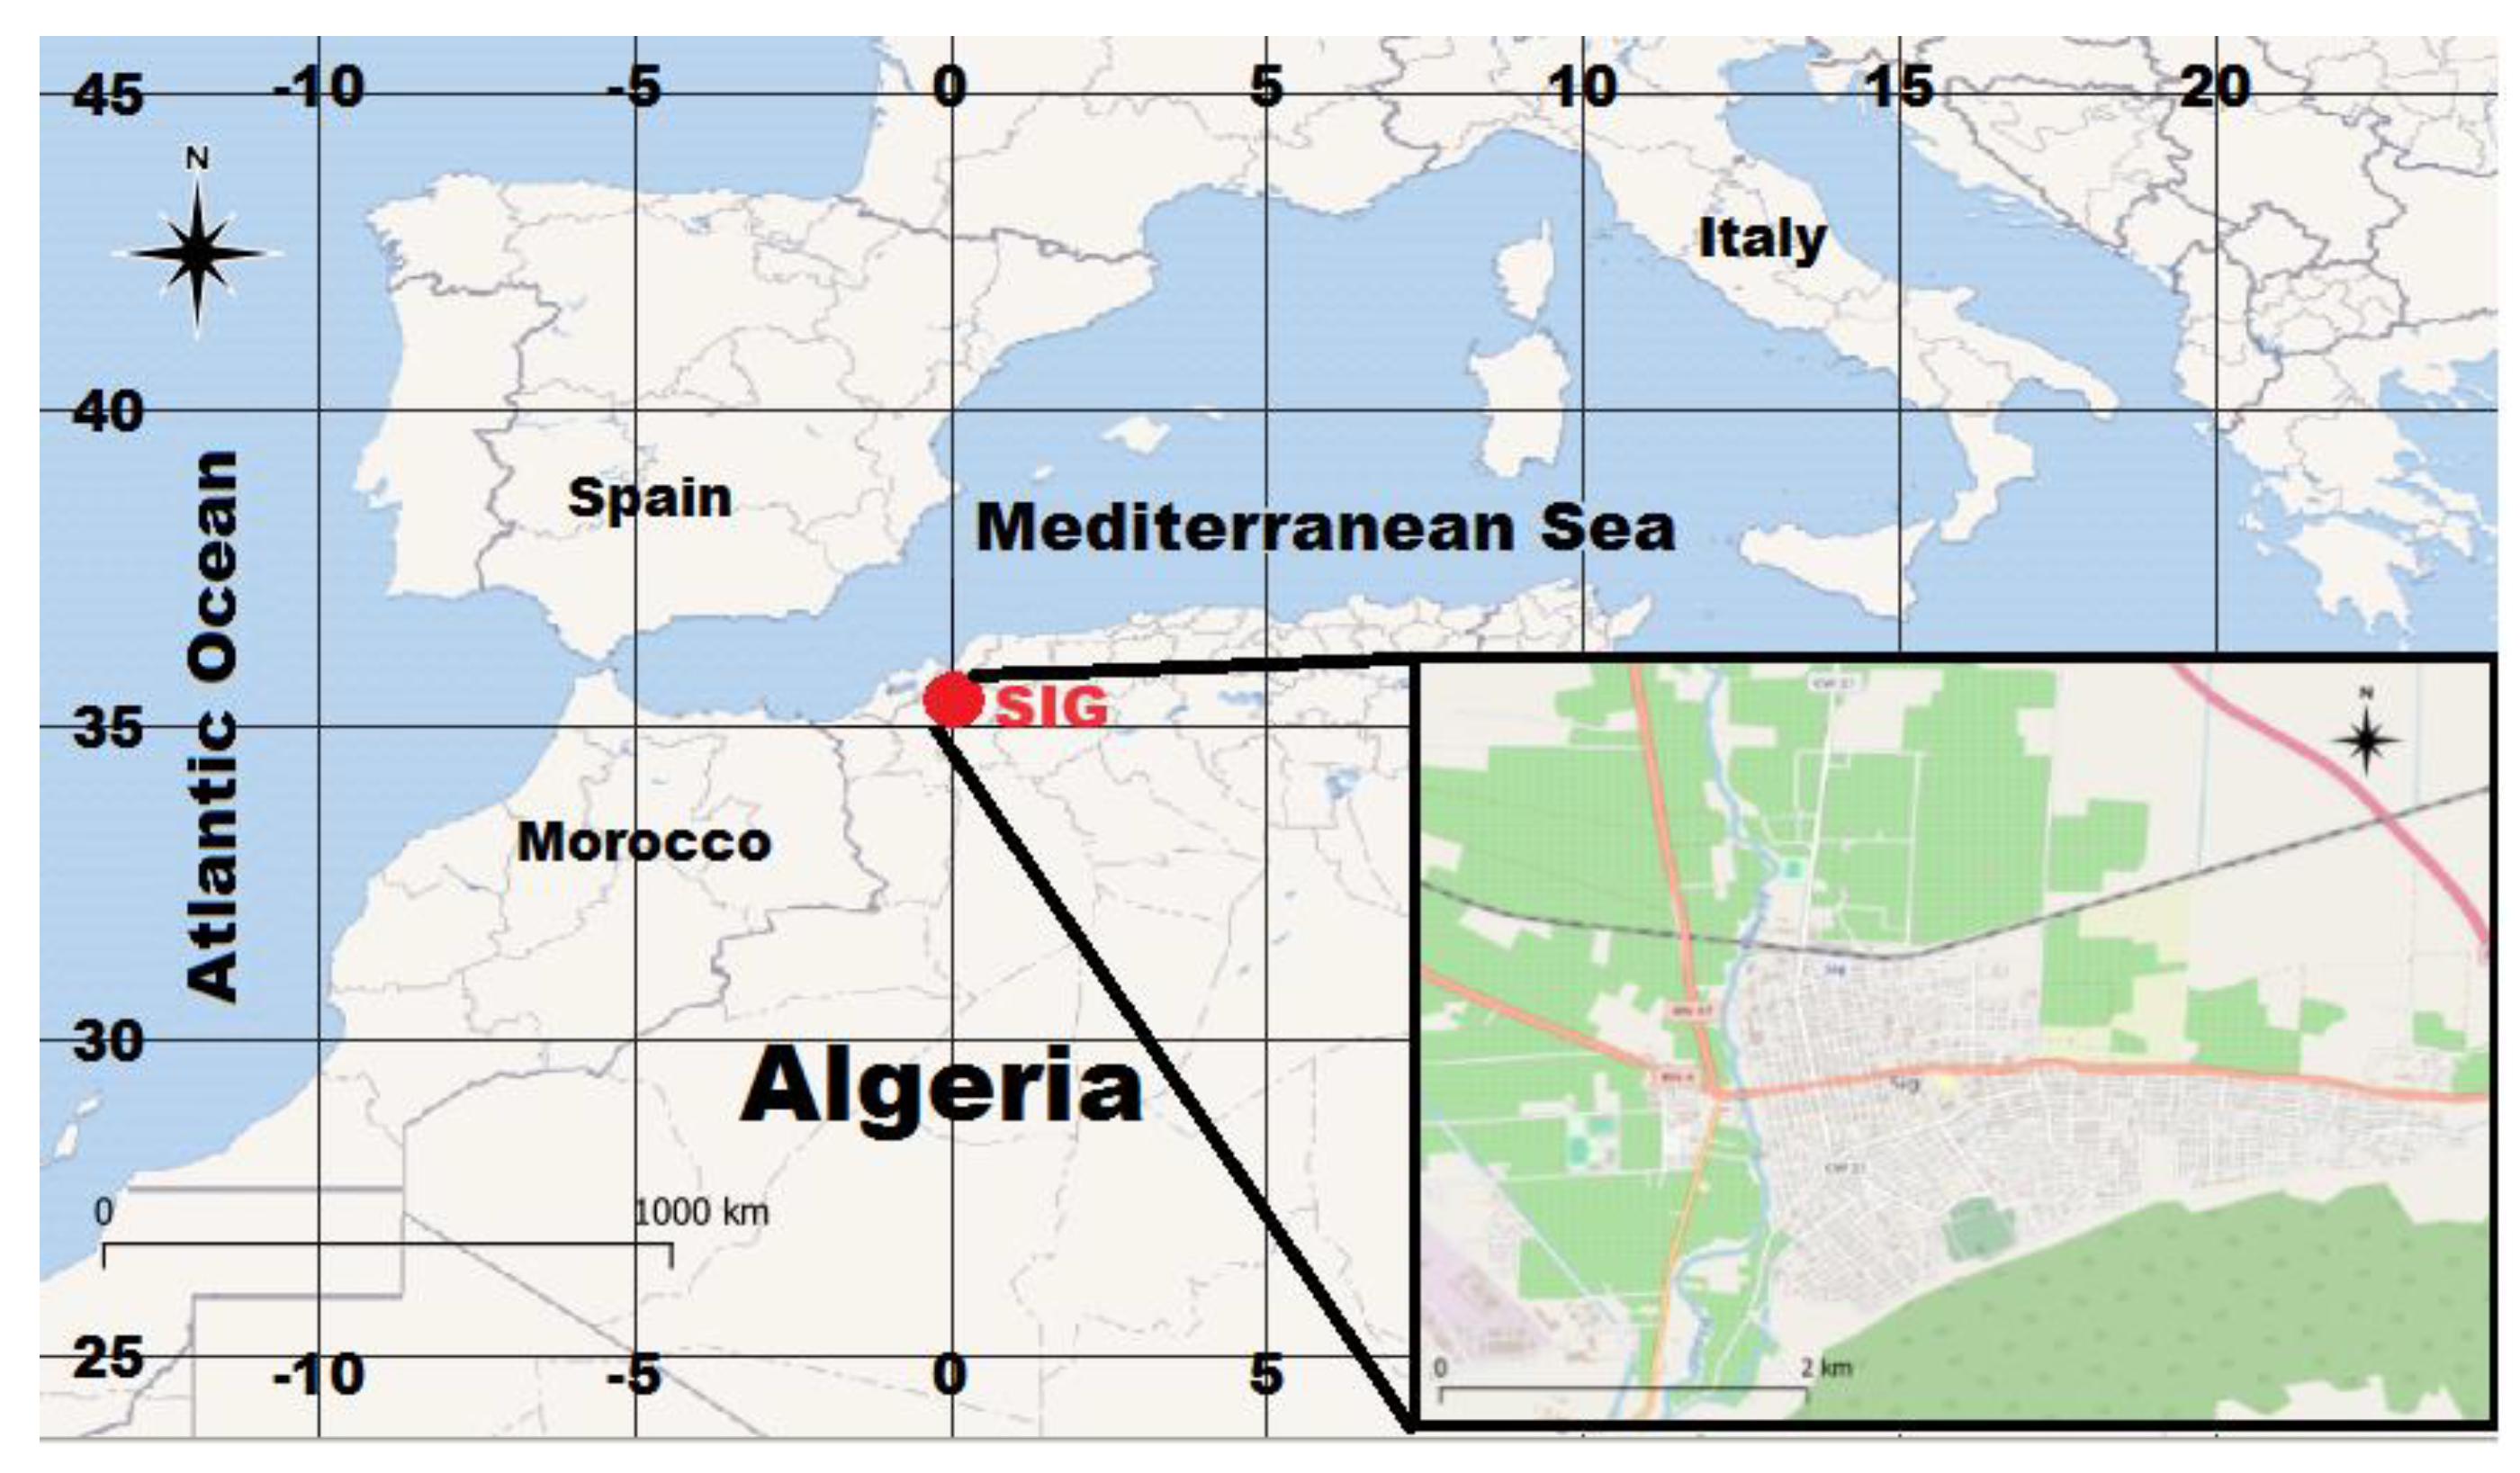
Figure 3.
Data from the TROPOMI aerosol index in the wavelength interval between 340 and 380 nm dated 01/10/2019 over North Africa. Source: Authors.
Figure 3.
Data from the TROPOMI aerosol index in the wavelength interval between 340 and 380 nm dated 01/10/2019 over North Africa. Source: Authors.
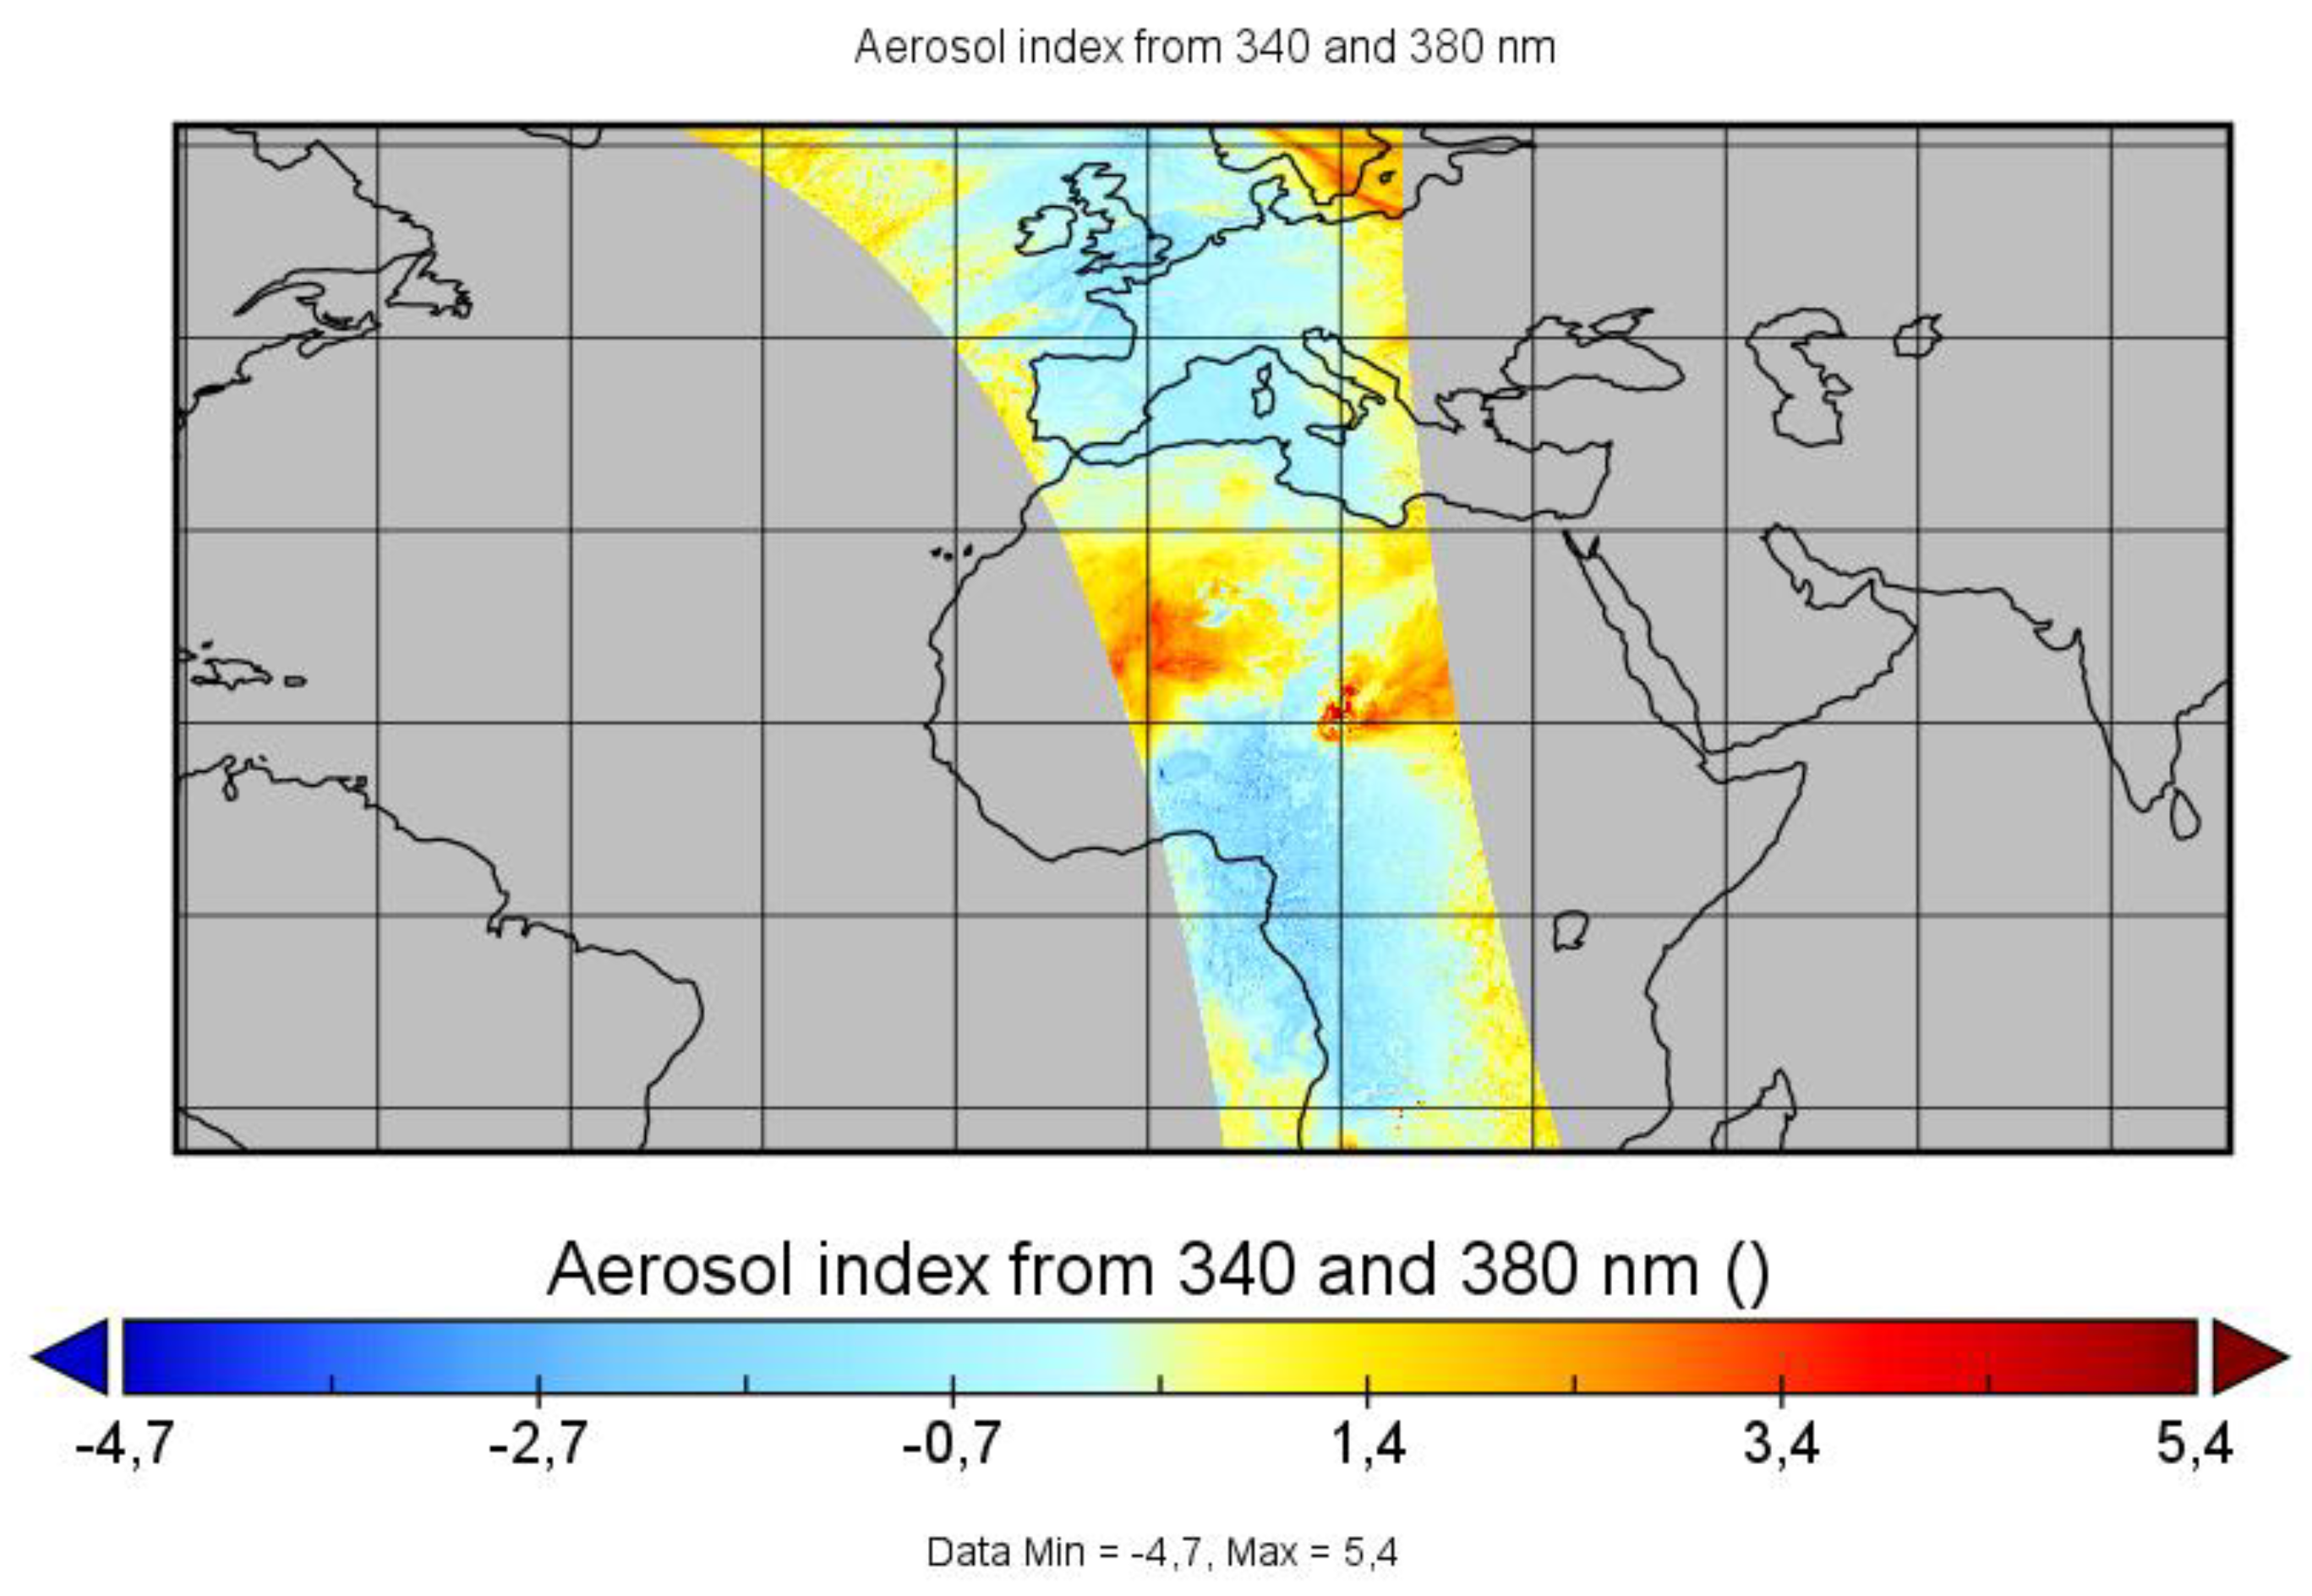
Figure 4.
Flowchart of research methodology.
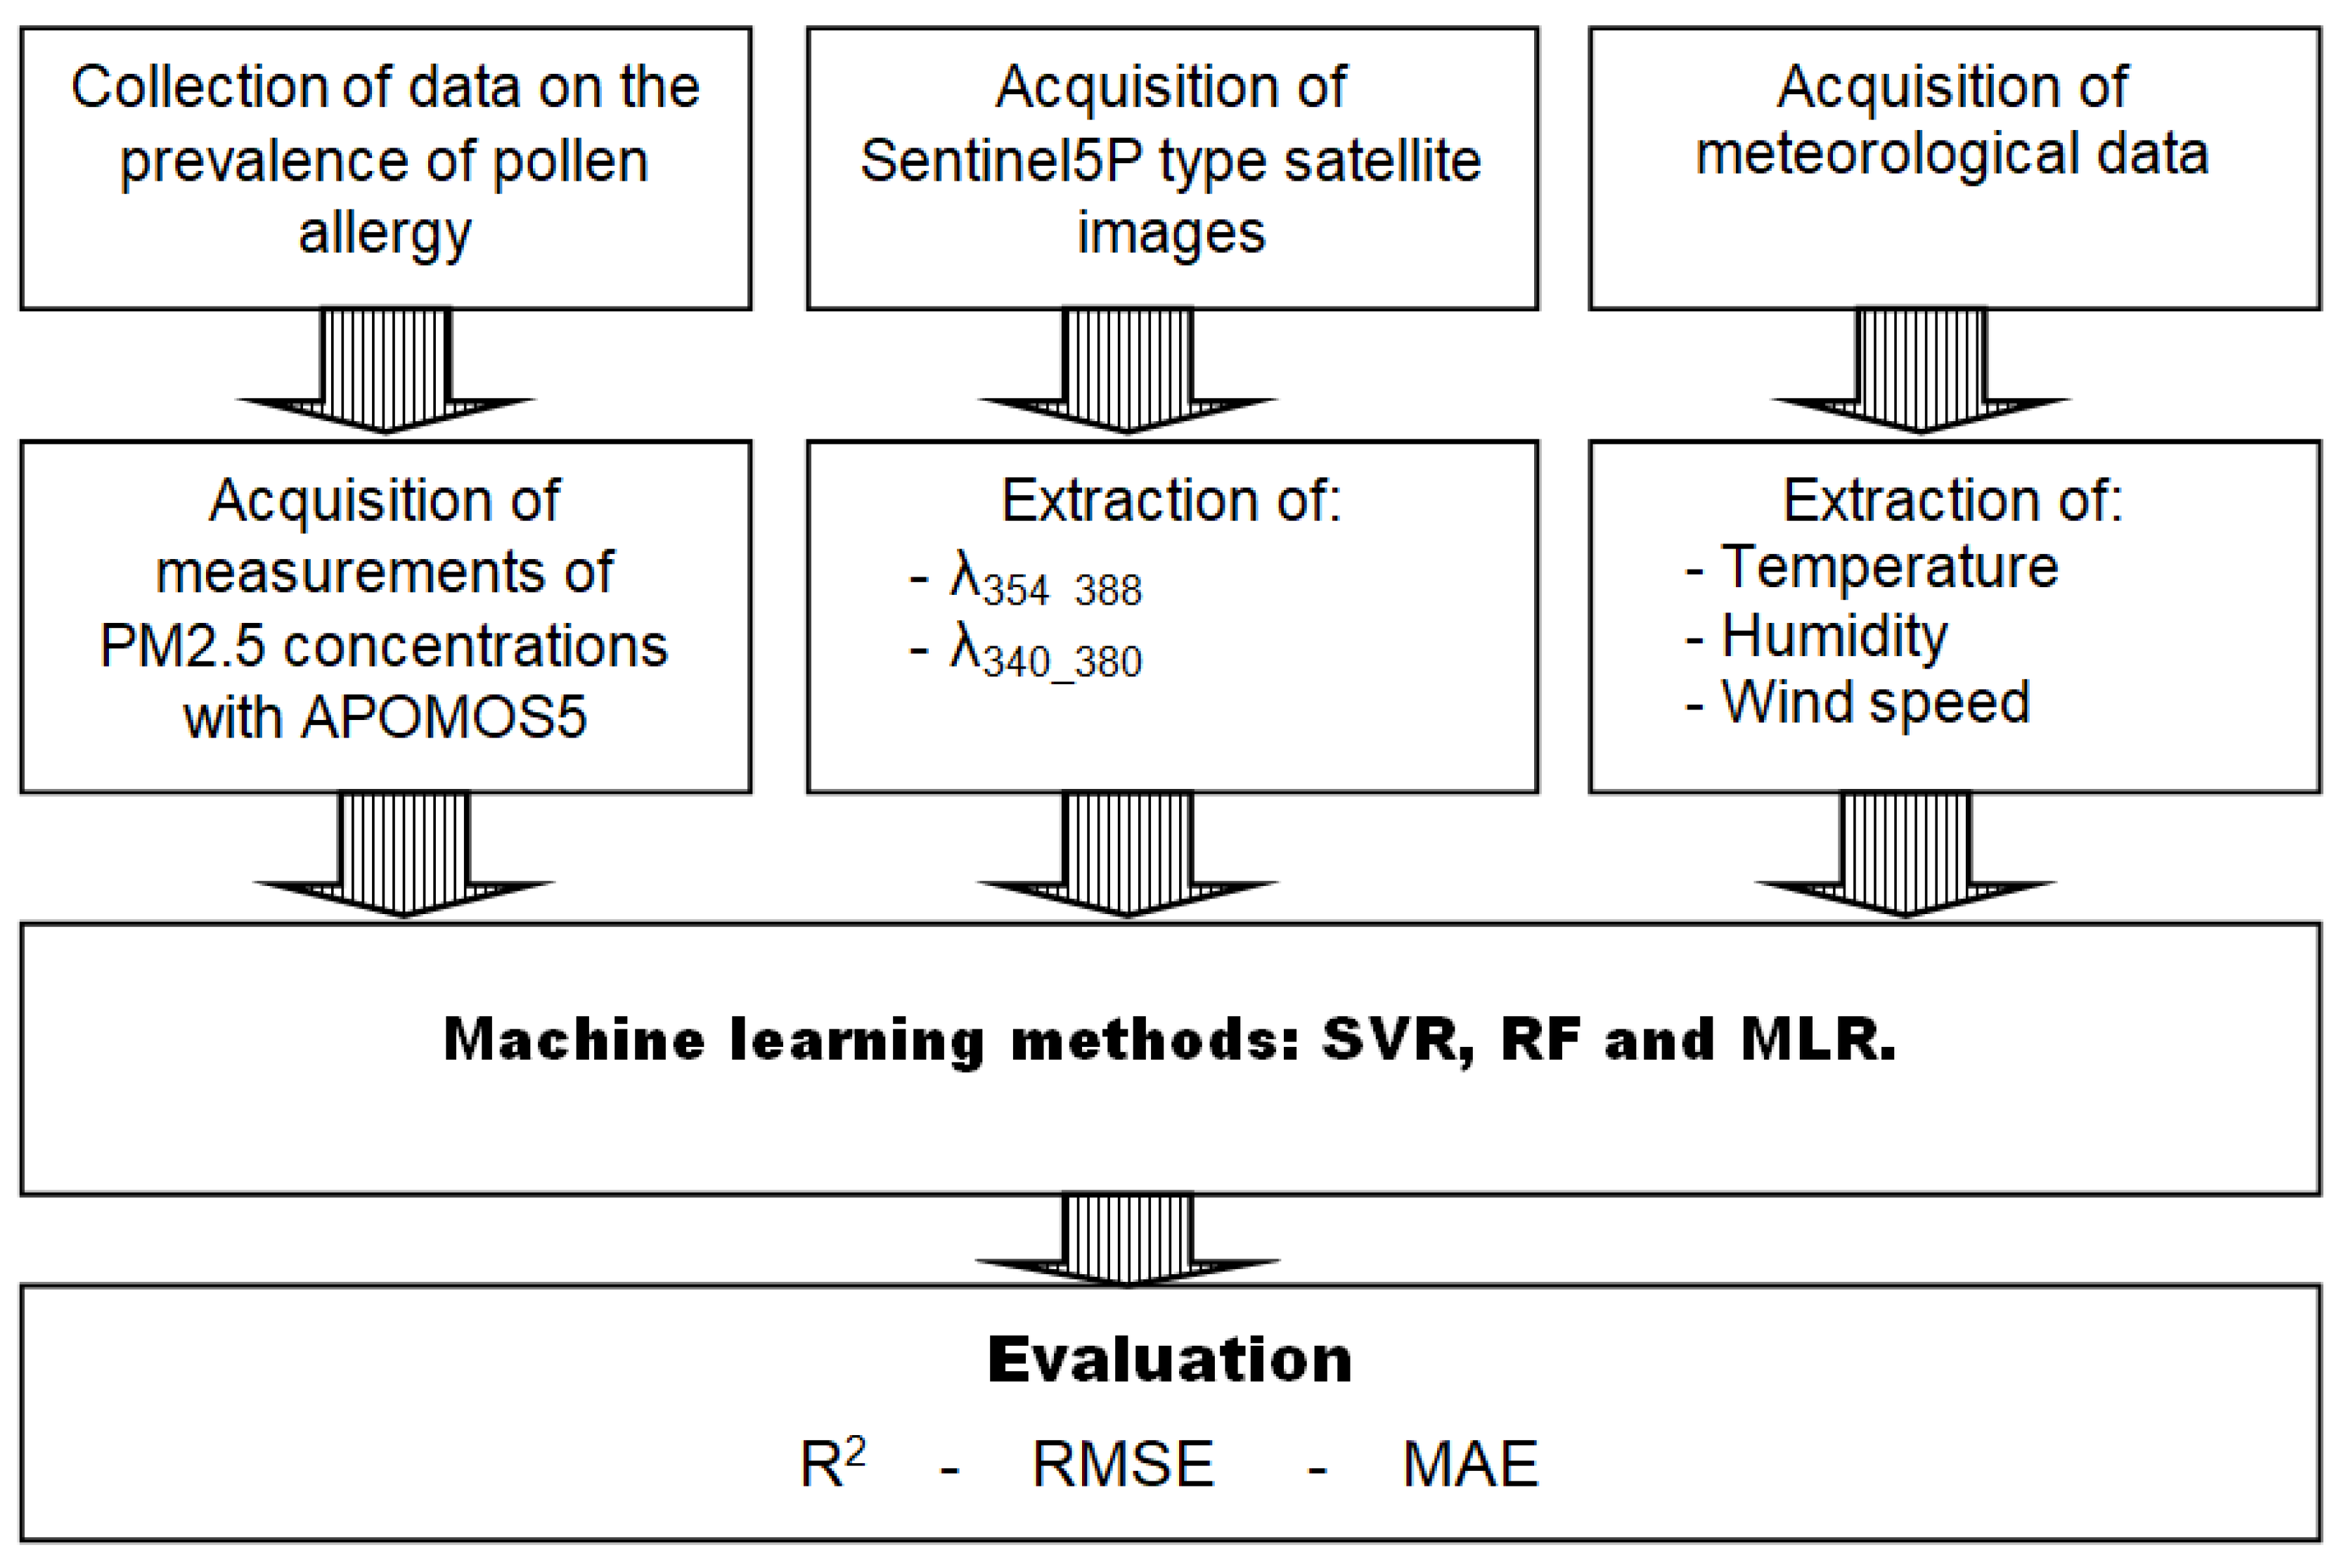
Figure 5.
Prevalence of olive pollen allergy in the city of Sig during the years 2018 and 2019. [26].
Figure 5.
Prevalence of olive pollen allergy in the city of Sig during the years 2018 and 2019. [26].
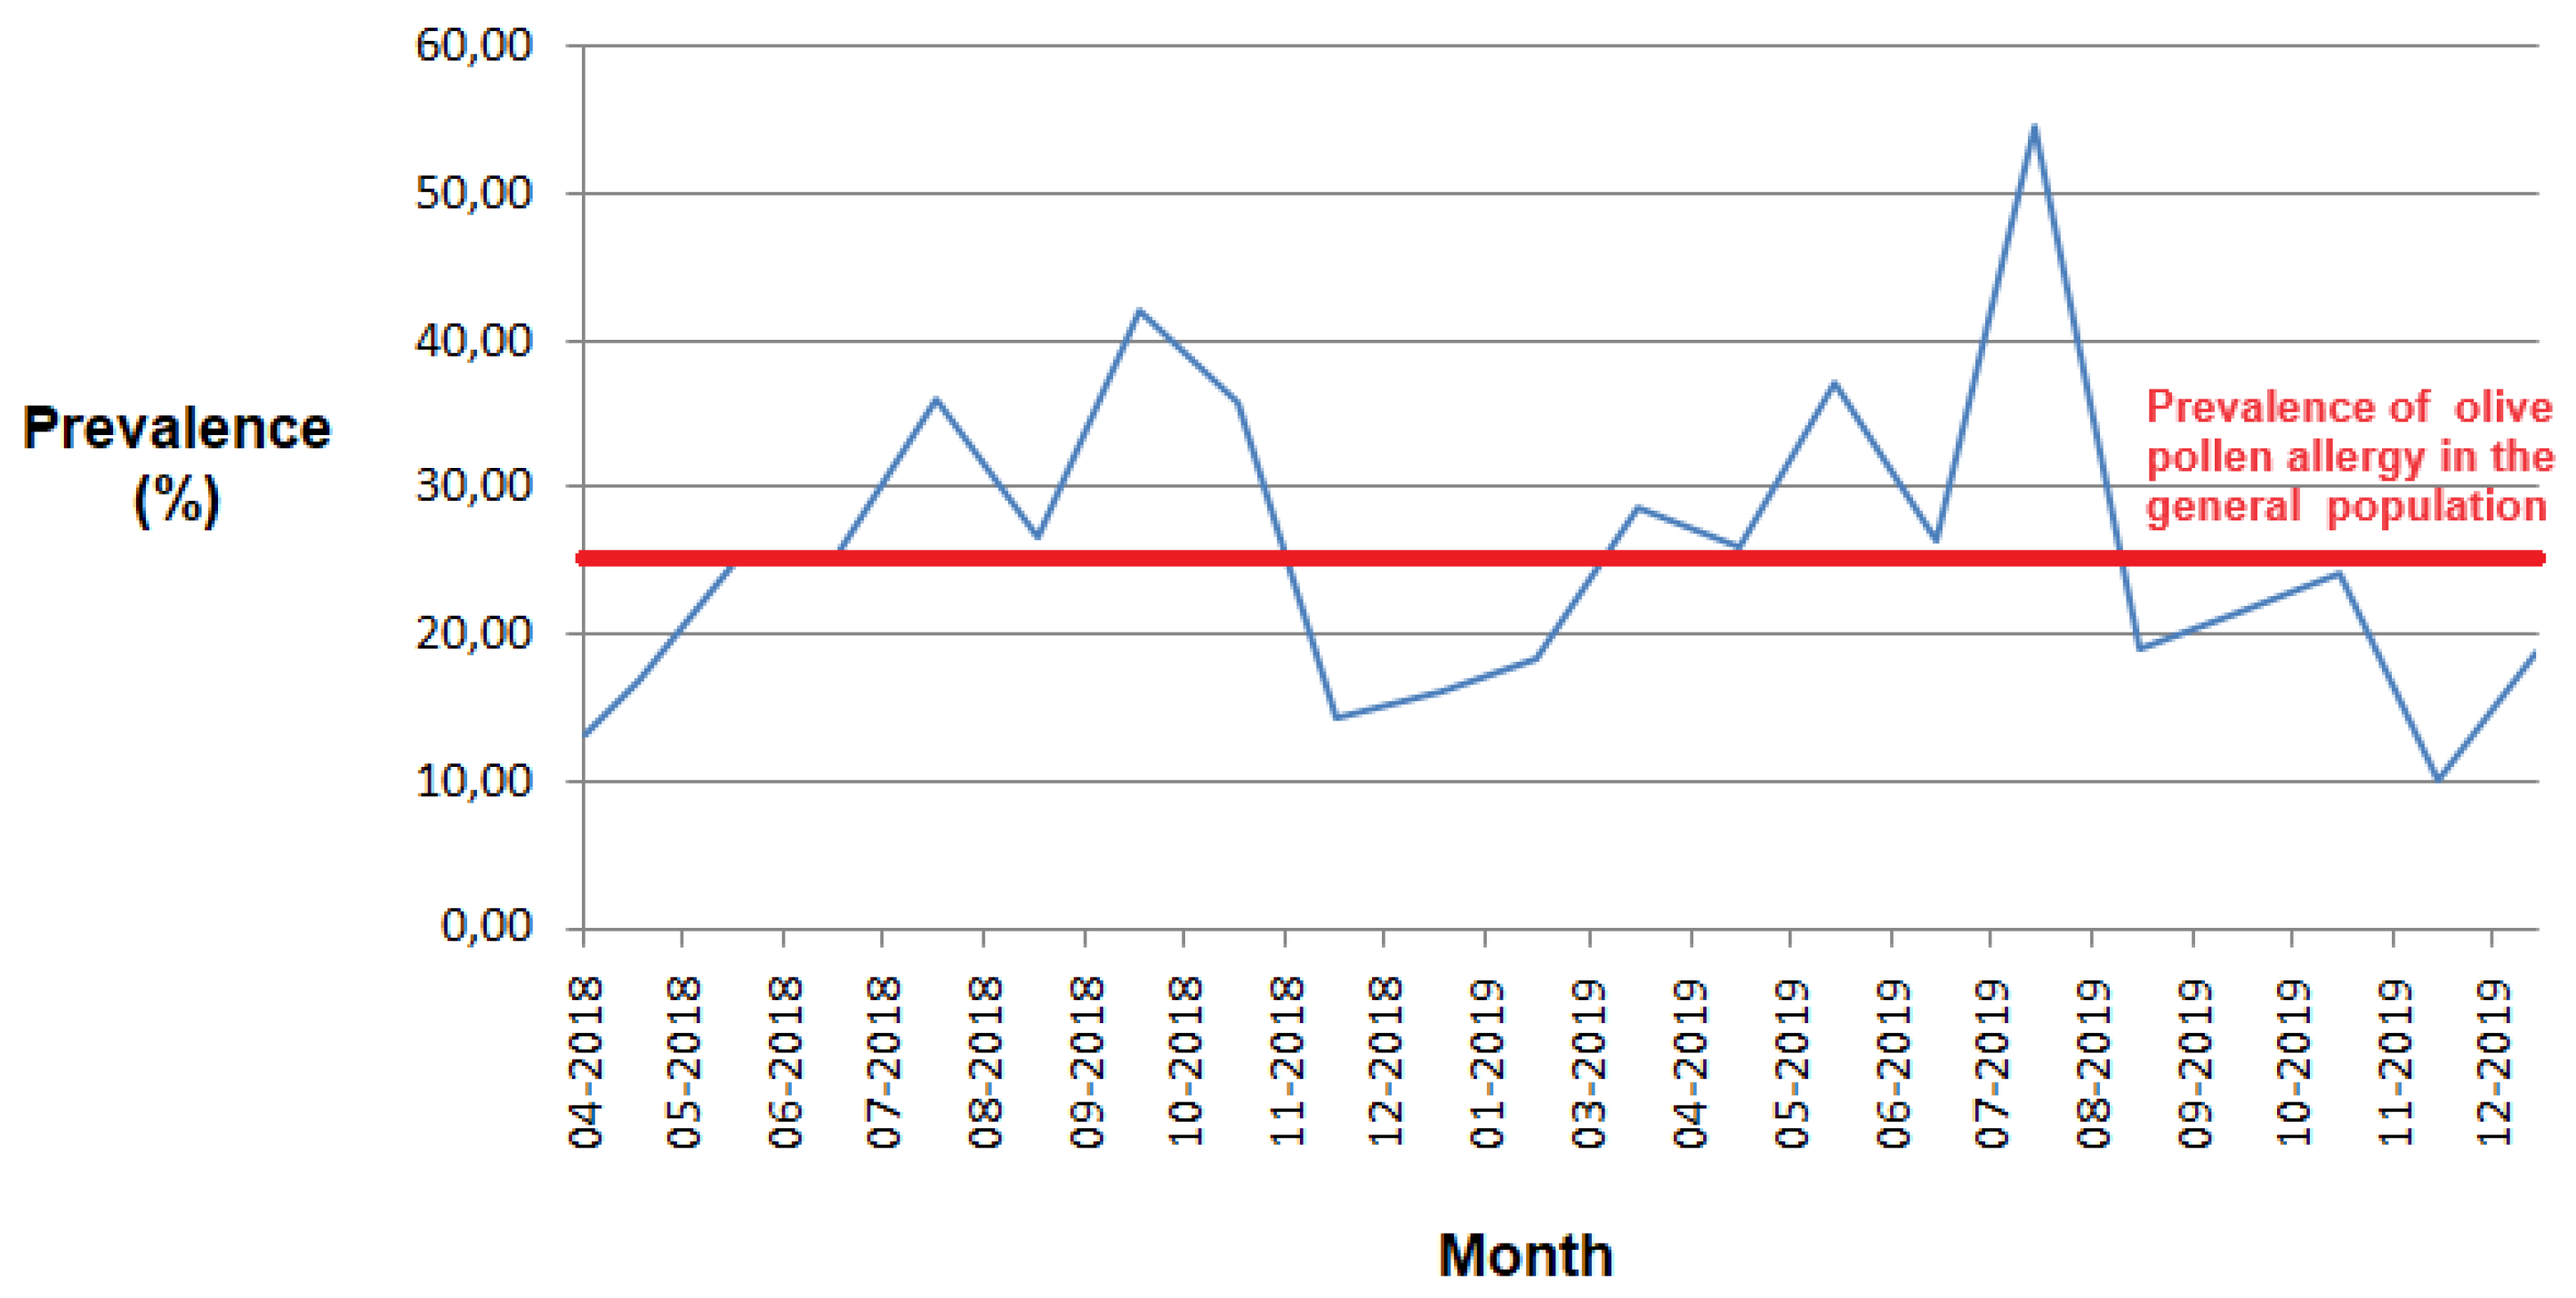
Figure 6.
Daily aerosol index λ354_388 and λ340_380 from Sentinel 5P-Tropomi type images for the years 2018 and 2019, concerning the Sig region in Algeria.
Figure 6.
Daily aerosol index λ354_388 and λ340_380 from Sentinel 5P-Tropomi type images for the years 2018 and 2019, concerning the Sig region in Algeria.
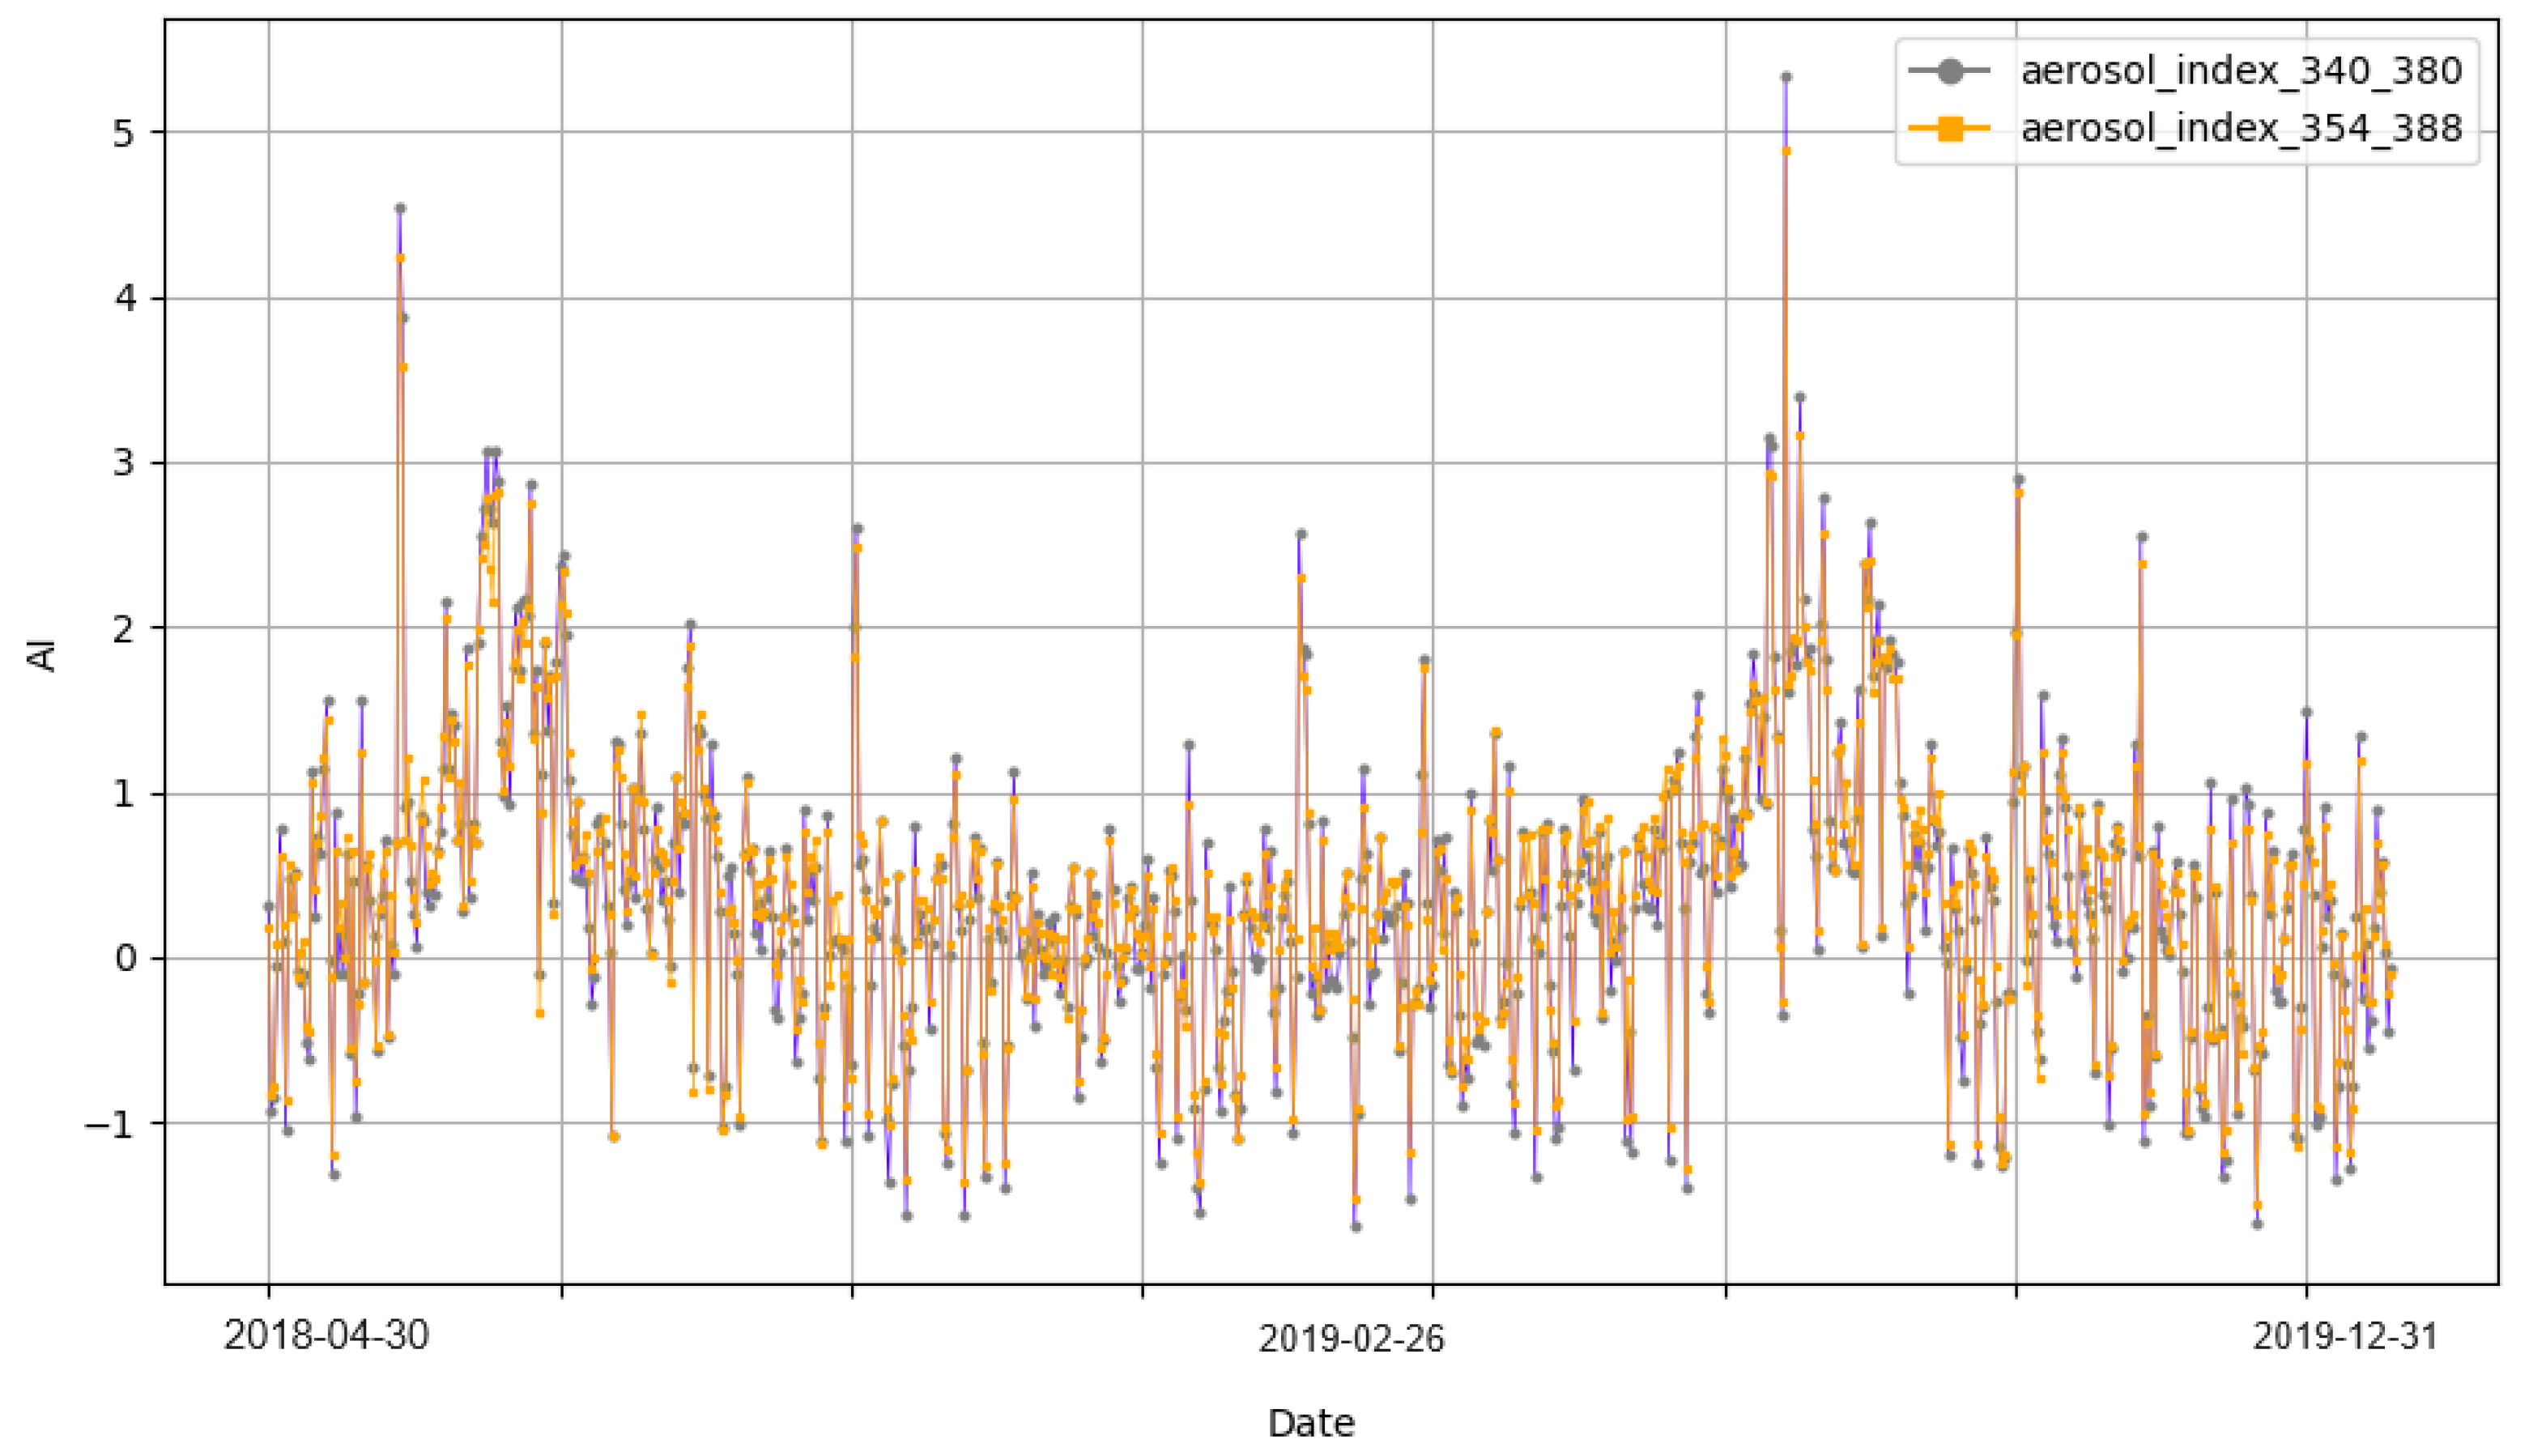
Figure 7.
Minimum temperature, humidity and wind speed in the Sig region during the years 2018 and 2019.
Figure 7.
Minimum temperature, humidity and wind speed in the Sig region during the years 2018 and 2019.
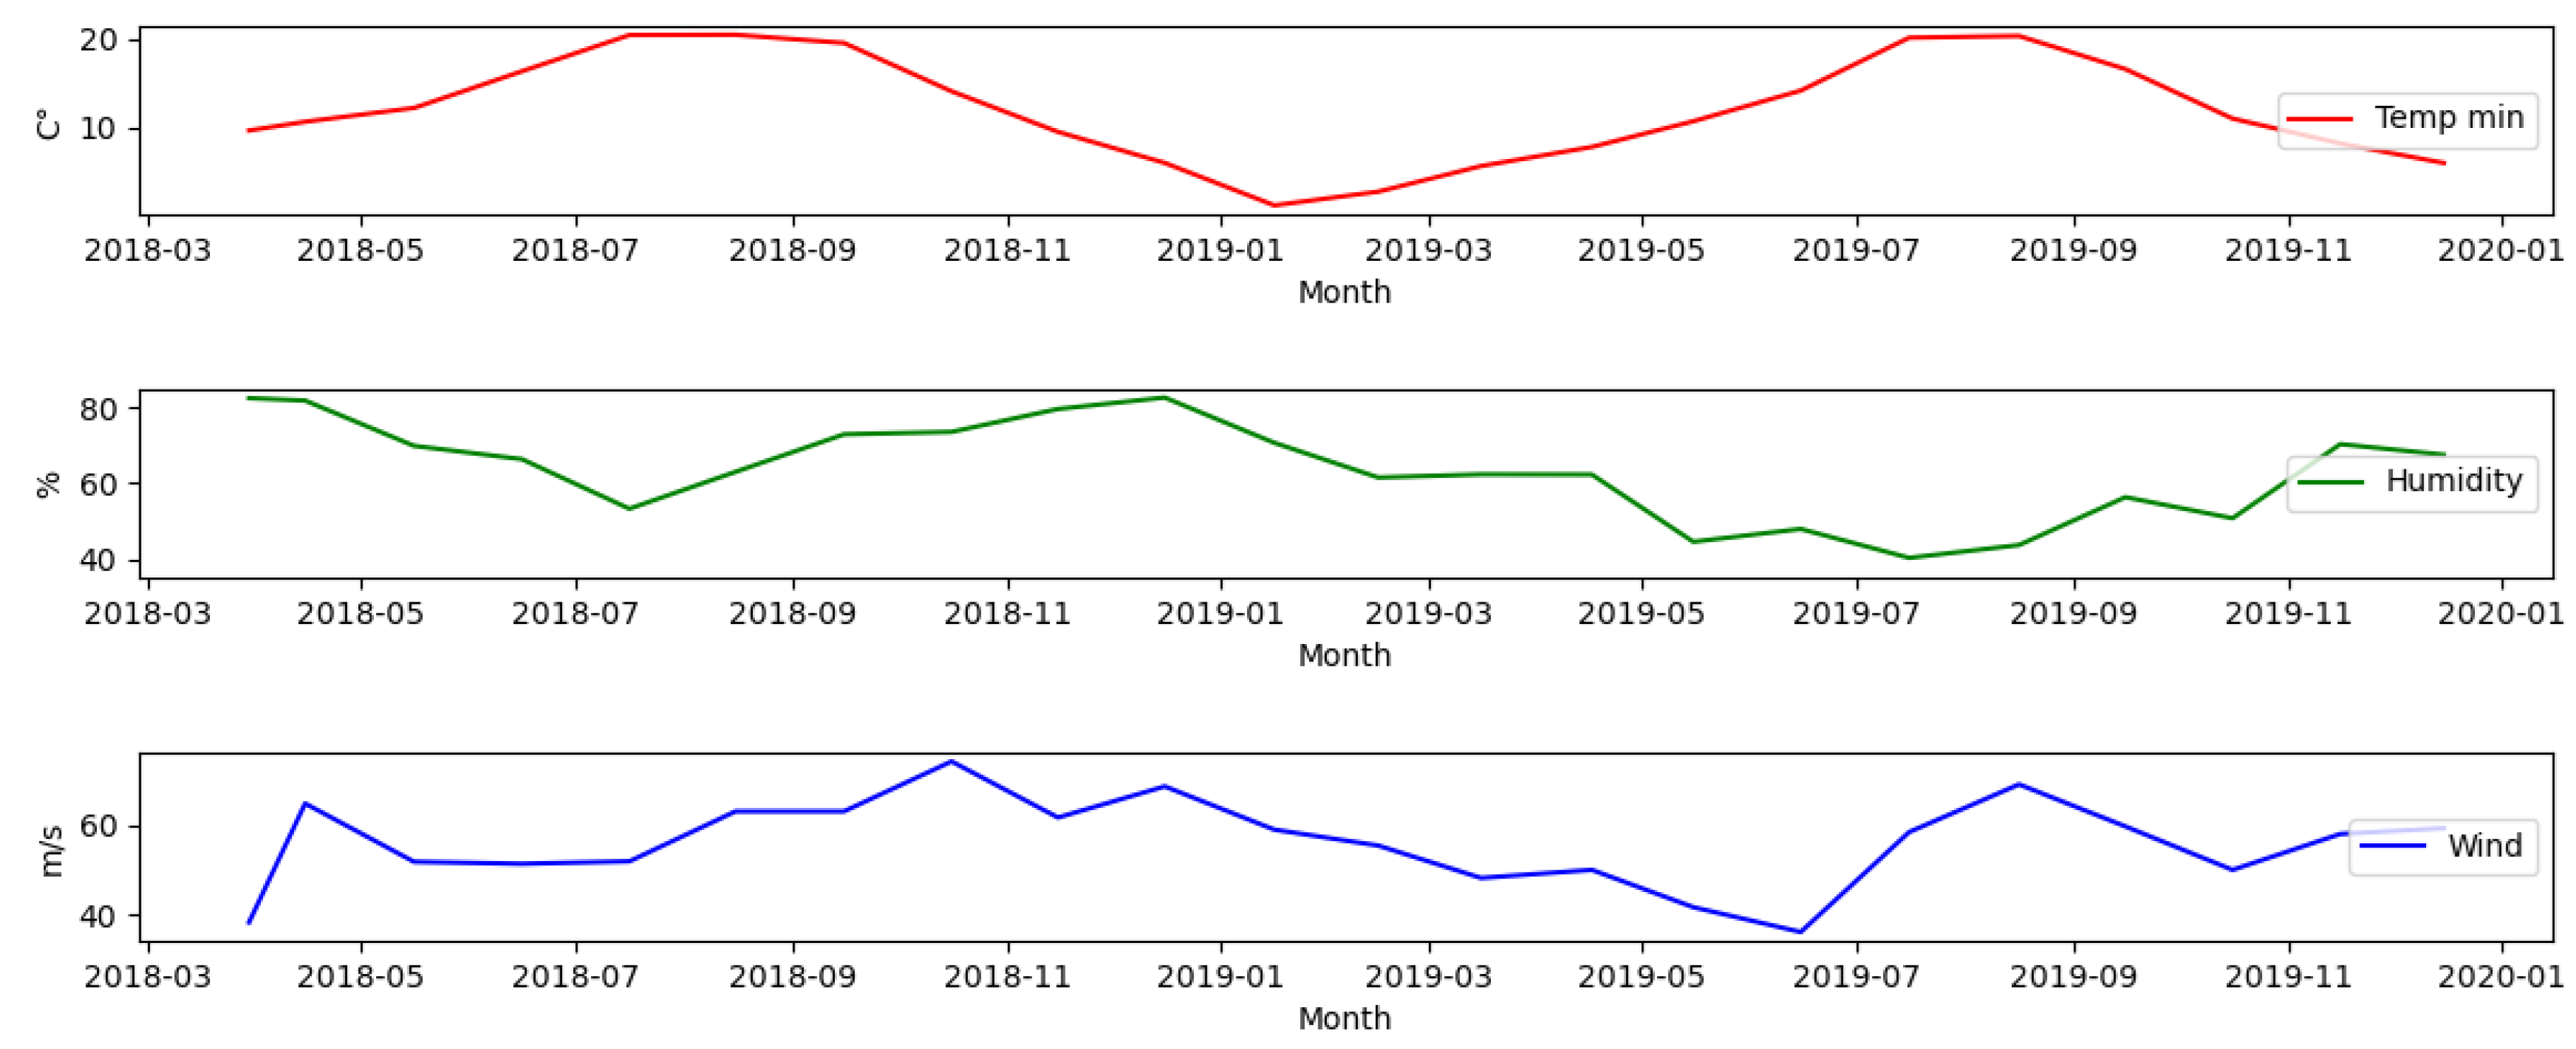
Figure 8.
Correlation matrix between input and output parameters.
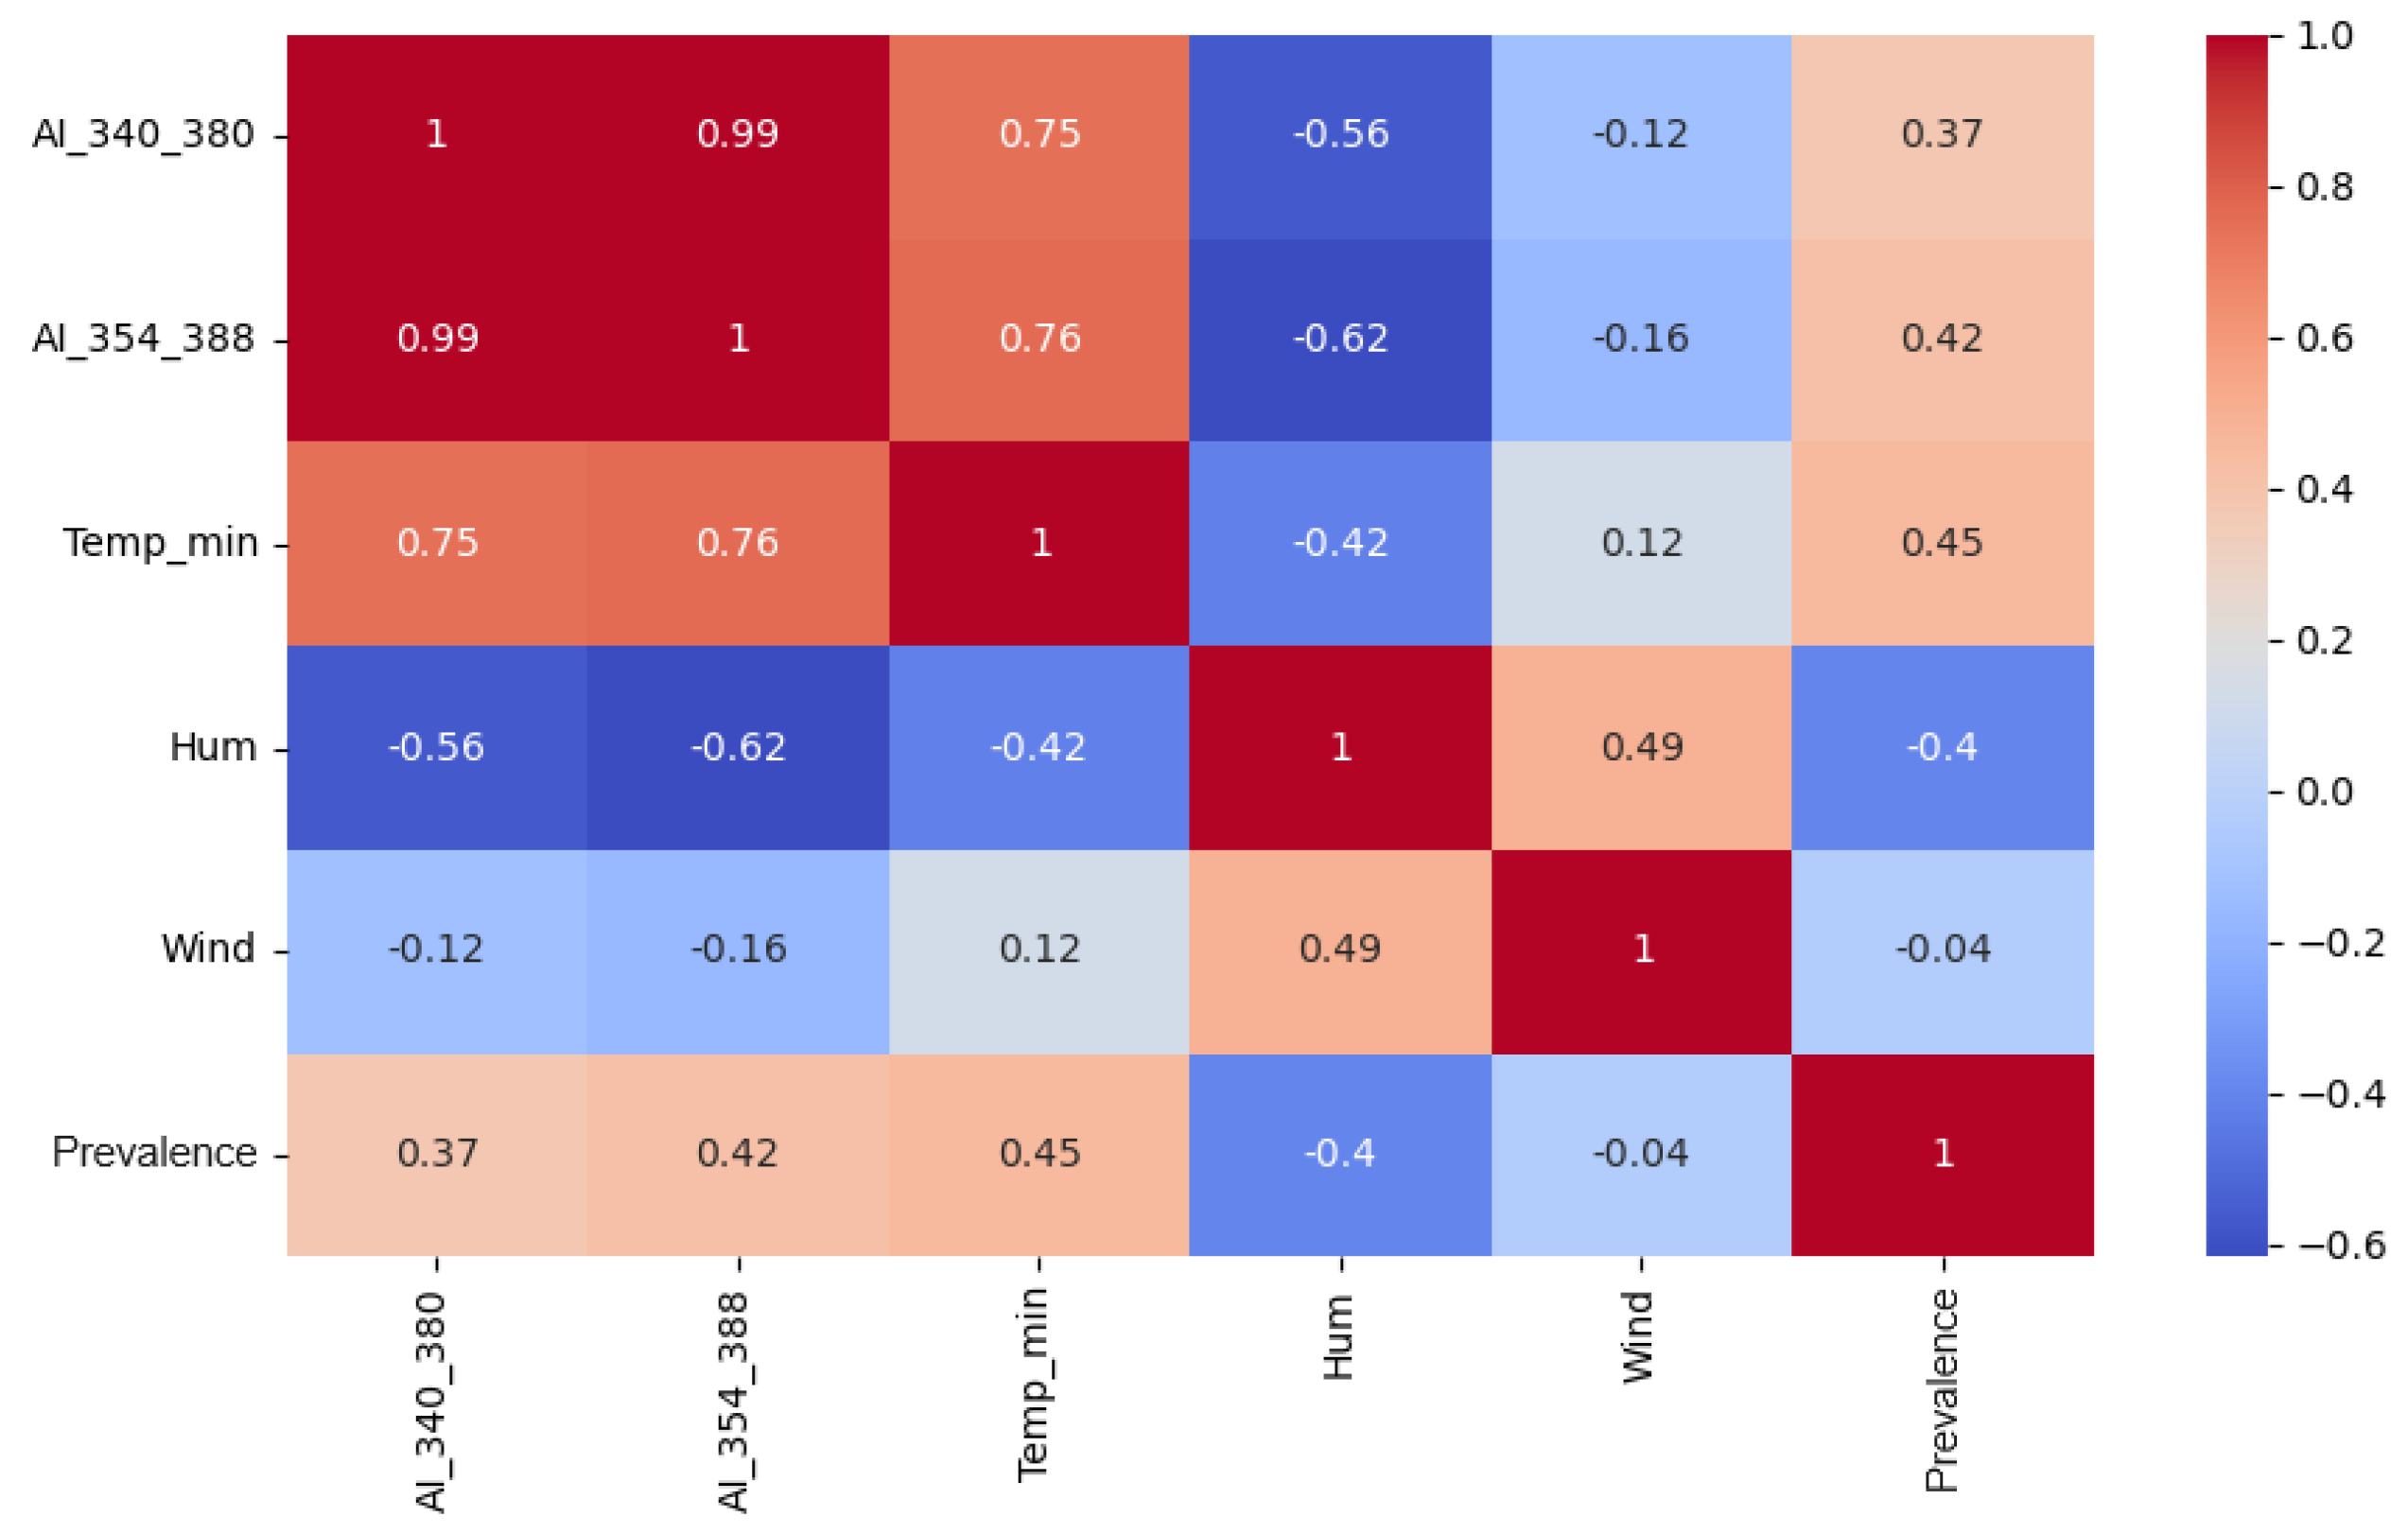
Figure 9.
Comparison of the prevalence rates of olive pollen allergy recorded in the Sig region with the values simulated using the SVR model.
Figure 9.
Comparison of the prevalence rates of olive pollen allergy recorded in the Sig region with the values simulated using the SVR model.
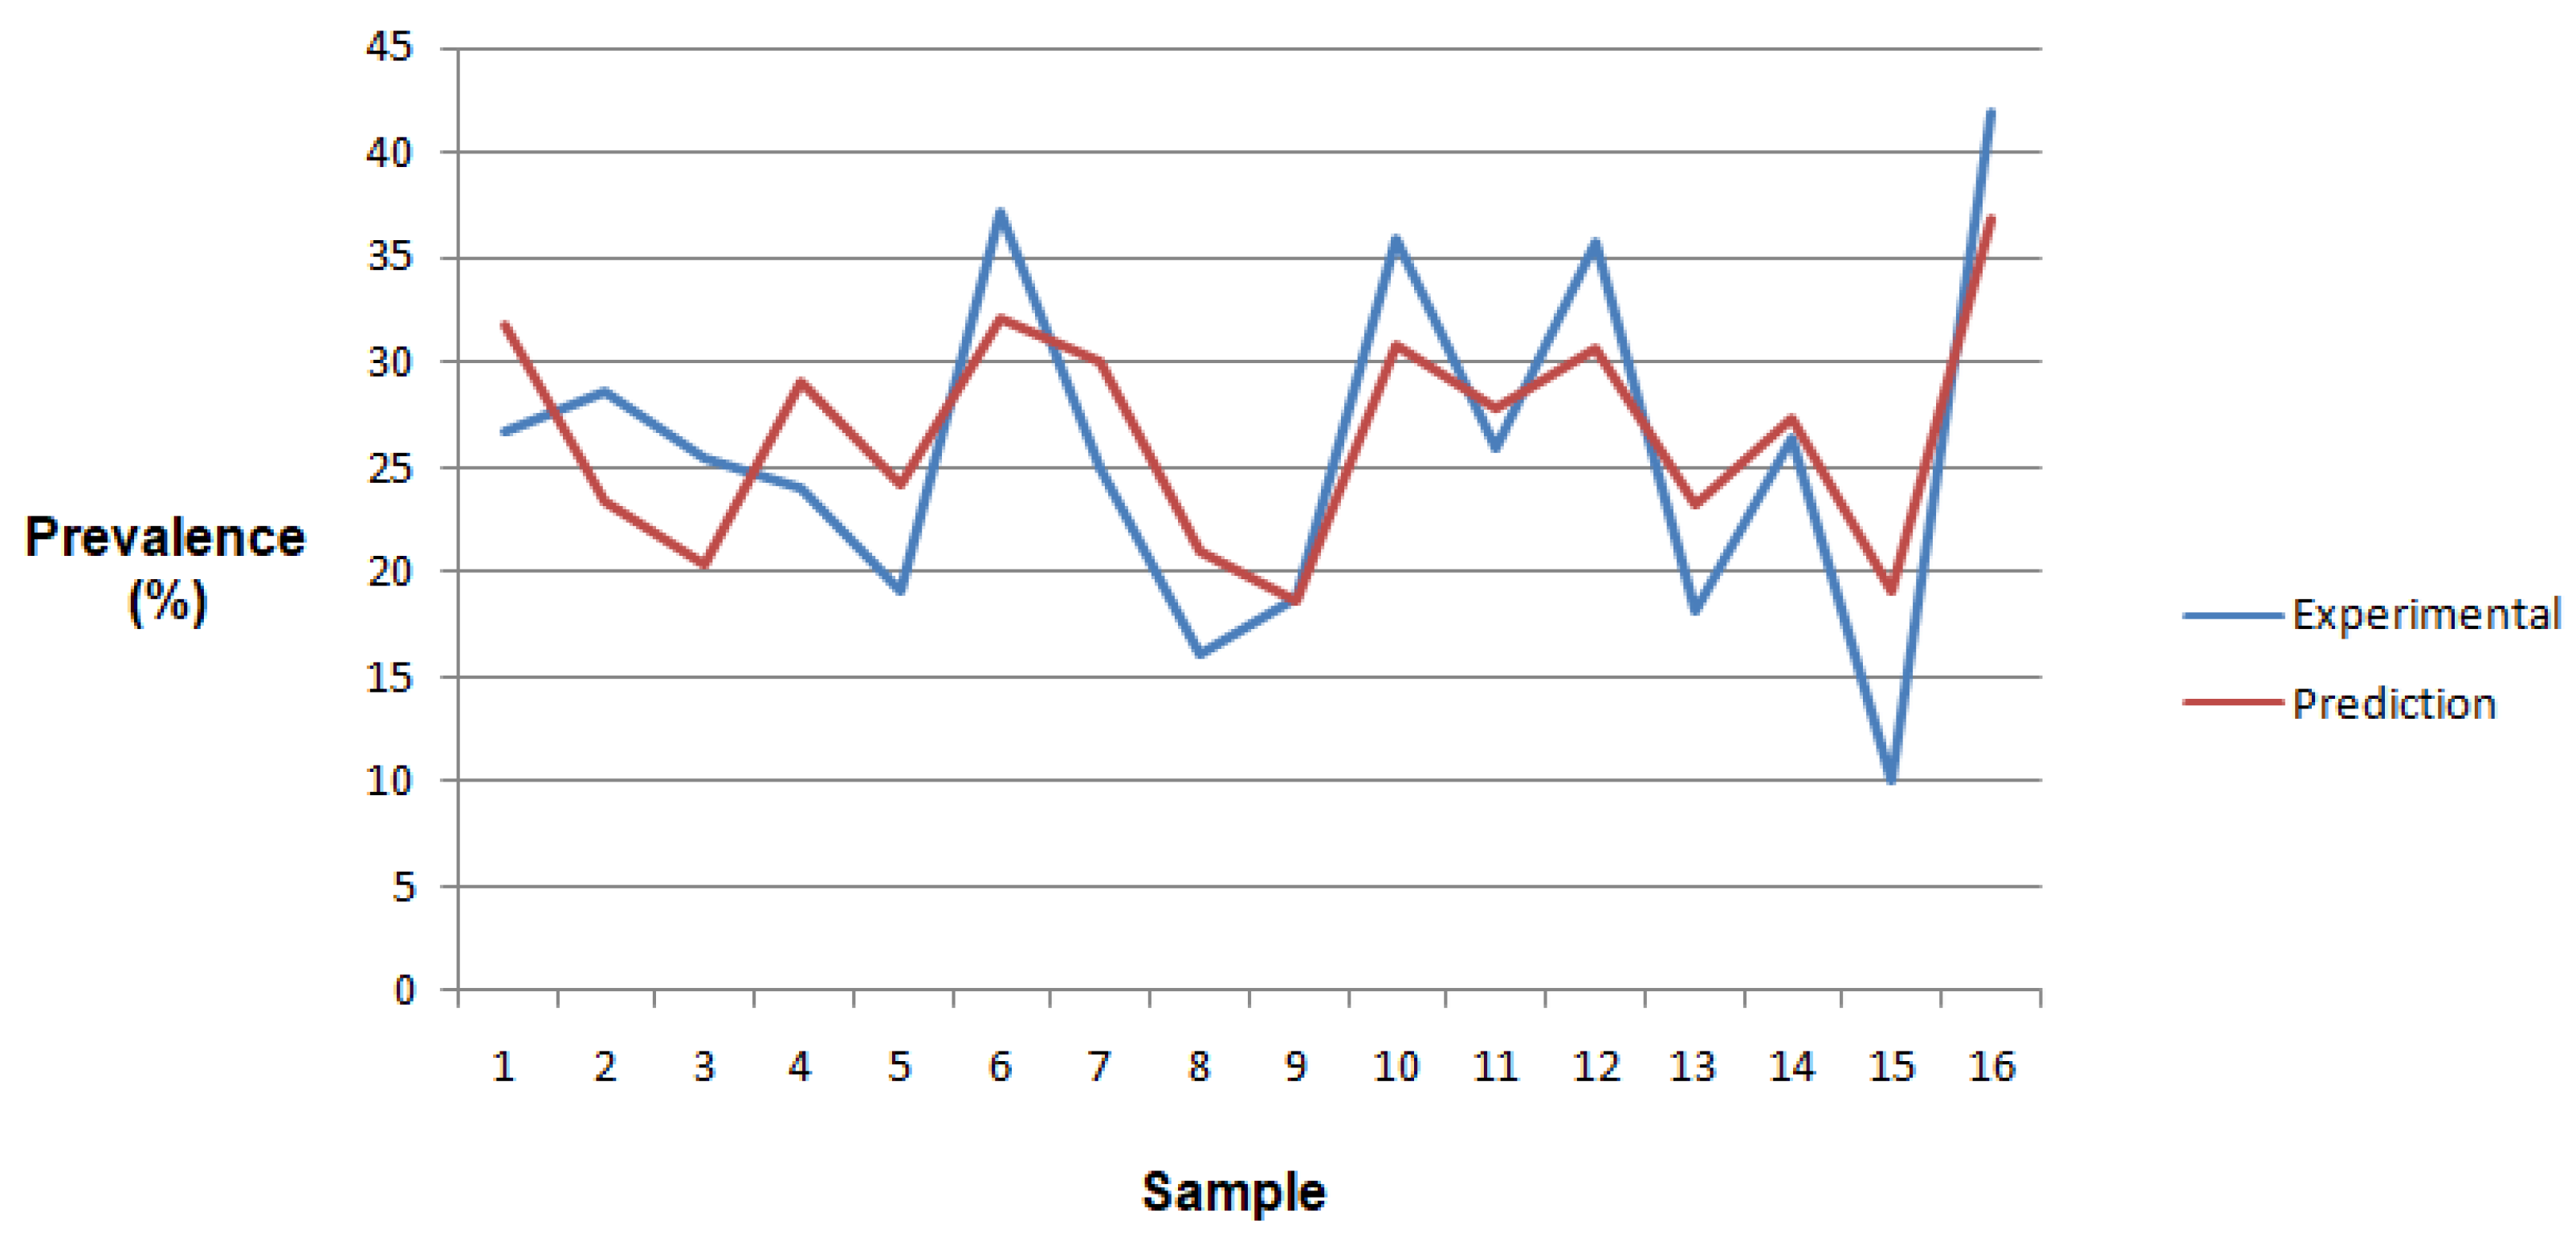

Table 1.
Performance of all the models.
| Model | R2 | RMSE | MAE |
|---|---|---|---|
| SVR | 0,92 | 2,27 | 0,66 |
| RFR | 0,85 | 3,2 | 2,66 |
| MLR | 0,54 | 5,58 | 4,65 |
Disclaimer/Publisher’s Note: The statements, opinions and data contained in all publications are solely those of the individual author(s) and contributor(s) and not of MDPI and/or the editor(s). MDPI and/or the editor(s) disclaim responsibility for any injury to people or property resulting from any ideas, methods, instructions or products referred to in the content. |
© 2026 by the authors. Licensee MDPI, Basel, Switzerland. This article is an open access article distributed under the terms and conditions of the Creative Commons Attribution (CC BY) license (http://creativecommons.org/licenses/by/4.0/).
Copyright: This open access article is published under a Creative Commons CC BY 4.0 license, which permit the free download, distribution, and reuse, provided that the author and preprint are cited in any reuse.


