

Submitted:
15 June 2026
Posted:
16 June 2026
You are already at the latest version
Abstract
Background/Objectives: Low-dose CT (LDCT) screening reduces lung cancer mortality, but implementation is limited by high false-positive rates, inter-reader variability, and increasing radiologist workload. Deep learning may address these challenges, yet there is limited consensus on how input dimensionality and model architecture should be selected for LDCT screening. We systematically review AI methods for LDCT lung cancer screening and organize the evidence around three workload-relevant questions: (i) when native-resolution 2D input benefits transformer-/CLIP-based models and how this depends on dataset size; (ii) whether 2D or 2.5D representations are preferable to full 3D for nodule detection and malignancy classification when computational cost and limited labeled screening data are considered; and (iii) whether slice-level attribution can guide radiologists. Methods: Following PRISMA, we searched PubMed, IEEE Xplore, Scopus, SPIE, and SpringerLink for studies published between January 2018 and November 2024. Records were screened using predefined eligibility criteria; 72 studies were included and synthesized thematically, with selected 2025--2026 studies discussed as post-cutoff context. Results: CNN-based detectors and classifiers approach expert-level performance, while imaging-plus-clinical fusion models improve risk stratification. Full 3D representations remain valuable for segmentation and volumetry, especially when volumetric continuity is central. However, transformer- and CLIP-type models generally require larger datasets and greater computational resources, making 2D or 2.5D inputs attractive for performance--stability--cost trade-offs under limited labeled data. Conclusions: In the data-limited, class-imbalanced screening setting, 2D/2.5D representations may provide a practical alternative to full 3D for malignancy classification, whereas full 3D remains better suited to spatially intensive tasks such as segmentation and volumetry. Native-resolution 2D input with large-scale pretraining is especially relevant for transformer-/CLIP-based models, and slice-level attribution represents an underused strategy for reducing radiologist workload. These design choices affect earlier cancer detection, false-positive reduction, unnecessary follow-up, and missed cancers.
Keywords:
lung cancer screening
; low-dose CT
; deep learning
; convolutional neural networks
; transformer
; foundation model
; 2.5D
; input dimensionality
; false-positive reduction
; Lung-RADS
1. Introduction
Lung cancer remains the leading cause of cancer-related death globally, and the overall 5-year survival rate is only around 20–25%, largely because most cases are diagnosed at an advanced stage [1]. The National Lung Screening Trial (NLST) established that annual screening of high-risk individuals with low-dose computed tomography (LDCT) reduces lung cancer mortality by about 20% relative to chest radiography; the trial randomized 53,454 participants, of whom 26,722 were assigned to the LDCT arm—an enrollment scale that remains the largest screening CT cohort and that shapes much of the data-availability discussion in this review [2]. The Dutch–Belgian NELSON trial subsequently reported, at ten years of follow-up, a 24% reduction in lung-cancer mortality among screened high-risk men (rate ratio 0.76), with subgroup data suggesting an even larger but less precisely estimated benefit in women (rate ratio 0.67) [3]; the trial’s earlier reports document its volume-based nodule-management protocol [4]. These landmark trials also exposed two persistent problems: a high false-positive rate (over 90% of nodules flagged in NLST were not cancer), and the workload that screening at population scale imposes on a finite radiology workforce.
In current practice, guidelines recommend annual LDCT for high-risk adults, though their eligibility criteria differ. The U.S. Preventive Services Task Force (2021) recommends screening adults aged 50–80 years with a ≥20 pack-year smoking history who currently smoke or quit within the past 15 years [5], whereas the American Cancer Society’s 2023 update broadened eligibility to adults aged 50–80 years who currently or formerly smoked and have a ≥20 pack-year history, removing the years-since-quitting requirement [6]. Each LDCT is read slice-by-slice—often hundreds of axial images (0.6–2.5 mm thick) per case—and findings are categorized using systems such as Lung-RADS. Benign processes (scars, lymph nodes, infections) can mimic cancer, and in NLST roughly a quarter of participants had a positive finding requiring follow-up, of which the large majority were not cancer. The sheer number of images requiring scrutiny, combined with the small fraction that represent early cancer, is itself a workload problem and a strong motivation for AI assistance.
Since 2018, convolutional neural networks (CNNs) have become central to medical image analysis, and groups have reported expert-level nodule detection and classification [7,8,9,10]. More recently, transformer architectures and large self-supervised “foundation models” have been explored for lung imaging [11,12,13]. Deep learning is now pervasive across oncologic imaging more broadly—spanning digital pathology [14], transfer-learning–based classification in other tumor types [15,16], cloud-deployed detection pipelines [17], and fusion detection–segmentation systems [18]—and prior reviews and representative lung-cancer studies summarize its growing role in radiology, lung cancer, lung digital pathology, and medical image segmentation [7,9,14,19,21,22,33]. Despite this progress, a practical gap remains: most work relies on supervised learning from relatively small labeled datasets, and there is little consensus on how to choose input dimensionality (2D, 2.5D, or 3D) and model family (CNN vs. transformer) for the data-limited, class-imbalanced screening setting.
Several reviews have surveyed AI in lung cancer broadly [7,19]. Unlike prior reviews that summarize applications across detection, diagnosis, and prognosis, the present review focuses specifically on the screening setting—LDCT in asymptomatic high-risk adults—and organizes the evidence around four design decisions that determine whether AI improves the screening benefit–harm balance: input dimensionality (2D/2.5D/3D), model family (CNN vs. transformer), foundation-model readiness, and reader-facing workflow integration. To our knowledge, no prior review ties these choices to the small-data, class-imbalanced statistics specific to screening or to concrete reductions in false positives, missed cancers, and radiologist reading burden.
This systematic review evaluates recent developments in AI for LDCT lung cancer screening and is organized around three guiding questions that connect directly to reducing radiologist workload:
- Q1 (native-resolution 2D for transformers/CLIP): When does native-resolution 2D LDCT input help train transformer- or CLIP-based models, and how does the answer depend on the size of the available dataset?
- Q2 (dimensionality for detection/classification): For nodule detection and malignancy classification, is 2D (or 2.5D) input more appropriate than full 3D once computational cost and the limited number of labeled screening cases are accounted for, given that the original NLST randomized 26,722 participants to the LDCT arm, the public TCIA imaging subset contains CT scans from 26,254 subjects, and only 1,060 lung cancers were reported in the LDCT arm?
- Q3 (slice-level attribution): Can identifying which slices contributed most to a prediction provide tangible, workload-reducing value to the radiologist?
We address these questions in the Discussion (Section 8) after synthesizing the evidence.
2. Materials and Methods
We performed a systematic literature search and review following the Preferred Reporting Items for Systematic Reviews and Meta-Analyses (PRISMA) 2020 guidelines [87]. We searched PubMed, IEEE Xplore, Scopus (Elsevier), SPIE Digital Library, and SpringerLink for publications from January 2018 through November 2024. Representative search terms included `lung cancer screening AND (deep learning OR machine learning)”, `lung nodule detection CNN”, `lung CT screening AI”, `transfer learning lung nodule”, and “(NLST OR NELSON) AND lung cancer screening AND (machine learning OR deep learning)”, adapted across databases. We restricted results to English-language studies published from 2018 onward.
The systematic database search was conducted through November 2024, which defines the corpus subjected to formal screening and counting. Because foundation models for radiology advanced rapidly after this cutoff, a small number of high-impact post-cutoff works were additionally tracked through citation chaining and expert knowledge; these are used only to contextualize the discussion and are flagged as post-cutoff additions rather than included in the systematic count. This review was not prospectively registered (e.g. in PROSPERO), which we note as a limitation. To prevent ambiguity, Table 1 states explicitly which reference classes contribute to the systematic count and which are cited for context only.
Records were pooled and de-duplicated; titles and abstracts were screened to remove clearly irrelevant articles. Full texts of the remaining records were assessed against inclusion criteria: a study had to (1) involve low-dose CT lung cancer screening images, and (2) develop, evaluate, or review an AI/ML technique for nodule detection, classification, segmentation, or risk prediction. Both original research and relevant reviews were eligible. Reference lists of key articles were hand-searched for additional studies. In total, 72 studies met the inclusion criteria and form the basis of the thematic synthesis. Beyond these, the reference list also cites landmark screening trials, background and methodological references, screening-guideline statements, and public data resources for context; eleven high-impact works published after the November 2024 search cutoff (foundation models and other 2025–2026 advances surveyed as forward-looking context in Section 7); and one forthcoming companion study (Section 4.6). Consistent with Table 1, these contextual, post-cutoff, and forthcoming references are not part of the systematic count of 72. The flow of records through identification, screening, eligibility, and inclusion is summarized in Figure 1.
Screening and data extraction were performed by the lead author (M.E.H.), with the senior author (F.P.) consulted to adjudicate uncertain inclusion decisions. For each included study we extracted: dataset(s) and cohort type, task (detection, classification, segmentation, or risk prediction), primary input dimensionality (2D/2.5D/3D), model family (CNN, transformer, or hybrid), reported performance metrics and operating points, and validation type (internal vs. external). Explicit eligibility criteria are summarized in Table 2. The database-specific search strategies, the PRISMA 2020 checklist, and a data-extraction sheet for representative included studies are provided as Supplementary Material (Table S1, Supplementary File S1, and Table S3, respectively).
Given the heterogeneity of endpoints and data, no meta-analysis was performed; findings were synthesized thematically (CNN-based detection, malignancy classification, risk prediction, input dimensionality, foundation models, and dataset/metric heterogeneity). To ground the dimensionality discussion in controlled evidence, we additionally summarize an empirical companion study by the present authors (Hoq et al., submitted) [20] that varies only input dimensionality and model family under a matched protocol; consistent with MDPI policy on unpublished data, this study is cited as a forthcoming work, is summarized for context only, and is not counted among the 72 included studies, and its primary data are not re-derived here.
Use of Generative Artificial Intelligence.
During manuscript preparation, the authors used a large language model only for superficial language editing, including grammar, spelling, punctuation, wording, and readability. No generative artificial intelligence tool was used to generate scientific content, formulate the research questions, design the search strategy, select or appraise studies, extract or analyze data, interpret results, create figures or tables, or draw conclusions. All manuscript content was reviewed, verified, and approved by the authors, who take full responsibility for the accuracy and integrity of the work.
3. Results: AI Across the LDCT Screening Workflow
3.1. Overview of Included Studies
Table 3 summarizes representative included studies grouped by task, spanning whole-scan risk prediction, nodule detection, malignancy classification, external validation, and (for post-cutoff context) foundation models. Performance is reported as stated in each primary source; values independently re-verified during preparation are flagged.
3.2. Structured Quality Appraisal
Because performance figures alone can be misleading without attention to study design, Table 4 provides a simplified appraisal of the representative studies along dimensions that matter for screening: external (independent) validation, use of a public dataset, patient-level data splitting, whether sensitivity/specificity (or FROC) is reported, whether calibration is reported, and relevance to the screening reading workflow. The pattern is informative: external validation and calibration reporting are the weakest dimensions across the field, which tempers the high AUCs reported on curated single-institution or diagnostic datasets and motivates the evaluation recommendations in Section 6 and Table 6.
3.3. Automated Nodule Detection
Computer vision algorithms, especially CNN-based models, now achieve excellent sensitivity for lung nodule detection on CT [36]. 2D CNNs on individual slices detect many nodules, but modern systems increasingly leverage 3D information [21]. In a landmark study, Ardila et al. developed a 3D CNN that analyzes whole LDCT volumes; trained on NLST data and evaluated on a held-out set of 6,716 NLST cases, it achieved an AUC of 0.944 for predicting cancer within one year, matching experienced radiologists and detecting some cancers they missed [21]. Single-scan risk models such as Sybil now forecast 1–6-year risk directly from one LDCT without manual annotation, validating across U.S. and Taiwanese cohorts [22].
Many groups report near-radiologist sensitivity while cutting false positives [26]. Liao et al.’s 3D “deep noisy-or” CNN achieved ≈85.6% recall at ∼4 false positives/scan; false-positive reduction approaches using 3D texture/edge features roughly halved baseline false positives [28], and multi-dimensional fusion networks combine 2D and 3D streams for the same purpose [29]. In a routine-clinical-population validation, readers aided by a deep-learning CAD system improved nodule sensitivity from 71.9% to 80.3% with only a small change in the false-positive rate (0.11 to 0.16 per scan) [34], supporting a second-reader role.
Likewise, a separate reader study found that AI-assisted reading improved detection sensitivity, particularly for non-solid nodules [30]. Two-stage pipelines (candidate proposal then false-positive discrimination) are common [37], and pyramid-input designs such as PiaNet reach 93.6% sensitivity at 1 false positive/scan for ground-glass nodules [27]. In practice, approved CADe software highlights suspicious regions for review; user-interface design is critical, since excess false marks erode trust, while precise detectors can reduce reading time by directing attention to a few regions. Comparable gains have been reported across related settings: deep detectors reduce false positives relative to classical machine-learning CAD [38], generalize to multi-lesion detection on chest radiographs [39,40], and have been implemented as modified 3D U-Nets for automated nodule detection [41] and even in preclinical micro-CT [42]. Transfer learning from large natural-image networks remains a common backbone [43], and deep models have been used to confidently reclassify benign nodules so as to curtail unnecessary follow-up [44].
3.4. Nodule Characterization and Malignancy Classification
AI can analyze nodule characteristics to distinguish likely cancers from benign nodules [45]. Causey et al.’s “NoduleX” CNN, trained on >1,000 LIDC-IDRI nodules, reported a nodule-level AUC of ∼0.99 for malignancy and ∼0.95 for nodule-vs-non-nodule discrimination [8]; the attention- and curriculum-based ProCAN reported 98.0% AUC and 95.3% accuracy on LIDC-IDRI [31]. Such near-ceiling figures, however, derive from highly curated datasets with biopsy- or surgery-confirmed ground truth, and real-world performance on small or indeterminate nodules is likely lower. Hybrid models combining CNN features with radiologist-defined features (margin sharpness, lobulation) have reported AUC ≈0.98 while remaining partly interpretable [32]. By assigning objective per-nodule risk scores, such tools could help separate the many benign nodules from the few that warrant work-up, but prospective validation of management impact is still needed. Related deep-learning efforts predict histologic subtype or metastatic potential from CT or PET [46,47], characterize PD-L1 status or immune phenotype [48,49], model longitudinal change with Siamese or recurrent architectures [50,51], improve diagnostic certainty for indeterminate nodules [52], and apply 3D capsule networks to malignancy prediction [53]. Radiomics-based machine learning further links CT phenotypes to prognosis and treatment response [54,55], and deep-learning image reconstruction can preserve nodule conspicuity at reduced dose [56]. More recent (2025) classification work, surveyed in Section 7, includes multitask Swin-transformer characterization of nodules [83] and sequential multi-instance learning across serial screening rounds [84].
3.5. Risk Prediction and Clinical Integration
Beyond individual nodules, AI can estimate overall lung cancer risk [23]. Gao et al.’s co-learning model fused LDCT images with clinical data elements, reaching AUC 0.88 internally and 0.91 on the external Vanderbilt dataset, outperforming imaging-only (0.86) and clinical-only (0.69) models [23]. Temporal models using serial scans stratify risk over time [57], and chest-radiograph models such as CXR-LC (AUC 0.75 vs 0.63 for CMS criteria) could identify high-risk individuals for CT referral [25]. In a screening program, AI risk scores could prioritize worklists and expedite high-risk patients; early real-world deployment, such as the UK study by Murchison et al., detected cancers missed in routine practice without excessive false positives [34], suggesting a “safety-net” role—though prospective validation and reader training remain essential. Since the search cutoff, risk modeling has advanced further (Section 7): 2025 models predict long-term risk from global lung features even in baseline-negative scans [80], with growing emphasis on independent external testing of single-scan risk models [81].
Figure 2 illustrates a generalized conceptual framework that operationalizes the three themes of this review. In this architecture, a quality-control module filters input imaging before it is processed by a self-supervised foundation model backbone. While this backbone can be implemented using either native-resolution 2D slices or full 3D volumetric streams—reflecting the active dimensionality debate in the literature—the core engine utilizes a patient embedding space to retrieve similar historical cancer or benign cases. It then returns a three-way decision (high risk / low risk / indeterminate) accompanied by an auto-generated, case-based explanation. This approach routes AI-flagged low-risk studies toward expedited reassurance and high-risk studies toward prioritized clinical action, aiming to simultaneously reduce false positives and false negatives. Within this broader design space, the authors’ own pipeline serves as one specific instantiation utilizing a 2D-based approach to capture high-resolution slice features.
4. Results: Input Dimensionality and Model Family
Three-dimensional analysis is natural for inherently 3D CT data, and many top-performing systems use 3D CNNs [21]. However, 3D introduces practical misalignments with radiology workflow and statistical challenges that bear directly on Q2.
4.1. Radiologist Reading Habits Versus 3D AI
Radiologists read slice-by-slice and integrate across slices mentally, whereas a 3D CNN may output a whole-volume score not tied to any slice. A bare “60% cancer risk” without localization is hard to act on or trust; useful AI should highlight the nodule, region, or slice driving a prediction. Per-nodule outputs and 3D Grad-CAM-style attributions help, but a fully volumetric workflow remains a paradigm shift not yet routine in practice.
4.2. Interpolation and Preprocessing
3D models often require isotropic voxels and fixed dimensions, so LDCT scans with varying slice thickness are resampled (e.g. mm), introducing smoothing/artifacts that can affect small nodules. To manage memory, developers may downsample or crop, risking missed lesions. This contrasts with the emerging argument that downsampling volumetric CT to low-fidelity 2D slices discards informative grayscale contrast, motivating attention to native-resolution input regardless of dimensionality [12,13].
4.3. Training Cost and Data Requirements
3D networks have far more parameters and need more data. This is problematic given scarce confirmed cancers: the CT arm of the landmark National Lung Screening Trial (NLST), for instance, yielded only 1,060 confirmed lung cancers among its 26,722 participants [2]. A 2D approach treats each slice or patch as a sample (tens of thousands of images), whereas 3D uses one sample per scan/nodule, drastically reducing effective sample size and risking overfitting. A practical compromise is the hybrid 2.5D / 2D–3D approach: wide-net 2D detection followed by limited 3D confirmation [29], balancing sensitivity, stability, and training efficiency.
4.4. Computational Burden
3D models may take 10–30 s per scan (longer on CPU), versus seconds for 2D, which can limit scalability in busy or resource-limited settings. Hardware/optimization advances help—e.g. Lung-CRNet performs 4D-CT registration in under a second [59], and deep networks now enable markerless tumor tracking on simulated 4D-CT [60]—but integration questions (dedicated workstation vs. cloud) remain.
4.5. Segmentation: A Task Where Full 3D Retains Its Advantage
Although classification in the data-limited regime favors 2D/2.5D, segmentation is the task where volumetric context is most valuable and where 3D networks remain the norm, providing an important boundary condition for our Q2 position. Auto-segmentation has advanced rapidly [61], with edge-aware and multidimensional 3D CNNs [62,63], multi-scale deeply supervised 3D U-Nets for lung-tumor delineation [64], and two-stage multitask U-Nets that couple nodule segmentation with malignancy prediction [65]. Transformer-augmented U-Nets increasingly compete with or surpass pure CNNs by modeling long-range dependencies [66,67,68,69], and self-supervised pretraining can reduce the annotation burden that volumetric models otherwise demand [70]. This contrast reinforces our central point: dimensionality should be matched to the task, with full 3D reserved for spatially intensive problems such as segmentation and volumetry, and 2D/2.5D preferred for class-imbalanced screening classification.
4.6. Illustrative Case Study: A Controlled Resource–Performance Comparison (Companion Preprint)
Because this companion study is a preprint that has not yet completed peer review, its results are presented only as an illustrative example and are not used as primary evidence in the systematic synthesis. To isolate input dimensionality from architectural confounds, we summarize a companion study by the present authors (Hoq et al., 2026) [20], available as a preprint and included here for context only (Section 2). That study fixes the training protocol (20 epochs, weighted binary cross-entropy, matched optimization) and varies only input dimensionality—2D (central slice), 2.5D (three orthogonal slices), and 3D (sub-volume)—across a CNN and a Vision Transformer (ViT) on a leakage-free NLST cohort (; patient-level splits of 1,426/254/297) prepared with a lung-focused quality-control pipeline [58]; LIDC-IDRI provided supporting weak labels.
As summarized in Table 5, the 2.5D CNN achieved the best discrimination (ROC-AUC 0.682, 95% CI [0.546, 0.799]) with stable operating behavior. The 2D CNN was overly conservative; the 3D CNN showed threshold instability (sensitivity 0.05–0.50 between default and validation thresholds). Transformers required ≈3× the GPU memory and frequently collapsed: the 3D ViT produced zero sensitivity (all-negative) despite ROC-AUC 0.589, and the 2.5D ViT showed extreme threshold sensitivity. The pattern reproduced on LIDC-IDRI, where several higher-capacity models collapsed to all-positive behavior (specificity 0) despite moderate AUC. Two lessons recur in this review: ROC-AUC alone can mask clinical unusability (acceptable ranking yet extreme sensitivity–specificity imbalance), and input dimensionality governs not only performance but failure mode, with full 3D and transformer configurations most prone to degeneracy in the data-limited, class-imbalanced screening regime.
4.7. Native-Resolution 2D Input and Transformer Data Efficiency
ViTs lack the inductive biases of CNNs (locality, translation equivariance) and need large-scale data [71]. In screening applications, this data dependency frequently manifests as the training instability and representation collapse illustrated in Section 4.6. Two lines of evidence indicate when native-resolution 2D input helps a transformer-/CLIP-based model. First, self-supervised 2D foundation models shift the representation burden off scarce labels: a feasibility study with native-resolution 2D RAD-DINO embeddings achieved strong classification because the heavy lifting occurs during large-scale pretraining [12]. Second, recent radiology foundation-model work argues that preserving native resolution (rather than downsampling to low-fidelity slices), with large-scale pretraining, yields strong, data-efficient performance and improves long-horizon risk prediction [13]. Task-agnostic 3D pretraining is an alternative route to data efficiency when ample unlabeled volumes exist [72], but does not negate the central point for small labeled data: native-resolution 2D plus pretraining is the more reliable recipe for transformer/CLIP models, with the benefit shrinking as the labeled dataset grows.
4.8. Slice-Level Attribution as a Workload-Reducing Aid
Because reading is slice-by-slice, the most actionable output beyond a per-case score is an indication of which slices and regions drove the prediction. Per-slice/per-region attribution (attention, Grad-CAM-style saliency, slice-importance scoring) turns an opaque output into a triage aid, e.g., directing the reader to the few slices that matter reduces images requiring close scrutiny and shortens reading time. The 2.5D paradigm aligns naturally with this, since its contributions are attributable to identifiable slices, whereas volumetric models require post-hoc reconstruction. Current interpretability work emphasizes nodule-level heatmaps over reader-facing slice triage [73], which remains a concrete gap. Reliable slice-level attribution also requires preserving per-case predictions [20].
5. Results: Foundation Models
Foundation models—large, broadly pretrained models adaptable to many tasks—are maturing in medical imaging but face several limitations relevant to screening [11].
5.1. Domain Mismatch and Representation
General vision models trained on natural images transfer imperfectly to grayscale CT; domain-specific pretraining helps. For example, MIS-FM, pretrained on 110,000 unlabeled 3D CT scans, outperformed prior segmentation methods after fine-tuning [74], and CT-specific self-supervised approaches—native-resolution 2D [12] and task-agnostic 3D pretraining [72]—target this gap. Cross-domain experience with transfer learning in other tumor types underscores both the promise and the fragility of borrowed representations [15,16].
5.2. Data and Computational Requirements
Hierarchical transformers (e.g. Swin) have tens of millions of parameters [75], and the scarcity of labeled screening data pushes the field toward self-supervision; contrastive transformers for nodule detection, for instance, improve sparse-label performance [35]. Because no single center holds enough labeled cancers, distributed and federated training across institutions is increasingly proposed to assemble the needed scale without pooling patient data [76], and cloud-based deployment can offload inference cost [17].
5.3. Interpretability and Customization
Large models are less interpretable than task-specific networks, and fine-tuning risks catastrophic forgetting; explainability for screening therefore remains an active need [73].
5.4. Current Performance and Examples
No foundation model has clearly displaced specialized CNNs across all lung tasks, though transformer skip-connection designs improve segmentation [66]. Within the formal search window, cross-domain deep-learning pipelines (e.g., for chest-radiograph triage during the COVID-19 pandemic) demonstrate how rapidly such systems can be assembled and validated when data are available [77]. While these baseline architectures show strong promise, the trajectory has shifted toward specialized radiology and multimodal foundation models optimized specifically for screening workflows; these post-cutoff advancements and their data-efficient gains are analyzed in detail in Section 7.
5.5. Multi-Modality and Few-Shot Adaptation
6. Results: Dataset and Evaluation Heterogeneity
A major obstacle to assessing progress is heterogeneity in datasets and metrics [33]. Public datasets differ substantially in clinical utility: for instance, while the widely used LIDC-IDRI dataset is fully accessible via The Cancer Imaging Archive (TCIA) [79], it represents an older diagnostic cohort whose acquisition parameters do not reflect the spatial resolution and capabilities of modern low-dose CT scanners. Meanwhile, NLST has a limited public release, and the Kaggle DSB 2017 dataset lacked granular annotations. Few studies test on independent external data; Jacobs et al. found top algorithms reached AUC 0.877 to 0.902 versus radiologists’ 0.917, which is close but does not significantly exceed human readers [33]. Ground-truth definitions vary, such as detailed multi-reader annotation versus confirmed-cancer labels, as do operating points, making comparison difficult without common FROC analysis. Metric definitions, specifically patient- versus nodule-level sensitivity, are not interchangeable, and at a realistic 1 to 2% prevalence even 95% sensitivity with 80% specificity yields more false positives than true positives. As the companion analysis underscores, reporting ROC-AUC without operating-point behavior can hide degenerate collapse [20]. Ultimately, a modern benchmark explicitly linking detection to clinical outcomes in a contemporary screening cohort is still needed; models tuned on older cohorts also generalize imperfectly to modern European protocols like NELSON-type populations. Encouragingly, recent (2025) studies increasingly report independent external validation, including of commercially available detectors in new national screening cohorts [85], and updated European recommendations now explicitly call for deep-learning-assisted nodule detection and growth assessment [86].
7. Recent Developments (2025–2026)
The systematic search closed in November 2024. Because the field has moved quickly since, we summarize here, strictly as forward-looking context outside the systematic count (Table 1), several 2025–2026 studies that reinforce the conclusions of this review.
Risk prediction has extended beyond visible nodules. ScreenLungNet combined multiple-nodule and global lung-parenchyma features to predict three-year lung-cancer risk from a single LDCT (AUC 0.93–0.94) and retained useful accuracy even in baseline-negative participants (AUC 0.87), addressing the interval and post-screening cancers that lack a visible baseline nodule [80]. In parallel, independent external testing of single-scan deep-learning risk models on LDCT has begun to close the external-validation gap emphasized in Section 6 [81].
Foundation and transformer models continued to mature in directions consistent with Q1. A multimodal, multitask foundation model trained for lung cancer screening reported coverage across detection, classification, and risk tasks from a single pretrained backbone [82], while a multitask Swin transformer jointly classified and characterized pulmonary nodules [83]. These results reinforce our position that large-scale pretraining, rather than raw architectural capacity, is what makes transformers viable in the data-limited screening regime. Sequential multi-instance learning across serial screening rounds further exploited longitudinal structure for classification [84].
Finally, the evidence base has shifted toward external validation and clinical translation. External validation of commercially available deep-learning nodule detection in a Japanese LDCT screening population [85], together with updated European practice recommendations that now explicitly call for deep-learning–assisted nodule detection and volumetric growth assessment [86], signals movement from algorithm development toward deployment—while reaffirming, as this review argues, that prospective validation and standardized, operating-point–aware evaluation remain the principal bottlenecks.
8. Discussion
We answer the three guiding questions, each framed by the goal of reducing radiologist workload, then address real-world integration and the limitations of this review.
8.1. Q1: Native-Resolution 2D for Transformer/CLIP Models Is Helpful, Conditional on Dataset Size
The evidence supports a qualified “yes.” Because transformers lack CNN inductive biases and are data-hungry [71], training them—especially in 3D—on the small labeled cohorts typical of screening tends to be unstable (Table 5) [20]. Native-resolution 2D input becomes advantageous when paired with large-scale self-supervised or pretrained representations that move the data burden off scarce labels [12,13]. The benefit is largest when labeled data are modest and shrinks as the dataset grows; for the small-to-moderate datasets characterizing most screening research, native-resolution 2D plus pretraining is the more dependable recipe.
8.2. Q2: For Detection and Classification, 2D/2.5D Is the Better Trade-Off than Full 3D in the Screening Regime
The data-availability argument is decisive: with even NLST offering only ∼1,000 cancers among ∼26,000 CT-arm participants [2], 3D models that consume one sample per scan are starved of examples, whereas 2D/2.5D multiply effective training data by treating slices as samples (Section 4.3). This is corroborated by published work in which hybrid 2D–3D pipelines capture most of the benefit of volumetric context without the full 3D penalty [29]. Consistent with this published evidence—and offered only as an illustration, not as primary evidence—our companion comparison found the 2.5D CNN best with stable behavior, the 3D CNN threshold-unstable, and transformer/3D configurations prone to collapse, all at higher GPU cost for volumetric/ViT variants [20]. The caveat is task-dependence: full 3D remains preferable for spatially intensive tasks such as segmentation and volumetry. For classification in class-imbalanced screening, 2D and especially 2.5D are the more reliable defaults.
8.3. Q3: Slice-Level Attribution Offers Substantial, Underexploited Value
Because reading is slice-by-slice, slice-level attribution is the most direct route by which AI reduces workload—turning a per-case score into a triage signal that points the reader to the few slices that matter (Section 4.8). The 2.5D paradigm is naturally suited to this; volumetric models require post-hoc reconstruction. Current work emphasizes nodule-level heatmaps over reader-facing slice triage [73], leaving a tractable, high-value gap: standardized, validated slice-level attribution presented inside the PACS reading interface would convert model accuracy into measurable workflow efficiency.
8.4. Real-World Integration Challenges
Translation requires regulatory clearance (which is often more straightforward for narrow CADe tasks than holistic risk prediction), seamless PACS/DICOM integration with real-time performance, and human-factors design so that AI marks assist rather than distract the clinical reader. These practical hurdles are closely mirrored by broader systemic concerns; medico-legal responsibility, reimbursement pathways, out-of-distribution detection, equity monitoring across demographic subgroups, and patient transparency all remain substantial barriers to routine deployment. To address these multi-faceted requirements systematically, emerging frameworks like the FUTURE-AI international consensus guidelines provide a structured blueprint for achieving trustworthy and clinically deployable healthcare AI [88]. Ultimately, a phased deployment, where early adopters collect prospective clinical impact data alongside professional-society guidance as evidence accrues, represents the most viable path forward.
8.5. Clinical Implications for LDCT Lung Cancer Screening
Translating these findings into screening practice suggests several concrete implications. First, AI for screening should not be optimized for ROC-AUC alone; in a population with ∼1–2% cancer prevalence, the operationally decisive endpoints are reductions in unnecessary recalls (false positives) and in missed cancers (false negatives), so calibration and operating-point behavior must be reported and optimized. Second, 2D/2.5D models—being lighter and more stable in the data-limited regime—may be more readily deployable in screening clinics with limited compute, widening equitable access. Third, slice-level attribution aligned with how radiologists read could reduce reading burden by guiding the reader to the few relevant slices, a tractable efficiency gain. Fourth, AI outputs should be integrated with established decision structures—Lung-RADS categorization, PACS/DICOM workflow, and multidisciplinary management pathways—rather than presented in isolation. Finally, prospective, multi-center validation that measures management impact (time-to-read, recall rates, stage shift) is needed before clinical adoption; current evidence, while promising, is largely retrospective.
8.6. Limitations of this Review
The systematic search closed in November 2024; high-impact 2025–2026 developments are surveyed separately as flagged, post-cutoff context (Section 7) and are not part of the systematic count, but a fully updated systematic search may surface additional studies. The review was not prospectively registered, and English-only inclusion may introduce selection bias. Because screening and data extraction were performed by one primary reviewer with senior-author adjudication, selection bias in study inclusion cannot be fully excluded. Heterogeneity of endpoints precluded meta-analysis, so synthesis is narrative. Finally, the companion empirical study is the authors’ own and is not yet peer-reviewed; it is cited as forthcoming and used only to illustrate, not to establish, the dimensionality argument.
9. Conclusions and Future Directions
AI can augment radiologist performance across LDCT screening: CNN detectors reach high sensitivity for small nodules, attention-based and fusion classifiers assess malignancy on par with experts, and imaging-plus-clinical risk models refine patient selection, all enabled by public resources such as LIDC-IDRI and NLST [79]. Our synthesis reaches three positions. First, native-resolution 2D input is a dependable basis for transformer-/CLIP-based models when labeled data are limited and large-scale pretraining is available, conditional on dataset size. Second, for nodule detection and malignancy classification in the data-limited, class-imbalanced screening regime, 2D and especially 2.5D inputs may offer a more favorable performance–stability–cost trade-off than full 3D, which retains its advantage for segmentation and volumetry. Third, slice-level attribution—aligned with the 2.5D paradigm and with how radiologists read—is an underexploited, tractable route to reducing reading burden. Future work should prioritize prospective multi-center validation, standardized evaluation that reports operating-point behavior alongside ROC-AUC, and reader-facing slice-level interpretability integrated into clinical workflow, so that algorithmic accuracy translates into earlier detection, fewer unnecessary procedures, and a lighter load on radiologists. Table 6 summarizes the principal gaps and a recommended research agenda.
Supplementary Materials
The following supporting information can be downloaded at the website of this paper posted on Preprints.org. Table S1: database-specific search strategies for PubMed, IEEE Xplore, Scopus, SPIE Digital Library, and SpringerLink; Supplementary File S1: completed PRISMA 2020 checklist mapped to manuscript locations; Table S2: extended structured quality appraisal of representative studies anchoring the synthesis (extending Table 4); Table S3: data-extraction sheet for representative included studies (dataset, cohort type, task, input dimensionality, model family, reported performance, and validation type).
Author Contributions
Conceptualization, M.E.H. and F.P.; methodology, M.E.H. and F.P.; investigation (literature search, study selection, data extraction), M.E.H.; writing—original draft preparation, M.E.H.; writing—review and editing, F.P.; visualization, M.E.H.; supervision, F.P. All authors have read and agreed to the published version of the manuscript.
Funding
This research received no external funding.
Institutional Review Board Statement
Not applicable. This is a review of previously published literature and did not involve new studies on humans or animals.
Informed Consent Statement
Not applicable.
Data Availability Statement
No new data were created in this study. The public datasets discussed (e.g. NLST, LIDC-IDRI) are available via The Cancer Imaging Archive (TCIA, https://www.cancerimagingarchive.net).
Acknowledgments
The authors thank colleagues at the Department of Biomedical Informatics, UAMS, for helpful discussions.
Conflicts of Interest
The authors declare no conflict of interest.
Abbreviations
The following abbreviations are used in this manuscript:
| ACS | American Cancer Society |
| AI | Artificial Intelligence |
| AUC | Area Under the (ROC) Curve |
| CADe | Computer-Aided Detection |
| CADx | Computer-Aided Diagnosis |
| CDE | Clinical Data Element |
| CNN | Convolutional Neural Network |
| CT | Computed Tomography |
| CXR | Chest X-Ray |
| FROC | Free-Response Receiver Operating Characteristic |
| GGO | Ground-Glass Opacity |
| LDCT | Low-Dose Computed Tomography |
| LIDC-IDRI | Lung Image Database Consortium and Image Database Resource Initiative |
| NELSON | Nederlands–Leuvens Longkanker Screenings Onderzoek |
| NLST | National Lung Screening Trial |
| PACS | Picture Archiving and Communication System |
| PR-AUC | Precision–Recall Area Under the Curve |
| ROC | Receiver Operating Characteristic |
| TCIA | The Cancer Imaging Archive |
| USPSTF | U.S. Preventive Services Task Force |
| ViT | Vision Transformer |
References
- Kramer, B.S.; Berg, C.D.; Aberle, D.R.; Prorok, P.C. Lung Cancer Screening with Low-Dose Helical CT: Results from the National Lung Screening Trial (NLST). J. Med. Screen. 2011, 18, 109–111. [Google Scholar] [CrossRef] [PubMed]
- National Lung Screening Trial Research Team; Aberle, D.R.; Adams, A.M.; Berg, C.D.; Black, W.C.; Clapp, J.D.; Fagerstrom, R.M.; Gareen, I.F.; Gatsonis, C.; Marcus, P.M.; Sicks, J.D. Reduced Lung-Cancer Mortality with Low-Dose Computed Tomographic Screening. N. Engl. J. Med. 2011, 365, 395–409. [Google Scholar] [CrossRef] [PubMed]
- de Koning, H.J.; van der Aalst, C.M.; de Jong, P.A.; Scholten, E.T.; Nackaerts, K.; Heuvelmans, M.A.; Lammers, J.J.; Weenink, C.; Yousaf-Khan, U.; Horeweg, N.; et al. Reduced Lung-Cancer Mortality with Volume CT Screening in a Randomized Trial. N. Engl. J. Med. 2020, 382, 503–513. [Google Scholar] [CrossRef] [PubMed]
- Zhao, Y.R.; Xie, X.; de Koning, H.J.; Mali, W.P.; Vliegenthart, R.; Oudkerk, M. NELSON Lung Cancer Screening Study. Cancer Imaging 2011, 11, S79–S84. [Google Scholar] [CrossRef] [PubMed]
- US Preventive Services Task Force; Krist, A.H.; Davidson, K.W.; Mangione, C.M.; Barry, M.J.; Cabana, M.; Caughey, A.B.; Davis, E.M.; Donahue, K.E.; Doubeni, C.A.; et al. Screening for Lung Cancer: US Preventive Services Task Force Recommendation Statement. JAMA 2021, 325, 962–970. [Google Scholar] [CrossRef] [PubMed]
- Wolf, A.M.D.; Oeffinger, K.C.; Shih, T.Y.; Walter, L.C.; Church, T.R.; Fontham, E.T.H.; Elkin, E.B.; Etzioni, R.D.; Guerra, C.E.; Perkins, R.B.; et al. Screening for Lung Cancer: 2023 Guideline Update from the American Cancer Society. CA Cancer J. Clin. 2024, 74, 50–81. [Google Scholar] [CrossRef] [PubMed]
- Hosny, A.; Parmar, C.; Quackenbush, J.; Schwartz, L.; Aerts, H. Artificial Intelligence in Radiology. Nat. Rev. Cancer 2018, 18, 500–510. [Google Scholar] [CrossRef] [PubMed]
- Causey, J.; Zhang, J.; Ma, S.; et al. Highly Accurate Model for Prediction of Lung Nodule Malignancy with CT Scans. Sci. Rep. 2018, 8, 9286. [Google Scholar] [CrossRef] [PubMed]
- Hesamian, M.; Jia, W.; He, X.; Kennedy, P. Deep Learning Techniques for Medical Image Segmentation: Achievements and Challenges. J. Digit. Imaging 2019, 32, 582–596. [Google Scholar] [CrossRef] [PubMed]
- Simonyan, K.; Zisserman, A. Very Deep Convolutional Networks for Large-Scale Image Recognition. arXiv 2015, arXiv:1409.1556. [Google Scholar] [CrossRef]
- Zhang, S.; Metaxas, D. On the Challenges and Perspectives of Foundation Models for Medical Image Analysis. Med. Image Anal. 2023, 91, 102996. [Google Scholar] [CrossRef]
- Hoq, M.E.; Tarbox, L.; Johann, D., Jr.; Larson-Prior, L.; Prior, F. Harnessing Native-Resolution 2D Embeddings for Lung Cancer Classification: A Feasibility Study with the RAD-DINO Self-Supervised Foundation Model. J. Imaging Inform. Med. 2025. [Google Scholar] [CrossRef] [PubMed]
- Agrawal, K.K.; Liu, L.; Lian, L.; Nercessian, M.; Harguindeguy, N.; Wu, Y.; Mikhael, P.; Lin, G.; Sequist, L.V.; Fintelmann, F.; et al. Pillar-0: A New Frontier for Radiology Foundation Models. arXiv 2025, arXiv:2511.17803. [Google Scholar] [CrossRef]
- Viswanathan, V.S.; Toro, P.; Corredor, G.; Mukhopadhyay, S.; Madabhushi, A. The State of the Art for Artificial Intelligence in Lung Digital Pathology. J. Pathol. 2022, 257, 413–429. [Google Scholar] [CrossRef] [PubMed]
- Rahman, A.; Alqahtani, A.; Aldhafferi, N.; et al. Histopathologic Oral Cancer Prediction Using Oral Squamous Cell Carcinoma Biopsy Empowered with Transfer Learning. Sensors 2022, 22, 3833. [Google Scholar] [CrossRef] [PubMed]
- Anaya-Isaza, A.; Mera-Jiménez, L.; Verdugo-Alejo, L.; Sarasti, L. Optimizing MRI-Based Brain Tumor Classification and Detection Using AI: A Comparative Analysis of Neural Networks, Transfer Learning, Data Augmentation, and the Cross-Transformer Network. Eur. J. Radiol. Open 2023, 10, 100484. [Google Scholar] [CrossRef] [PubMed]
- Kasinathan, G.; Jayakumar, S. Cloud-Based Lung Tumor Detection and Stage Classification Using Deep Learning Techniques. Biomed. Res. Int. 2022, 2022, 4185835. [Google Scholar] [CrossRef] [PubMed]
- Narasimha Raju, A.; Jayavel, K.; Rajalakshmi, T. Dexterous Identification of Carcinoma through ColoRectalCADx with Dichotomous Fusion CNN and UNet Semantic Segmentation. Comput. Intell. Neurosci. 2022, 2022, 4325412. [Google Scholar] [CrossRef] [PubMed]
- Chiu, H.Y.; Chao, H.S.; Chen, Y.M. Application of Artificial Intelligence in Lung Cancer. Cancers 2022, 14, 1370. [Google Scholar] [CrossRef] [PubMed]
- Hoq, M.E.; Hossain, S.; Emmaka, I.; Larson-Prior, L.; Tarbox, L.; Bona, J.; Johann, D., Jr.; Prior, F. When Is 3D Worth It? A Resource–Performance Frontier for CNNs and Transformers in Lung CT. arXiv 2026, arXiv:2606.06950. [Google Scholar] [CrossRef]
- Ardila, D.; Kiraly, A.; Bharadwaj, S.; Choi, B.; Reicher, J.; Peng, L.; Tse, D.; Etemadi, M.; Ye, W.; Corrado, G.; et al. End-to-End Lung Cancer Screening with Three-Dimensional Deep Learning on Low-Dose Chest Computed Tomography. Nat. Med. 2019, 25, 954–961. [Google Scholar] [CrossRef] [PubMed]
- Mikhael, P.G.; Wohlwend, J.; Yala, A.; Karstens, L.; Xiang, J.; Takigami, A.K.; Bourgouin, P.P.; Chan, P.; Mrah, S.; Amayri, W.; et al. Sybil: A Validated Deep Learning Model to Predict Future Lung Cancer Risk from a Single Low-Dose Chest Computed Tomography. J. Clin. Oncol. 2023, 41, 2191–2200. [Google Scholar] [CrossRef] [PubMed]
- Gao, R.; Tang, Y.; Khan, M.; et al. Cancer Risk Estimation Combining Lung Screening CT with Clinical Data Elements. Radiol. Artif. Intell. 2021, 3, e210032. [Google Scholar] [CrossRef] [PubMed]
- Trajanovski, S.; Mavroeidis, D.; Swisher, C.; et al. Towards Radiologist-Level Cancer Risk Assessment in CT Lung Screening Using Deep Learning. Comput. Med. Imaging Graph. 2021, 90, 101883. [Google Scholar] [CrossRef] [PubMed]
- Lu, M.; Raghu, V.; Mayrhofer, T.; et al. Deep Learning Using Chest Radiographs to Identify High-Risk Smokers for Lung Cancer Screening CT. Ann. Intern. Med. 2020, 173, 704–713. [Google Scholar] [CrossRef] [PubMed]
- Liao, F.; Liang, M.; Li, Z.; Hu, X.; Song, S. Evaluate the Malignancy of Pulmonary Nodules Using the 3D Deep Leaky Noisy-OR Network. IEEE Trans. Neural Netw. Learn. Syst. 2019, 30, 3484–3495. [Google Scholar] [CrossRef] [PubMed]
- Liu, W.; Liu, X.; Luo, X.; et al. A Pyramid Input Augmented Multi-Scale CNN for GGO Detection in 3D Lung CT Images. Pattern Recognit. 2023, 136, 109261. [Google Scholar] [CrossRef]
- Wang, B.; Si, S.; Zhao, H.; Zhu, H.; Dou, S. False Positive Reduction in Pulmonary Nodule Classification Using 3D Texture and Edge Feature in CT Images. Technol. Health Care 2021, 29, 1071–1088. [Google Scholar] [CrossRef] [PubMed]
- Wu, Z.; Ge, R.; Shi, G.; Zhang, L.; Chen, Y.; Luo, L.; Cao, Y.; Yu, H. MD-NDNet: A Multi-Dimensional Convolutional Neural Network for False-Positive Reduction in Pulmonary Nodule Detection. Phys. Med. Biol. 2020, 65, 235053. [Google Scholar] [CrossRef] [PubMed]
- Zhang, Y.; Jiang, B.; Zhang, L.; et al. Lung Nodule Detectability of AI-Assisted CT Image Reading in Lung Cancer Screening. Curr. Med. Imaging 2022, 18, 327–334. [Google Scholar] [CrossRef] [PubMed]
- Al-Shabi, M.; Shak, K.; Tan, M. ProCAN: Progressive Growing Channel Attentive Non-Local Network for Lung Nodule Classification. Pattern Recognit. 2022, 122, 108309. [Google Scholar] [CrossRef]
- Wang, X.; Zhang, L.; Yang, X.; et al. Deep Learning Combined with Radiomics May Optimize the Differentiation of High-Grade Lung Adenocarcinoma in Subsolid Nodules. Eur. J. Radiol. 2020, 129, 109150. [Google Scholar] [CrossRef] [PubMed]
- Jacobs, C.; Setio, A.; Scholten, E.; et al. Deep Learning for Lung Cancer Detection on Screening CT Scans: Results of a Large-Scale Public Competition and an Observer Study with 11 Radiologists. Radiol. Artif. Intell. 2021, 3, e210027. [Google Scholar] [CrossRef] [PubMed]
- Murchison, J.; Ritchie, G.; Senyszak, D.; et al. Validation of a Deep Learning Computer-Aided System for CT-Based Lung Nodule Detection, Classification, and Growth Rate Estimation in a Routine Clinical Population. PLoS ONE 2022, 17, e0266799. [Google Scholar] [CrossRef] [PubMed]
- Niu, C.; Wang, G. Unsupervised Contrastive Learning Based Transformer for Lung Nodule Detection. Phys. Med. Biol. 2022, 67, 225015. [Google Scholar] [CrossRef] [PubMed]
- Zhang, C.; Li, J.; Huang, J.; Wu, S. Computed Tomography Image under CNN Deep Learning Algorithm in Pulmonary Nodule Detection and Lung Function Examination. J. Healthc. Eng. 2021, 2021, 3417285. [Google Scholar] [CrossRef] [PubMed]
- Nasrullah, N.; Sang, J.; Alam, M.S.; Mateen, M.; Cai, B.; Hu, H. Automated Lung Nodule Detection and Classification Using Deep Learning Combined with Multiple Strategies. Sensors 2019, 19, 3722. [Google Scholar] [CrossRef] [PubMed]
- Perl, R.; Grimmer, R.; Hepp, T.; Horger, M. Can a Novel Deep Neural Network Improve CAD of Pulmonary Nodules and Reduce False Positives versus an Established Machine-Learning CAD? Invest. Radiol. 2021, 56, 103–108. [Google Scholar] [CrossRef] [PubMed]
- Park, S.; Lee, S.; Lee, K.; et al. Deep Learning-Based Detection System for Multiclass Lesions on Chest Radiographs: Comparison with Observer Readings. Eur. Radiol. 2020, 30, 1359–1368. [Google Scholar] [CrossRef] [PubMed]
- Yoo, H.; Lee, S.; Arru, C.; et al. AI-Based Improvement in Lung Cancer Detection on Chest Radiographs: Results of a Multi-Reader Study in the NLST Dataset. Eur. Radiol. 2021, 31, 9664–9674. [Google Scholar] [CrossRef] [PubMed]
- Suzuki, K.; Otsuka, Y.; Nomura, Y.; et al. Development and Validation of a Modified Three-Dimensional U-Net Deep-Learning Model for Automated Detection of Lung Nodules on Chest CT. Acad. Radiol. 2022, 29, S11–S17. [Google Scholar] [CrossRef] [PubMed]
- Holbrook, M.; Clark, D.; Patel, R.; et al. Detection of Lung Nodules in Micro-CT Imaging Using Deep Learning. Tomography 2021, 7, 358–372. [Google Scholar] [CrossRef] [PubMed]
- Wu, P.; Sun, X.; Zhao, Z.; et al. Classification of Lung Nodules Based on Deep Residual Networks and Transfer Learning. Comput. Intell. Neurosci. 2020, 2020, 8975078. [Google Scholar] [CrossRef] [PubMed]
- Heuvelmans, M.; van Ooijen, P.; Ather, S.; et al. Lung Cancer Prediction by Deep Learning to Identify Benign Lung Nodules. Lung Cancer 2021, 154, 1–4. [Google Scholar] [CrossRef] [PubMed]
- Chaunzwa, T.; Hosny, A.; Xu, Y.; et al. Deep Learning Classification of Lung Cancer Histology Using CT Images. Sci. Rep. 2021, 11, 5471. [Google Scholar] [CrossRef] [PubMed]
- Tau, N.; Stundzia, A.; Yasufuku, K.; Hussey, D.; Metser, U. Convolutional Neural Networks in Predicting Nodal and Distant Metastatic Potential of Newly Diagnosed Non-Small Cell Lung Cancer on FDG-PET Images. Am. J. Roentgenol. 2020, 215, 192–197. [Google Scholar] [CrossRef] [PubMed]
- Moitra, D.; Mandal, R. Prediction of Non-Small Cell Lung Cancer Histology by a Deep Ensemble of Convolutional and Bidirectional Recurrent Neural Networks. J. Digit. Imaging 2020, 33, 895–902. [Google Scholar] [CrossRef] [PubMed]
- Hondelink, L.; Hüyük, M.; Postmus, P.; et al. Development and Validation of a Deep Learning Algorithm for Automated Whole-Slide PD-L1 Tumor Proportion Score Assessment in Non-Small Cell Lung Cancer. Histopathology 2022, 80, 635–647. [Google Scholar] [CrossRef] [PubMed]
- Tong, H.; Sun, J.; Fang, J.; et al. A Machine Learning Model Based on PET/CT Radiomics and Clinical Characteristics Predicts Tumor Immune Profiles in Non-Small Cell Lung Cancer: A Retrospective Multicohort Study. Front. Immunol. 2022, 13, 859323. [Google Scholar] [CrossRef] [PubMed]
- Veasey, B.; Broadhead, J.; Dahle, M.; Seow, A.; Amini, A. Lung Nodule Malignancy Prediction from Longitudinal CT Scans with Siamese Convolutional Attention Networks. IEEE Open J. Eng. Med. Biol. 2020, 1, 257–264. [Google Scholar] [CrossRef] [PubMed]
- Liu, X.; Wang, M.; Aftab, R. Prediction of Long-Term Outcomes for Pulmonary Lesions Using a CNN-LSTM Model. Front. Bioeng. Biotechnol. 2022, 10, 791424. [Google Scholar] [CrossRef] [PubMed]
- Wang, Y.; Wang, J.; Yang, S.; et al. A Deep Learning Method for Improving the Diagnostic Certainty of Pulmonary Nodules on CT. Eur. Radiol. 2021, 31, 8160–8167. [Google Scholar] [CrossRef] [PubMed]
- Afshar, P.; Oikonomou, A.; Naderkhani, F.; et al. 3D-MCN: A 3D Multi-Scale Capsule Network for Lung Nodule Malignancy Prediction. Sci. Rep. 2020, 10, 7948. [Google Scholar] [CrossRef] [PubMed]
- Tang, X.; Li, Y.; Yan, W.; et al. CT Radiomics Analysis for Prognostic Prediction in Metastatic NSCLC Patients with EGFR-T790M Mutation Receiving Osimertinib. Front. Oncol. 2021, 11, 719919. [Google Scholar] [CrossRef] [PubMed]
- Ma, Y.; Li, J.; Xu, X.; Zhang, Y.; Lin, Y. CT Delta-Radiomics Based Machine Learning in Evaluating Multiple Primary Lung Adenocarcinoma. BMC Cancer 2022, 22, 770. [Google Scholar] [CrossRef] [PubMed]
- Kim, J.; Yoon, H.; Lee, E.; et al. Validation of Deep-Learning Image Reconstruction for Low-Dose Chest Computed Tomography Scan: Emphasis on Image Quality and Noise. Korean J. Radiol. 2021, 22, 131–138. [Google Scholar] [CrossRef] [PubMed]
- Xu, Y.; Hosny, A.; Zeleznik, R.; et al. Deep Learning Predicts Lung Cancer Treatment Response from Serial Medical Imaging. Clin. Cancer Res. 2019, 25, 3266–3275. [Google Scholar] [CrossRef] [PubMed]
- Hoq, M.E.; Larson-Prior, L.; Prior, F. Virtual-Eyes: Quantitative Validation of a Lung CT Quality-Control Pipeline for Foundation-Model Cancer Risk Prediction. In Proceedings of the 9th International Conference on Medical Imaging with Deep Learning; Proceedings of Machine Learning Research; PMLR; 2026; Volume 315, pp. 4639–4663. Available online: https://proceedings.mlr.press/v315/hoq26a.html.
- Lu, J.; Jin, R.; Song, E.; Ma, G.; Wang, M. Lung-CRNet: A Convolutional Recurrent Neural Network for Lung 4DCT Image Registration. Med. Phys. 2021, 48, 7900–7912. [Google Scholar] [CrossRef] [PubMed]
- Mori, S.; Hirai, R.; Sakata, Y. Simulated Four-Dimensional CT for Markerless Tumor Tracking Using a Deep Learning Network with Multi-Task Learning. Phys. Med. 2020, 80, 151–158. [Google Scholar] [CrossRef] [PubMed]
- Cardenas, C.; Yang, J.; Anderson, B.; Court, L.; Brock, K. Advances in Auto-Segmentation. Semin. Radiat. Oncol. 2019, 29, 185–197. [Google Scholar] [CrossRef] [PubMed]
- Hatamizadeh, A.; Terzopoulos, D.; Myronenko, A. Edge-Gated CNNs for Volumetric Semantic Segmentation of Medical Images. arXiv 2020, arXiv:2002.04207. [Google Scholar] [CrossRef]
- Martin, R.; Sharma, U.; Kaur, K.; et al. Multidimensional CNN-Based Deep Segmentation Method for Tumor Identification. Biomed. Res. Int. 2022, 2022, 5061112. [Google Scholar] [CrossRef] [PubMed]
- Yang, J.; Wu, B.; Li, L.; Cao, P.; Zaiane, O. MSDS-UNet: A Multi-Scale Deeply Supervised 3D U-Net for Automatic Segmentation of Lung Tumor in CT. Comput. Med. Imaging Graph. 2021, 92, 101957. [Google Scholar] [CrossRef] [PubMed]
- Ni, Y.; Xie, Z.; Zheng, D.; Yang, Y.; Wang, W. Two-Stage Multitask U-Net Construction for Pulmonary Nodule Segmentation and Malignancy Risk Prediction. Quant. Imaging Med. Surg. 2022, 12, 292–309. [Google Scholar] [CrossRef] [PubMed]
- Wang, H.; Cao, P.; Wang, J.; Zaiane, O.R. UCTransNet: Rethinking the Skip Connections in U-Net from a Channel-Wise Perspective with Transformer. Proc. AAAI Conf. Artif. Intell. 2022, 36, 2441–2449. [Google Scholar] [CrossRef]
- Sinha, A.; Dolz, J. Multi-Scale Self-Guided Attention for Medical Image Segmentation. IEEE J. Biomed. Health Inform. 2021, 25, 121–130. [Google Scholar] [CrossRef] [PubMed]
- Zhang, J.; Liu, Y.; Wu, Q.; et al. SWTRU: Star-Shaped Window Transformer Reinforced U-Net for Medical Image Segmentation. Comput. Biol. Med. 2022, 150, 105954. [Google Scholar] [CrossRef] [PubMed]
- Liu, F.; Zhu, J.; Lv, B.; et al. Auxiliary Segmentation Method of Osteosarcoma in MRI Images Based on Denoising and Local Enhancement. Healthcare 2022, 10, 1468. [Google Scholar] [CrossRef]
- Felfeliyan, B.; Forkert, N.; Hareendranathan, A.; et al. Self-Supervised-RCNN for Medical Image Segmentation with Limited Data Annotation. Comput. Med. Imaging Graph. 2023, 109, 102297. [Google Scholar] [CrossRef] [PubMed]
- Dosovitskiy, A.; Beyer, L.; Kolesnikov, A.; Weissenborn, D.; Zhai, X.; Unterthiner, T.; Dehghani, M.; Minderer, M.; Heigold, G.; Gelly, S.; et al. An Image Is Worth 16x16 Words: Transformers for Image Recognition at Scale. In Proceedings of the International Conference on Learning Representations (ICLR), 2021. [Google Scholar] [CrossRef]
- Veenboer, T.; Yiasemis, G.; Marcus, E.; van Veldhuizen, V.; Snoek, C.G.M.; Teuwen, J.; Groot Lipman, K.B.W. TAP-CT: 3D Task-Agnostic Pretraining of Computed Tomography Foundation Models. arXiv 2025, arXiv:2512.00872. [Google Scholar] [CrossRef]
- Kobylińska, K.; Orłowski, T.; Adamek, M.; Biecek, P. Explainable Machine Learning for Lung Cancer Screening Models. Appl. Sci. 2022, 12, 1926. [Google Scholar] [CrossRef]
- Wang, G.; Wu, J.; Luo, X.; Liu, X.; Li, K.; Zhang, S. MIS-FM: 3D Medical Image Segmentation Using Foundation Models Pretrained on a Large-Scale Unannotated Dataset. arXiv 2023, arXiv:2306.16925. [Google Scholar] [CrossRef]
- Liu, Z.; Lin, Y.; Cao, Y.; Hu, H.; Wei, Y.; Zhang, Z.; Lin, S.; Guo, B. Swin Transformer: Hierarchical Vision Transformer Using Shifted Windows. arXiv 2021, arXiv:2103.14030. [Google Scholar] [CrossRef]
- Field, M.; Vinod, S.; Aherne, N.; et al. Implementation of the Australian Computer-Assisted Theragnostics (AusCAT) Network for Radiation Oncology Data Extraction, Reporting and Distributed Learning. J. Med. Imaging Radiat. Oncol. 2021, 65, 627–636. [Google Scholar] [CrossRef] [PubMed]
- Wang, G.; Liu, X.; Shen, J.; et al. A Deep-Learning Pipeline for the Diagnosis and Discrimination of Viral, Non-Viral and COVID-19 Pneumonia from Chest X-ray Images. Nat. Biomed. Eng. 2021, 5, 509–521. [Google Scholar] [CrossRef] [PubMed]
- Gong, R.; Han, X.; Wang, J.; Ying, S.; Shi, J. Self-Supervised Bi-Channel Transformer Networks for Computer-Aided Diagnosis. IEEE J. Biomed. Health Inform. 2022, 26, 3435–3446. [Google Scholar] [CrossRef] [PubMed]
- Clark, K.; Vendt, B.; Smith, K.; et al. The Cancer Imaging Archive (TCIA): Maintaining and Operating a Public Information Repository. J. Digit. Imaging 2013, 26, 1045–1057. [Google Scholar] [CrossRef] [PubMed]
- Lin, C.; et al. ScreenLungNet: Personalized Long-Term Prediction of Lung Cancer Risk from a Single Low-Dose CT Screening. Radiology 2025, e251310. [Google Scholar] [CrossRef] [PubMed]
- Lee, J.H.; Chae, K.J.; Lu, M.T.; et al. External Testing of a Deep Learning Model for Lung Cancer Risk Prediction from Low-Dose Chest CT. Radiology 2025, 316, e243393. [Google Scholar] [CrossRef] [PubMed]
- Niu, C.; Lyu, Q.; Carothers, C.D.; et al. Medical Multimodal-Multitask Foundation Model for Superior Chest CT Performance. Nat. Commun. 2025, 16, 1523. [Google Scholar] [CrossRef] [PubMed]
- Jin, H.; Yu, C.; Zhang, J.; Zheng, R.; Fu, Y.; Zhao, Y. Multitask Swin Transformer for Classification and Characterization of Pulmonary Nodules in CT Images. Quant. Imaging Med. Surg. 2025, 15, 1845–1861. [Google Scholar] [CrossRef] [PubMed]
- Zhao, W.; Fu, Y.; Shen, Y.; Ma, J.; Zhao, L.; Fu, X.; Zhang, P.; Zhao, J. Lung Cancer Screening Classification by a Sequential Multi-Instance Learning (SMILE) Framework with Multiple CT Scans. IEEE Trans. Med. Imaging 2025, 44, 3151–3161. [Google Scholar] [CrossRef] [PubMed]
- Fukumoto, W.; Yamashita, Y.; Kawashita, I.; Higaki, T.; Sakahara, A.; Nakamura, Y.; Awaya, Y.; Awai, K. External Validation of the Performance of Commercially Available Deep-Learning-Based Lung Nodule Detection on Low-Dose CT Images for Lung Cancer Screening in Japan. Jpn. J. Radiol. 2025, 43, 634–640. [Google Scholar] [CrossRef] [PubMed]
- Revel, M.P.; Biederer, J.; Nair, A.; et al. ESR Essentials: Lung Cancer Screening with Low-Dose CT—Practice Recommendations by the European Society of Thoracic Imaging. In Eur. Radiol.; 2025. [Google Scholar] [CrossRef] [PubMed]
- Page, M.J.; McKenzie, J.E.; Bossuyt, P.M.; Boutron, I.; Hoffmann, T.C.; Mulrow, C.D.; et al. The PRISMA 2020 Statement: An Updated Guideline for Reporting Systematic Reviews. BMJ 2021, 372, n71. [Google Scholar] [CrossRef] [PubMed]
- Lekadir, K.; Frangi, A. F.; Porras, A. R.; Glocker, B.; Cintas, C.; Langlotz, C. P.; et al. FUTURE-AI: international consensus guideline for trustworthy and deployable artificial intelligence in healthcare. BMJ 2025, 388, e081554. [Google Scholar] [CrossRef] [PubMed]
Figure 1.
PRISMA flow diagram of study identification, screening, eligibility assessment, and inclusion. Counts reconcile at every stage: 1,802 records were identified (1,788 from database searching and 14 from reference-list hand-searching), 487 duplicates were removed, 1,315 records were screened on title and abstract, 139 full texts were assessed for eligibility, and 72 studies met the inclusion criteria. The 67 full-text exclusions comprise 26 with no LDCT screening images, 19 with no AI/ML method, 14 with insufficient outcome data, and 8 conference abstracts without an available full text.
Figure 1.
PRISMA flow diagram of study identification, screening, eligibility assessment, and inclusion. Counts reconcile at every stage: 1,802 records were identified (1,788 from database searching and 14 from reference-list hand-searching), 487 duplicates were removed, 1,315 records were screened on title and abstract, 139 full texts were assessed for eligibility, and 72 studies met the inclusion criteria. The 67 full-text exclusions comprise 26 with no LDCT screening images, 19 with no AI/ML method, 14 with insufficient outcome data, and 8 conference abstracts without an available full text.
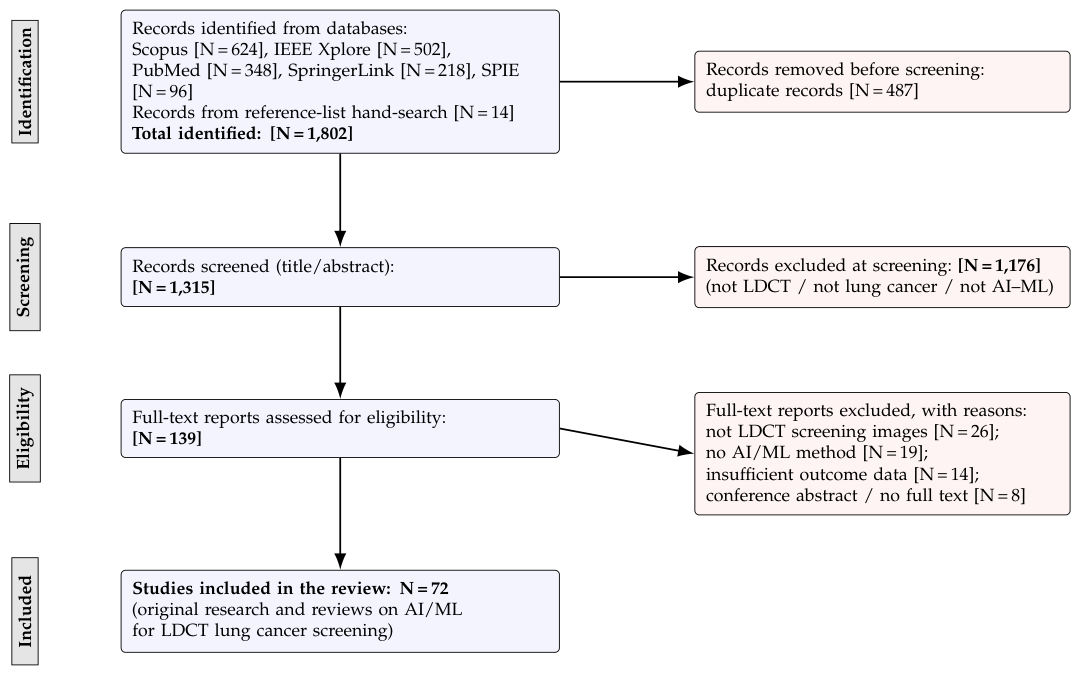
Figure 2.
Proposed general framework for AI-assisted LDCT lung cancer screening, integrating the three themes of this review. An LDCT scan from a high-risk patient passes through a quality-control (QC) module that yields lung-focused, QC-approved imaging; a self-supervised screening model (which can incorporate either 2D slice-level or 3D volumetric representations depending on architectural trade-offs) then forms a patient embedding and retrieves similar cancer/benign cases. A three-way output—high risk, low risk, or indeterminate—is returned with a case-based explanation for radiologist review. Low-risk studies are routed toward faster reassurance, high-risk studies toward prioritized clinical action, and indeterminate studies toward short-term follow-up. Balancing spatial continuity against computational overhead and resolution constraints (Q1, Q2), paired with case-based, interpretable explanations for the reader (Q3), jointly targets a potential reduction in false positives and false negatives and a lighter reading burden. The framework is design-agnostic; the authors’ own QC front end [58] and native-resolution 2D encoder [12] represent one specific implementation strategy within this broader design space.
Figure 2.
Proposed general framework for AI-assisted LDCT lung cancer screening, integrating the three themes of this review. An LDCT scan from a high-risk patient passes through a quality-control (QC) module that yields lung-focused, QC-approved imaging; a self-supervised screening model (which can incorporate either 2D slice-level or 3D volumetric representations depending on architectural trade-offs) then forms a patient embedding and retrieves similar cancer/benign cases. A three-way output—high risk, low risk, or indeterminate—is returned with a case-based explanation for radiologist review. Low-risk studies are routed toward faster reassurance, high-risk studies toward prioritized clinical action, and indeterminate studies toward short-term follow-up. Balancing spatial continuity against computational overhead and resolution constraints (Q1, Q2), paired with case-based, interpretable explanations for the reader (Q3), jointly targets a potential reduction in false positives and false negatives and a lighter reading burden. The framework is design-agnostic; the authors’ own QC front end [58] and native-resolution 2D encoder [12] represent one specific implementation strategy within this broader design space.
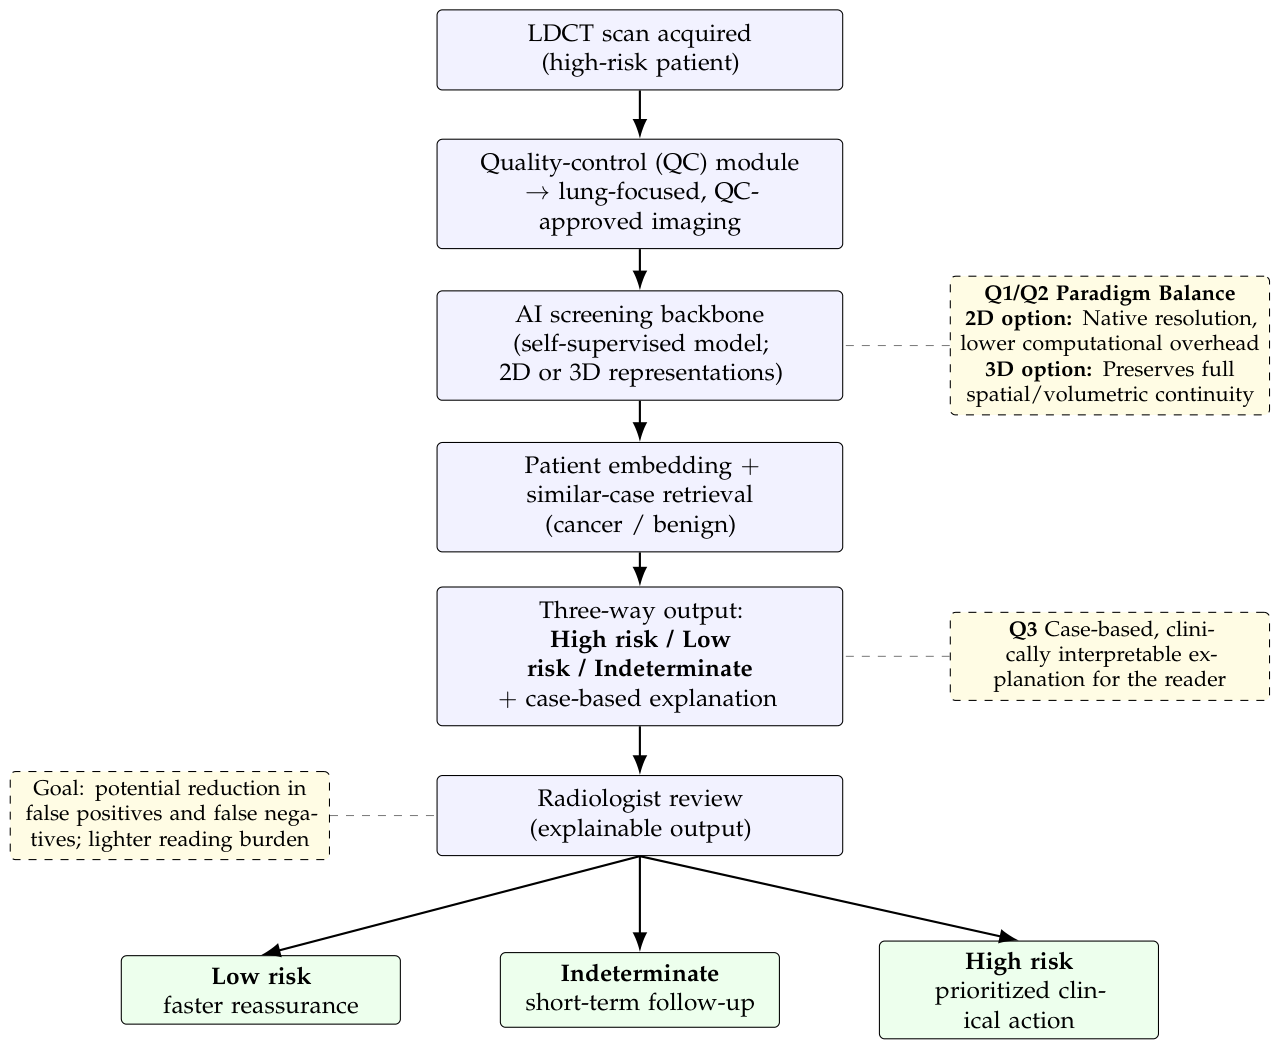

Table 1.
How each class of reference is treated in this review. Only 2018–November 2024 database studies contribute to the systematic count of 72 included studies; landmark trials, background and methodological references, screening-guideline statements, public data resources, post-cutoff works, and the forthcoming companion study are cited for context and are not counted.
Table 1.
How each class of reference is treated in this review. Only 2018–November 2024 database studies contribute to the systematic count of 72 included studies; landmark trials, background and methodological references, screening-guideline statements, public data resources, post-cutoff works, and the forthcoming companion study are cited for context and are not counted.
| Reference class | In systematic count? | Role |
|---|---|---|
| 2018–Nov 2024 database studies | Yes () | Main thematic synthesis |
| Landmark trials / background / guidelines / data resources | No | Clinical, methodological, and historical context |
| Post-Nov 2024 works (2025–2026), surveyed as recent developments () | No | Forward-looking context only (Section 7) |
| Authors’ forthcoming companion study () | No | Illustrative example only |
Table 2.
Eligibility criteria applied during full-text assessment.
| Inclusion criteria | Exclusion criteria |
|---|---|
| Involves low-dose CT lung cancer screening images | Non-screening or non-CT imaging (e.g. diagnostic chest CT only, PET, pathology) |
| Develops, evaluates, or reviews an AI/ML technique for nodule detection, classification, segmentation, or risk prediction | No AI/ML methodology (purely clinical or epidemiological studies) |
| Original research or relevant review | Conference abstract without an available full text |
| English language; published January 2018–November 2024 | Insufficient outcome data to characterize the method; duplicate cohort/report |
Table 3.
Evidence table of representative included studies, grouped by task. Dim. = primary input dimensionality. Performance is reported as stated in the cited primary source; AUC is ROC-AUC unless noted. Entries marked † were independently re-verified against the primary source during preparation. This table summarizes representative studies that anchor the synthesis and is not an exhaustive listing of all 72 included studies; a structured appraisal of these studies is given in Table 4, and an extended appraisal of further representative studies is provided in Supplementary Table S2.
Table 3.
Evidence table of representative included studies, grouped by task. Dim. = primary input dimensionality. Performance is reported as stated in the cited primary source; AUC is ROC-AUC unless noted. Entries marked † were independently re-verified against the primary source during preparation. This table summarizes representative studies that anchor the synthesis and is not an exhaustive listing of all 72 included studies; a structured appraisal of these studies is given in Table 4, and an extended appraisal of further representative studies is provided in Supplementary Table S2.
| Study (year) | Dim. | Dataset | Task | Key reported result |
|---|---|---|---|---|
| Risk prediction / whole-scan classification | ||||
| Ardila et al. (2019) [21] | 3D | NLST | 1-yr cancer risk | AUC 0.944 on 6,716 NLST test cases; ≈ radiologist level † |
| Mikhael et al. (2023), Sybil [22] | 3D | NLST; MGH; CGMH | 1–6-yr risk, single LDCT | Validated across U.S. and Taiwan cohorts; no manual annotation† |
| Gao et al. (2021) [23] | 3D | NLST; Vanderbilt | Imaging + clinical fusion | AUC 0.88 internal; 0.91 external; > imaging-only (0.86) / CDE-only (0.69)† |
| Trajanovski et al. (2021) [24] | 3D | NLST; LHMC; Kaggle | Patient-level risk | AUC 0.86–0.94 across datasets; ≈ radiologists† |
| Lu et al. (2020), CXR-LC [25] | 2D | PLCO; NLST (CXR) | 12-yr risk from chest X-ray | AUC 0.75 vs 0.63 (CMS criteria)† |
| Nodule detection | ||||
| Liao et al. (2019) [26] | 3D | LUNA16/LIDC | Detection (noisy-OR) | ≈85.6% recall at ∼4 FP/scan |
| Liu et al. (2023), PiaNet [27] | 3D | LIDC-IDRI | GGO detection | 93.6% sensitivity at 1 FP/scan† |
| Wang et al. (2021) [28] | 3D | LIDC-IDRI | False-positive reduction | ≈50% reduction in FP rate vs baseline |
| Wu et al. (2020), MD-NDNet [29] | 2D+3D | LUNA16 | FP reduction (fusion) | Multi-dimensional fusion improves FP reduction |
| Zhang et al. (2022) [30] | — | Reader study | AI-assisted reading | AI-assisted reading improved detection sensitivity vs radiology reports, especially for non-solid nodules |
| Nodule malignancy classification | ||||
| Causey et al. (2018), NoduleX [8] | 2D | LIDC-IDRI | Malignancy classification | AUC ∼0.99 (nodule-level); 0.949 nodule-vs-non-nodule † |
| Al-Shabi et al. (2022), ProCAN [31] | 3D | LIDC-IDRI | Malignancy classification | AUC 0.980; accuracy 0.953 (as reported) † |
| Wang et al. (2020) [32] | — | Institutional | DL + radiomics (subsolid) | AUC 0.98 for malignancy (hybrid features) |
| External validation / generalizability | ||||
| Jacobs et al. (2021) [33] | 3D | Kaggle DSB; NLST | Competition + observer study | Top algorithms AUC 0.877–0.902 vs radiologists’ 0.917 † |
| Murchison et al. (2022) [34] | 3D | Routine clinical (UK) | CAD validation + reader study | Reader sensitivity 71.9%→80.3% with CAD (FP 0.11→0.16/scan); detected nodules in a routine population † |
| Foundation / self-supervised models (post-cutoff context) | ||||
| Hoq et al. (2025) [12] | 2D | Native-res. 2D | RAD-DINO embeddings (SSL) | Feasibility of strong classification from native-resolution 2D |
| Agrawal et al. (2025), Pillar-0 [13] | 3D | Multi-organ CT/MRI | Radiology foundation model | Improves over Sybil on NLST risk; high data efficiency |
| Niu & Wang (2022), URCTrans [35] | 3D | LIDC | Contrastive SSL transformer | Improves detection when labels are sparse |
Table 4.
Simplified quality appraisal of the representative studies in Table 3. Y = yes, P = partial, N = no, — = not applicable. Ext. = independent/external validation; Public = public dataset used; Split = patient-level (leakage-free) data split; S/S = reports sensitivity/specificity or FROC; Cal. = reports calibration; Workflow = relevance to the screening reading workflow; Overall = coarse qualitative rating. Ratings reflect documented study characteristics; an extended appraisal of further representative studies is provided in Supplementary Table S2.
Table 4.
Simplified quality appraisal of the representative studies in Table 3. Y = yes, P = partial, N = no, — = not applicable. Ext. = independent/external validation; Public = public dataset used; Split = patient-level (leakage-free) data split; S/S = reports sensitivity/specificity or FROC; Cal. = reports calibration; Workflow = relevance to the screening reading workflow; Overall = coarse qualitative rating. Ratings reflect documented study characteristics; an extended appraisal of further representative studies is provided in Supplementary Table S2.
| Study (year) | Ext. | Public | Split | S/S | Cal. | Workflow | Overall |
|---|---|---|---|---|---|---|---|
| Ardila et al. (2019) | Y | Y | Y | Y | N | High | High |
| Mikhael et al. (2023), Sybil | Y | Y | Y | Y | P | High | High |
| Gao et al. (2021) | Y | Y | Y | P | P | Mod. | Mod.–High |
| Trajanovski et al. (2021) | Y | P | Y | Y | N | Mod. | Mod.–High |
| Lu et al. (2020), CXR-LC | Y | Y | Y | Y | P | Mod. | Mod. |
| Liao et al. (2019) | N | Y | Y | Y | N | Mod. | Mod. |
| Liu et al. (2023), PiaNet | N | Y | Y | Y | N | Mod. | Mod. |
| Wang et al. (2021) | N | Y | P | Y | N | Low–Mod. | Mod. |
| Wu et al. (2020), MD-NDNet | N | Y | Y | Y | N | Low–Mod. | Mod. |
| Zhang et al. (2022), reader study | — | N | — | Y | N | High | Mod. |
| Causey et al. (2018), NoduleX | N | Y | P | Y | N | Mod. | Mod. |
| Al-Shabi et al. (2022), ProCAN | N | Y | P | Y | N | Low–Mod. | Mod. |
| Wang et al. (2020), subsolid | N | N | Y | Y | N | Mod. | Low–Mod. |
| Jacobs et al. (2021) | Y | Y | Y | Y | N | High | High |
| Murchison et al. (2022) | Y | N | Y | Y | N | High | Mod.–High |
Table 5.
Key results of the companion controlled comparison, summarized from the authors’ companion preprint (Hoq et al., 2026) [20]; reproduced for context and not generated within the present review. Sens/Spec are reported at default (0.5) and validation-selected thresholds. The 2.5D CNN gives the best discrimination with stable behavior; transformer and 3D configurations show degeneracy (e.g. all-negative 3D ViT).
Table 5.
Key results of the companion controlled comparison, summarized from the authors’ companion preprint (Hoq et al., 2026) [20]; reproduced for context and not generated within the present review. Sens/Spec are reported at default (0.5) and validation-selected thresholds. The 2.5D CNN gives the best discrimination with stable behavior; transformer and 3D configurations show degeneracy (e.g. all-negative 3D ViT).
| Model | ROC-AUC | PR-AUC | Sens (Def/Val) | Spec (Def/Val) | GPU (MB) |
|---|---|---|---|---|---|
| 2D CNN | 0.581 | 0.088 | 0.10 / 0.10 | 0.949 / 0.931 | 1620 |
| 2.5D CNN | 0.682 | 0.158 | 0.20 / 0.75 | 0.949 / 0.469 | 1646 |
| 3D CNN | 0.622 | 0.107 | 0.05 / 0.50 | 0.975 / 0.671 | 1777 |
| 2D ViT | 0.598 | 0.088 | 0.10 / 0.10 | 0.910 / 0.881 | 4959 |
| 2.5D ViT | 0.631 | 0.127 | 0.10 / 0.60 | 0.986 / 0.505 | 4959 |
| 3D ViT | 0.589 | 0.081 | 0.00 / 0.00 | 1.00 / 0.964 | 352 |
Table 6.
Gaps in current AI-for-LDCT-screening research and a recommended research agenda.
| Gap | Why it matters | Recommended next step |
|---|---|---|
| Few external validations | Limits generalizability to new scanners, protocols, and populations | Multi-center testing across NLST, NELSON, and institutional cohorts |
| Inconsistent metrics | Prevents comparison across studies | Report ROC-AUC, PR-AUC, sensitivity, specificity, FROC, and calibration |
| Limited interpretability | Reduces radiologist trust and adoption | Standardized, validated slice-level attribution in the reading interface |
| Class imbalance | Inflates accuracy and can hide degenerate behavior | Use PR-AUC, calibration, and decision-curve analysis at screening prevalence |
| Workflow uncertainty | Limits real-world adoption | Reader studies reporting time-to-read and management impact |
| Reliance on retrospective data | Cannot establish clinical benefit–harm balance | Prospective trials measuring recall rate, stage shift, and outcomes |
Disclaimer/Publisher’s Note: The statements, opinions and data contained in all publications are solely those of the individual author(s) and contributor(s) and not of MDPI and/or the editor(s). MDPI and/or the editor(s) disclaim responsibility for any injury to people or property resulting from any ideas, methods, instructions or products referred to in the content. |
© 2026 by the authors. Licensee MDPI, Basel, Switzerland. This article is an open access article distributed under the terms and conditions of the Creative Commons Attribution (CC BY) license (http://creativecommons.org/licenses/by/4.0/).
Copyright: This open access article is published under a Creative Commons CC BY 4.0 license, which permit the free download, distribution, and reuse, provided that the author and preprint are cited in any reuse.


