
Submitted:
11 June 2026
Posted:
16 June 2026
You are already at the latest version
Abstract
Background: VERO cells, derived from the kidney epithelium of the African green monkey, are widely used in virology, but their ability to metabolize xenobiotics is not fully understood. Since cytochrome P450 (CYP) enzymes participate in xenobiotic metabolism, we investigated which CYP genes are expressed in VERO-E6 cells. Methods: Reverse Transcription- quantitative Polymerase Chain Reaction (RT-qPCR) showed that VERO-E6 cells express CYP3A4, CYP3A5, and CYP3A7. In contrast, CYP1A1, CYP2E1, and CYP2D6 transcripts were at the low detection level. To determine whether the encoded enzymes have the potential to activate aflatoxin B1 (AFB1), we used artificial intelligence (AI) -based structural modeling along with molec-ular docking. Results: AI modeling indicated CYP3A enzymes position AFB1 in a manner that supports the formation of the reactive intermediate, and CYP3A4 showed the most favorable orientation. To demonstrate AFB1 bioactivation, we exposed VERO-E6 cells to 200 nmol/L AFB1. After 10 days, we observed about 40 % cell death. Liquid chromatography-tandem mass spectroscopy (LC–MS/MS) analysis confirmed the presence of AFB1-derived DNA adducts, indicating that metabolic activation occurred in these cells. Conclusion: These results suggest that VERO-E6 cells have functional CYP-mediated metabolic activi-ty. Thus, combining computational and experimental approaches elucidates xenobiotic metabolism in cells where biochemical data are limited.
Keywords:
cytochrome P450
; AlphaFold
; AutoDoc Vina
; aflatoxin B1
; DNA adducts
1. Introduction
VERO-E6 cells are derived from the kidney epithelium of the African green monkey (Chlorocebus sabaeus) and are widely used as a mammalian cell model in virology (Ammerman et al., 2008) [1], vaccine production (Barrett et al., 2009) [2], and toxicological studies (Costa et al., 2016) [3]. ,They provide a useful system for studying how cells respond to chemical toxicants because they grow consistently in culture while maintaining intact apoptotic and stress-response pathways (Osada et al., 2014, Sène et al., 2021) [4,5]. As epithelial cells, they serve as a model for the first point of contact for xenobiotics, making them important for studying chemical uptake, cellular injury, and downstream stress responses. This allows investigation of genotoxic mechanisms as well as broader toxicant-induced cellular effects (Gómez-Lechón et al., 2010) [6].
Studies using VERO-E6 cells have already shown how different toxins affect cellular function. For example, microcystin-LR (MCLR) exposure leads to dose- and time-dependent cytotoxicity, mitochondrial dysfunction, oxidative DNA damage, and activation of ERK1/2 signaling pathways (Alverca et al., 2009, Dias et al., 2010, Menezes et al., 2013) [7,8,9]. In a similar way, the mycotoxin ochratoxin A (OTA) has been reported to increase reactive oxygen species (ROS) levels, induce apoptosis, and cause micronucleus formation in VERO cells. These observations suggest that oxidative stress plays a significant role in its toxicity in this system (Costa et al., 2016; Costa et al., 2015) [3,10].
VERO cells have also been used to investigate the combined effects of aflatoxin B1 (AFB1) and OTA, where non-linear dose–response relationships and enhanced genotoxicity were observed (El Golli-Bennour et al., 2010)[11]. Additionally, cellular assays in VERO-E6 cells have been used to detect industrial and environmental pollutants, such as 2,4,6-trichlorophenol, and to assess leachates from drinking water materials, demonstrating that morphological and membrane integrity changes can serve as sensitive indicators of chemical toxicity (Liao et al., 2010) [12]. More recently, VERO-based cytotoxicity datasets have been used to develop naïve Bayesian models for predicting compound toxicity, highlighting their utility in computational toxicology pipelines (Perryman et al., 2018) [13]. These models have been applied to classify structurally diverse small molecules as toxic or non-toxic and to identify chemical features associated with cytotoxic responses. Together, these studies demonstrate that VERO cells are a useful platform for detecting diverse toxicological endpoints.
While the Chlorocebus sabaeus genome has been sequenced, revealing orthologs of major Homo sapiens (human) cytochrome P450 enzymes involved in xenobiotic metabolism, including CYP1A and CYP3A family members, the metabolic capabilities of VERO cells remain incompletely understood. (Warren et al., 2015) [14]. However, many xenobiotics, including mycotoxins, polyaromatic hydrocarbons, heterocyclic aromatic amines, and small hydrophobic molecules, require metabolic activation by cytochrome P450 (CYP) enzymes to generate reactive intermediates capable of forming DNA adducts and inducing mutagenesis. For example, AFB1 is bioactivated primarily by CYP1A2 and CYP3A family enzymes to form the highly reactive exo-8,9-epoxide (Figure 1), which covalently binds DNA and initiates carcinogenic processes (Kensler et al., 2011, Guengerich et al., 2002) [15,16]. While hepatic systems are typically used to study such metabolic activation, limited evidence suggests that non-hepatic cell lines, including VERO cells, may express certain CYP enzymes (Gómez-Lechón et al., 2010; Bader et al., 2019) [6,17]. However, individual cytochrome P450 enzymes from VERO cells have not been purified or systematically characterized at the biochemical level, and their catalytic activity toward well-characterized human CYP substrates remains largely undefined (Guengerich et al., 2008, Zanger & Schwab., 2013) [18,19]. While in vitro studies have demonstrated active cellular metabolism in VERO cells, including glycolytic and mitochondrial pathways (Petiot et al., 2010) [20], direct evidence of functional CYP-mediated xenobiotic metabolism is limited. Consequently, the extent to which VERO cells support CYP-dependent metabolic activation of pro-carcinogens remains unclear.
Recent advances in AI, driven structural biology, and computational toxicology provide new opportunities to address key gaps, particularly with respect to protein structure, substrate binding, and catalytic positioning within CYP enzymes, thereby enabling an understanding of the structural and mechanistic basis of xenobiotic metabolism in VERO cells. Methods such as AlphaFold are now widely used to predict protein structures with high accuracy, and molecular docking can be used to examine how enzymes and ligands may interact (Jumper et al., 2021) [22]. In the context of toxicology, these approaches can help us understand how compounds like AFB1 might interact with different CYP isoforms, including how the ligand is positioned and how close it comes to the catalytic site. At the same time, these methods have limitations. They do not provide information about gene expression, enzyme levels, or whether the enzymes are active in the cell. Because of this, computational results alone cannot confirm whether a predicted CYP enzyme is functionally involved under biological conditions. For this reason, it is better to use both computational and experimental approaches, particularly in systems like VERO cells where detailed biochemical information is not available. While computational analysis can give us an idea of what might happen, experimental data are still needed to confirm what is occurring in the cell.
In this study, we used a combined experimental and computational approach to evaluate the metabolic potential of VERO-E6 cells. We first quantified the transcriptional expression of CYP genes and then used AI-based structural modeling and molecular docking to examine possible interactions between CYP enzymes and AFB1. To assess these predictions, we measured DNA adduct formation and assessed cytotoxic effects after AFB1 exposure. By combining gene expression data with the modeling results, we were able to better understand how VERO cells metabolize AFB1.
2. Results
2.1. Expression of C. sabaeus CYP3A4, CYP3A5, and CYP3A7 RNA Transcripts
We used RT-qPCR to determine which CYP genes were expressed in C. sabaeus (VERO E6) cells (Figure 2), and CYP expression was compared to the housekeeping gene GAPDH, where the Ct values are inversely proportional to mRNA abundance. The Ct value for GAPDH was around 25. CYP3A5 showed a similar Ct (≈ 25), which indicates that it has relatively high basal expression. CYP3A4 and CYP3A7 gave Ct values of about 27 and 36, suggesting lower expression compared to CYP3A5. Statistical comparison of Ct values relative to GAPDH demonstrated significant differences for CYP3A5 (p < 0.01), CYP3A4 (p < 0.05), and CYP3A7 (p < 0.01), with CYP3A7 showing the largest Ct difference, consistent with comparatively lower transcript abundance. In contrast, CYP1B1 and CYP1A2 had much higher Ct values (≈ 39 and 42), which points to extremely low levels of transcription. We also could not detect CYP2D6, CYP1A1, or CYP2C9 under these conditions, likely because their expression was below the detection limit of the assay. Overall, what we see is that VERO E6 cells do express CYP genes, with CYP3A5 and CYP3A4 showing the strongest expression in our dataset.
2.2. Comparison of the CYP Amino Acid Sequences from H. sapiens to Those of C. sabeus
We observed close similarities between the amino acid sequences of the CYP3A enzymes from C. sabaeus (VERO E6) and those of human versions (Supplementary Figure S1), which were all approximately500 amino acids in length.. Among the individual isoforms, CYP3A4 showed the highest similarity, with about 93 % identity and 97 % similarity between C. sabaeus and human sequences. CYP3A5 and CYP3A7 isoforms were also quite similar, with roughly 91 % identity and 95 % similarity. \ Aligned sequences exhibited at most one gap, indicating few insertions or deletions . Some similarity is due to conservative substitutions, where the amino acids changes do not affect charge or hydrophobicity. The catalytic regions were the most conserved, including key motifs and the substrate recognition sites (SRS1–SRS6), which are important for enzyme function. For example, the heme-binding motif (FGxGPRNCIG), which contains the cysteine that coordinates the heme iron, was conserved in all three CYP3A proteins. In C. sabaeus, the “x” position is threonine (T), while in humans it is serine (S), which is still a conservative change. Other motifs, such as PERF and EXXR, were also present in both species, suggesting that the catalytic core is maintained. On the other hand, most of the differences were seen in the N-terminal region and in some surface-exposed loops. The apparent flexibility of the surface-expose loops suggests that these changes have minimal effects. The sequences are still quite similar overall, and the key catalytic features are present in both species. Based on this, CYP3A enzymes in C. sabaeus and humans likely share functional similarities.
2.3. Conservation of the H. sapiens and C. sabaeus Three-Dimensional CYPs Structures
To determine whether C. sabaeus CYP enzymes have the structural features needed for catalysis, we compared AlphaFold-predicted structures with experimentally determined human CYP structures including CYP3A5 (PDB: 5VEU) (Hsu et al., 2018) [23], CYP3A4 (PDB: 9BV6) (Wang et al., 2025) [24] and CYP3A7 (PDB: 8GK3) (Liu et al., 2023) [25] (Figure 3). All C. sabaeus CYP3A isoforms exhibited the typical cytochrome P450 fold, including the heme-binding catalytic core. Overall, the fold and the position of the heme were similar to those seen in human enzymes, suggesting that the basic catalytic structure is preserved.
Notable differences were observed in substrate access regions, particularly the B–C and F–G loops, which appeared slightly more flexible and extended in C. sabaeus enzymes. Since these loops are known to control substrate entry into the active site, this added flexibility may facilitate ligand entry and accommodation without affecting the core catalytic structure. A comparison of human and C. sabaeus CYP3A isoforms is summarized in Table 1, which highlights a conserved catalytic core and minor differences in loop flexibility and active-site openness. Another difference was observed in the N-terminal region between human and C. sabaeus CYP3A isoforms. This region mainly helps keep the enzyme associated with the endoplasmic reticulum membrane. In many human CYP crystal structures, this part is often missing or only partially resolved because it is flexible and difficult to crystallize. In contrast, the AlphaFold models include the full-length protein, so the N-terminal region looks more extended and flexible. Because of this, its orientation appears different from that seen in human structures. That said, this region is mainly involved in anchoring the protein to the membrane and is not close to the catalytic site. So, any differences here are unlikely to have a major effect on the heme-binding pocket or enzyme activity. From this, it seems that C. sabaeus CYP3A enzymes still retain the key structural features needed for substrate binding and catalysis.
2.4. Multiple Docking Orientations Reveal Accessible Binding Landscapes
We used molecular docking to look at how AFB1 might interact with CYP enzymes. In the simulations, AFB1 did not stay in a single position within the CYP3A active site (Figure 4). Instead, it adopted several different binding orientations. We saw differences.
In how deeply the ligand sat in the pocket, how it was oriented with respect to the heme, and where it was positioned along the access channel. Overall, this suggests that the CYP binding pocket is quite flexible. Across docking runs, AFB1 was observed in both the central catalytic region and the nearby access channel. In some cases, such as CYP3A5 Mode 1 and CYP3A4 Mode 1 (Figure 4), the difuran moiety of AFB1 was oriented toward the heme group. In other poses, including CYP3A4 Mode 2 and CYP3A7 Mode 3 (Figure 4), the coumarin ring was directed toward the catalytic center. These differences indicate that AFB1 can reposition within the active site, allowing distinct parts of the molecule to approach the heme iron during docking.
Analysis of binding energies indicated that AFB1 interacts well with all CYP3A isoforms (Table 2). Among the isoforms, CYP3A4 generally had the lowest binding energies, suggesting that it accommodates AFB1 more tightly. In comparison, CYP3A5 and CYP3A7 also had favorable interactions, but to a lesser extent. These differences are probably due to minor changes in active-site shape, residue composition, and the flexibility of the access channel in each isoform.
A more detailed look at individual docking modes is summarized in Table 3. In the productive poses, AFB1 stabilization within the active site involved several residues located along the catalytic cavity and access channel. For CYP3A4, we kept seeing the same set of residues come up as Phe108, Phe213, Phe215, Phe241, and Phe304. These are mostly aromatic and hydrophobic, and they seem to form a kind of pocket that holds the planar rings of AFB1 in place, probably through hydrophobic and π–π interactions. Leu482 is also part of this region and adds to the hydrophobic surface. Residues like Arg105 and Arg212 are nearby as well and seem to help with how the ligand sits in the pocket. CYP3A5 did not look the same. Thr309 is close to the catalytic cavity and might be involved in positioning the ligand, possibly through polar interactions or hydrogen bonding. Arg105 and Phe213 are still there, but the interactions here seem less dominated by hydrophobic contacts and more by polar ones. In CYP3A7, the favorable poses were mainly associated with arginine residues, such as Arg105 and Arg372, as well as hydrophobic residues, such as Ala305, Ala370, and Leu482. In this case, AFB1 seems to be stabilized more by a mix of electrostatic interactions and hydrophobic contacts than by the strong aromatic interactions we see in CYP3A4.
Importantly, a high binding energy alone does not necessarily indicate that catalysis will occur. Several poses with favorable docking scores placed AFB1 too far from the heme center (Table 3), making them unlikely to support epoxidation. For catalytic activation, the reactive C8–C9 double bond of the difuran ring needs to be positioned close to the heme iron–oxo species. Only those orientations that bring this region near the heme are likely to lead to the formation of the AFB1-8,9-exo-epoxide, which is responsible for DNA adduct formation. The differences in residues involved in stabilizing these poses likely reflect small variations in active-site structure and flexibility among the CYP3A isoforms. Although the overall fold and heme-binding architecture are conserved, even minor differences in side-chain composition can influence how the ligand is positioned (Ekroos & Sjögren., 2006) [26]. As a result, each CYP isoform appears to use a slightly different combination of aromatic, hydrophobic, and polar residues to orient AFB1 for catalysis. The fact that we observe multiple favorable orientations aligns with what is already known about CYP enzymes, which are quite flexible and allow substrates to move within the active site before settling into a productive position. Overall, this suggests that CYP3A enzymes can bind AFB1 in multiple ways. This flexibility likely helps the ligand adjust its position until the reactive difuran region is aligned with the heme catalytic center.
2.5. Catalytically Favorable Binding Orientations Support Epoxidation Potential
Among the docking results, we selected representative poses with both low binding energies and favorable catalytic geometries for closer analysis (Figure 5). For AFB1 to be metabolically activated, the reactive C8–C9 double bond needs to be positioned close to the heme iron so that oxygen transfer can occur and the AFB1-8,9-epoxide can form. Based on this, we examined the docking poses by considering the ligand’s orientation, its distance from the heme, and its fit within the active site. In the selected poses, AFB1 was generally positioned with its difuran ring facing the heme, bringing the C8–C9 bond close enough to potentially support catalysis.
Among the CYP isoforms, CYP3A4 placed AFB1 closest to the heme iron, which likely makes it the most favorable for epoxidation. CYP3A5 and CYP3A7 exhibited slightly larger Fe–C8/C9 distances, but the ligand was still positioned in a way that could support catalytic activation. This suggests that all three enzymes may be capable of forming epoxide.
The active-site views in Figure 5 indicate that these productive orientations are stabilized by interactions between AFB1 and residues lining the catalytic cavity. Aromatic residues appear to form hydrophobic and π–π interactions with the planar aflatoxin structure, helping to hold the ligand in place above the heme. We also noticed that nearby polar and charged residues seem to affect how the ligand sits in the pocket and limit how much it moves. Because of that, the reactive double bond tends to stay pointed toward the catalytic center.
Taken together, this kind of positioning looks suitable for oxygen insertion. The details of the different modes, including Fe–C8/C9 distances and interacting residues, are listed in Table 3. From this, it is clear that catalytic potential is not determined by binding energy alone. For example, some poses with good docking scores, such as CYP3A4 Mode 2 and CYP3A5 Mode (Table 3), placed the ligand away from the heme and are therefore unlikely to support epoxidation at the C8–C9 position. These poses may reflect alternative ways the ligand can bind within the active site, but the orientation does not appear suitable for oxidation at the main reactive site. In contrast, the poses shown in Figure 5 not only have good binding energies but also place the ligand closer to the heme with supportive interactions, keeping the C8–C9 bond near the catalytic center. These poses are therefore more likely to reflect orientations that can support catalysis. The way CYP3A enzymes position AFB1 here also fits with what is already known about their flexibility and ability to work with different substrates. The minor differences in Fe–C8/C9 distances between the isoforms likely come from differences in active-site shape or how flexible the surrounding loops are, which may influence how efficiently the reaction proceeds. Overall, these results suggest that C. sabaeus CYP enzymes are structurally capable of positioning AFB1 in orientations that support formation of the reactive epoxide intermediate responsible for DNA adduct formation.
2.6. DNA Adduct Formation Confirms AFB1 Bioactivation
The most direct evidence of metabolic activation in VERO E6 cells is the formation of AFB1-derived DNA adducts. We quantified AFB1-derived DNA adducts following short-term exposure. Cells were treated with 200 nmol/L AFB1 for 2 h, 4h, and 16 h, and total DNA adducts, including the AFB1 N7Gua and AFB1 Fapy adducts, were quantified (Figure 6C). After 4 h exposure to 200 nmol/L AFB1, total DNA adduct levels increased approximately fourfold relative to 2 h treatment. The maximum adduct burden reached approximately 1.2 adducts per 1000 kb of DNA at 16 h following a single exposure. Statistical analysis (one-way ANOVA followed by Dunnett’s test, p < 0.001 at 4 h and p < 0.05 at 16 h) confirmed significant increases in adduct formation relative to the 2 h reference time point. These results provide direct biochemical evidence that AFB1 is rapidly bioactivated in VERO-E6 cells, resulting in the formation of canonical genotoxic DNA lesions.
2.7. AFB1 Induces Time- and Dose-Dependent Cytotoxicity
Consistent with the DNA adduct data, AFB1 exposure caused pronounced cytotoxicity in VERO-E6 cells. Dose- and time-dependent reductions in viability were observed, with approximately 50 % lethality by 14 d after prolonged exposure to 200 nmol/L AFB1 (Figure 6A-B). The data indicated that AFB1 exposure not only killed cells but also reduced cell number. This delayed cytotoxic response is similar to that reported in hepatocyte-based models, in which toxicity is mainly linked to the accumulation of reactive metabolites rather than to direct chemical damage (Kensler et al., 2011) [15]. We used a two-tailed Welch’s t-test to compare the AFB1-treated groups with their respective DMSO controls at each time point. At 5 nmol/L, AFB1 caused a small but significant decrease in cell numbers at 6 d (p = 0.029) and again at 14 d (p = 0.027), while no clear change was observed at 10 d (p = 0.469). At the higher dose of 100 nmol/L, a reduction in cell number was seen at later time points, with significant decreases at 10 d (p = 1.46 × 10⁻⁴) and 14 d (p = 4.90 × 10⁻⁵). In contrast, there was no noticeable effect at 6 d (p = 0.806). The strongest effects were seen at 200 nmol/L, where cell number was significantly reduced at all time points—6 d (p = 7.65 × 10⁻⁵), 10 d (p = 5.54 × 10⁻⁴), and 14 d (p = 1.71 × 10⁻⁶). A similar pattern was observed for percent viability. At 5 nmol/L AFB1, we did not see much difference from DMSO at 6 d or 10 d, but by 14 d, there was a small decrease in viability (p = 0.006). In contrast, both 100 nmol/L and 200 nmol/L AFB1 reduced viability at all exposure times (p < 0.05). Overall, the effect clearly depends on both dose and time. One thing we noticed is that the cell number started to drop before we saw a clear decrease in viability, which suggests that AFB1 may first slow down cell growth and then lead to more obvious cell death.
3. Discussion
The present study integrates molecular, structural, computational, and biochemical approaches to evaluate the metabolic competence of VERO-E6 cells for AFB1 bioactivation. From our results, these cells express key xenobiotic-metabolizing genes, including CYP3A7, CYP3A4, and CYP3A5. From the predicted structures using AI-based tools, we observed that these enzymes still maintain the typical cytochrome P450 fold and can accommodate AFB1 in orientations that may support catalytic activation. While AI-based modeling can identify binding orientations that are compatible with the generation of the reactive exo-8,9-epoxide intermediate, it cannot predict the formation of DNA adducts since the epoxide can be catalyzed to less reactive intermediates if additional detoxification enzymes are present. The formation of the reactive intermediate was supported by the experimental detection of AFB1-derived DNA adducts, which provides indirect but definitive evidence that the reactive epoxide intermediate was formed in VERO-E6 cells. This study indicates that combining AI-based characterization of CYP-AFB1 interactions within silico toxicology and experimental validation provides an effective approach for determining xenobiotic metabolism in systems where direct enzymatic characterization is limited. Based on our results, VERO-E6 cells can support CYP-mediated activation of AFB1 and may serve as a useful model for studying xenobiotic metabolism. To our knowledge, this is the first study that combines AI-based structural prediction with experimental detection of AFB1-derived DNA adducts in VERO-E6 cells.
Here, we used AI-based structural modeling and molecular docking to explore CYP-mediated metabolic activation, especially since detailed biochemical data for this system are limited. In VERO-E6 cells, although CYP gene expression can be detected, the lack of purified enzymes and limited functional data make it difficult to directly study enzyme–substrate interactions using conventional methods. Using AI-predicted protein structures, we were able to model the three-dimensional organization of VERO CYP enzymes and examine the active site in more detail. With molecular docking, we looked more closely at how AFB1 might interact with these enzymes—specifically how it sits in the binding pocket, which residues are nearby, and how close it gets to the heme iron. For example, we determined whether the reactive C8–C9 double bond of AFB1 could be positioned within the substrate binding site in a manner that would preferentially favor epoxide formation.. At the same time, there are some limitations with this approach. In most docking methods, the protein is treated as rigid, which does not reflect all dynamic structures (Lee et al., 2025) [27]. We also noticed that scoring functions can sometimes rank poses as favorable just based on energy, even if those poses are not likely to be relevant for catalysis (Desta et al., 2020) [28]. Because of this, binding affinity alone is not enough to predict metabolic activation.
Another limitation is that these computational methods do not give any information how the biological context of the enzyme can affect activity Zanger & Schwab., 2013) [19]. In cells, CYP activity is influenced by factors that are not accounted for by the folded structure predicted by the primary sequence, including-translational modifications, orientation and of the enzyme within the endoplasmic reticulum membrane, its interaction with cytochrome P450 oxidoreductase (POR), and the local membrane environment. From the structural and docking analysis, CYP3A4 is best suitable to bindAFB1 in the most favorable position for epoxidation. However, additional functional studies would be needed to determine which CYP isoform is mainly responsible for this activity in VERO-E6 cells..
When we compared the human and VERO CYP3A enzymes, we observed high sequence and structural similarity, particularly in the catalytic core and heme-binding region. We also saw those important motifs for enzyme activity, such as the conserved cysteine for heme binding and the substrate recognition sites, were present in both species. This points to the enzymes working in an equivalent way. We also noticed some differences in the N-terminal region, which engages in membrane anchoring and may influence how the enzyme is positioned in the endoplasmic reticulum (Denisov et al., 2005) [29]. We also noticed variations in the B–C and F–G loop regions. These regions are quite flexible and seem to be involved in how substrates get into the active site. Because of that, any differences here are more likely to affect how the substrate enters, rather than the catalytic step itself (Yan & Hirao., 2026, Li et al., 2022, Urban et al., 2018)[30,31,32].
The CYP3A family is important for xenobiotic metabolism, and CYP3A4, in particular, is involved in the metabolism of many commonly used drugs (Zanger & Schwab., 2013) [19]. Based on the level of structural similarity we observed, it seems likely that VERO CYP3A enzymes can also interact with different xenobiotics in a way that is comparable to human CYPs. AI-predicted structures and docking can be used to explore how different compounds, such as mycotoxins, environmental contaminants, pharmaceuticals, and industrial chemicals, might interact with metabolic enzymes (Jumper et al., 2021, Stokes et al., 2020) [22,33]. This makes it possible to quickly screen enzyme–substrate interactions, identify binding modes that could be relevant for catalysis, and decide which compounds are worth testing experimentally.
Going forward, this approach could be improved by including molecular dynamics simulations, using better scoring methods, and combining these results with transcriptomic or proteomic data to get a more complete picture of metabolic capacity.. From the RT-qPCR data, we detected expression ofCYP3A5, CYP3A7 and CYP3A4 but not CYP1A2. This underscores the importance of these CYP3A in AFB1 activation but does not preclude that CYP1A2 activity is important at low AFB1 exposure levels (Guengerich et al., 2002, Gallagher et al., 1996)[16,34]. However, we do not know which additional detoxification enzymes, such as glutathione S-transferases, interact with these CYPs to modulate AFB1 adduct formation in VERO-E6 cells, nor the full range of AFB1 metabolites that are generated that may contribute to toxicity.
4. Conclusions
Here, we showed that AFB1 is metabolically activated in VERO-E6 by detecting AFB1-derived DNA adducts. Although VERO-E6 cells do not fully represent hepatic metabolism, they still serve as a useful and responsive system for studying how cells respond to toxicants. Based on the combination of AI computational modeling of enzyme structure and substrate binding, and CYP gene expression, we suggest that bioactivation is mediated by encoded CYP enzymes. Our results indicate that metabolic activation cannot be explained by enzyme expression or binding affinity alone. Instead, the orientation of the substrate within the catalytic site, especially the positioning of the reactive C8–C9 bond relative to the heme iron, plays a critical role. This approach can also be used for other compounds, including environmental toxicants and pharmaceuticals, to better understand how they are metabolized. This study thus provides a way to study xenobiotic metabolism in cell systems where detailed biochemical information is limited.
5. Materials and Methods
5.1. Chemicals and Media
AFB1 was purchased from Sigma and dissolved in dimethyl sulfoxide (DMSO) at a concentration of 10 mg/mL and stored at 4 °C. The Dulbecco’s Modified Eagle Medium (DMEM) medium was purchased from CellTreat. Fetal bovine serum (FBS) was purchased from MidSci.
5.2. Cell Lines and Toxicity Assays
VERO-E6 cells were purchased from the American Type Culture Collection (ATCC). Cells were cultured in DMEM high glucose, 5 % Fetal Bovine Serum, and penicillin/streptomycin and incubated at 37 °C, 5 % CO2. To assess the toxicity in VERO E6 cells with different toxicants, 50 000 cells were seeded per well in a 6-well plate and allowed to attach overnight. Cells were then treated with AFB1 (DMSO, 5 nmol/L,100 nmol/L, 200 nmol/L) for 6 days, 10 days, or 14 days, with media changes every third day, and fresh AFB1 at the indicated concentrations was re-added with each media change. After exposure, cells were rinsed with PBS, trypsinized, and counted using a hemocytometer to determine the total cell count. Cell lethality was measured using trypan blue (0.4 %, 1:1), a dye that stains non-viable cells. Each experiment was conducted in triplicate to ensure consistent results. To evaluate the effects of AFB1 concentration and exposure time on cell proliferation and viability, statistical analysis was performed at each time point (6 days, 10 days, and 14 days). AFB1-treated groups (5 nmol/L, 100 nmol/L, and 200 nmol/L) were compared with the corresponding DMSO control. Differences between groups were analyzed using Welch’s two-tailed t-test, which is suitable for comparing independent groups when variances may differ. Statistical significance was considered at p < 0.05. (Motulsky et al., 2018)[35]
5.3. Quantitative RT-PCR
Total RNA was isolated from cells using Trizol reagent (1 mL per 5 × 10⁶ cells) following standard procedures (Chomczynski and Mackey., 1995)[36]. Briefly, phase separation was conducted using chloroform, followed by centrifugation at 11 500 rpm for 15 min at 4 °C. The aqueous phase was collected, and RNA was precipitated using 0.5 mL of isopropanol. The resulting pellet was washed with 75 % ethanol, air-dried, and then resuspended in nuclease-free water. To remove any remaining genomic DNA, the samples were treated with DNase I (Thermo Scientific, Lot# 2893971).
Quantitative RT-PCR was then conducted using the Power SYBR Green RNA-to-CT One-Step Kit (Applied Biosystems, Lot# 1707101) on a Step OnePlus Real-Time PCR System (Applied Biosystems). Each reaction contained 300 ng RNA in a final volume of 20 µL and was performed in 96-well plates according to the manufacturer’s instructions. The cycling program consisted of reverse transcription at 48 °C for 30 min, an initial denaturation at 95 °C for 10 min, followed by 50 cycles of 95 °C for 15 s, 56 °C for 15 s, and 60 °C for 1 min. A final extension was performed at 60 °C for 10 min.
During amplification, SYBR Green fluorescence was measured at each PCR cycle using the StepOnePlus Real-Time PCR System. The cycle threshold (Ct) was defined as the PCR cycle number at which the fluorescence signal from the amplified product crossed a fixed threshold above background fluorescence. Ct values were automatically calculated by the instrument software using the same threshold settings across samples. Lower Ct values indicate higher starting mRNA abundance because fewer amplification cycles are required for the fluorescence signal to reach the threshold. GAPDH was used as the housekeeping reference gene for comparison of relative transcript abundance.
cDNA amplification was performed using gene-specific primers. The following forward (F) and reverse (R) primers were used: CYP3A4 (F: 5′-AAACAAAAGCACCGAGTGGA-3′; R: 5′-GGAGAGTGGTGCTAGTTGTG-3′), CYP3A7 (F: 5′-ACTGTCTACAGCCTGTGCCTGG-3′; R: 5′-TGAGCTCTAGAGAGGGCACTT-3′), CYP1A2 (F: 5′GCACAACAAGGGACACAACA-3′; R: 5′-TCCAGTTGCTGTAGCAGGATG-3′), CYP1B1 (F:5′ATCCCAATTCAAGCGCTCCT-3′; R: 5′-TGGTGCTCATGCTGCGG-3′), CYP3A5 (F: 5′-CAGCCTGGTGCTCCTCTATC-3′; R: 5′-ACCATCTTGCGTTCTCCACAT-3′), The resulting cDNA products are in range of 150 bp to 200 bp for Glyceraldehyde-3- phosphate dehydrogenase (GAPDH), CYP3A5, CYP1B1, CYP3A7, CYP3A4 and 270 bp for CYP1A2.
Statistical analysis of RT-qPCR data was performed using paired two-tailed Student’s t-tests comparing Ct values of CYP genes with the endogenous control GAPDH. Results are presented as mean ± standard deviation from three technical replicates, and p < 0.05 was considered statistically significant.
5.4. Detection and Quantification of Aflatoxin B1 (AFB1)–Derived DNA Adducts
The metabolically active form of AFB1, the AFB1 exo-8,9-epoxide, reacts with the N7 group of guanine to form the AFB1 N7-Gua adducts (Figure 1). The AFB1 N7-Gua adduct is highly unstable and converts to trans-AFB1-FAPY-Gua adducts, with the combined levels representing the total DNA adducts (Dohnal et al., 2014)[37]. To assess metabolic activation of AFB1, we quantified total AFB1-associated DNA adducts in exposed cells. Approximately 2 × 10⁷ VERO-E6 cells were cultured in T75 flasks and exposed to 200 nmol/L AFB1 for 2 h, 4 h, or 16 h. After treatment, cells were rinsed twice with phosphate-buffered saline (PBS), detached using trypsin, and washed again with PBS. Genomic DNA was purified using a magnetic bead-based extraction procedure according to the manufacturer’s recommendations (Gen Find V3 mammalian DNA extraction kit). DNA was precipitated with 0.1 mol/L ammonium acetate in 70 % ethanol and resuspended in ethanol for concentration determination. The isolated DNA was then subjected to acid hydrolysis, and AFB1-associated adducts were quantified by liquid chromatography–tandem mass spectrometry as previously reported by (Pawel et al., 2023)[38]. Data represents replicate measurements from independent biological experiments. For time-course studies, total DNA adduct levels were analyzed using one-way analysis of variance (ANOVA) to assess the effect of time. When significance was detected (p < 0.05), Dunnett’s post hoc test was performed to compare each time point with the 2 h reference condition. (Zar et al., 2010, Montgomery et al., 2019)[39,40].
5.5. Computational Modeling and Docking Methodology
Protein structures for CYP3A4, CYP3A5, AND CYP3A7 from C. sabeus were predicted using Alphafold3 to enable structural analysis in the absence of experimentally resolved VERO CYP structures (Jumper et al., 2021)[21]. We used AlphaFold3 to generate structural models of the VERO CYP enzymes, which we then used for computational analysis. Without these structures, it would have been difficult to do the docking or make sense of the interactions.
These models also helped with the docking in AutoDock Vina, since they gave us a better idea of what the proteins look like. As a result, we were able to obtain more consistent predictions for both binding affinity and ligand orientation within the active site. This also allowed us to look more closely at protein–ligand interactions, including identifying key residues involved in binding and checking how close the ligand is to the heme iron (Fe), which is important for catalytic activity in cytochrome P450 enzymes. Details of the individual steps, including protein preparation, ligand processing, docking setup, and interaction analysis, are described in Sections 2.5.1–2.5.6.
5.5.1. Protein Sequence Retrieval and Structural Prediction
We obtained the amino acid sequences of cytochrome P450 enzymes from C. sabaeus from the NCBI protein database. To compare them with human sequences, we ran pairwise alignments between the C. sabaeus and H. sapiens CYP3A isoforms using BLASTP from the NCBI BLAST suite. This allowed us to look at sequence identity, similarity, and whether there were any insertions or deletions (Altschul et al., 1990)[41].
For the structural predictions, we used the default settings and selected the models with the highest confidence scores (pLDDT) for further analysis. The structures were downloaded into CIF format and then converted to PDB format using Python-powered Molecular olet-modeling system (PyMOL). After that, we looked at the structures to make sure the overall folding and key features appeared reasonable.
5.5.2. Heme Transfer and Template Preparation
We retrieved the experimentally determined crystal structures of the corresponding human CYP enzymes from the Protein Data Bank (PDB) (Berman et al., 2000)[42] and used them as a reference for placing the heme group, since their active sites and iron coordination are well characterized. During preparation, we removed other ligands and solvent molecules, while keeping the heme and the key residues around it. The AlphaFold-predicted VERO CYP structures were then aligned with the human CYP structures in PyMOL using the Cα backbone atoms. This helped bring both structures into the same frame, so we could compare conserved features more easily, including the cysteine residue that coordinates the heme iron. Following alignment, the heme cofactor was transferred from the human CYP structure to the Vero CYP model. The Fe–S distance between the heme iron and coordinating cysteine was measured to confirm proper coordination geometry. The resulting heme-bound structures were saved as docking-ready models.
5.5.3. Protein and Ligand Preparation for Docking
We used a structure-based docking approach to look at how Aflatoxin B1 (AFB1) interacts with CYP3A4, CYP3A5, and CYP3A7. During protein preparation, we removed most of the crystallographic water molecules, except for those close to the heme or involved in ligand interactions. The heme group was kept in place. We also fixed duplicate side chains using PyMOL and MGLTools (Rosignoli & Paiardini., 2022)[43]. After that, polar hydrogens were added, Kollman charges were assigned, and the final structures were converted to Protein Data Bank, Quantum and Torsions (PDBQT) format for docking in AutoDock Vina.
The three-dimensional structure of AFB1 was obtained from the PubChem database. Hydrogen atoms were then added, and Gasteiger charges were assigned. The ligand was then converted to PDBQT format, and rotatable bonds were defined for docking in AutoDock Vina.
5.5.4. Docking Site Definition
For docking, we centered the search space on the heme iron in the active site. We used a cubic grid box of 4 nm × 4 nm × 4 nm (40 Å × 40 Å × 40 Å) so that both the catalytic pocket and nearby regions involved in ligand entry and stabilization were included.
This grid size was chosen so that both the active site and nearby regions, such as subpockets and possible access pathways, were included, without making the calculations unnecessarily large. Using this setup, we could check how the ligand sits in the active site, how it interacts with surrounding residues, and whether its orientation is suitable for catalytic activity.
5.5.5. Docking Protocol
Docking simulations were conducted using AutoDock Vina (Eberhardt et al; 2021) [44]. To get better sampling, we ran the docking multiple times using different random seeds. In each run, up to 20 poses were generated within an energy range of 16.73 kJ/mol (4 kcal/mol). The exhaustiveness parameter was increased to 32 (default = 8) so that the program could explore a wider range of ligand conformations and provide more consistent docking results.
5.5.6. Post-Docking Structural Analysis
We looked at the docking poses in PyMOL to see how the ligand sits in the active site, which residues are around it, and how close the reactive C8–C9 atoms are to the heme iron (Rosignoli & Paiardini., 2022) [43]. The C8 and C9 atoms were marked so we could track their positions, and distances from these atoms to the heme iron were measured to determine whether the orientation could support CYP-mediated activation. We also looked at which residues were within about 0.5 nm (5 Å) of the ligand to better understand the binding environment. The distances between the C8–C9 region and the heme iron were measured and, where needed, averaged so we could compare different poses. Dashed lines were mainly used for visualization, which made it easier to see how the ligand sits relative to the catalytic center. To narrow down the most relevant poses, we considered a combination of docking scores, distance measurements, and the surrounding residues. In practice, we focused on poses that showed both a reasonable binding score and a C8–C9 distance of around 0.6 nm (6 Å) or less from the heme iron, since this distance is generally needed for epoxide formation.
NIST Disclaimer
Certain equipment, instruments, software, or materials are identified in this paper in order to specify the experimental pro-cedure adequately. Such identification is not intended to imply recommendation or endorsement of any product or ser-vice by NIST, nor is it intended to imply that the materials or equipment identified are necessarily the best available for the purpose. This work with the Project no. MML-16–0016 and with the Material Transfer Agreement no. MTA-16–0016 between The State University of New York at Albany (University at Albany) and NIST was reviewed and approved by the Office of Technology Transfer of the University at Albany, Research Protection Office, and the Technology Part-nership Office of NIST.
Supplementary Materials
The following supporting information can be downloaded at the website of this paper posted on Preprints.org.
Author Contributions
Author information removed for double blind peer review.
Funding
This work was supported by grant support from the National Institute of Environmental and Health Sciences, R15ES023685 and from the Center for Advancement of Technology in Nanomaterials and Nanoelectronics (CATN2), and the Grenander Award.
Data Availability Statement
All the primary data can be obtained by request to the corresponding author.
Acknowledgments
We acknowledge XXX for his efforts to expedite protocols for extracting DNA from carcinogen-exposed cells.
Conflicts of Interest
The authors declare no conflicts of interest.
Abbreviations
| AFB1 | aflatoxin B1 |
| CYP | cytochrome P450 |
| AI | Artificial Intelligence |
| ANOVA | Analysis of Variance |
| ATCC | American Type Culture Collection |
| BE | Binding Energy |
| BLAST | Basic Local Alignment Search Tool |
| BLASTP | Protein Basic Local Alignment Search Tool |
| Ct / CT | Cycle Threshold |
| DMSO | Dimethyl Sulfoxide |
| ERK1/2 | Extracellular Signal-Regulated Kinase ½ |
| GAPDH | Glyceraldehyde-3-Phosphate Dehydrogenase |
| HAAs | Heterocyclic Aromatic Amines |
| LC–MS/MS | Liquid Chromatography–Tandem Mass Spectrometry |
| OTA | Ochratoxin A |
| PCR | Polymerase Chain Reaction |
| qPCR | Quantitative Polymerase Chain Reaction |
| ROS | Reactive Oxygen Species |
| SRS | Substrate Recognition Site |
| MDPI | Multidisciplinary Digital Publishing Institute |
| mRNA | Messenger RNA |
References
- Ammerman, N.C.; Beier-Sexton, M.; Azad, A.F. Growth and maintenance of Vero cell lines. Curr. Protoc. Microbiol. Appendix 4E. 2008, Appendix 4. [Google Scholar] [PubMed]
- Barrett, P.N.; Mundt, W.; Kistner, O.; Howard, M.K. Vero cell platform in vaccine production: moving towards cell culture-based viral vaccines. Expert Rev. Vaccines 2009, 8, 607–618. [Google Scholar] [CrossRef] [PubMed]
- Costa, J.G.; Saraiva, N.; Guerreiro, P.S.; Louro, H.; Silva, M.J.; Miranda, J.P.; et al. Ochratoxin A-induced cytotoxicity, genotoxicity and reactive oxygen species in kidney cells: role of oxidative stress. Toxicol. Vitr. 2016, 36, 213–220. [Google Scholar]
- Osada, N.; Kohara, A.; Yamaji, T.; Hirayama, N.; Kasai, F.; Sekizuka, T.; et al. The genome landscape of the African green monkey kidney-derived Vero cell line. DNA Res. 2014, 21, 673–683. [Google Scholar] [CrossRef] [PubMed]
- Sène, A.; Imamura, H.; Ito, M.; Kato, T.; et al. The African green monkey genome and its use in biomedical research. Front. Genet. 2021, 12, 675886. [Google Scholar]
- Gómez-Lechón, M.J.; Tolosa, L.; Conde, I.; Donato, M.T. Competency of different cell models to predict human hepatotoxicity. Expert Opin. Drug Metab. Toxicol. 2010, 6, 1553–1568. [Google Scholar]
- Alverca, E.; Andrade, M.; Dias, E.; Sam-Bento, F.; Batoreu, M.C.; Jordão, L.; et al. Morphological and ultrastructural effects of microcystin-LR from Microcystis aeruginosa extract on a kidney cell line. Toxicon 2009, 54, 283–294. [Google Scholar] [CrossRef] [PubMed]
- Dias, E.; Matos, P.; Pereira, P.; Batoreu, M.C.; Silva, M.J.; Jordão, L. Microcystin-LR activates the ERK1/2 kinases and stimulates the proliferation of the monkey kidney-derived cell line Vero-E6. Toxicol. Vitr. 2010, 24, 1689–1695. [Google Scholar]
- Menezes, C.; Alverca, E.; Dias, E.; Sam-Bento, F.; Pereira, P. Involvement of mitochondria in microcystin-LR toxicity in Vero-E6 cells. Toxicon 2013, 70, 1–9. [Google Scholar]
- Costa, J.G.; Saraiva, N.; Guerreiro, P.S.; Louro, H.; Silva, M.J. The protective effect of MnTnHex-2-PyP against ochratoxin A-induced toxicity. Toxicol. Lett. 2015, 238, 113–121. [Google Scholar]
- El Golli-Bennour, E.; Bacha, H.; Hassen, W. Combined effects of aflatoxin B1 and ochratoxin A in Vero cells: cytotoxicity and genotoxicity. Toxicology 2010, 270, 34–40. [Google Scholar]
- Liao, C.M.; Chen, S.C.; Lin, T.L.; Chio, C.P. Risk assessment of disinfection by-products in drinking water using Vero cell bioassays. Sci. Total Environ. 2010, 408, 1825–1832. [Google Scholar]
- Perryman, A.L.; Stratton, T.P.; Ekins, S. Predicting toxicity using Bayesian models and cell-based assay data. J. Chem. Inf. Model. 2018, 58, 1184–1193. [Google Scholar]
- Warren, W.C.; Jasinska, A.J.; García-Pérez, R.; et al. The genome of the vervet (Chlorocebus aethiops sabaeus). Nat. Genet. 2015, 47, 635–643. [Google Scholar]
- Kensler, T.W.; Roebuck, B.D.; Wogan, G.N.; Groopman, J.D. Aflatoxin: a 50-year odyssey of mechanistic and translational toxicology. Toxicol. Sci. 2011, 120, S28–S48. [Google Scholar] [PubMed]
- Guengerich, F.P.; Johnson, W.W.; Shimada, T.; Ueng, Y.F.; Yamazaki, H.; Langouët, S. Activation and detoxication of aflatoxin B1. Mutat. Res. 2002, 402, 121–128. [Google Scholar]
- Bader, A.; Hansen, T.; Kirschning, A.; et al. non-hepatic cell models and their metabolic competence. Biotechnol. Adv. 2019, 37, 107407. [Google Scholar]
- Guengerich, F.P. Cytochrome P450 and chemical toxicology. Chem. Res. Toxicol. 2008, 21, 70–83. [Google Scholar] [PubMed]
- Zanger, U.M.; Schwab, M. Cytochrome P450 enzymes in drug metabolism: regulation of gene expression, enzyme activities, and impact of genetic variation. Pharmacol. Ther. 2013, 138, 103–141. [Google Scholar] [CrossRef] [PubMed]
- Petiot, E.; Jacob, D.; Lanthier, S.; Lohr, V.; Ansorge, S.; Kamen, A.A. Kinetic characterization of Vero cell metabolism in a serum-free medium. Biotechnol. Bioeng. 2010, 107, 304–314. [Google Scholar] [CrossRef] [PubMed]
- Dohnal, V.; Wu, Q.; Kuča, K. Metabolism of aflatoxins: Key enzymes and interindividual as well as interspecies differences. Arch. Toxicol. 2014, 88, 1635–1644. [Google Scholar] [CrossRef] [PubMed]
- Jumper, J.; Evans, R.; Pritzel, A.; Green, T.; Figurnov, M.; Ronneberger, O.; et al. Highly accurate protein structure prediction with AlphaFold. Nature 2021, 596, 583–589. [Google Scholar] [CrossRef] [PubMed]
- Hsu, M.H.; Savas, U.; Johnson, E.F. The X-ray crystal structure of the human mono-oxygenase cytochrome P450 3A5-ritonavir complex reveals active site differences between P450s 3A4 and 3A5. Mol. Pharmacol. 2018, 93, 14–24. [Google Scholar] [PubMed]
- Wang, J.; Nithianantham, S.; Chai, S.C.; et al. Decoding the selective chemical modulation of CYP3A4. Nat. Commun. 2025, 16, 3423. [Google Scholar] [CrossRef] [PubMed]
- Liu, J.; Kandel, S.E.; Lampe, J.N.; Scott, E.E. Human cytochrome P450 3A7 binding four copies of its native substrate dehydroepiandrosterone 3-sulfate. J. Biol. Chem. 2023, 299, 104993. [Google Scholar] [CrossRef] [PubMed]
- Ekroos, M.; Sjögren, T. Structural basis for ligand promiscuity in cytochrome P450 3A4. Proc. Natl. Acad. Sci. USA 2006, 103, 13682–13687. [Google Scholar] [CrossRef] [PubMed]
- Lee, J.; Nguyen, C.H.; Mamitsuka, H. Beyond rigid docking: Deep learning approaches for fully flexible protein–ligand interactions. Brief. Bioinform. 2025, 26, bbaf454. [Google Scholar] [CrossRef] [PubMed]
- Desta, I.T.; Porter, K.A.; Xia, B.; Kozakov, D.; Vajda, S. Performance and its limits in rigid body protein–protein docking. Structure 2020, 28, 1071–1081.e3. [Google Scholar] [PubMed]
- Denisov, I.G.; Makris, T.M.; Sligar, S.G.; Schlichting, I. Structure and chemistry of cytochrome P450. Chem. Rev. 2005, 105, 2253–2277. [Google Scholar] [CrossRef] [PubMed]
- Yan, J.; Hirao, H. Molecular dynamics simulations elucidate the role of the F–F′ loop in substrate entry into CYP3A4. Commun. Chem. 2026, 9, 17. [Google Scholar] [CrossRef] [PubMed]
- Li, Z.; Meng, S.; Nie, K.; Schwaneberg, U.; Davari, M.D.; Xu, H.; Ji, Y.; Liu, L. Flexibility regulation of loops surrounding the tunnel entrance in cytochrome P450 enhanced substrate access substantially. ACS Catal. 2022. [Google Scholar] [CrossRef]
- Urban, P.; Lautier, T.; Pompon, D.; Truan, G. Ligand access channels in cytochrome P450 enzymes: A review. Int. J. Mol. Sci. 2018, 19, 1617. [Google Scholar] [CrossRef] [PubMed]
- Stokes, J.M.; Yang, K.; Swanson, K.; Jin, W.; Cubillos-Ruiz, A.; Donghia, N.M.; et al. A deep learning approach to antibiotic discovery. Cell 2020, 180, 688–702.e13. [Google Scholar] [CrossRef] [PubMed]
- Gallagher, E.P.; Kunze, K.L.; Stapleton, P.L.; Eaton, D.L. The kinetics of aflatoxin B1 oxidation by human cDNA-expressed and human liver microsomal cytochromes P450. Toxicol. Appl. Pharmacol. 1996, 141, 595–606. [Google Scholar] [PubMed]
- Motulsky, H.J. Intuitive Biostatistics: A Nonmathematical Guide to Statistical Thinking, 4th ed.; Oxford University Press: New York, NY, USA, 2018. [Google Scholar]
- Chomczynski, P.; Mackey, K. Modification of the TRI reagent procedure for isolation of RNA from polysaccharide- and proteoglycan-rich sources. Biotechniques 1995, 19, 942–945. [Google Scholar] [PubMed]
- Dohnal, V.; Wu, Q.; Kuča, K. Metabolism of aflatoxins: Key enzymes and interindividual as well as interspecies differences. Arch. Toxicol. 2014, 88, 1635–1644. [Google Scholar] [CrossRef] [PubMed]
- Jaruga, P.; Tomar, R.; Kant, M.; Vartanian, V.; Sexton, B.; Rizzo, C.J.; Turesky, R.J.; Stone, M.P.; Lloyd, R.S.; Dizdaroglu, M. Synthesis and characterization of ¹⁵N₅-labeled aflatoxin B1–formamidopyrimidines and aflatoxin B1–N7-guanine from a partial double-stranded oligodeoxynucleotide as internal standards for mass spectrometric measurements. ACS Omega 2023, 8, 14841–14854. [Google Scholar] [CrossRef] [PubMed]
- Zar, J.H. Biostatistical Analysis, 5th ed.; Prentice Hall: Upper Saddle River, NJ, USA, 2010. [Google Scholar]
- Montgomery, D.C. Design and Analysis of Experiments, 10th ed.; Wiley: Hoboken, NJ, USA, 2019. [Google Scholar]
- Altschul, S.F.; Gish, W.; Miller, W.; Myers, E.W.; Lipman, D.J. Basic local alignment search tool. J. Mol. Biol. 1990, 215, 403–410. [Google Scholar] [CrossRef]
- Berman, H.M.; Westbrook, J.; Feng, Z.; Gilliland, G.; Bhat, T.N.; Weissig, H.; et al. The Protein Data Bank. Nucleic Acids Res. 2000, 28, 235–242. [Google Scholar] [CrossRef] [PubMed]
- Rosignoli, S.; Paiardini, A. Boosting the full potential of PyMOL with structural biology plugins. Biomolecules 2022, 12, 1764. [Google Scholar] [CrossRef] [PubMed]
- Eberhardt, J.; Santos-Martins, D.; Tillack, A.F.; Forli, S. AutoDock Vina 1.2.0: New docking methods, expanded force field, and Python bindings. J. Chem. Inf. Model. 2021. [Google Scholar] [CrossRef]
Figure 1.
Aflatoxin B1 (AFB1) undergoes enzymatic biotransformation through multiple oxidative and reductive pathways. Hydroxylation reactions produce AFM1, AFQ1, and AFP1, while reduction yields aflatoxicol (AFL). Cytochrome P450–mediated epoxidation at the 8,9-double bond generates the reactive intermediate AFB1-8,9-epoxide, which can be detoxified via hydrolysis to AFB1-8,9-dihydrodiol or react with DNA to form the mutagenic AFB1-N7-guanine adduct (Dohnal et al., 2014) [21].
Figure 1.
Aflatoxin B1 (AFB1) undergoes enzymatic biotransformation through multiple oxidative and reductive pathways. Hydroxylation reactions produce AFM1, AFQ1, and AFP1, while reduction yields aflatoxicol (AFL). Cytochrome P450–mediated epoxidation at the 8,9-double bond generates the reactive intermediate AFB1-8,9-epoxide, which can be detoxified via hydrolysis to AFB1-8,9-dihydrodiol or react with DNA to form the mutagenic AFB1-N7-guanine adduct (Dohnal et al., 2014) [21].
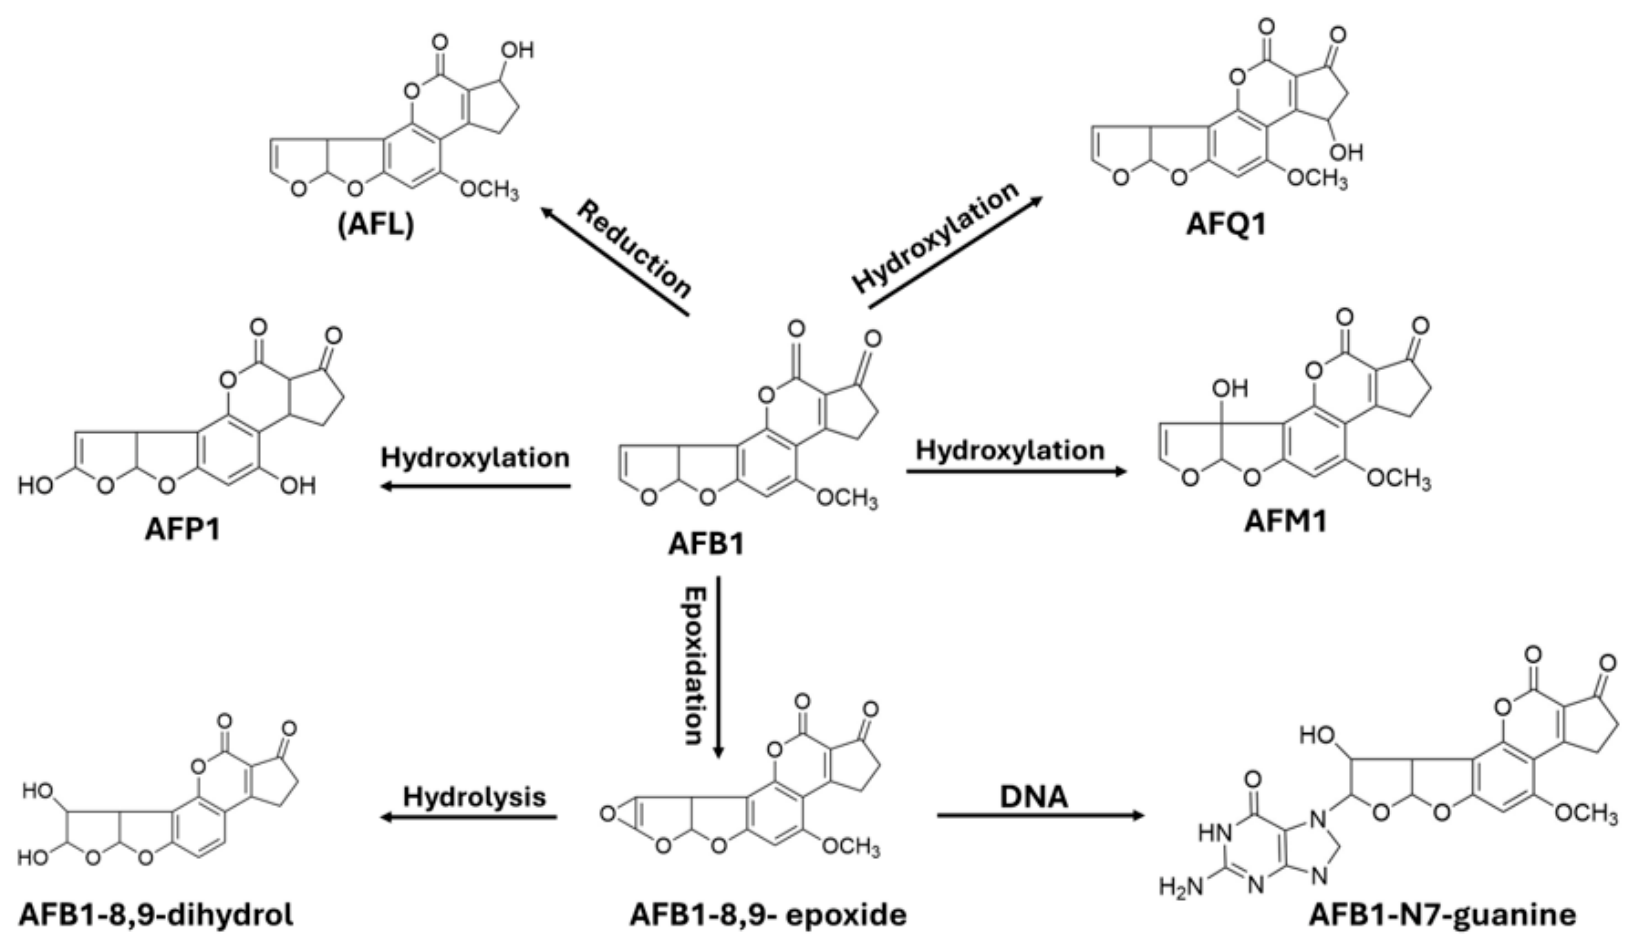
Figure 2.
(A–C) Amplification curves showing fluorescence signal (ΔRn) versus cycle number for CYP3A4 (A), CYP3A5 (B), and CYP3A7 (C) following reverse transcription of mRNA isolated from VERO E6 cells, with GAPDH used as the endogenous control. Amplification of all three CYP3A transcripts confirms that VERO E6 cells express CYP3A4, CYP3A5, and CYP3A7. GAPDH amplifies at earlier cycles, reflecting higher transcript abundance relative to the CYP3A isoforms. CYP3A4 and CYP3A5 display similar amplification profiles, whereas CYP3A7 amplifies later, suggesting comparatively lower expression. (D) Cycle threshold (Ct) analysis supports these findings, showing comparable Ct values for CYP3A4 and CYP3A5 and a higher Ct value for CYP3A7, consistent with reduced transcript abundance. Statistical comparison of Ct values with GAPDH using paired two-tailed t-tests showed significant differences for CYP3A5 (p < 0.01), CYP3A4 (p < 0.05), and CYP3A7 (p < 0.01), with CYP3A7 showing the greatest Ct difference from GAPDH. Data represent mean ± SD.
Figure 2.
(A–C) Amplification curves showing fluorescence signal (ΔRn) versus cycle number for CYP3A4 (A), CYP3A5 (B), and CYP3A7 (C) following reverse transcription of mRNA isolated from VERO E6 cells, with GAPDH used as the endogenous control. Amplification of all three CYP3A transcripts confirms that VERO E6 cells express CYP3A4, CYP3A5, and CYP3A7. GAPDH amplifies at earlier cycles, reflecting higher transcript abundance relative to the CYP3A isoforms. CYP3A4 and CYP3A5 display similar amplification profiles, whereas CYP3A7 amplifies later, suggesting comparatively lower expression. (D) Cycle threshold (Ct) analysis supports these findings, showing comparable Ct values for CYP3A4 and CYP3A5 and a higher Ct value for CYP3A7, consistent with reduced transcript abundance. Statistical comparison of Ct values with GAPDH using paired two-tailed t-tests showed significant differences for CYP3A5 (p < 0.01), CYP3A4 (p < 0.05), and CYP3A7 (p < 0.01), with CYP3A7 showing the greatest Ct difference from GAPDH. Data represent mean ± SD.
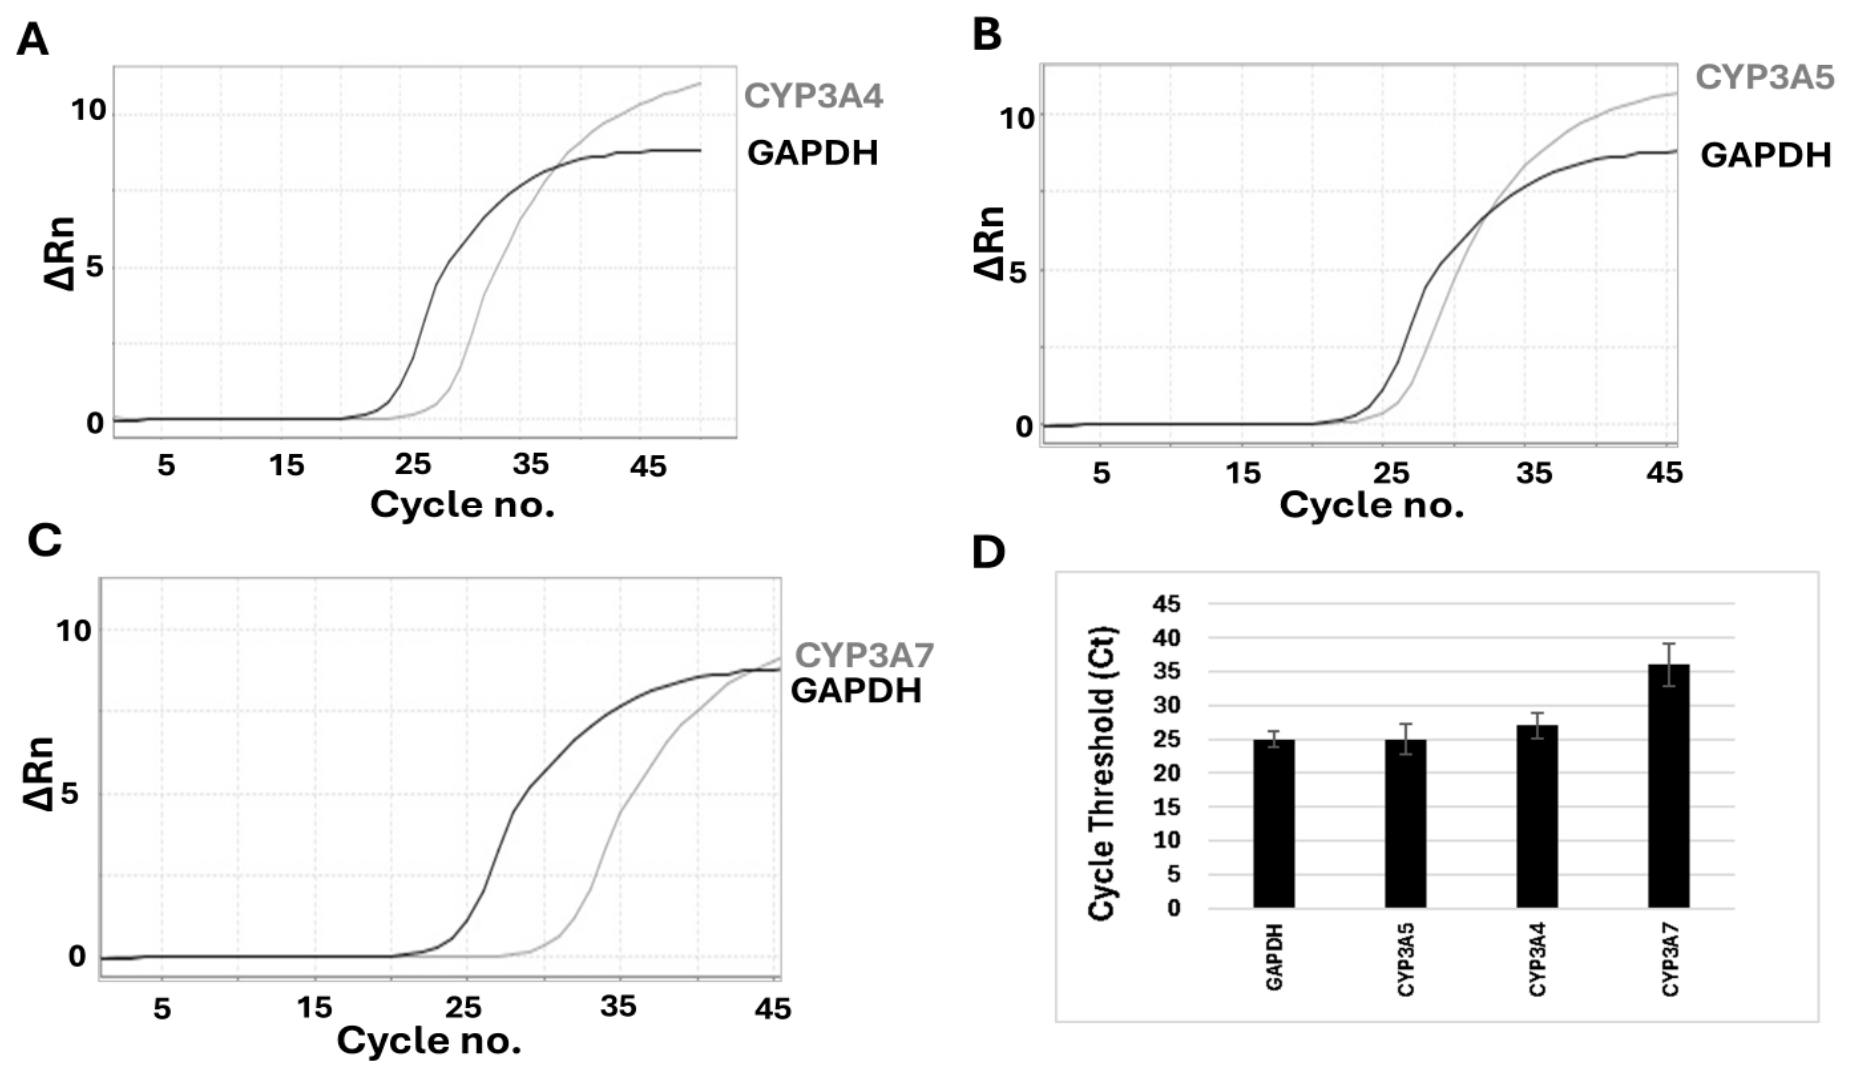
Figure 3.
Structural comparison of H. sapiens and C. sabaeus CYP3A isoforms. Experimentally determined human CYP3A5 (PDB: 5VEU), CYP3A4 (PDB: 9BV6), and CYP3A7 (PDB: 8GK3) structures (left) were compared with AlphaFold-predicted structures of the corresponding C.sabaeus (VERO E6) CYP proteins (right). Structures are shown in ribbon representation with the heme prosthetic group centered within the catalytic pocket. The overall cytochrome P450 fold is conserved across species and is characterized by a predominantly α-helical architecture surrounding the heme active site. N-terminal regions are indicated by asterisks (*), and C-terminal regions are indicated by delta symbols (∆), highlighting differences in terminal orientation and surface loop extensions between species. Major α-helices (A, B, C, D, F, and G) are labeled to illustrate conserved structural elements involved in shaping the catalytic cavity and substrate access channels. VERO CYP3A isoforms exhibit more extended terminal and surface loop regions relative to the corresponding human structures, suggesting potential differences in protein flexibility and substrate accessibility.
Figure 3.
Structural comparison of H. sapiens and C. sabaeus CYP3A isoforms. Experimentally determined human CYP3A5 (PDB: 5VEU), CYP3A4 (PDB: 9BV6), and CYP3A7 (PDB: 8GK3) structures (left) were compared with AlphaFold-predicted structures of the corresponding C.sabaeus (VERO E6) CYP proteins (right). Structures are shown in ribbon representation with the heme prosthetic group centered within the catalytic pocket. The overall cytochrome P450 fold is conserved across species and is characterized by a predominantly α-helical architecture surrounding the heme active site. N-terminal regions are indicated by asterisks (*), and C-terminal regions are indicated by delta symbols (∆), highlighting differences in terminal orientation and surface loop extensions between species. Major α-helices (A, B, C, D, F, and G) are labeled to illustrate conserved structural elements involved in shaping the catalytic cavity and substrate access channels. VERO CYP3A isoforms exhibit more extended terminal and surface loop regions relative to the corresponding human structures, suggesting potential differences in protein flexibility and substrate accessibility.
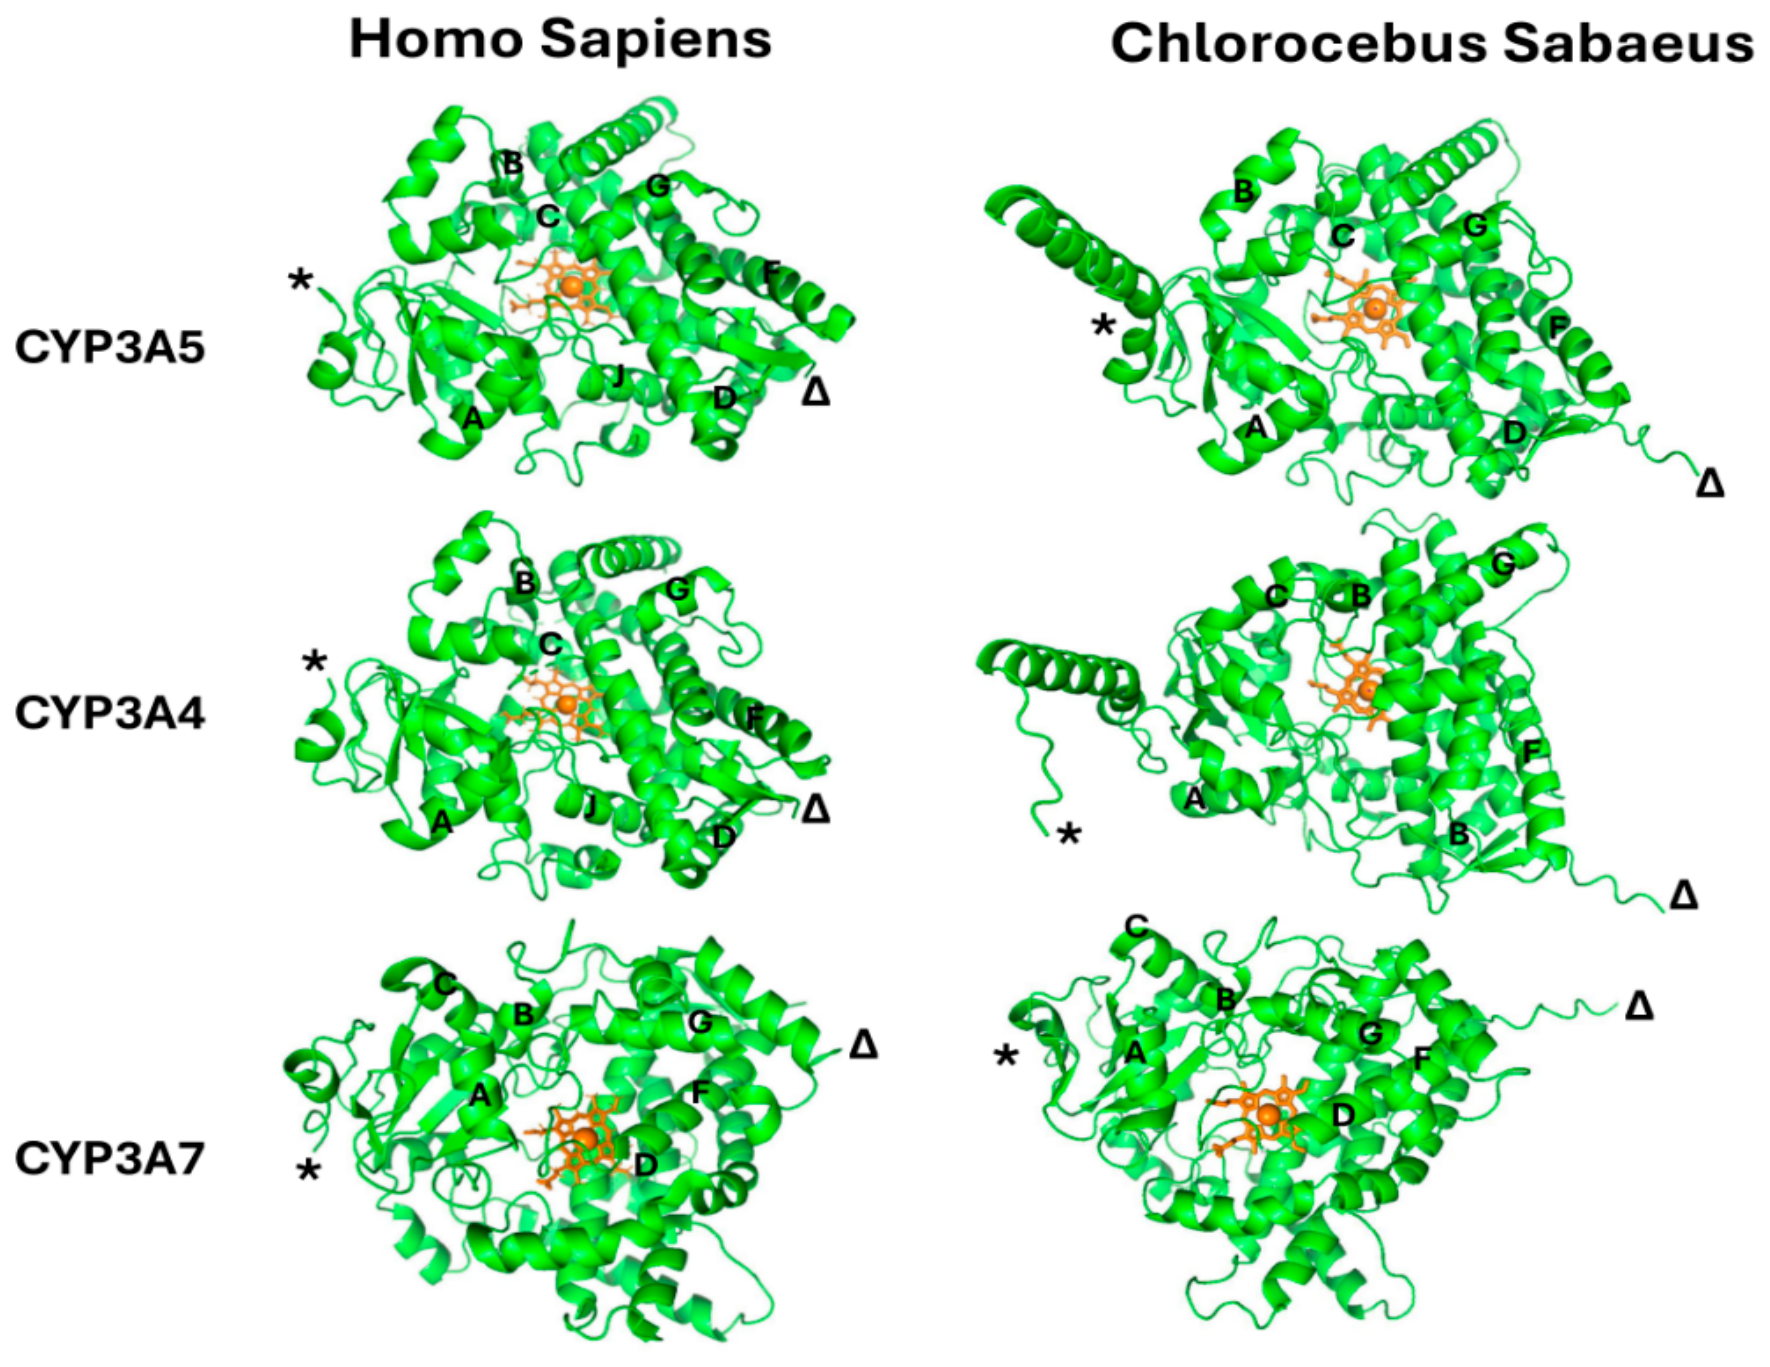
Figure 4.
Representative docking poses illustrate several energetically favorable binding modes of AFB1 in the active sites of CYP3A5 (top row), CYP3A4 (middle row), and CYP3A7 (bottom row). For each enzyme, selected modes (Mode 1, Mode 2/3, and Mode 5) highlight alternative ligand orientations relative to the heme prosthetic group (orange sphere). Binding energies (BE, kcal/mol) and key interacting residues are indicated for each pose. Insets show enlarged views of the catalytic pocket with measured distances (Å) between the heme iron and the reactive C8–C9 region of AFB1. The diversity of orientations demonstrates the conformational adaptability of the CYP3A active site, allowing AFB1 to sample multiple positions within the catalytic cavity and substrate access channel prior to adopting a catalytically productive alignment.
Figure 4.
Representative docking poses illustrate several energetically favorable binding modes of AFB1 in the active sites of CYP3A5 (top row), CYP3A4 (middle row), and CYP3A7 (bottom row). For each enzyme, selected modes (Mode 1, Mode 2/3, and Mode 5) highlight alternative ligand orientations relative to the heme prosthetic group (orange sphere). Binding energies (BE, kcal/mol) and key interacting residues are indicated for each pose. Insets show enlarged views of the catalytic pocket with measured distances (Å) between the heme iron and the reactive C8–C9 region of AFB1. The diversity of orientations demonstrates the conformational adaptability of the CYP3A active site, allowing AFB1 to sample multiple positions within the catalytic cavity and substrate access channel prior to adopting a catalytically productive alignment.
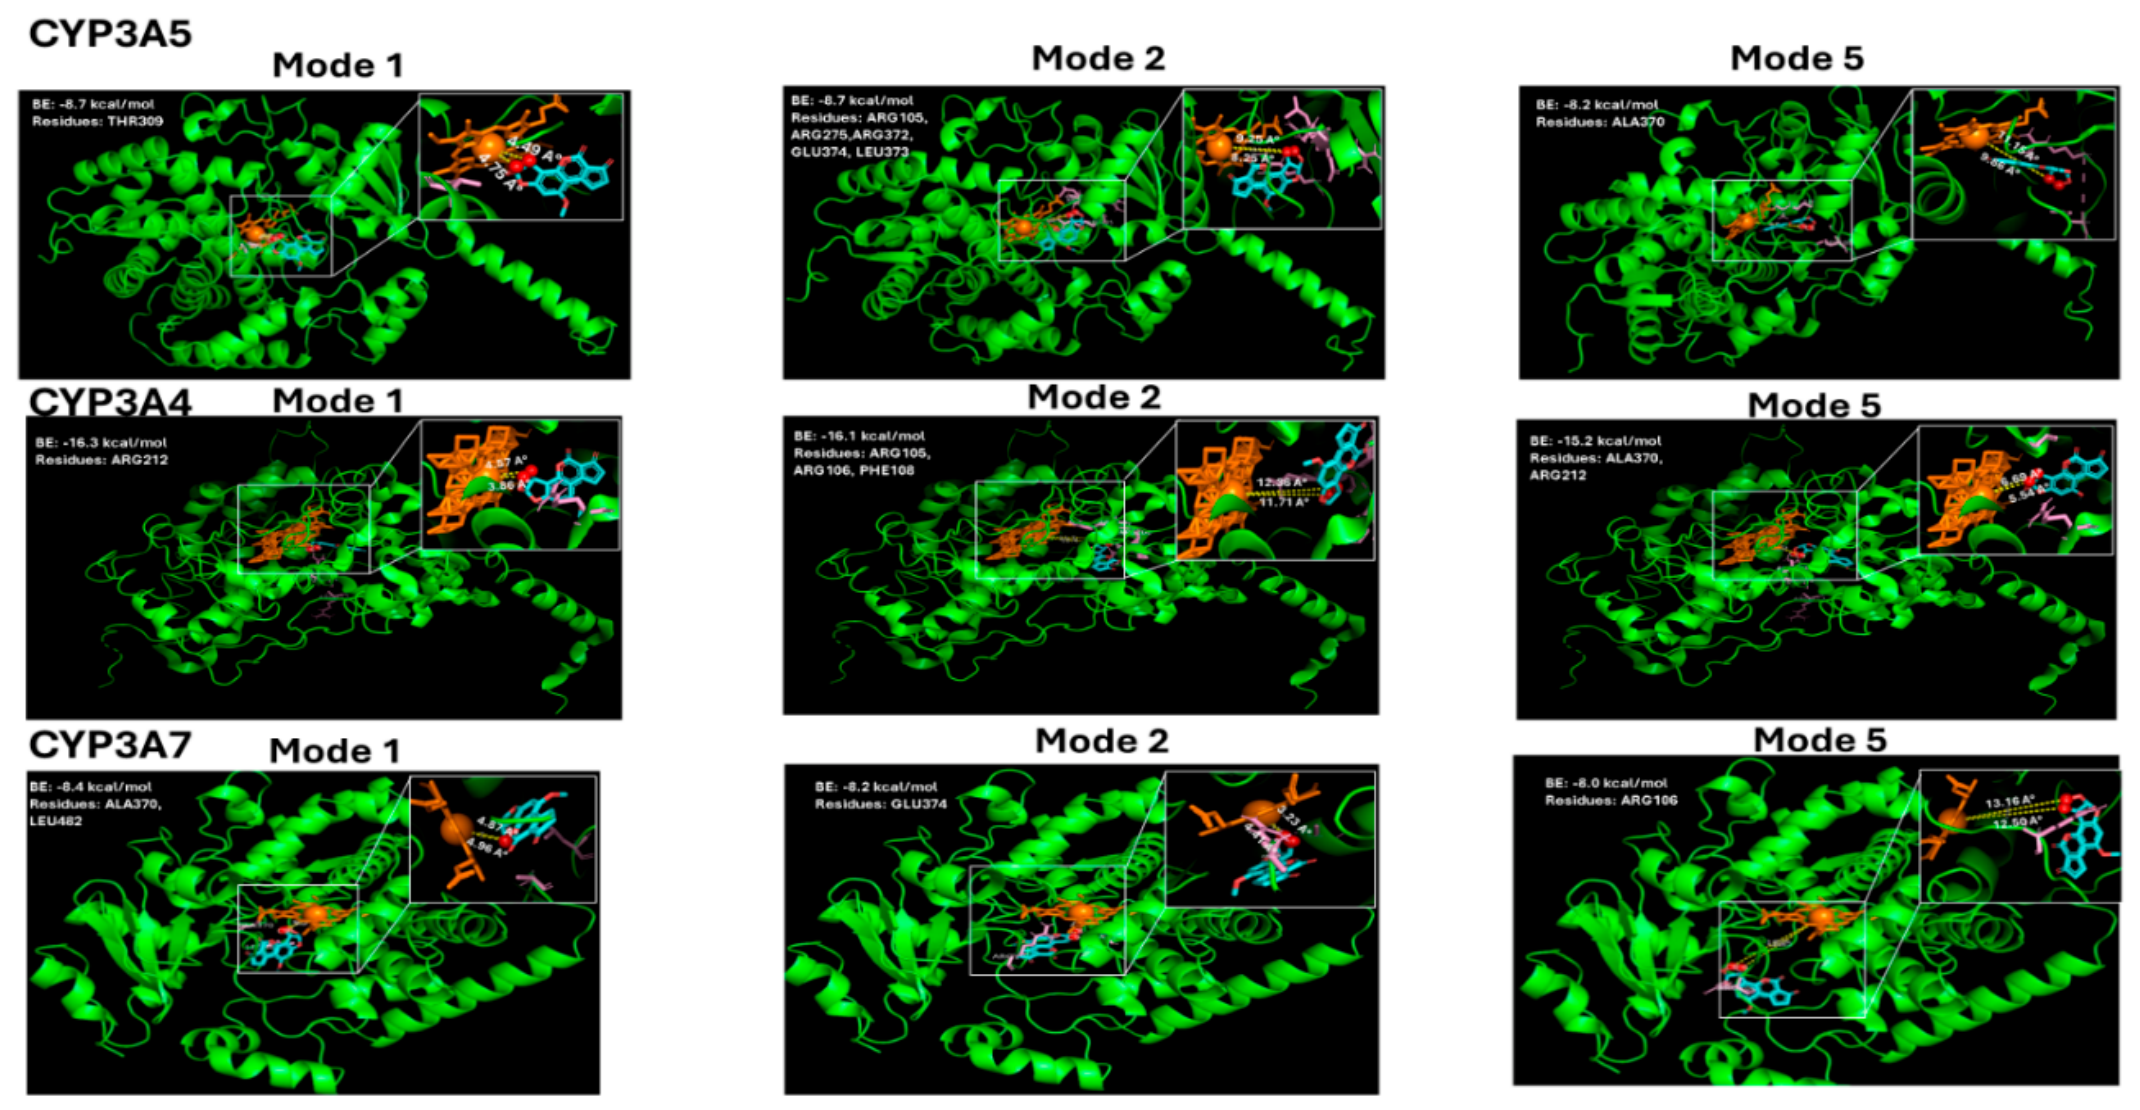
Figure 5.
Representative epoxidation-competent docking poses of AFB1 within the active sites of VERO CYP3A5, CYP3A4, and CYP3A4 are shown. AFB1 is depicted in cyan, the heme group in green, and the heme iron as orange spheres. Distances between the heme iron and the C8 and C9 atoms of AFB1 are indicated. In CYP3A5, the C8–C9 double bond is positioned at 3.4 Å and 4.7 Å from the heme iron, while in CYP3A4, corresponding distances of approximately 3.9 Å and 4.6 Å are observed, and in CYP3A7, the C8-C9 double bond is positioned at 3.2 Å and 4.4 Å. These distances fall within the catalytic window required for oxygen transfer to the C8–C9 double bond, indicating epoxidation-competent geometry. Similar ligand orientations in both enzymes demonstrate that VERO CYP3A4 and CYP3A5 enforce conserved structural constraints predictive of AFB1 bioactivation.
Figure 5.
Representative epoxidation-competent docking poses of AFB1 within the active sites of VERO CYP3A5, CYP3A4, and CYP3A4 are shown. AFB1 is depicted in cyan, the heme group in green, and the heme iron as orange spheres. Distances between the heme iron and the C8 and C9 atoms of AFB1 are indicated. In CYP3A5, the C8–C9 double bond is positioned at 3.4 Å and 4.7 Å from the heme iron, while in CYP3A4, corresponding distances of approximately 3.9 Å and 4.6 Å are observed, and in CYP3A7, the C8-C9 double bond is positioned at 3.2 Å and 4.4 Å. These distances fall within the catalytic window required for oxygen transfer to the C8–C9 double bond, indicating epoxidation-competent geometry. Similar ligand orientations in both enzymes demonstrate that VERO CYP3A4 and CYP3A5 enforce conserved structural constraints predictive of AFB1 bioactivation.
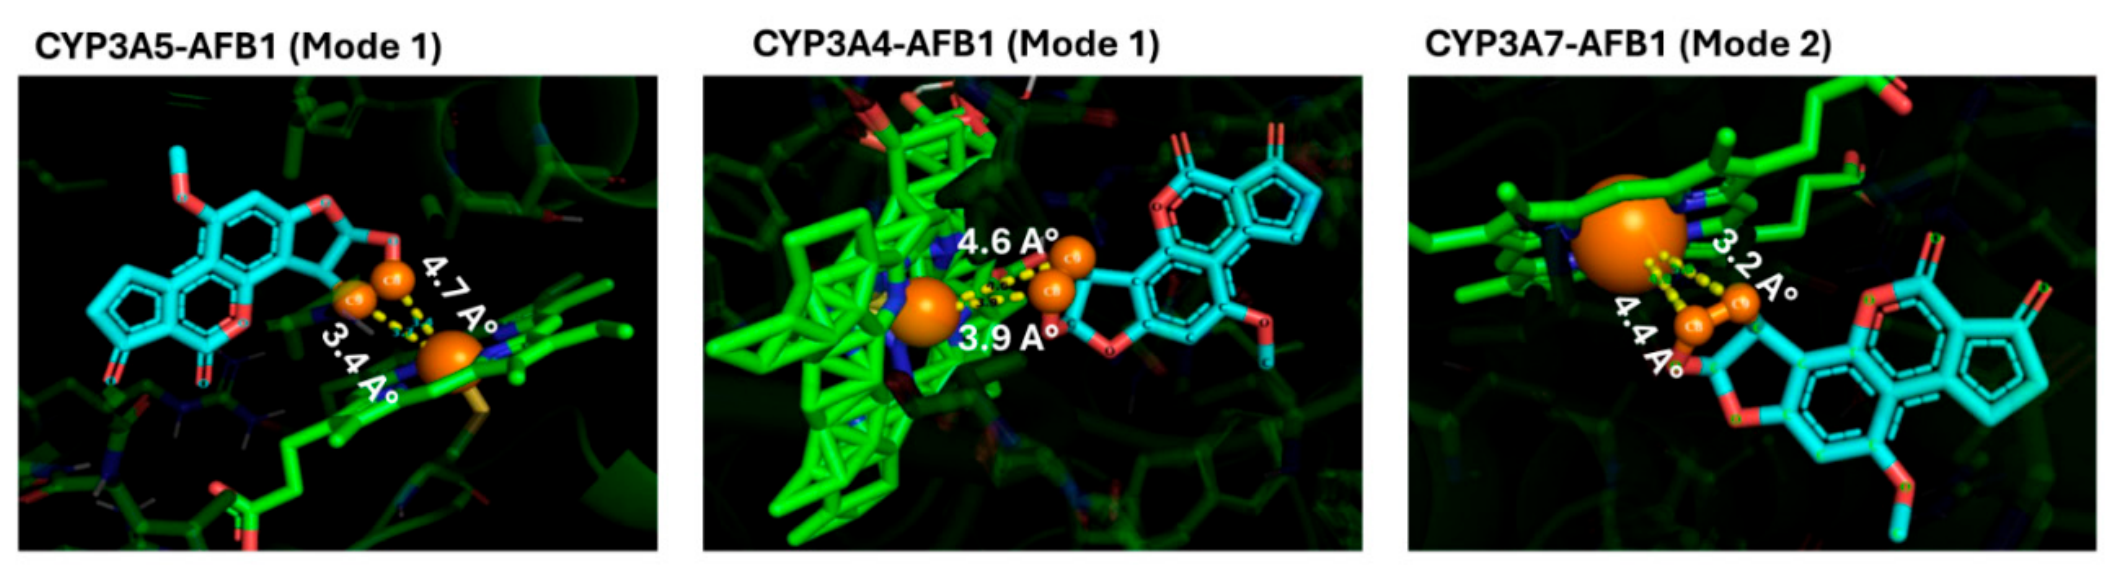
Figure 6.
AFB1 reduces VERO cell viability and proliferation. (A) VERO cells were exposed to increasing concentrations of AFB1 (5 nmol/L to 200 nmol/L), and cell proliferation was monitored over 14 d. (B) Percent cell viability was assessed over the same time period. DMSO-treated cells served as controls. AFB1 caused a concentration- and time-dependent reduction in cell number and viability, with 200 nmol/L producing the greatest loss of growth and survival by day 14. Data represent mean ± SD. (C) Total DNA adduct levels following exposure to 200 nmol/L AFB1 increased over time, indicating progressive DNA damage. Significance was determined using one-way ANOVA followed by Dunnett’s test with 2 h as the reference; asterisks indicate (***) p < 0.001 and (*)p < 0.05, which denote significant increases relative to the 2 h time point.
Figure 6.
AFB1 reduces VERO cell viability and proliferation. (A) VERO cells were exposed to increasing concentrations of AFB1 (5 nmol/L to 200 nmol/L), and cell proliferation was monitored over 14 d. (B) Percent cell viability was assessed over the same time period. DMSO-treated cells served as controls. AFB1 caused a concentration- and time-dependent reduction in cell number and viability, with 200 nmol/L producing the greatest loss of growth and survival by day 14. Data represent mean ± SD. (C) Total DNA adduct levels following exposure to 200 nmol/L AFB1 increased over time, indicating progressive DNA damage. Significance was determined using one-way ANOVA followed by Dunnett’s test with 2 h as the reference; asterisks indicate (***) p < 0.001 and (*)p < 0.05, which denote significant increases relative to the 2 h time point.
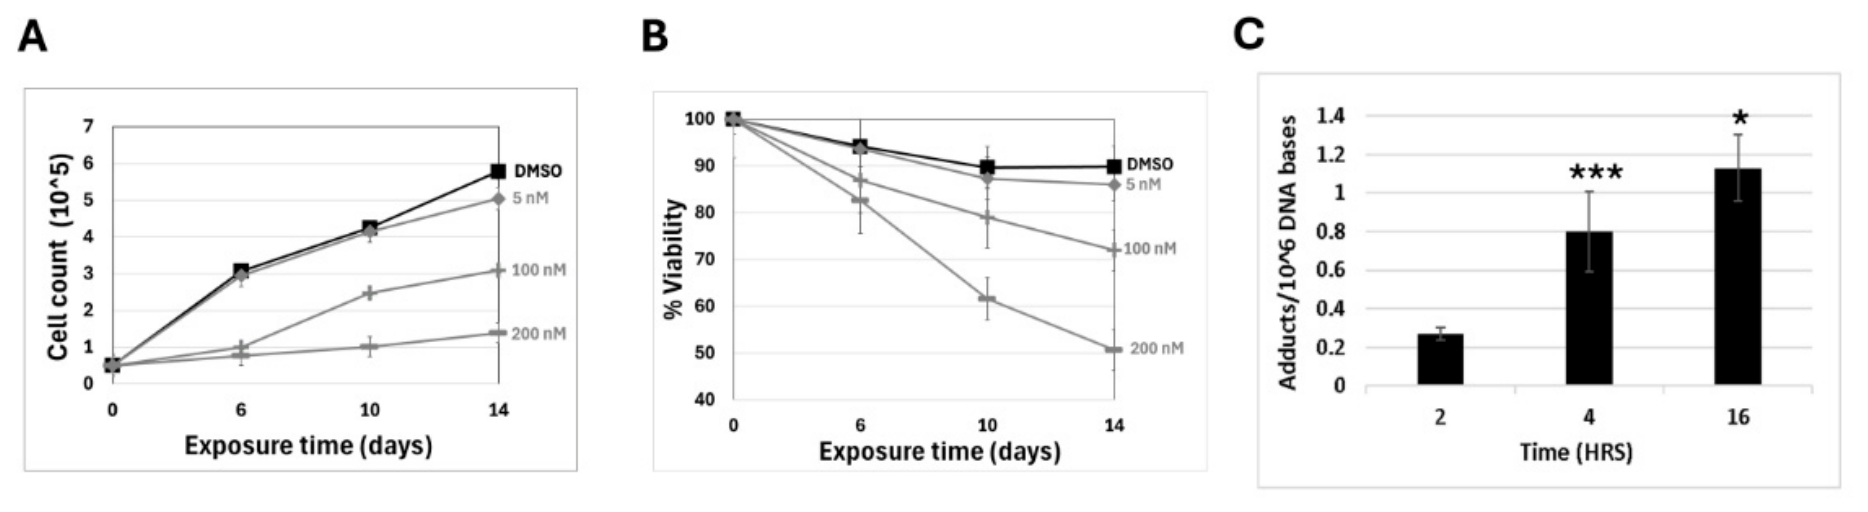

Table 1.
Comparison of the Structures of CYP3A4, CYP3A5, CYP3A7 in Homo Sapiens and Chlorocebus sabaeus.
Table 1.
Comparison of the Structures of CYP3A4, CYP3A5, CYP3A7 in Homo Sapiens and Chlorocebus sabaeus.
| CYP | Overall fold | Catalytic core | B–C loop | F–G loop | Active-site pocket |
|---|---|---|---|---|---|
|
CYP3A5 H. sapiens |
Canonical P450 fold | Conserved | Compact | Constrained | Defined |
| C. sabaeus | Canonical P450 fold | Conserved | slight flexibility/shift | extended/flexible | Slightly open |
|
CYP3A4 H. sapiens |
Canonical P450 fold | Conserved | Compact | Constrained | Defined |
| C. sabaeus | Canonical P450 fold | Conserved | loop extension/relaxed entrance | extended access-channel region | Slightly open |
|
CYP3A7 H. sapiens |
Canonical P450 fold | Conserved | Compact | Constrained | Defined |
| C. sabaeus | Canonical P450 fold | Conserved | Relaxed | extended access-channel region | Slightly open |
Table 2.
Binding affinities of aflatoxin B1 (AFB1) with Chlorocebus Sabaeus cytochrome P450 enzymes across multiple docking modes.
Table 2.
Binding affinities of aflatoxin B1 (AFB1) with Chlorocebus Sabaeus cytochrome P450 enzymes across multiple docking modes.
| Binding affinities (kJ/mol) | |||
|---|---|---|---|
| Binding Modes | CYP3A4 | CYP3A5 | CYP3A7 |
| 1 | -68.2 (-16.3 kcal/mol) | -36.4 (-8.7 kcal/mol) | -35.1 (-8.4 kcal/mol) |
| 2 | -67.3 (-16.1 kcal/mol) | -36.4 (-8.7 kcal/mol) | -34.7 (-8.3 kcal/mol) |
| 3 | -66.1 (-15.8 kcal/mol) | -35.6 (-8.5 kcal/mol) | -34.3 (-8.2 kcal/mol) |
| 4 | -64.0 (-15.3 kcal/mol) | -34.7 (-8.3 kcal/mol) | -33.9 (-8.1 kcal/mol) |
| 5 | 63.6 (-15.2 kcal/mol) | -34.3 (-8.2 kcal/mol) | -33.5 (-8.0 kcal/mol) |
| 6 | -63.6 (-15.2 kcal/mol) | -33.1 (-7.9 kcal/mol) | -33.1 (-7.9 kcal/mol) |
| 7 | -63.6 (-15.2 kcal/mol) | -33.1 (-7.9 kcal/mol) | -33.1 (-7.9 kcal/mol) |
| 8 | -63.2 (-15.1 kcal/mol) | -33.1 (-7.9 kcal/mol) | -32.6 (-7.8 kcal/mol) |
| 9 | -62.8 (-15.0 kcal/mol) | -33.1 (-7.9 kcal/mol) | -32.6 (-7.8 kcal/mol) |
| 10 | -61.5 (-14.7 kcal/mol) | -33.1 (-7.9 kcal/mol) | -32.6 (-7.8 kcal/mol) |
Table 3.
Mode-specific residues and catalytic relevance of AFB1 binding in C. sabaeus CYP3A4, CYP3A5, and CYP3A7.
Table 3.
Mode-specific residues and catalytic relevance of AFB1 binding in C. sabaeus CYP3A4, CYP3A5, and CYP3A7.
| CYP | Binding modes (Table 1) | ΔG (kJ/mol) | Fe–C8 / Fe–C9 (nm) | Key interacting residues | Catalytic interpretation |
|---|---|---|---|---|---|
| CYP3A4 | 1 |
-68.2 (–16.3 kcal/mol) |
0.386 / 0.457 (3.86 / 4.57 Å) |
Phe108, Phe213, Phe215, Phe241, Phe304, Leu482, Arg105, Arg212, | The best catalytic pose is supported by a conserved aromatic clamp and compact hydrophobic wall, with Phe, Arg, and Leu residues positioning AFB1 optimally near the heme for epoxidation. |
| CYP3A4 | 2 |
-67.3 (–16.1 kcal/mol) |
1.171 / 1.236 (11.71 / 12.36 Å) |
Arg105, Arg106, Phe108 | High affinity with high heme-distant; may stabilize binding without supporting catalysis. |
| CYP3A4 | 5 |
-63.6 (–15.2 kcal/mol) |
0.554 / 0.669 (5.54 / 6.69 Å) |
Ala370, Arg212 | Borderline productive; partial steering with one distance near the upper catalytic limit. |
| CYP3A4 | 10 |
-61.5 (-14.7 kcal/mol) |
1.416 / 1.296 (14.16 / 12.96 Å) |
Asn312, Arg372, Met371, Phe57 | Peripheral binding site; non-productive despite favorable interactions. |
| CYP3A5 | 1 |
-36.4 (-8.7 kcal/mol) |
0.349 / 0.475 (3.49 / 4.75 Å) |
Thr309 | Productive epoxidation poses with optimal heme proximity and polar steering. |
| CYP3A5 | 2 |
-36.4 (-8.7 kcal/mol) |
0.952 / 0.825 (9.25 / 8.25 Å) |
Arg105, Arg372, Glu374, Leu373 | Same affinity as Mode 1 but non-productive geometry; illustrates ΔG alone is insufficient. |
| CYP3A5 | 9 |
-33.1 (-7.9 kcal/mol) |
0.342 / 0.368 (3.42 / 3.68 Å) |
Ala305, Arg105, Thr309, Phe213 | Likely productive; Arg105 provides steering with optimal distances. |
| CYP3A5 | 10 |
-33.1 (-7.9 kcal/mol) |
0.658 / 0.766 (6.58 / 7.66 Å) |
Phe304, Ser119 | Mostly non-productive; distances drift beyond the optimal catalytic window. |
| CYP3A7 | 1 |
-35.1 (-8.4 kcal/mol) |
0.487 / 0.496 (4.87 / 4.96 Å) |
Ala370, Leu482, Phe304, Arg372 | Productive-capable; hydrophobic contacts support binding near heme. |
| CYP3A7 | 2 |
-34.7 (-8.3 kcal/mol) |
0.323 / 0.441 (3.23 / 4.41 Å) |
Ala305, Arg105 | Best CYP3A7 pose; strong heme proximity with steering interaction. |
| CYP3A7 | 3 |
-34.3 (-8.2 kcal/mol) |
1.125 / 1.055 (11.25 / 10.55 Å) |
Glu374 | Non-catalytic; ligand stabilized far from heme. |
| CYP3A7 | 4 |
-33.9 (-8.1 kcal/mol) |
0.537 / 0.652 (5.37 / 6.52 Å) |
Phe304 | Aromatic contact but reduced catalytic reliability. |
Disclaimer/Publisher’s Note: The statements, opinions and data contained in all publications are solely those of the individual author(s) and contributor(s) and not of MDPI and/or the editor(s). MDPI and/or the editor(s) disclaim responsibility for any injury to people or property resulting from any ideas, methods, instructions or products referred to in the content. |
© 2026 by the authors. Licensee MDPI, Basel, Switzerland. This article is an open access article distributed under the terms and conditions of the Creative Commons Attribution (CC BY) license (http://creativecommons.org/licenses/by/4.0/).
Copyright: This open access article is published under a Creative Commons CC BY 4.0 license, which permit the free download, distribution, and reuse, provided that the author and preprint are cited in any reuse.