

Submitted:
15 June 2026
Posted:
16 June 2026
You are already at the latest version
Abstract
Cognitive load is a critical factor that influences learning and performance. In recent years, eye-tracking technologies have emerged as a promising method for detecting and measuring cognitive load in real-time during learning activities. This paper presents a comprehensive review of the state-of-the-art machine learning (ML) and deep learning (DL) methods utilizing eye-tracking technology for cognitive load assessment. We systematically selected and analyzed 27 studies using the PRISMA protocol, focusing on the methodologies, data, and tasks employed. The reviewed studies leverage a variety of eye-tracking features, such as pupil size, fixations, saccades, blink rate, and eye gaze, to classify cognitive load. Key contributions of this review include identifying specific eye movement patterns associated with cognitive load and exploring multimodal approaches that combine eye-tracking data with other physiological measures to enhance model accuracy and generalizability. By tracking changes in eye movements, researchers can gain insights into the cognitive processes underlying learning activities and identify strategies for improving instructional designs. ML and DL models have become increasingly popular for cognitive load classification based on eye-tracking metrics. These algorithms are capable of learning complex patterns in data and identifying subtle changes in eye movements that are indicative of changes in cognitive load. Therefore, this review focuses on how ML/DL models are used to study cognitive processes using eye-tracking technology, along with relevant variables. The review involved an extensive examination of electronic repositories and a thorough exploration of references from papers that met the inclusion criteria. After removing duplicates and irrelevant papers, the analysis focused on journal articles that presented well-executed studies involving eye-tracking and physiological signals. Specifically, the studies needed to analyze healthy individuals both at rest and during cognitive load. Eye-tracking offers a rich source of data, including fixations, pupil size, saccades, blinks, and eye-gaze, which can provide valuable insights into attentional processes during cognitive tasks. Several studies focus on the use of DL algorithms for automated detection and classification of cognitive load levels using eye-tracking features. While the potential of Artificial Neural Networks (ANNs) and Convolutional Neural Networks (CNNs) in accurately classifying cognitive load levels is emphasized, it is crucial to acknowledge their limitations. These models heavily rely on the quality and quantity of training data, as well as the generalizability of the learned patterns to different populations and learning contexts. We discuss the challenges posed by these gaps and emphasize the need for privacy-preserving technologies and robust legal frameworks to protect individuals' privacy as the adoption of eye-tracking technology grows. Additionally, the interpretability of DL models poses challenges, as their decision-making processes are often perceived as black boxes. Thus, it is important for future research to address these limitations and develop more robust and interpretable ML/DL models for cognitive load classification. It is worth noting that eye-tracking data are subject to potential bias as the related experiments are often conducted under controlled conditions with a small number of participants. Although eye-tracking technology has been the primary focus of analysis in many studies, researchers are increasingly exploring the benefits of combining eye-tracking data with other physiological signals. By integrating eye-tracking data with other physiological signals, effective classification models can be established to enhance the understanding of human cognitive processes. However, further research is needed to understand the generalizability and effectiveness of these approaches in different contexts and larger datasets.
Keywords:
eye-tracking
; deep learning
; machine learning
; cognitive load
; artificial intelligence
1. Introduction
Cognitive Load Theory (CLT) is a well-established instructional framework that aims to understand and manage the limited capacity of a learner’s working memory during the learning process. CLT specifically addresses the short-term memory load imposed by learning tasks and how it affects learners' ability to process and retain information effectively [1]. The primary objective of CLT is to develop instructional methods that minimize unnecessary cognitive load and optimize the use of learners' working memory, thereby enhancing their ability to process and learn new information [2]. CLT suggests that working memory has a limited capacity, which can be easily overwhelmed if too much information is presented simultaneously or if the information is not structured in a way that aligns with the learner's cognitive processes. This limitation is a fundamental characteristic of working memory [3], meaning that learners can only handle a finite amount of information at any given time. Therefore, instructional designers must carefully consider the cognitive demands of a task or activity to ensure that it does not exceed the learners' working memory capacity. To achieve this, CLT emphasizes the importance of designing instructional materials and activities that account for the constraints of working memory. This involves breaking down complex information into manageable chunks, using clear and concise instructions, and providing supportive scaffolding to help learners process new information efficiently. Effective instructional design, guided by CLT principles, aims to reduce extraneous cognitive load (unnecessary mental effort unrelated to the learning task) and enhance germane cognitive load (mental effort directly related to the learning process). For instance, CLT suggests using multimedia learning principles, such as the split-attention effect and the modality effect, to design instructional content that leverages both visual and auditory channels of working memory. By doing so, learners can process information more effectively, as these strategies help distribute cognitive load across different sensory modalities.
The use of simulation environments has proven to be highly beneficial in various fields such as psychology [4], neuroscience [5], and education [6], as it allows researchers to learn knowledge and skills in a safe environment, without any risk to themselves or others. Moreover, simulation environments enable researchers to collect and analyse data, providing insights that may be difficult to obtain through conventional methods [7]. In addition, simulation environments offer several advantages over traditional research methods, such as providing the opportunity to re-create complex scenarios that are hard to reproduce in real life [8], e.g. training novice fire-fighters during real bushfire situations. They can also facilitate the evaluation of different variables and conditions [9], allowing researchers to examine the effects of specific variables on human behaviours and performance. Simulation tasks often involve replicating real-world situations in controlled environments, enabling researchers to manipulate and measure cognitive demands. A common simulation task used to assess cognitive load is the N-back task [10]. This task requires participants to monitor a sequence of stimuli and identify the situation when a current stimulus matches the one presented in an earlier trial. The task places high demands on working memory, which has been used to assess cognitive load in both healthy and clinical populations. Driving simulators are another example of a simulation task used to assess cognitive load [11]. These simulators replicate real-world driving situations, allowing researchers to manipulate the complexity and difficulty of driving scenarios. Measuring the reaction times, decision-making processes, and errors can provide insights into cognitive load demands and the effectiveness of the driver’s training programs. The Stroop task [12] is a classic cognitive load assessment tool that measures the interference of response time when identifying the colour of a word printed in a different colour than the word itself (e.g., the word "red" printed in blue). The task requires participants to inhibit their automatic response of reading the word and, instead, identify the colour, placing a high demand on cognitive control processes. Puzzles, video games, and virtual reality game-based environments are additional examples of simulation tasks that can be used to assess cognitive load. These tasks can be designed to present different levels of difficulty and complexity, allowing researchers to measure how cognitive load changes with task demands.
The assessment of cognitive load in psychology often involves subjective measurements such as questionnaires [13], as well as objective measures like physiological measures [14]. Questionnaires are a common tool used to gather participants' subjective experiences pertaining to cognitive load. By asking participants to rate their perceived level of difficulty or effort during a task, researchers can gain insights into the mental effort required to complete a designed task [15]. While questionnaires can provide valuable information, they are subjected to biases and individual differences in cognitive ability [16]. Additionally, self-reported cognitive load via questionnaires can be unreliable due to retrospective memory biases [17], affecting the accuracy and validity of the collected data. Moreover, participants may fail to accurately assess their own cognitive load, leading to inaccurate responses. Objective measures of cognitive load, on the other hand, provide more direct insights into the cognitive processes underlying task performance. Physiological measures, such as Electroencephalography (EEG) [18], Functional near-infrared spectroscopy (fNIRS) [19] or Functional Magnetic Resonance Imaging (fMRI) [20], can provide information on brain activity associated with cognitive load. Among these measures, eye-tracking is often considered a superior technique for measuring cognitive load over other physiological measures [21]. This is because eye-tracking provides direct information on attention and cognitive processing, which enables researchers to track where a person is looking during a task and identify the areas of the task that require the most cognitive resources. This information can be invaluable for understanding how individuals allocate their cognitive resources, leading to optimised learning or performance.
Eye tracking is a comparatively easily accessible option for researchers with limited resources, as it is non-invasive, user-friendly, and cost-effective, unlike other physiological measures such as EEG or fNIRS. [22,23]. Eye-tracking technology involves tracking and measuring eye movements and the focus points of a user's gaze [24]. This technology is becoming essential across various domains. In these fields, eye tracking is utilized to study how individuals process information, providing insights that other methods might not easily capture. In computer science, eye tracking is particularly beneficial for studying user interactions and information processing tasks [25]. The technology measures eye movements using an eye-tracking sensor or a standard camera, making it accessible and easy to implement. This ease of use allows researchers to collect rich datasets that include various eye-tracking metrics such as fixation duration, saccades, and blink rate [26]. These metrics can then be analysed for different classification tasks, offering insights into cognitive load [27]. Furthermore, eye tracking can be used in practical environments to study cognitive load in naturalistic settings, providing more ecologically valid data. Eye tracking can provide immediate feedback during a task, enabling researchers to identify areas of high cognitive load and modify the task in real-time. Although eye-tracking has limitations in measuring cognitive load as it is exclusively focused on visual attention and susceptible to individual differences [26,28], it is still a valuable means for researchers to study cognitive load in different contexts. Eye-tracking provides information on areas of a task that require the most cognitive resources and allows optimized tasks to be designed for improving performance or learning outcomes [24,29].
In the recent decade, the trend of using Machine Learning (ML) and Deep Learning (DL) has increased across various domains, including the analysis of eye-tracking data [30]. These advanced computational techniques have been employed to predict cognitive load from eye-tracking metrics. Machine learning models can be trained to recognize patterns in eye movement data that correlate with high cognitive load, such as longer fixation durations or increased blink rates [31]. Deep learning, particularly neural networks, has shown promise in this area due to its ability to handle large and complex datasets, learning hierarchical features from raw eye-tracking data without the need for extensive pre-processing [32]. By integrating these machine learning methods, researchers can develop more accurate and robust models for predicting cognitive load, leading to better understanding and optimization of tasks in various applications [33]. Therefore, in this review article, we focus on the intersection of ML/DL algorithms with eye-tracking techniques, specifically applied to the study of cognitive load. The articles included in this review were selected using the Preferred Reporting Items for Systematic Reviews and Meta-Analyses (PRISMA) [34] protocol, ensuring a rigorous and systematic approach to the literature selection process. We specifically analyse studies that utilize their own eye-tracking datasets, providing a detailed examination of the unique contributions and methodologies employed. Notably, there is a lack of reviews that specifically use eye-tracking data to analyze cognitive load using ML and DL. The primary aim of this article is to thoroughly analyse the application of ML and DL algorithms to eye-tracking data in the context of cognitive load. We explore the strengths and limitations of these algorithms, offering a comprehensive understanding of their effectiveness. By doing so, we aim to highlight the current state of the field and identify areas where improvements are needed. Our review reveals significant gaps in the existing literature, particularly in the application of advanced ML and DL techniques to cognitive load analysis using eye-tracking data. These gaps suggest opportunities for future research and development, which are discussed in subsequent sections. Additionally, this research also covers possible future directions for the use of eye-tracking techniques in conjunction with ML and DL.
This review covers the fundamental concepts of DL and ML pipelines, which are essential for the analysis of eye-tracking data. The design and training of existing models for analysing of eye-tracking data are examined. It is envisaged that this review can help readers to gain a deeper understanding of the technical aspects involved in the use of DL and ML models to analyse and assess cognitive load.
The main contributions of this review are three-fold, as follows:
- Comprehensive coverage of recent research publications (2011-2022) that leverage eye-tracking data and other physiological measures to classify cognitive load using state-of-the-art DL and ML models.
- A detailed explanation of the fundamental concepts of DL and ML pipelines, including the design and training processes of existing DL and ML models for analysing eye-tracking data;
- Future research and development directions in ML and DL models pertaining to cognitive load assessment.
This article is structured as follows: In Section 2, we detail our literature search strategy, outlining our inclusion and exclusion criteria. Section 3 provides a summary of all cognitive load studies we have reviewed. In Section 4, we discuss the challenges and implications of our review findings. Concluding remarks are presented in Section 5.
2. Materials and Methods
This literature review adopts a rigorous and comprehensive approach in line with the PRISMA [34] guidelines. To ensure a systematic and up-to-date literature review, we conduct a detailed search for relevant articles using several reputable databases, including IEEExplore, PubMed, Scopus, Web of Science and EBSCO. Table 1 displays the search terms used in our literature search.
We utilise a combination of search terms relevant to the topics of cognitive load, artificial intelligence, and eye tracking. By employing a diverse range of search terms, we aim to capture a wide range of relevant studies and maximise the comprehensiveness of our literature search. Our search terms are carefully selected to ensure that they are as inclusive as possible, while being specific enough to yield the most relevant results. We adopt Boolean operators, such as "AND" and "OR" to combine our search terms and refine our search results. We use the search keywords in the identified electronic databases, and screen the extracted titles and abstracts based on the following inclusion and exclusion criteria.
2.1. Inclusion Criteria
This review aims to investigate ML and DL models for analysing cognitive tasks using eye-tracking data. We have chosen to examine literature from the past decade to encompass the most recent and impactful research, especially concerning cognitive load assessment using eye-tracking technology. Our review spans from January 1, 2011, to January 1, 2023, a crucial timeframe for the evolution of ML/DL techniques in eye-tracking studies. During this period, significant progress has been made in algorithmic advancements, computational capabilities, and data accessibility, all of which are necessary for the accuracy and efficacy of cognitive load measurement models. Focusing on the past ten years ensures the inclusion of the latest techniques and validation studies, offering a thorough understanding of the current capabilities and constraints of eye-tracking technologies. This approach not only reflects the state-of-the-art but also keeps pace with technological advancements, ensuring that the review’s findings are relevant and applicable to ongoing and future research in the field. To be included in our review, a selected publication must meet the following criteria:
- 1-
- The cognitive tasks analysed are complex and demanding;
- 2-
- The analysis utilises AI-based models;
- 3-
- The AI models undergo training with either eye-tracking data alone or a combination of eye-tracking and other physiological data. This approach allows a thorough exploration of the capabilities of AI-based models in analysing cognitive tasks and provides insights into the relative contributions of different types of physiological data on cognitive load assessment;
- 4-
- The search is limited to peer-reviewed journal papers, excluding conference papers and other non-peer-reviewed publications that are deemed less reliable.
- 5-
- Articles published between January 1, 2011 and January 1, 2023
- 6-
- Studies: involving humans in good health and without any detected cognitive impairments as participants.
By focusing on studies that meet the aforementioned criteria, we can gain a deeper understanding of how ML and DL models can be leveraged to analyse cognitive tasks and inform the development of practical applications related to cognitive load.
2.2. Exclusion Criteria
To determine which articles should be excluded from our review, the following criteria are applied:
- Articles that lack sufficient details for assessing research quality or are presented solely in an abstract form are not considered;
- Dissertations, case studies, theses, pre-prints, overviews, and book chapters are excluded;
- Studies involving patient populations are not considered;
- Studies that rely solely on publicly available cognitive load-related data sets are excluded;
- Studies that rely solely on a statistical analysis of cognitive load data are not considered;
- Studies conducted on animals are excluded since this review is on human cognitive load analysis using AI-based models;
- Studies written in languages other than English are excluded.
By applying these criteria, we can ensure that the articles included in our analysis meet the necessary standards for quality and relevance, thereby enhancing the validity and reliability of our findings.
2.3. Search Results
Figure 1 presents a flowchart outlines our systematic review procedure, as per the PRISMA guidelines [34]. It provides a visual representation of the number of studies identified, screened, and included at each stage of our review process. After conducting a thorough search for relevant articles in several reputable databases, we use the Rayyan systematic review software [35] to screen the resulting titles and abstracts. This software enables us to efficiently and systematically evaluate the extracted articles and identify those that conform with our inclusion and exclusion criteria. To ensure that the resulting set of articles is free of duplicates, we manually review and exclude any articles appearing more than once in our search results. Armed with all included articles from this initial screening stage, we further review them in the full-text stage.
Following the initial screening process, a total of 82 articles are excluded, owing to duplication. An additional 1479 articles are removed after reviewing their abstracts and titles, as they are irrelevant to our research question. Further screening is conducted using the inclusion criteria, resulting in the removal of an additional 170 articles failing to meet the requirements, namely studies on cognitively demanding tasks, use of AI-based models for analysis, and involvement of healthy human subjects. After applying the screening processes, a total of 24 articles are identified, which meet the established inclusion criteria. These selected articles are thoroughly examined and evaluated to gain a deeper understanding of the application of ML and DL-based models for analysing cognitive tasks with eye-tracking data, as well as to identify potential areas for future research in this field.
3. Bibliometric Analysis of ML/DL Models on Cognitive Load Classification
The process of eye-tracking involves extracting features from eye movements and using these features to analyse different cognitive states. Figure 2 illustrates this process, which involves capturing eye movements using an eye-tracking device, processing the data to extract relevant features, and then utilising the features for analysis and classification of different cognitive states.
This process offers valuable insights into a range of cognitive processes, including attention, perception, and decision-making. Classifying eye-tracking data involves several stages, including feature extraction, statistical analysis, and ML/DL models for categorisation. In the following sections, we describe each stage and explain their significance in the classification process of cognitive load.
3.1. Eye-Tracking Data
Eye-tracking devices are useful for directly measuring eye movements in response to different cognitive tasks [36]. These devices provide valuable information into the working principle of the human mind, as eye movements provide an indication of where an individual's attention is focused, the level of engagement, and the cognitive workload [37,38]. Eye-tracking devices can be categorized into two types based on their mobility and proximity to the person being studied: mobile and remote devices. Compared with remote devices, mobile devices are typically binocular, which can offer greater accuracy. Mobile devices can be used in a variety of settings, and are particularly useful for studying eye movements during naturalistic activities [39]. Tobii eyeglasses [40] have emerged as a popular and widely used eye-tracking device for research purposes. This device requires the participants to wear glasses equipped with small cameras to capture eye movements [41]. The glasses are designed to be non-intrusive and comfortable to wear, ensuring that participants can engage in naturalistic activities without any hindrance [42]. Tobii eyeglasses offer a range of advantages over other types of eye-tracking devices. These devices capture information on how individuals process information and make decisions [43]. The use of Tobii eyeglasses has become increasingly prevalent in a range of research fields, including psychology [44], neuroscience [45], marketing [46], and human-computer interaction [47]. Researchers have used these glasses to study a range of cognitive processes, such as attention, perception, decision-making, and emotion. These glasses have also been used to study social interactions and how individuals interact with technology in real-world settings [48]. In addition to providing direct eye related features, Tobii eyeglasses are designed to capture eye movements with minimal noise and distortion, ensuring that the data collected are accurate and reliable [49,50]. This is particularly important in research studies, where data quality can significantly impact the validity of results. On the other hand, remote eye-tracking devices do not require any contact with individuals, as eye movement measurement are conduct from a distance using a camera. Comparing with mobile devices, these devices are typically less accurate, but are more convenient to use in a wider range of settings [39]. They are particularly convenient for capturing eye movement data from large groups of people.
3.2. Feature Extraction From Eye-Tracking Data
The first stage in eye tracking classification is feature extraction. These features can provide valuable insights into visual attention, cognitive load, and other psychological states. For instance, fixation-related features such as fixation duration, count, and spatial distribution can reveal how long and where a person focuses their gaze. Saccade-related features, including saccade amplitude and velocity, offer information about the rapid eye movements between fixations. Pupil diameter changes can indicate cognitive and emotional states. Figure 3 illustrates the distribution of studies utilizing different eye-tracking features, highlighting the diverse approaches researchers have taken in this field. Some studies focus on a single type of feature, while others combine multiple types to capture a more comprehensive picture of eye movement behaviour.
In general, feature selection is determined by the research question and the available eye-tracking technology. The selected features have a significant impact on the accuracy and efficiency of a classification model. Table 2 presents various eye behaviour features along with their respective sources or references. Commonly used eye-tracking features include pupil size, fixation, saccade, blink, and eye-gaze, as explained in the following sub-sections.
3.2.1. Pupil Size
The pupil is a distinguishing feature of the human eye that serves a critical role in regulating the amount of light entering the retina. The pupil size is primarily influenced by the illumination level, with a smaller pupil size being more common in a brighter environment and a larger pupil size in a low-lighting condition [68]. However, pupil size is also subject to other factors, such as emotions, stress, cognitive processes, and mental workload. The relationship between pupil size and cognitive load has been extensively explored, with studies demonstrating that an increased dilation response in the pupil is associated with higher cognitive demands and increased cognitive load [69]. Moreover, as the pupil responds rapidly to changes in cognitive demands, it allows real-time monitoring of mental workload [70]. Consequently, researchers have examined pupil size to better understand the cognitive effects in simulated environments. To analyse the cognitive load, researchers commonly use a set of pupil features, including baseline pupil size, mean pupil diameter, the average percentage change in pupil size, peak dilation, entropy of pupil, time to peak and peak dilation speed, latency to peak, mean pupil diameter, peak dilation, average percentage change in pupil size, percentage change in pupil size, maximum pupil size, minimum pupil size, and standard deviation of pupil size [51,52,53,64]. By analysing these features, researchers can gain insights into the cognitive demands of different tasks and understand how mental workload affects the physiological responses of individuals. The pupil and its associated features provide a valuable mechanism for understanding cognitive processes and mental workloads.
3.2.2. Fixation
Fixation measures play an important role in evaluating the cognitive load and efficiency of visual information processing. Fixation is a stable and precise state of the eye when it is focused on a particular point [71]. Eye fixations are an essential component of visual attention, reflecting the brain's cognitive and perceptual processes in response to different stimuli. During fixation, the eye remains stationary for a duration of approximately 180-300 milliseconds [39], giving individuals the opportunity to gather new information from objects or locations. Fixation is typically assessed by researchers through measures such as fixation rate, fixation duration, and transition rate. Fixation rate and fixation duration are inversely correlated given the same trial duration, and the interpretation of results is highly task-specific [72]. As an example, in tasks that require frequent searching of different locations, an increased fixation rate is associated with a high cognitive load, accompanied by a short fixation duration. On the other hand, in tasks that involve deep and effortful processing of specific visual targets, a long fixation duration indicates a high cognitive load [56,59,63,73]. In addition to these measures, other commonly used fixation-related features include maximum fixation duration, mean fixation duration, median of fixation duration, variance of fixation duration, standard deviation of fixation duration, skewness of fixation duration, kurtosis of fixation duration, maximum fixation count, minimum fixation count, average fixation count, number of fixations, average fixation length, maximum fixation length, and total fixation duration [58]. These measures provide a comprehensive understanding of fixation characteristics and the underlying cognitive processes.
3.2.3. Saccade
Saccades refer to rapid eye movements that occur when a person shifts his/her focus between fixations. These eye movements typically last between 10 to 100 milliseconds [39]. As the difficulty of a task increases, individuals tend to decrease the amount of visual exploration and rely more heavily on goal-directed saccades. Therefore, it is reasonable to expect a higher saccade frequency during a highly difficult task [74]. Researchers often use several features to study saccades. These features include the number of saccades, mean and standard deviation of saccade durations, maximum, average, and standard deviation of saccade amplitudes, average velocity and angle of the next saccade, saccade frequency, and skewness and kurtosis of saccades [56,59,63]. These measures can provide insights into the underlying cognitive and perceptual processes involved in task performance. As an example, saccade frequency can reflect the level of attentional demand and information processing required for a given task. Meanwhile, the amplitude and duration of saccades provide valuable insights into the efficiency of oculomotor control and clarity of visual perception. Additionally, skewness and kurtosis of saccades indicate the presence of outliers or abnormalities in eye movement patterns.
3.2.4. Blinks
The rate of blinks is a measure of the frequency at which individuals blink their eyes, expressed as the number of blinks per second or minute. Blinks are influenced by various physiological factors, such as mood state, task demands, attention, and tension [75]. Research has shown that the blink rate increases as a function of time on a task, as well as fatigue and workload. However, it is important to note that the blink rate as a measure of cognitive load is task-specific and may not be applicable across all types of tasks [39]. In addition to the blink rate, there are several other blink-related features that researchers commonly use to study eyeblink behaviours. These features include blink count, blink frequency, mean, median, standard deviation, minimum, and maximum blink durations [59,63,76]. These measures provide valuable information on one’s eyeblink behaviour in response to different stimuli, tasks, and environments. As an example, the blink count and frequency provide insights into the overall blink rate and how it changes over time, or in response to different task demands. Meanwhile, the mean, median, standard deviation, minimum, and maximum blink durations reveal the temporal characteristics of eyeblink behaviours, such as the duration and variability of individual blinks. Moreover, recent research has explored the use of eyeblink behaviours as a potential marker of cognitive and emotional states. In this respect, changes in the blink rate and duration have been linked to changes in attention, arousal, and anxiety. This suggests that eyeblink behaviours serve as a useful mechanism for studying cognitive and emotional processes in various contexts.
3.2.5. Eye Gaze
The dynamics of eye gaze offer insights into cognitive states by analysing various features related to gaze biometrics and behaviours [77], which are often used in research studies. Some common features of gaze behaviours include the mean and standard deviation of the horizontal and vertical positions of the gaze. This provides information on the direction and focus of eye gaze, which can be used to infer an individual's attention and interest. Gaze transition is another feature that is often analysed in gaze biometrics. This includes transitions from the front to the right side, front to right front, front to rear, and front to left front [57,64,66,67]. These transitions provide insights into an individual's cognitive and emotional states, such as his/her level of engagement or distraction. Gaze distribution is also a commonly studied feature in gaze biometrics. It involves creating feature maps or images of the gaze behaviours, serving to identify areas of interest or patterns in one's gaze. Gaze density, which is a measure of the concentration of eye gaze in a particular area, is another useful feature. All these gaze biometric features offer is useful for deriving insights into various cognitive load states.
3.3. Eye-Tracking Features Constraints
To this end, several studies have investigated the relation of eye-movements like fixations, saccades, pupil size and blink number on cognitive processes. Through the tracking of the eyes, one can study a user’s physical reaction to a task and a system and adapt the interface accordingly. For example, in controlled environments, high-precision eye-trackers and pupillometers can be used to detect small pupil dilations that are indicators of cognitive load. Several studies has proved these eye-tracking features as a reliable source of monitoring cognitive load, however it suffers from a some constraints which needs to be addressed in eye-tracking studies.
3.3.1. Constraints in Eye Tracking in Dynamic Environments
Many eye-tracking glasses and video-based trackers available today require the eye to remain still and on-axis with respect to the eye tracking camera. However, in experiments involving dynamic environments like driving or flying simulators, this requirement poses a significant challenge [78,79]. Participants in such studies need to move continuously to interact realistically with the simulation. Thus, the conventional setup of eye trackers inhibits participants' natural behavior, compromising the ecological validity of the research outcomes. One of the most critical performance parameters of eye trackers is the sampling rate, measured in Hz [80]. A higher sampling rate allows eye trackers to capture more detailed information about eye movement behaviors, including fixations, saccades, and blink frequency. However, achieving a high sampling rate often entails using advanced eye-tracking sensors and increasing the number of infrared light sources, which consequently raises experimental costs and generates larger datasets for processing. Therefore, researchers must carefully consider the sampling rate of the eye trackers based on the specific requirements of their study. In studies focusing on cognitive load, where eye-tracking technology plays a significant role in understanding visual attention, the sampling rates of selected eye trackers typically range from 30 to 500 Hz. However, the most commonly selected sampling rates are 50 Hz and 100 Hz. Eye trackers with a minimum sampling rate of 50 Hz are generally deemed sufficient for detecting participants' fixations, eye gaze, and other relevant behaviors [81]. Most eye-tracking devices utilized in cognitive studies meet or exceed these requirements. It's important to note that while lower sampling rates may be sufficient for certain studies, they can introduce additional variations in the data, potentially affecting the accuracy and reliability of the results.
Eye-tracking technology employed in cognitive load studies can typically be classified into two main categories: desktop devices and wearable devices. Desktop devices consist of stationary eye-tracking systems where participants do not need to wear any additional equipment on their heads. Instead, they are seated in front of a monitor and engage with screen-based stimuli. These desktop setups are commonly utilized in laboratory settings, particularly in studies involving screen-based materials such as images and videos. While desktop eye-tracking systems offer precise measurements in controlled environments, they have limitations, especially when it comes to capturing eye movements during dynamic activities or simulations [82]. This is where wearable eye-tracking devices come into play. Wearable eye trackers are equipped with sensors integrated into glasses or head-mounted displays, allowing participants to move freely while their eye movements are recorded. This flexibility is particularly advantageous in simulator-based experiments where participants engage in activities that mimic real-world scenarios, such as driving or flying simulations. Moreover, wearable eye trackers can also be integrated with Virtual Reality (VR) headsets, allowing researchers to measure eye movements within virtual environments. This integration with VR significantly expands the scope of cognitive load studies, as it allows researchers to create and manipulate realistic scenarios without exposing participants to actual risks or hazards. However, wearing glasses or head-mounted eye trackers during dynamic activities, such as driving or flying simulations, can pose challenges. Excessive movements or shifts of the glasses can potentially interfere with the quality of the eye movement data collected [83]. Researchers need to address these issues by ensuring that wearable eye-tracking devices are securely fitted and do not impede participants' movements or comfort during the experiment.
3.3.2. Constraints Related to Features Estimation Methods.
Exploring the relationship between eye-tracking metrics and cognitive load presents a typical pattern recognition challenge, seeking to extract cognitive information embedded within eye movement data. While extensive research has focus on iris and pupil localization for eye detection and tracking [84,85], the process entails complexities influenced by multiple factors. Traditionally, the determination of pupil coordinates serves as a first step enabling gaze estimation and analysis of eye movements within images and video frames. Eye images are characterized not only by the intensity distribution of the iris, pupil, and cornea but also by their shapes [86]. However, it's essential to acknowledge the factors influencing eye appearance, including viewing angle, ethnicity, head position, lighting conditions, eye colour, eye state, and overall well-being [81]. Despite the general darker hue of pupils and irises compared to the surrounding eye area, thresholds can be applied effectively in cases where the contrast is pronounced. However, the operational mechanisms of commercially available eye-tracking systems like Tobii is unknown, posing challenges in certain cognitively demanding environments where off-the-shelf solutions may not be sufficient. Consequently, researchers often resort to developing custom eye-tracking setups using video cameras or leveraging open-source eye-tracking platforms [87].
To estimate pupil area via customized eye-tracking methodologies, researchers have devised iterative threshold algorithms grounded in skin-color models [39]. These algorithms identify dark areas meeting specific anthropometric constraints. However, the efficiency of such methods diminishes significantly in the presence of dark areas surrounding the eye, such as eyebrows or eyelashes [88]. Moreover, these approaches struggle to model eye closure accurately. In response to these limitations, alternative pupil detection techniques have emerged, including shape-based, feature-based, appearance-based, and hybrid methods. Shape-based methods describe open eyes by their contours, incorporating pupil and iris shapes alongside eyelid contours [89]. Feature-based approaches aim to identify local eye features less susceptible to illumination and viewpoint variations. Appearance-based methods rely on detecting and tracking eyes based on photometric characteristics, such as colour distribution and filter responses to eyes and surroundings. Hybrid methods Endeavor to integrate various techniques to mitigate the shortcomings inherent in individual methods. These conventional methods for gaze estimation rely on corneal reflections, necessitating precise localization of both the pupil centre and glints. Algorithms for pupil and glint localization typically leverage image processing techniques, such as morphological operators for contour detection and intensity threshold identification, followed by fitting using ray-based ellipse models. Hybrid methods based on topography employ a series of filters to estimate the iris centre. However, these techniques often assume that the pupil resides in the darkest area of the input image, rendering them vulnerable to fluctuations in illumination conditions that may necessitate manual adjustment of threshold parameters.
Recent advancements have seen the integration of DL algorithms into pupil segmentation processes, utilizing CNN to segment the pupil's region and subsequently determine the centre of mass within that region [90]. While these DL-based methods offer promising accuracy, they come with computational costs and increased processing requirements, rendering them less efficient for real-time implementation of these models. There is a need to develop accurate and lightweight DL models that can robustly predict pupil area while mitigating computational overhead. Future research endeavours should prioritize the refinement of DL algorithms and find a balance between accuracy and computational efficiency, thereby facilitating their practical application in real-time gaze estimation systems. Additionally, efforts to enhance the robustness of DL models against varying lighting conditions and occlusions would further enhance their utility in gaze estimation tasks across diverse environmental settings.
3.4. Eye-Tracking Data Analysis
Traditionally, eye-tracking data is analyzed by examining various metrics such as the duration and velocity of fixations, the characteristics of saccades, and the frequency of blinks [91]. These metrics provide valuable insights into cognitive processes, as they are often correlated with changes in cognitive load. Generally, a positive correlation has been observed between eye-tracking metrics and cognitive load; as cognitive load increases, there are typically longer fixation durations, faster saccade velocities, and an increased number of blinks [92,93]. This correlation suggests that as tasks become more cognitively demanding, individuals' eye movement patterns change in predictable ways, reflecting their heightened mental effort. However, this relationship is not universally observed across all studies. Research conducted by Desmet et al. [94], Walter et al. [95] and Schmidt et al. [96] has reported negative correlations or even a lack of correlation between cognitive load and certain eye-tracking metrics. These findings challenge the assumption that increased cognitive load always leads to more pronounced changes in eye movement behaviors. The variability in these findings could be attributed to several factors. Different tasks may place varying types of cognitive demands on participants, leading to different eye movement patterns. Additionally, individual differences in cognitive strategies and visual processing abilities can result in diverse eye-tracking behaviors under the same cognitive load. Environmental factors and the specific design of the eye-tracking study, such as the stimuli used and the duration of the tasks, can also influence the observed correlations.
To mitigate the challenges of analyzing eye-tracking data, researchers have traditionally employed parametric techniques such as ANOVA and t-tests. These statistical methods are used to detect significant differences between various levels of cognitive load by examining eye-tracking metrics [97,98]. However, ANOVA and t-tests come with inherent limitations. As parametric methods, they rely on specific assumptions about the data distribution namely, that the data are normally distributed and have homogeneity of variances. When the data is non-normal or skewed, these methods may not perform optimally. Furthermore, ANOVA and t-tests are not well-suited for handling complex relationships or high-dimensional data, which are often encountered in eye-tracking studies. Given these limitations, there is a growing necessity to employ ML and DL models to manage the complexity inherent in eye-tracking data. ML and DL techniques can handle large volumes of data with complex structures and uncover patterns that traditional parametric methods might miss. These advanced models are particularly effective in dealing with non-linear relationships and high-dimensional spaces, making them ideal for analyzing the intricate dynamics of eye movements under varying cognitive loads.
Currently, researchers often use ANOVA and t-tests in conjunction with ML and DL methods. For example, preliminary statistical tests can be used to identify significant features within the eye-tracking data [99,100], which can then be further analyzed using ML algorithms. This hybrid approach leverages the strengths of both parametric and non-parametric methods, providing a more comprehensive analysis framework. ML models, such as SVMs, Random Forests, and neural networks, can then be applied to these significant features to build predictive models of cognitive load. In addition, DL models, particularly CNNs and RNNs, have shown great promise in eye-tracking research [62]. These models can automatically learn feature representations from raw eye-tracking data, reducing the need for extensive manual feature engineering. CNNs, for instance, can capture spatial hierarchies in eye movement patterns, while RNNs can model temporal dependencies, both of which are crucial for understanding the dynamic nature of cognitive load.Moreover, combining parametric methods with ML and DL approaches allows researchers to cross-validate their findings and ensure robustness. For instance, significant features identified through ANOVA can be validated through ML model performance, ensuring that the detected patterns are not due to random chance. This integrated methodology enhances the reliability and validity of the research findings. The integration of ML and DL techniques with traditional statistical methods represents a significant advancement in the field of eye-tracking research. By addressing the limitations of parametric techniques and utilizing the power of advanced computational models, researchers can more accurately and comprehensively analyze eye-tracking data.
Statistical analysis of features
Eye movement features are a valuable source of cognitive information that is strongly linked to cognitive load. Extracting meaningful features from eye movement data requires careful consideration of the statistical methods used [101,102]. In addition, analysing eye-tracking data can be challenging owing to the large volume of data and complexity of the signals [103]. One important step to analyse eye-tracking data is feature selection, where relevant features are identified and extracted from eye-tracking data. Numerous research studies have utilised various statistical tests to analyse eye-tracking data and extract significant features. Among these methods, the t-test and ANOVA tests are commonly used to compare means across groups and identify statistically significant differences [99,100]. In this regard, Hijazi et al. [104] have used the t-test to identify significant features and determine whether there are significant differences between them. Similarly, Rizzo et al. [60], Kaczorowska et al. [58], Roy et al. [53] and Oppelt et al. [105] have employed the ANOVA test to extract significant features from eye-tracking data. By analysing the variance between groups and within groups, researchers can determine whether there are significant differences in means across different conditions or factors. Parametric methods are frequently utilised in eye movement research to compare various experimental conditions and assess feature effectiveness. However, these tests require the assumption of normality and equal variance, which may not always hold true in eye movement data.
To address this issue, various statistical tests to check the distribution of eye-tracking data can be employed. Yousefi et al. [106], used the Kolmogorov-Smirnov test, while Mitre-Hernandez et al. [52] used the Shapiro-Wilk test to assess the normality of eye-tracking data. If the data samples do not follow a normal distribution, non-parametric tests, such as the Wilcoxon rank-sum test, can be used to evaluate feature efficiency. The Wilcoxon rank-sum test is a non-parametric method that can be used to compare two groups of data and is particularly useful when dealing with small sample sizes or non-normal data distributions. It ranks the data values and then computes the test statistics based on the sum of the ranks for each group. This test is robust to deviations from normality and can be used to evaluate the efficiency of the extracted features from eye movement data. Both parametric and non-parametric tests have their advantages and limitations when evaluating feature efficiency in eye movement data. While parametric tests such as t-test and ANOVA are commonly used, non-parametric tests such as the Wilcoxon rank-sum test can provide more reliable results when the assumptions of normality and equal variance are not met. By carefully selecting appropriate tests and considering specific research questions and characteristics of the data being analysed, feature efficiency can be accurately evaluated pertaining to eye movement data, leading to a better understanding of cognition and related behaviours.
3.5. ML/DL Models on Eye Movement Studies
Eye tracking provides valuable indications of how individuals process information by measuring their visual attention. After feature selection, the next step is the automatic classification of eye-tracking signals, which can be accomplished by using ML and DL algorithms. As an example, eye-tracking data can be classified based on the level of cognitive loads, the type of tasks, or the emotional states of an individual. Figure 4 illustrates the distribution of studies that utilize different ML and DL algorithms for classifying eye-tracking data. This figure provides a comprehensive overview of the algorithmic approaches adopted in the research community, showcasing the prevalence and popularity of various techniques. By analysing eye tracking data, various patterns associated with eye movements that correspond to different levels of cognitive load can be identified.
Figure 5 illustrates the trend of cognitive load classification, as observed in various eye-tracking studies. These studies have extensively utilized statistical tests to determine the optimal feature sample size for processing eye-tracking data. The selected statistical features encompass a wide range of metrics, including mean, variance, maxima, minima, slope, skewness, kurtosis, and normalization, among others. These features are derived from essential eye-tracking parameters such as pupil size, blink rate, fixation duration, saccades, and eye-gaze. The process of cognitive load classification using ML/DL techniques involves leveraging these statistical features. By training ML/DL models with labelled datasets, the classification of cognitive load levels becomes feasible. This approach has been widely adopted and has shown promising results in discerning different cognitive load states.
However, some recent studies have taken a different approach by bypassing the traditional statistical feature selection techniques altogether. Instead, they directly apply the raw eye-tracking data to ML/DL models for cognitive load classification. These studies aim to explore the potential benefits of using unprocessed data, allowing the ML/DL models to automatically extract relevant patterns and features from the raw inputs. We will delve deeper into these studies and their outcomes in the subsequent sections of this discussion. The decision to employ statistical feature selection or direct raw data application depends on various factors, including the complexity of the cognitive load classification task, the size of the available dataset, and the computational resources at hand. Each approach has its advantages and challenges, and further research is necessary to determine the most suitable method for specific scenarios.
ML/DL-based algorithms provide predictive models for cognitive load classification based on eye-tracking data. These models can be used to develop accurate and personalised measures of cognitive load for different individuals, tasks, and learning materials. Many different ML/DL algorithms can be used for automatic classification of eye-tracking data. Table 3 provides a summary of recent ML/DL studies in eye-tracking classification. These studies use a range of ML/DL algorithms, including decision trees, random forests, Support Vector Machines (SVM), k-Nearest Neighbours (k-NN) classifier, and neural networks, to classify eye-tracking data. Table 3 also includes information on the features used in each study, number of participants, and accuracy of the classification model. These algorithms can be trained using labelled data, whereby eye-tracking signals are labelled into appropriate categories. The trained models can then be used to classify new eye-tracking data samples that have not been learned previously.
In the following sections, we will thoroughly analyse and compare the outcomes of both feature selection techniques and direct raw data application in cognitive load classification using ML/DL models. This analysis aims to shed light on the potential improvements and limitations of each method, ultimately contributing to the advancement of cognitive load assessment and its practical applications in various fields such as education, human-computer interaction, and healthcare.
3.5.1. Support Vector Machines (SVM)
The SVM is a supervised learning model for data classification and regression analysis. Originally, the SVM has been used as non-probabilistic binary classifiers, but they have now been extended to handle multi-class problems. The SVM works by creating hyperplanes in an n-dimensional space that divides the data samples into various groups or classes. It has been utilised in many eye-tracking studies for cognitive load classification with promising results, e.g., for accurately identifying the level of cognitive load experienced by individuals. Table 4 shows the strength and limitation of studies that utilize the SVM for eye-tracking data. These studies highlight the versatility and potential of SVMs in analysing eye-tracking data for various applications.
Liao et al. [57] conducted a study that aimed to evaluate the performance of drivers in a cognitively distracted environment by combining eye features and driving performance features obtained from a driving simulator. The study used the SVM Recursive Feature Elimination (SVM-RFE) model to select the most optimal features from eye-tracking signals. The selected features were then used to train the SVM with radial basis function to classify normal and cognitively distracting driving scenarios. To evaluate the performance of drivers, a detection response task was used. The experimental results revealed that the fusion of features did not necessarily demonstrate significant improvements, implying that the combination of eye features and driving performance features might not always lead to better results. However, the SVM model used was able to effectively classify normal and cognitively distracting driving scenarios, demonstrating the potential of using ML algorithms in eye-tracking research for cognitive load classification pertaining to driving scenarios. Cao et al. [64] developed an intention recognition system by utilising the cognitive process and eye-tracking technology to estimate the direction of an endoscope. The system was controlled by two classifiers, the SVM and a Probabilistic Neural Network (PNN).
The SVM classifier used an individual's eye movement velocity and pupil variation to estimate his/her intention, while the PNN classifier used intentional gaze segments to control the direction of the endoscope. The study aimed to improve the accuracy and efficiency of endoscope operation by using the intention recognition system. The study involved a group of participants who performed a simulated endoscope operation task while their eye movements were recorded using an eye-tracking device. The recorded eye data set was then used to train and test the SVM and PNN classifiers. The SVM classifier yielded higher accuracy in estimating the participant's intention, as compared with that from the PNN classifier. However, the PNN classifier was more effective in controlling the direction of the endoscope using intentional gaze segments. Roy et al. [53] conducted a study based on eye-tracking data solicited from participants observing the Young girl and Old Woman image (YGOW) and the Duck and Rabbit (DR) images to understand cognitive behaviours. The fixation data set was analysed using the bucket algorithm to identify a total of 46 optimal features. Additionally, one-way ANOVA was applied to select 6-dimensional features from YGOW images and 9-dimensional features from DR images. To further reduce the data dimensionality, the Principal Component Analysis (PCA) was applied. The study provided a detailed analysis of several ML classifiers, including decision trees, linear discriminant analysis, quadratic discriminant analysis, SVM with linear, quadratic, and cubic kernel functions, bagged trees, and k-NN models.
For the DR images, decision trees, linear discriminant analysis, and bagged trees achieved similar results, while SVM and bagged trees achieved nearly 90% accuracy. This study offered insights into the use of ML classifiers for analysing eye-tracking data toward understanding cognitive behaviours. Sabab et al. [61] proposed a pipeline-based approach to extract eye features from webcam images for the classification of visual attention tasks. Initially, facial regions were extracted from the images using the voila-jones algorithm. The iris areas were detected using heuristic calculations [108], histogram equalisation, Gaussian pyramid, Circular Hough transform, and Kalman filtering on the extracted facial regions. The extracted eye regions were used to compute features such as Maximum Fixation Count (MAX_FC), Minimum Fixation Count (MIN_FC), Average Fixation Count (AVG_FC), and Movement Ratio (MR) for classification purposes. The extracted features were employed to train several classification algorithms, including k-NN, Gaussian Naive Bayes (NB), Logistic Regression (LR), random forest (RF), and SVM with a linear kernel function. The SVM performed better in terms of accuracy, precision, recall, and F1-score as compared with those from other algorithms.
However, RF produced a higher AUC of 0.9631, as compared with 0.9548 from the SVM. The study also found that the eye-movement ratio and average fixation count contributed more toward classification. For visual attention tasks, younger adults tended to lean toward graphical tasks while older adults were more inclined toward word tasks. The proposed method was efficient for extracting eye features to facilitate classification of visual attention tasks. Although the SVM has been extensively used in eye tracking studies for cognitive load classification, there are some issues associated with its usage. The performance of SVM models can be highly dependent on the choice of kernel function used. Linear kernels are often used for feature selection and interpretation, while non-linear kernels, such as the radial basis function, are commonly used for classification. In addition, the performance of SVM models can vary depending on data characteristics, as some eye tracking data sets may not have a clear separation boundary that can be learned using an SVM model.
3.5.2. Naive Bayes
The Naive Bayes algorithm has gained popularity due to its foundation on the Bayesian probability theorem. Unlike other classification algorithms, Naive Bayes doesn't require the specification of an outcome, and it uses conditional probability to assign data samples to the predicted classes, making it a form of unsupervised learning. However, when used for classification purposes, Naive Bayes requires both input and target variables and hence makes it a supervised learning technique. Naive Bayes has been utilised in several studies for cognitive load classification with eye-tracking data. Table 5 provides an overview of the strengths and limitations of studies that employ the Naive Bayes algorithm for eye-tracking data analysis. These studies showcase the adaptability and potential of Naive Bayes in deciphering intricate patterns within eye-tracking data for cognitive load assessment and related applications.
Pillai et al. [67] investigated the effectiveness of Naïve Bayes using the information of the Signal to Noise Ratio (SNR) and eye tracking data to assess the cognitive load of drivers in a simulation environment. The results of the SNR analysis revealed that entropy-based eye features gave a greater contribution in classifying cognitive load as compared with that of Driving Response Time (DRT). Moreover, the study highlighted that feature such as the Nearest Neighbour index (NNI), entropy of eye movements, and entropy of gaze transitions could further improve the classification accuracy, in view of their higher SNR scores. The study emphasised the potential of SNR in selecting useful features from data samples. While the research did not compare the classification results from other ML or DL algorithms, it provided a comparison of accuracy derived from different combinations of features.
The performance of participants under cognitive load induced by CAPTCHA puzzle images was evaluated in a study conducted by Ktistakis et al. [76]. Optimal eye features for classification were selected using two-way ANOVA analysis, and ML algorithms, namely Gaussian Naive Bayes (GNB), Random Forest (RF), Linear Support Vector Machine (SVM), Ensemble Gradient Boosting (EGB), K-Nearest Neighbour (k-NN), Bernoulli Naive Bayes (NB), Logistic Regression (LR) and Decision Trees (DT) were used for classification. The finding indicated that GNB outperformed all other algorithms, with similar results shown by the DT classifier.
3.5.3. k-Nearest-Neighbors (k-NN)
The k-NN algorithm is an instance-based statistical analysis method for tackling classification tasks. To implement this method, an integer k, a set of training data, and a closeness metric must be specified. The training set is used to define different regions with respect to different classes in the input space. When an unlabelled data sample is given, the k-NN classifier searches for k training samples in the input space that is the closest to the given sample and assigns it to the class that has the most nearby training samples.
In a study conducted by Hirayama et al. [19], eye gaze patterns were used in combination with peripheral vehicle heatmaps to classify driving behaviours in both neutral and distracted environments. The performance of k-NN classifiers with k=1, 3, 5, 7, and 9, as well as class-featuring information compression (CLAFIC), Multiple Similarity Method, and eigenspace methods, were compared. The k-NN classifier with k=7 achieved 80.4% accuracy in classifying neutral driving and 95.4% accuracy in classifying distracted driving. This study indicated the potential of using eye-tracking data in combination with other types of information, such as vehicle heatmaps, to improve classification accuracy in real-world scenarios. It also demonstrated the effectiveness of k-NN in classifying complex behaviours based on multimodal data. While the k-NN is a popular algorithm due to its simplicity and ease of implementation, it has some notable drawbacks. One major disadvantage of the k-NN is its computational demand, which grows in accordance with the data set size. This is because, for a given data sample, the k-NN algorithm needs compare it with all data samples in the training set to find the k closest neighbours. Additionally, its performance is susceptible to high-dimensional data or noisy data with irrelevant features. Improving current k-NN algorithms can be approached in several ways. Firstly, the selection of optimal features using techniques such as PCA, ANOVA, or t-test can aid in maintaining the impact of noisy data by removing irrelevant features [109]. By focusing on the most informative features, the algorithm can operate more effectively, leading to improved classification accuracy. Moreover, enhancing the performance of eye-tracking data processing is necessary for enhancing the overall performance of k-NN classifiers. One approach involves optimizing the approximation methods utilized for proximity searches. Techniques such as k-d trees [110], k-d forests [111], or the progressive k-NN algorithm have been proposed as alternative methods for efficiently locating nearest neighbours [111]. While these approximate algorithms offer promising approaches for improvement, their performance has been found to be comparable to traditional k-NN algorithms in many cases. Therefore, while they present potential enhancements, further exploration and refinement are necessary to fully exploit their capabilities and distinguish their advantages over conventional k-NN approaches.
3.5.4. Random Forests
A random forest is an ensemble learning algorithm introduced in [112]. The name "random forest" refers to the creation of a "forest", or an ensemble of decision trees, trained on randomly sampled data subsets from an original data set. Each decision tree in the forest is constructed using a different subset of features in the data set and a different subset of the training samples. By aggregating the predictions of decision trees, a random forest can provide accurate and robust predictions than single decision tree. One of the key advantages of random forest models is their ability to handle a wide range of data types and can work with missing values and outliers in the data set. Table 6 presents a comprehensive overview of the strengths and limitations of studies that utilize the random forest algorithm for the analysis of eye-tracking data. Additionally, random forest models provide a measure of variable importance, which can help identify the most relevant features for making accurate predictions. Random forests can be used to analyse eye-tracking data by creating an ensemble of decision trees that are trained on randomly sampled subsets of the data.
Mitre-Hernandez et al. [51] analysed cognitive workload by using memorisation tasks with varying levels of difficulty. To classify the resulting cognitive workload, they used the Tukey HSD test to identify the significant variables. The study evaluated several ML algorithms, including Support Vector Machine (SVM), Decision Tree (DT), Linear Discriminant Analysis (LDA), and Random Forest (RF) for the classification of mental workload. The Random Forest model outperformed the other ML algorithms in classifying cognitive workload. This study indicated the potential of using ML algorithms, specifically Random Forest, to accurately classify cognitive workload based on eye-tracking data. In another study, Mitre-Hernandez et al. [52] employed the Shapiro-Wilk test to assess the distribution of data, which showed that the data samples were not normally distributed. The study classified different levels of mental workload in a game-based environment using the random forest algorithm. To detect the significant variables, the Wilcoxon signed rank test was utilised. A combination of several features, including the total errors, time to complete the stage, and peak dilation, yielded an accuracy of 87.5%. In contrast, the peak dilation features alone achieved only 62.5% accuracy. This study highlighted the importance of selecting appropriate statistical tests to analyse non-normally distributed data in eye-tracking studies. The findings also suggested that ML algorithms such as random forest models served as an effective approach to classifying different levels of mental workload in a game-based environment. The use of multiple eye-tracking features could improve the accuracy of mental workload classification. These findings have important implications in game design, where understanding mental workload can lead to the development of more engaging and effective games.
Kaczorowska et al. [63] employed ex-gaussian statistics to identify relevant features from eye tracking data. The feature derived from the symmetric standard deviation of normal components was not significant in classification, therefore was discarded from further analysis. On the other hand, the mean and exponential information of data distribution pertaining to saccade, fixation, and blink-related features were found to contribute significantly to the classification process, achieving 96% accuracy when the random forest model was applied, outperforming other algorithms, such as decision trees, SVM with a linear kernel function, and logistic regression. The use of ex-gaussian statistics to select relevant features combined with random forest indicated the potential of ML in accurately classifying cognitive workload levels based on eye tracking data. Nonetheless, further research to explore the potential of other ML algorithms and feature selection techniques for improving classification accuracy is useful. Bafna et al. [54] induced six levels of mental workload using an eye typing task. The level of task difficulty was based on the Leipzig corpus and the readability score Lasbarheits index (LIX) score [113]. To classify different mental workload levels, the data set was labelled using the Hidden Markov Model. Four ML algorithms were trained, namely AdaBoost [114] regressor with regression trees, random forest regression, partial least squares regression, and support vector regression with bagging. Experimental results indicate that the random forest regression model performed better in terms of variance and mean absolute error as compared with those from other models, indicating its effectiveness in classifying the levels of mental workload induced by an eye-typing task. Random forests have emerged as a significant tool for predicting cognitive load using eye-tracking data. However, directly comparing the results across different studies is complex due to various influencing factors such as disparate sample sizes, diverse eye-tracking modalities, and differing methods for feature selection. Despite these challenges, commonalities emerge among the studies, including similar approaches to performance validation and a consistent trend indicating that combining features from different categories enhances cognitive load prediction accuracy. Notably, the literature highlights instances where random forest classifier achieved remarkable accuracies, approaching 97%, particularly when trained on high-dimensional and multi-modal data [115]. This exceptional performance underscores RF's unique ability to discern changes in variables that may remain undetected by alternative algorithms. Upon these findings, it becomes evident that random forests strength lies in its capacity to effectively integrate diverse data sources and identify subtle patterns within them. By harnessing the collective information from various eye-tracking modalities and feature categories, RF models can identify relationships that contribute to accurate cognitive load classification. Moreover, the consistent validation approaches adopted across studies contribute to the reliability of the observed trends.
While random forest models have shown promising results in cognitive workload classification using eye-tracking data, they still suffer from some drawbacks. It is often difficult to understand how a random forest model arrives at its predictions. This is because a random forest generates multiple decision trees with different variable subsets and different splits, which makes it challenging to interpret the overall prediction process. Another limitation is its demand for significant computational resources, especially when working with large data sets with high-dimensional data. Therefore, further investigations on solving these drawbacks are necessary, in order to optimal the performance of ML algorithms in cognitive load analysis with eye-tracking data. Moreover, the studies reviewed have employed various feature extraction methods, including Tukey's HSD [51], ex-Gaussian statistics [52], and Hidden Markov Models [54]. While these techniques have contributed to understanding cognitive workload dynamics, the optimization of feature space remains a critical aspect for developing consistent and practical classification systems. Additionally, optimizing the feature space holds promise for informing the design of future application-oriented eye-tracking sensors. Further research efforts should focus on evaluating the robustness of feature spaces created using filter or embedded feature selection methods. By systematically assessing the effectiveness of different feature selection techniques, researchers can identify the most informative and discriminative features for cognitive load classification. This, in turn, will facilitate the development of more accurate and efficient ML models tailored to cognitive workload analysis with eye-tracking data.
3.5.5. Ensemble Machine Learning Methods
Ensemble methods work on the principle of combining multiple models to improve the overall predictive performance. In particular, boosting is an ensemble method that iteratively trains weak models, which are then combined to form a strong model. XGBoost and LightGBM are two popular gradient-boosting models that use the boosting method to improve the predictive performance of decision trees. XGBoost and LightGBM take the boosting concept a step further by incorporating techniques to enhance performance and efficiency. They optimize the learning process by assigning appropriate weights to data points and utilizing advanced algorithms for constructing decision trees. These gradient boosting models excel at capturing complex relationships within the data, handling both numerical and categorical features effectively, and combating overfitting through regularization techniques. Table 7 provides an overview of the strengths and limitations of studies that utilise the power of ensemble methods, specifically XGBoost and LightGBM, for the analysis of eye-tracking data. These studies underscore the immense potential of ensemble methods in enhancing the accuracy and robustness of cognitive load classification and other applications involving eye-tracking data.
These models implement several optimisation schemes to improve the speed and accuracy of the boosting process. Zhou et al. [55] utilised an ML ensemble model known as LightGBM (Light Gradient Boosting Machine) to predict situation awareness during takeover conditions in a simulated environment [116] with automated driving. The model was trained using eye-tracking data such as fixation, pupil diameter, and saccades, which were selected using the Shapley Additive Explanation (SHAP) algorithm [117]. In the study, the performance of LightGBM was compared with those from other ML models, such as Linear SVM, Quadratic SVM, Gaussian SVM, Linear regression, Random Forest, and XGBoost algorithms. The performance indicators included RMSE, MAE, and correlation between the actual and predicted values. Similarly, Bachurina et al. [56] investigated the use of reaction time, difficulty level, and eye-tracking data to predict cognitive load during a colour-matching task. The extracted features were used to train Linear Regression, Lasso Regression, Ridge Regression, k-NN Regression, XGBoost Regression, and Random Forest Regression models. The experimental results indicated that XGBoost outperformed the other models. Furthermore, the mean, standard deviation, maximum and minimum values of eye movement features were identified as the important factors for classification. Both XGBoost and LightGBM have been shown to achieve state-of-the-art performance on a range of tasks, including classification, regression, and ranking. However, their performance is affected by several factors, such as the size of data sets, model complexity, and computing resources. Additionally, both models require tuning of hyper-parameters to achieve optimal performance.
3.5.6. Artificial Neural Network (ANN)
ANNs mimic the neural structure of the human brain [118]. ANNs are composed of interconnected nodes, known as neurons, which are grouped into layers. The input layer receives the data samples, while the output layer produces the predicted results. In between the input and output layers, there can be one or more hidden layers that process the data samples [119]. The ability of ANNs to handle complex and nonlinear relationships in data sets has made them a popular tool for many applications, including the classification of cognitive load using eye-tracking data. In recent years, several studies have explored the use of ANNs for accurately classifying cognitive load levels based on eye-tracking measures. In Table 8, we presented a comprehensive overview of the strengths and limitations of studies that leverage ANNs for the analysis of eye-tracking data. Two selected papers that employ ANNs for this purpose are discussed, demonstrating their potential effectiveness in cognitive load classification. One of the benefits of using ANNs for cognitive load classification is their ability to learn from large amounts of data, which can improve the accuracy of the classification. ANNs can also adapt to new data, making them versatile and adaptable to different contexts and situations.
Kaczorowska et al. [58] conducted feature selection using ANOVA and verified the normal distribution and variance equality of the selected variables using the Kolmogorov-Smirnov test. The study explored the use of several ML algorithms, namely SVM with linear, quadratic, and cubic kernels, Logistic Regression, Decision Tree, k-NN, the Multilayer Perceptron neural network, and Random Forest to classify different levels of mental workload based on eye-tracking data. The results indicated that fixations and saccades were more significant features for classification than other eye-related features. The SVM with linear kernel function and logistic regression models performed similarly to the multi-layer perceptron, which outperformed other algorithms. Rizzo et al. [60] used 7 fixation and 22 saccade features from the Stroop task to classify different levels of mental workload. To select useful variables for classification, the ANOVA test was applied to all the features. Several ML algorithms, including ANN, SVM, logistic regression, and random forest, were evaluated. The experimental results indicated that the maximum and minimum fixation features performed significantly better as compared with other features, and random forest exhibited the worst performance in the classification task. One benefit of using ANNs for cognitive load classification is their ability to learn from large data sets, which can improve classification accuracy. ANNs can also adapt to new data, making them versatile and robust to different contexts and situations. Despite their effectiveness, ANNs have limitations in terms of their trial-and-error training process, which is time-consuming. Additionally, the optimal number of hidden neurons in the network is often unknown, and selecting an incorrect number can lead to overfitting or underfitting a given data set, compromising the performance [120].
3.5.7. Convolutional Neural Network (CNN)
CNNs have emerged as one of the most widely used cognitive load classifiers using eye-tracking data. One of the primary reasons for their effectiveness is that they can extract features from raw signals automatically, which eliminates the need for manual feature engineering [121]. This is particularly advantageous in the context of cognitive load classification, as it allows CNNs to learn and identify features that are most relevant to the cognitive load levels. Another reason why CNNs are effective for cognitive load classification is that they rely on spatial features. Eye tracking data provide information on the spatial distribution of fixations, saccades, and other eye movements, which allow a CNN to extract meaningful features. As an example, the CNN can identify regions of interest in the visual stimuli that are most relevant to the cognitive load levels and use this information to make a prediction. The basic structure of a CNN includes several layers, such as the convolutional layer, pooling layer, and fully connected layer [122].
The convolutional layer, which is the first layer in a CNN, performs feature extraction from a large amount of data. In the context of cognitive load classification, this layer is able to extract relevant features from eye-tracking data, such as the duration and frequency of fixations and saccades, as well as pupil size and blink rate. The pooling layer is the next in a CNN, and it compresses the input feature map to extract the main features. This layer can be used to reduce the data dimensionality while retaining the relevant features for classification. The fully connected layer is the last in a CNN, which processes the features extracted from the previous layers to produce the final output. In the context of cognitive load classification, this layer classifies different levels of cognitive load based on the extracted features. In the literature on cognitive load classification using eye-tracking data, several studies have explored the use of CNNs as a classification algorithm. Specifically, we have identified three studies that have successfully implemented CNNs for this purpose.
Rahman et al. [59] utilised eye-tracking data and camera images to extract saccade and fixation information from drivers in a simulation environment. The study found a strong correlation between the features obtained from both data modalities, with correlation scores ranging from 0.98 to 0.95. The main objective of the study was to classify the mental workload of drivers using various ML and DL classifiers. The ML classifiers used were SVM, LR, LDA, k-NN and DT, while the DL classifiers explored were CNN with a 16-layered network and an LSTM network. These models were trained using features with sample sizes of 60, 30, and 15 seconds. The experimental results that the models achieved the highest accuracy with the 30-feature data set, and 5-fold cross-validation achieved higher accuracy than holdout cross-validation. Although the accuracy of SVM was higher than that of CNN, the lower accuracy of CNN could be attributed to the small dataset size used in the study.
Okafuji et al. [66] introduced a new approach to analyse the cognitive behaviours of drivers during the control of the steering wheel using a DL model. Specifically, they proposed a CNN-based model named FB-Delay-Pilot Net, which had 11 layers. The model was trained on feature maps generated from eye gaze data. The study found a strong association between eye gaze data and steering wheel performance. Since the study was conducted with only three participants, the results might not generalise to more complex driving scenarios. Further research is necessary to replicate and validate the findings with larger sample sizes and more diverse driving scenarios, in order to fully evaluate the potential of the proposed approach. Nevertheless, this study demonstrated a promising step toward utilising DL models and eye gaze data to better understand and improve driver behaviours and performance.
Fan et al. [62] conducted a study using heatmaps of participants' fixation counts to train Siamese networks. The study classified participants who previously passed the examination using their eye-tracking data with two Siamese networks. The first was trained from scratch, while the second was trained using the pre-trained weights of the VGG-16 model, which had a similar structure to that of the Siamese network. While the second model outperformed the first, the performance difference was not significant. The study demonstrated the feasibility of using Siamese networks for the classification of eye-tracking data. Further studies to ascertain the effectiveness of these models on different types of data and tasks are necessary.
These studies collectively illustrated the effectiveness of integrating diverse eye-tracking features into a unified tensor, thereby enabling the extraction of complementary signals through convolutional operations. This method offers a straightforward implementation path without necessitating extensive modifications to standard CNN structures. CNNs can be deployed in various configurations and architectures, allowing for versatility in addressing different applications associated with the eye-tracking data analysis. Interestingly, many of these studies presented here developed custom CNN architectures based on their specific research objectives and datasets. CNNs represent a paradigm shift in data analysis, revolutionizing the way information is extracted from spatial data. Unlike traditional methods that often necessitate meticulous feature engineering to uncover relevant patterns, CNNs possess the remarkable ability to extract meaningful features from raw input data [32]. In conventional parametric or machine learning approaches applied to eye-tracking data, feature engineering involves carefully combing through input data redundancies and extracting latent variables to best describe the response variable. Essentially, these models must be trained to recognize relevant features before tackling the problem at hand. While feature engineering offers a degree of control over the model by leveraging prior knowledge, its efficacy is constrained when confronted with unknown systems characterized by myriad dimensions and intricate interactions. In contrast, CNNs learn to perceive features iteratively through the optimization of transformations, particularly within their convolutional layers [123], throughout the training process. This end-to-end learning principle renders traditional feature engineering obsolete, potentially obviating the need for additional preprocessing steps. Moreover, supplementary feature engineering methods, such as feature extraction via ANOVA or t-tests, may inadvertently introduce information loss and undermine model accuracy. Consequently, deep learning shifts the focal point from defining what a model should learn to refining how a model should learn. Despite their advantages, CNNs also have some limitations when used for cognitive load classification. In Table 9, we present an inclusive overview of the strengths and limitations of studies employing CNNs for the analysis of eye-tracking data.
One of the main limitations is that they can be computationally intensive, requiring powerful computing hardware and significant processing time [124]. Additionally, CNNs can be prone to overfitting if they are trained on small data sets. CNN models are also complex. Overfitting in models isn't solely determined by the number of parameters; it's also influenced by the representativeness of the sampled data [125]. In eye-tracking studies, samples are often taken under limited conditions, increasing the risk of model overfitting to these specific scenarios. A simple fix is to enlarge the training dataset to include more variance or a wider range of circumstances. However, acquiring labelled observations can be prohibitively expensive. Researchers commonly resort to data augmentation techniques, which involve generating additional samples synthetically from existing data. Among the diverse methodologies for data augmentation, Generative Adversarial Networks (GANs) stand out as an elegant framework. Rooted in game theory principles, GANs operate through a dynamic interplay between a generator module, responsible for crafting synthetic data, and a discriminator module tasked with distinguishing between synthetic and authentic data [126]. Throughout the training process, GANs refine their ability to synthesize observations from noise while simultaneously honing their discrimination skills. This dual objective enriches the creation of high-quality synthetic data that closely mimics the characteristics of real-world observations, thereby enriching the training dataset and mitigating the risk of overfitting.
3.6. Eye-Tracking and Other Physiological Measures for Cognitive Load Classification
Instead of solely relying on eye-tracking data, there are studies that combine them with other physiological data for cognitive load classification. Figure 6 illustrates the distribution of studies using eye-tracking data alone to classify cognitive load, compared to those that integrate eye-tracking with other physiological signals. The rationale includes the complex nature of cognitive load and the fact that eye movements are just one aspect of the overall physiological response. Although eye tracking can provide useful information on gaze patterns and fixation durations, but it does not capture a full range of physiological responses that can occur during cognitive tasks. When performing a task that demands a high cognitive load, individuals can experience various physiological changes, including alteration in heart rate, breathing patterns, and brain activity. These changes can be measured using various parameters such as Electrodermal Activity (EDA), Electrocardiography (ECG), Electromyography (EMG), Electroencephalography (EEG), Photoplethysmogram (PPG), skin temperature, Heart Rate Variability (HRV), Galvanic Skin Response (GSR), and Respiration Rate (RR). Each of these parameters provides a unique insight into an individual's physiological response toward cognitive tasks.
By employing deep learning techniques, researchers aim to develop models that can effectively detect and classify cognitive load based on the physiological data collected [127]. Deep learning algorithms have demonstrated great potential in handling complex patterns and extracting meaningful features from large datasets [128], making them well-suited for analysing the intricate relationships between physiological responses and cognitive load. Alternatively, researchers may opt to extract relevant features from the physiological data before inputting them into deep learning models [129]. This feature extraction process involves applying signal processing techniques to derive meaningful characteristics that capture the variations and patterns specific to cognitive load. These extracted features can then be used as inputs to the deep neural networks, enabling them to learn the relationships between these features and cognitive load levels.
Integrating eye tracking with other physiological measures can provide a more complete picture of an individual's physiological response, which can improve the accuracy of cognitive load classification. Table 10 provides a summary of recent studies on the fusion of eye-tracking data with other physiological signals. Since there exist individual differences in the physiological response toward cognitive tasks, some may show a stronger physiological response in one measure as compared with another, which can make it difficult to accurately classify cognitive load based on just a single measure. These fusion approaches enable the classification model to consider a broader range of physiological responses, thereby improving the classification accuracy and reducing the impact of individual variations. Moreover, integrating multiple physiological measures facilitates a more comprehensive understanding of the complex interplay between cognitive load and physiological responses. Different measures capture various aspects of the physiological state, such as heart rate, respiration rate, electrodermal activity, and brain activity. By examining these multiple dimensions, researchers gain a deeper understanding of the underlying mechanisms and dynamics associated with cognitive load.
Similar to research that solely leverages eye-tracking data to analyse cognitive load, studies that utilise eye-tracking data alongside other physiological measures have also relied on statistical methods to analyse the gathered data sets. To combine features from different modalities that are normally distributed, the t-test and ANOVA are frequently used. Meanwhile, the Wilcoxon test is employed to combine features that do not follow a normal distribution. Oppelt et al. [105] took an additional step to ensure the accuracy of the results by normalising all features using subject-wise z-scores. This approach took into account the unique distribution of each subject's data and standardised it accordingly. After extracting useful features, the next step involves classification. Various studies have utilised multiple physiological measures to analyse cognitive processes and mental workload. He et al. [115] evaluated several ML algorithms for the purpose of predicting human emotional states, namely k-NN, SVM with radial basis function, feedforward neural network, recurrent neural network, and random forest. To determine the accuracy of each algorithm, a combination of physiological measures, including eye tracking, heart rate (HR), electrocardiogram (ECG), and galvanic skin response (GSR), was used. The results revealed that prediction accuracy increased up to 34.5% with a combined data set. Similarly, Yousefi et al. [106] used a combination of pupil diameter and electrodermal activity (EDA) features to study cognitive load. Their research aimed to understand the relationship between cognitive workload and physiological responses. Meanwhile, Hijazi et al. [104] combined eye-tracking and heart rate variability (HRV) features to investigate the relationship between cognitive workload and cardiac response. Their study focused on understanding how cognitive workload could affect cardiovascular responses, and how these responses could be used to assess cognitive workload.
In another study, Wang et al. [131] utilised a combination of EEG and eye-tracking features to analyse mental workload in a simulated cognitive environment. The Relief algorithm was employed to select features indicative of cognitive load. This approach identified the δ, θ, and γ frequency bands, as well as the left-eye pupil diameter (LEPD), right-eye pupil diameter (REPD), and fixation time (FT), as key features of cognitive load analysis. Their research identified the underlying neural mechanisms of cognitive workload and determined the effectiveness of using EEG and eye-tracking features in assessing cognitive workload. These studies highlight the importance of utilising multiple physiological measures in analysing cognitive processes and workload. By combining features from different modalities, researchers can gain a comprehensive understanding of the underlying mechanisms that contribute to cognitive processes. Furthermore, these studies demonstrate that the use of various physiological measures can be effective in assessing cognitive workload in different contexts. Vaitheeshwari et al. [27] conducted a study to investigate the effectiveness of incorporating Galvanic Skin Response (GSR) features for ML models to predict cognitive load levels. A combination of GSR data and eye-tracking features was formed for the classification of cognitive load using a 7-layered Convolutional Neural Network (CNN) and a Long Short-Term Memory (LSTM) model with 50 units. To compare the performance of different ML algorithms, the accuracy of 1D-CNN, LSTM, SVM, and Random Forest models was compared. The SVM algorithm outperformed other models. The study found that incorporating raw features resulted in better accuracy for LSTM and 1D-CNN models. However, when using GSR data, the combination of GSR features achieved the highest accuracy, which outperformed other feature combinations. The results of this study suggested that incorporating GSR features could substantially enhance the usefulness of ML models in predicting cognitive load levels. The finding implied the importance of considering multiple physiological measures, such as GSR, in cognitive load analysis, particularly the effectiveness of SVM in predicting cognitive load levels. The advantage of ML/DL-based approaches lies in their ability to learn complex representations and capture intricate dependencies within the data. By leveraging the power of neural networks, these models can potentially uncover hidden patterns and nuances in the physiological responses that may not be readily apparent through traditional analysis methods. The integration of DL-based approaches in cognitive load classification research, leveraging multiple physiological signals, exhibits promising potential for enhancing the accuracy and robustness of these classification models. However, the integration of multiple physiological measures does present some challenges. These include the need for appropriate feature extraction techniques, data alignment and synchronization, and the selection of suitable fusion methods. Additionally, the dimensionality and complexity of the resulting dataset can pose challenges in terms of computational efficiency and model interpretability. Nonetheless, the integration of multiple physiological measures remains a promising approach for advancing cognitive load classification research. By considering the diverse physiological responses exhibited by individuals and making use of fusion techniques, researchers can improve the accuracy, robustness, and individual specificity of cognitive load classification models.
4. Challenges, Possible Solutions, and Limitations
Thus far, we have presented a comprehensive review of various ML and DL models for developing automatic cognitive load analysis based on eye-tracking data. To conduct a thorough and critical analysis of this topic, a total of 24 relevant research articles have been selected based on a set of inclusion and exclusion criteria. Of the 24 carefully selected research articles, 18 of them employ ML-based models, with the remaining 6 utilising DL-based models to build automatic cognitive load classification solutions using eye-tracking data. The chosen articles have been meticulously screened to ensure they are representative of the current state-of-the-art development in the field of cognitive load classification through eye-tracking data analysis. This study also delves into the categorization of workload using different AI models. While there is no universally standardized taxonomy to classify workload levels [132], as a few basic cognitive load levels cannot fully capture the entire spectrum, researchers and theorists have proposed various taxonomies based on cognitive load theory. One approach to classifying cognitive load involves utilising cognitive load tasks such as N-back tasks, Stroop tasks or creating virtual environments within simulated environments. These studies employ cognitively demanding tasks as stimuli to evoke specific physiological responses in subjects, which are then recorded to assess their mental states.
However, it is important to acknowledge the challenge of categorizing workload levels as they increase in complexity. Figure 7 presents a comprehensive list of challenges that arise when attempting to categorize workload levels as they increase in complexity. In the context of developing automatic cognitive load analysis based on eye-tracking data, these challenges play a significant role in shaping the direction and effectiveness of research efforts in the field. As the number of workload levels grows, it becomes increasingly difficult to assign them with distinct labels or categories. This complexity underscores the need for sophisticated AI models capable of accurately capturing and analysing the intricate nuances of cognitive load. Considering these factors, this paper provides a comprehensive framework for the classification of cognitive load using eye-tracking data. By examining the methodologies, algorithms, and performance metrics presented in the selected articles, this review offers a comprehensive understanding of state-of-the-art techniques in the domain and to identify potential areas for future research.
4.1. Cognitive Task Complexity and Engagement Levels
The dynamics of working memory vary significantly based on whether it interacts with previously stored information in long-term memory or processes new data from the environment. In the case of previously processed information from long-term memory, working memory exhibits distinct characteristics. It capitalizes on the established pathways of knowledge, efficiently accessing and applying the stored insights to navigate the current situation. This process is marked by a certain fluidity and fluency, facilitated by the familiarity of the information. Conversely, when confronted with new and unfamiliar information from the environment, working memory assumes a different set of attributes. It operates on a heightened alert, actively processing, and integrating the novel data to make informed decisions. This mode of operation involves a heightened cognitive engagement, as the system strives to comprehend and adapt to the unforeseen circumstances.
Most of the reviewed studies have employed the n-back task, the Stroop task, or the mental arithmetic task as tools for assessing cognitive load [133,134,135]. These tasks have proven to be particularly valuable due to their ability to elicit varying degrees of cognitive demand. The cognitive tasks, participants will be presented with various stimuli, such as numbers and letters, and were asked to perform different types of mental operations, such as n-back tasks, mathematical equations (addition, subtraction, and multiplication), counting, or comparing. These tasks were designed to elicit different levels of cognitive load, ranging from low to high, and will be presented either alone or in combination with the driving or flying tasks. For the driving or flying tasks, the participants will be asked to navigate a simulated environment and respond to various stimuli, such as traffic lights or obstacles [136]. The tasks were designed to simulate real-world driving, flying, or training scenarios and were presented either alone or in combination with the cognitive tasks. Engaging participants in cognitive tasks gives rise to a range of distinct challenges. One pivotal concern pertains to the intricate interplay between the cognitive load inherent in these tasks and the participants' engagement levels. When cognitive tasks are overly simplistic, participants might become disengaged, blurring the demarcation between a state of normal cognitive functioning and one under cognitive load [137]. Consequently, the imperative arises to judiciously curate cognitive load-based tasks to strike an optimal balance. The selection of cognitive load tasks assumes a paramount significance. Tasks ought to be meticulously chosen, ensuring they encompass a degree of challenge that is not excessively facile, but instead stimulates participants to be optimally engaged. This delicate equilibrium is pivotal, as it fosters an environment wherein users are stretched to their cognitive limits while remaining motivated to conquer the challenges at hand. However, it is crucial to tread cautiously, for an excessive cognitive load can potentially tip the delicate balance into unfavourable direction [138]. When participants are confronted with an overwhelming cognitive load that surpasses their coping capacities, they are susceptible to committing errors and mistakes during the execution of cognitive tasks. Such instances underscore the critical importance of calibrating the cognitive demands of tasks with the users' cognitive capabilities and the contextual environment.
The assessment of cognitive load through the utilization of a secondary task, commonly referred to as dual task methodologies. Researchers frequently employ a dual-task paradigm as a strategic approach to address the challenges associated with cognitive tasks. The utilization of a dual-task framework has emerged as a valuable strategy to tackle the complexities inherent in studying cognitive load and engagement. Nevertheless, it is essential to acknowledge that the substantial benefits of this approach may be counterbalanced by the intricate nature of the experimental design that it necessitates. The deployment of dual task methodologies demands careful orchestration and meticulous control over the simultaneous tasks, potentially introducing complexities that could challenge the interpretation of results. These tasks were designed to assess the participants' ability to multitask and to measure the cognitive load associated with this type of activity. Furthermore, it is imperative to address the potential encumbrance posed by this method, particularly when applied within contexts involving learning or problem-solving tasks.
However, the utilization of the secondary task technique comes with a set of inherent limitations that necessitate careful consideration [139]. One significant constraint involves the potential encroachment of the secondary task upon the primary task, introducing a propensity for the subject to alter their approach and strategy. This phenomenon has the potential to introduce distortions both in the execution and framework of the primary task, thereby influencing the overall performance outcomes. When the response modalities for both tasks coincide, the level of interference caused by the secondary task is at its highest. This is especially pronounced in scenarios where intricate tasks are involved, as their heightened structural complexity inherently restricts the allocation of attention across the inputs required for each task. This intricate relationship between task characteristics and attention-sharing underscores the pivotal role played by the nature of the primary task in shaping the efficacy and efficiency of the secondary task. Another critical concern revolves around the potential for the secondary task to impose an excessive cognitive burden on the subject, thus exerting a deleterious impact on the execution of the primary task. This potential for overload introduces an element of distortion to the performance of the primary task, further complicating the interpretation of results and undermining the reliability of the findings. This variance is attributed to the activation of arousal that the secondary task invokes, and its interaction with individual personality traits. For instance, individuals characterized by a 'Type A' personality exhibit distinct performance patterns under conditions of high cognitive load compared to those with a 'Type B' disposition [140]. Similarly, subjects with disparate decision-making styles respond differently to the demands imposed by the secondary task. [139]
To prevent the burden of excessive cognitive load often associated with authentic tasks, an effective training program employs a gradual approach. Initially, learners engage with learning tasks that present simplified versions of the overall task complexity. As their proficiency and knowledge advance, they progressively tackle more intricate renditions of the complete task. It is essential for these training tasks to closely mirror the real-world activities that await them post-training, striving for a high degree of fidelity. However, it is important to recognize that while training tasks should align closely with real-life scenarios, they need not be exact replicas, here lies the distinction between cognitive authenticity and physical authenticity. Prioritizing cognitive authenticity holds greater significance. While physical authenticity is certainly valuable, there exist valid reasons to adopt a somewhat less physically authentic, simulated training environment. This simulated approach can offer several advantages, such as curbing material expenses and the costs associated with errors. It also enables the controlled sequencing of tasks, affording the opportunity to introduce tasks that are infrequent in actual practice yet hold relevance for training purposes. Additionally, this approach allows for dedicated time intervals for feedback and contemplation during task execution, contributing to a more effective learning experience. The primary focus remains on cultivating cognitive authenticity, which may entail making thoughtful trade-offs with physical authenticity. While the latter is not to be dismissed, the decision to embrace a simulated training environment can be justified by its capacity to manage costs, optimize learning outcomes, and facilitate deliberate skill development.
4.2. Extracting Representative Features from Eye-Tracking Data
One of the most significant challenges in developing ML/DL-based models for cognitive load classification using eye-tracking data is identifying representative and meaningful features that can be utilised as inputs to generate an effective classification architecture [141]. This challenge arises from the complexity and high dimensionality of the data set, which can make it difficult to extract relevant information. Predominantly blink rate, pupil size, eye-gaze and fixation duration are commonly employed indicators of cognitive load in eye-tracking research [51,57,59,63]. They have shown the potential in capturing variations in cognitive processing demands. However, it is essential to conduct further research to elucidate the intricate relationship between pupil size and cognitive processing. This measure is influenced by multiple factors, including cognitive load and processing difficulty. Understanding these influences is crucial for accurately interpreting eye-tracking data and leveraging fixation duration as a reliable marker of cognitive load. Interestingly, conflicting research findings have emerged regarding the role of pupil size as an indicator of cognitive load. For instance, Mitre-Hernandez et al. [52] reported that features related to pupil size did not exhibit significant improvements in cognitive load classification. In contrast, other studies have indicated that pupil size-related features yield significant improvements in assessing cognitive load [142]. This conflicting evidence underscores the need for additional investigation to reconcile these discrepancies and gain a comprehensive understanding of the relationship between pupil size and cognitive load [143].
To address this challenge, many researchers have resorted to statistical methods such as ANOVA [58], t-test [104], and Wilcoxon signed rank test [52] to evaluate the effectiveness of different features and determine which ones can lead to improved classification accuracy. By utilising statistical methods to analyse the efficacy of various features, researchers can better understand the underlying patterns in the data set and identify the most relevant features as inputs to the ML/DL algorithms. The adoption of this methodological approach engenders a twofold benefit. Firstly, it cultivates a heightened comprehension of the underlying intricacies intrinsic to the dataset, thereby fostering a richer understanding of the dynamics that underpin cognitive load. Secondly, it facilitates the selection of optimal features to empower the machine learning and deep learning architectures, subsequently fostering the creation of more precise and robust cognitive load classification models. These advanced models are endowed with the potential to be wielded across an array of domains encompassing education, training, and the realms of human-computer interaction.
In addition to utilizing statistical methods for feature selection and evaluation, researchers have also explored the direct application of Deep Neural Networks (DNNs) on eye-tracking data for cognitive load classification [144]. DNNs have gained significant popularity in recent years due to their ability to automatically learn hierarchical representations from complex and high-dimensional data. When applying DNNs to eye-tracking data, researchers design neural architectures that can take raw eye-tracking data as input and learn to extract relevant features automatically through multiple layers of interconnected nodes. This process is known as feature learning [145], where the neural network learns to identify patterns and representations that are most informative for the cognitive load classification task. The advantage of using DNNs lies in their capacity to handle intricate patterns and relationships in the data, which is often difficult for traditional statistical methods. DNNs can effectively capture intricate spatial and temporal dependencies present in eye-tracking data, making them well-suited for cognitive load classification tasks. However, the successful application of DNNs to cognitive load classification using eye-tracking data comes with its own set of challenges. The majority of the reviewed DL/ML work has been primarily focused on the choice of models for classification rather than the extraction of relevant features. Many of the features used, such as pupil size, blink rate and gaze direction, are often selected manually. This approach raises questions about the optimality of these features for the given cognitive load classification task. The full potential of DNNs, which lies in their capability for automatic feature learning, remains largely unexplored in these studies. As a result, the extracted features in these works often appear static or are aggregated and averaged measures. This limits the ability of the models to capture the intricate and dynamic patterns present in eye-tracking data. The absence of utilizing multimodal temporal patterns for classification is a significant limitation observed across the reviewed works. This limitation not only restricts the overall performance of the models but also misses out on a substantial opportunity to enhance the accuracy and robustness of cognitive load classification. Moreover, training deep neural networks requires a large amount of labelled data, and acquiring such data for cognitive load classification can be a laborious and time-consuming process. Furthermore, deep neural networks are prone to overfitting, where the model may perform well on the training data but fail to generalize to new, unseen examples [146]. To address overfitting, researchers often employ techniques such as dropout, regularization, and data augmentation [147]. Despite the challenges, the direct application of deep neural networks to eye-tracking data has shown promising results in cognitive load classification tasks. The ability of DNNs to learn complex representations from raw data enables them to discover subtle cues and hidden patterns that might not be apparent through traditional statistical approaches alone.
By combining statistical methods for feature evaluation and selection with the power of deep neural networks, researchers can potentially achieve even higher classification accuracies and gain deeper insights into the underlying cognitive processes involved in different tasks. The development of accurate cognitive load classification models holds great potential for various domains, including education, training, and human-computer interaction, as it can help optimize learning experiences, improve task performance, and enhance the overall user experience. As the field continues to evolve, the integration of statistical techniques and deep learning approaches is likely to lead to more robust and sophisticated cognitive load classification models, further advancing our understanding of human cognition and its applications in real-world scenarios.
4.3. Investigating More Recent DL Models for the Analysis of Eye-Tracking Data
A variety of classifiers have been employed in conjunction with ML algorithms to tackle the task of classification or labelling and train systems to quantify different levels of cognitive workloads. Cognitive load classification using eye-tracking data has been explored through various machine learning algorithms, SVM, Naive Bayes, k-NN, Random Forests, Ensemble Machine Learning methods, ANN, and CNN. Among the numerous studies reviewed, it was observed that SVM was the most commonly utilised classifier for this purpose. Following SVM, other classifiers such as random forests, k-NN, CNN and various other machine learning and deep learning techniques were also applied in the reviewed studies. Naive Bayes, although a simple algorithm, has also been effective in certain cognitive load classification tasks. k-NN has demonstrated its potential in classifying complex behaviours based on multimodal data, but its computational demand and sensitivity to high-dimensional or noisy data are noted drawbacks. Random Forests, as an ensemble learning method, have shown accuracy in classifying cognitive workload, but their interpretability and computational resource requirements remain concerns. Ensemble machine learning methods, such as LightGBM and XGBoost, have emerged as powerful tools for predicting cognitive load levels. They can handle large data sets and extract relevant features automatically. ANNs have demonstrated their effectiveness in handling eye-tracking data for cognitive load classification. They can learn from vast amounts of data and adapt to different contexts, but their training process can be computationally intensive and prone to overfitting with small data sets. CNNs have also been successful in extracting spatial features from eye-tracking data, but they may require significant computing resources. Each algorithm has its strengths and weaknesses, and the choice of the appropriate method should consider the specific context, data characteristics, and interpretability requirements.
While traditional ML/DL classifiers have been extensively studied, it is important for the eye-tracking community to explore newer DL models and architectures that have emerged in recent years. The utilisation of CNN architectures has been notably successful, as demonstrated by previous studies. These architectures have showcased impressive capabilities in various computer vision tasks, leading to advancements in object recognition, image segmentation, and pattern analysis. However, when it comes to the domain of eye-tracking, a certain hesitancy can be observed among researchers towards embracing the potential of newer CNN models. While the efficacy of conventional CNN architectures is acknowledged, the dynamic and intricate nature of eye-tracking data demands a nuanced approach. The traditional CNNs, while powerful, might not be optimally tailored to capture the subtleties inherent in eye movement patterns, fixations, and gaze transitions. This recognition has prompted a growing interest within the eye-tracking community to explore newer and more specialized CNN models that could better accommodate the distinctive characteristics of eye-tracking data.
Newer models such as GhostNet [148], Densenet [149], and Capsule Net [150] could be particularly beneficial in this domain. CapsuleNet is a neural network architecture that aims to address the limitations of traditional CNNs by incorporating "capsules" that capture more hierarchical and spatial relationships in the data. DenseNet, on the other hand, introduces dense connections between layers, allowing for better gradient flow and feature reuse. GhostNet is a lightweight network architecture designed for efficient resource utilisation, making it suitable for deployment on devices with limited computational capabilities. The reluctance among researchers to adopt these newer CNN models in the eye-tracking domain could be attributed to multiple factors. Firstly, deep learning is characterized by its rapid evolution, which can make it challenging for researchers to stay up to date with the latest architectural developments. This can lead to a certain comfort with well-established CNN models that have already proven their mettle in various tasks. As the field of DL advances, models can become increasingly complex, making it difficult to decipher the decision-making processes that underlie their predictions. Transitioning to newer models might necessitate substantial changes in data preprocessing, training procedures, and fine-tuning techniques, potentially requiring more time and effort from researchers who are already familiar with existing CNN architectures. However, it is precisely these challenges that underscore the importance of investigating and embracing these newer CNN models within the eye-tracking domain. The unique characteristics of eye-tracking data warrant a tailored approach, and the pursuit of more advanced models is essential for unlocking deeper insights into cognitive load, visual attention, and other cognitive processes. By investigating these newer models and architectures on eye-tracking, researchers can achieve further advancements in automatic cognitive load analysis. To further enhance the accuracy and generalizability of these models, future research should focus on improving feature selection techniques, addressing computational challenges, and exploring novel approaches to interpretability. As eye-tracking technology continues to advance, the application of ML/DL algorithms in cognitive load classification is likely to lead to valuable information. State-of-the-art DL models can lead to improved classification accuracy, enhanced feature representation, and ultimately, a better understanding of cognitive workload levels based on eye-tracking data.
4.4. Interpretability Challenges in DL for Eye-Tracking Data Analysis
The high performance of end-to-end Deep DNNs is often counterbalanced by their intricate nature and the multitude of optimized weights they entail. Consequently, comprehending the rationale behind the classifications produced by a DL model for cognitive load analysis remains a challenging task. These DL algorithms are commonly referred to as "black boxes," leading us to accept the final outcomes (classifications or statistics) without accompanying explanations. To address this opacity, researchers have explored various methods for enhancing the interpretability of these models [151]. One prevalent approach in this quest for transparency is the utilization of feature-based interpretability methods [152]. These methods involve the extraction of pertinent features from input data, often derived from intricate eye-tracking signals. The significance of these features lies in their ability to reveal subtle patterns, hard to estimate through direct observation. These extracted features encompass a spectrum of physiological signals, including those operating within the time or frequency domains. Remarkably, these input features exert a profound influence over the final classifications produced by the model. Consequently, a key area of interest revolves around the determination of the relative importance of these input signals in shaping specific predictions [153]. This endeavour involves estimating the significance of individual input signals in contributing to the overall decision-making process of the model. The outcomes of these importance estimations hold the potential to be visualized, effectively giving rise to what are commonly referred to as saliency maps.
However, despite the potential benefits of incorporating interpretability into models for cognitive load analysis, especially those utilizing deep learning methodologies, there remains a lack of studies within the eye-tracking domain that have employed interpretability techniques. The pursuit of improved interpretability in models for cognitive load analysis, especially those based on deep learning methodologies, offers numerous promising benefits. Firstly, experts in the field can gain a deeper understanding into the underlying learning mechanisms of the models. This enhanced understanding opens up avenues for refining the models, particularly in terms of anticipating and rectifying potential shortcomings when confronted with new data. Moreover, individuals who are not specialists in the domain, including medical professionals who rely on these DL/ML models for crucial decisions, can benefit. A clear understanding of the internal workings of these algorithms gives users greater confidence that the model will work as expected even when presented with new data. Additionally, it encourages end users to have more trust in and acceptance of these models.
A few recent studies have aimed to address the challenge of interpretability in eye-tracking data with ML/DL models [66]. Some studies have investigated the addition of expert features to ML/DL architectures to enhance the model interpretability. Expert features are domain-specific characteristics that can be explicitly added to a DL model to aid in the interpretation of results. There are two main research directions in addressing the challenge of interpretability in DL models for eye-tracking data analysis. The first involves using existing expert knowledge to design DNN architectures. As an example, in a recent study [62], a method for guiding multilevel weights using expert features for modelling eye-tracking data was proposed. This approach aims to improve the model interpretability by explicitly incorporating expert knowledge into the DL architecture. This approach aims to improve the model interpretability by explicitly incorporating expert knowledge into the DL architecture. Models that are simpler and smaller offer enhanced comprehensibility and operational efficiency. Consequently, leveraging conventional statistical models becomes a viable approach to elucidate the intricate operational dynamics of deep learning systems. However, the task of interpreting DNNs poses a significant challenge, primarily due to the inherent non-linearity involved in the processing and integration of input features across successive layers. The intricate transformations that take place within DNNs often result in complex relationships that are not easily interpretable by humans. The transformational processes are characterized by complex interactions and weight adjustments, rendering the overall decision-making process of the network difficult to understand intuitively. Once deep neural networks have undergone training and demonstrated high proficiency. This strategy involves distilling the acquired knowledge within these complex networks into more conventional and interpretable models. One such approach is the utilization of Local Interpretable Model-agnostic Explanations (LIME) [154]. LIME, designed to explain the inner workings of intricate non-linear models, operates by creating a simplified, locally linear surrogate model in the proximity of a specific prediction.
The second is to leverage a DL model as a feature extractor to derive latent embeddings from the model. This approach involves using the trained DL model to extract meaningful features from the dataset and using the extracted features as inputs to a traditional ML algorithm. In some cases, expert features can be combined with deep features to construct hybrid models that offer improved interpretability and accuracy [59]. Although the addition of expert features to DL models represents a step towards enhancing interpretability, comprehensive investigations are required in this area. Nevertheless, it is noteworthy that despite the remarkable strides made in this direction, there remains an unexplored area that holds significant potential for further advancement. Specifically, XAI techniques grounded in layer-based methodologies, such as GradCAM, and LRP, have yet to be utilised in the analysis of eye-tracking signals linked to cognitive load. As of the present state of knowledge, these sophisticated XAI techniques have not been brought to bear upon the intricate domain of unravelling the complex interplay between eye-tracking signals and cognitive load. Their utilization has the potential to unveil intricate patterns and salient regions within the eye-tracking data, thus offering a deeper comprehension of the cognitive load dynamics. Future research can focus on developing advanced methods for incorporating expert knowledge into DL architectures and extracting meaningful features from the models. This will contribute to bridging the gap between the power of DL in capturing complex relationships and the necessity of transparent and interpretable decision-making processes, particularly in applications that demand clear explanations.
4.5. Incorporating Behavioral Data Into Eye-Tracking Analysis
While eye-tracking data classification has been the primary focus in many studies, a growing number of researchers have begun exploring the potential benefits of combining eye-tracking data with other sources of information. By utilising multiple data modalities, researchers may be able to develop more robust and accurate models for analysing human behaviour and performance [155]. In recent years, there has been an increasing interest in multimodal analysis, which involves combining data from different modalities such as ECG, GSR, hear rate, EEG and fNIRS to provide a comprehensive view of cognitive processes. The data collected from these multimodal devices contains a diverse array of attributes, features and characteristics that can illuminate the intricacies of human cognition. These devices record data at differing sampling rates, which typically span the range of 20 to 100 Hz, contingent upon the specific activities being observed. However, before these data can be subjected to analysis, a preliminary step involves data pre-processing. One challenge encountered during this pre-processing phase is the presence of noise and spikes within the sensor data. Noise interferences can impede the accuracy of measurements and compromise the integrity of subsequent analyses. To mitigate these effects, a variety of methods are commonly used. These methods encompass a spectrum of techniques, ranging from nonlinear algorithms to the application of low-pass and high-pass filters, among other sophisticated filtering methodologies. The goal of employing these techniques is to cleanse the data in order to produce more accurate reflection of the underlying cognitive processes.
Joint analysis of eye-tracking data with other modalities can lead to a better understanding of the underlying mechanisms of cognitive processes and improve the ability to predict and diagnose cognitive impairment. Numerous researchers are dedicated to identifying the most pertinent features related to cognitive load within physiological signals. These features encompass a variety of domains, such as time domain features, frequency domain features, higher-order spectra, and time-frequency domain features. Time domain features offer a several advantage in terms of computational efficiency, rendering them particularly suitable for real-time implementation within cognitive load systems. These features empower researchers to analyse and understand the temporal evolution of cognitive load with remarkable precision. The time domain features most frequently employed in the literature include mean, median, standard deviation, signal amplitude, entropy, variance, kurtosis, and skewness. On the other hand, frequency domain features play a unique role in separating the complex network of sensor signals. By delving into the distribution of signal energy across different frequency components, these features capture the rhythmic and repetitive aspects of cognitive load-related phenomena. Feature fusion offers a powerful mechanism for integrating diverse feature vectors of distinct types, thereby facilitating the establishment of spatial-temporal associations. This phenomenon holds particular significance within the domain of cognitive load analysis, owing to the inherent hierarchical structures that characterize cognitive processes. In the literature, researchers have employed various statistical and algorithmic techniques to effectively fuse different features derived from a wide array of physiological sensor sources. Among these methods, prominent approaches include the utilization of t-test, ANOVA, Wilcoxon test, and relief algorithms. Through feature fusion, researchers can combine time and frequency domain features, enabling a comprehensive understanding of cognitive load dynamics.
The use of machine learning algorithms, such as SVM, Random Forests, and XGBoost, alongside eye-tracking and other physiological data, has facilitated accurate cognitive load classification. By leveraging the power of these algorithms, researchers can extract meaningful features and discover intricate relationships within the data, improving classification accuracy. Moreover, deep learning techniques have demonstrated their potential in handling complex patterns and extracting relevant features from large datasets. Researchers have employed CNNs and LSTM models to classify cognitive load levels based on eye-tracking and physiological data, achieving high accuracy levels in prediction tasks. The fusion of eye-tracking with other physiological measures offers a more comprehensive understanding of the underlying mechanisms and dynamics associated with cognitive load. By considering multiple dimensions of physiological responses, such as heart rate, respiration rate, electrodermal activity, and brain activity, researchers can better assess cognitive workload in various contexts and reduce the impact of individual variations.
Despite the exploration of numerous features, there is still a lack of clear evidence regarding which combinations of features derived from physiological signals hold the most significant relevance to changes in cognitive load. The progress in understanding the mechanisms underlying cognitive load generation, particularly from the perspective of the human brain, may play a crucial role in advancing this field. Nevertheless, integration and analysis multimodal data entails challenges in various aspects, including data collection, preprocessing and integration, as well as analytics for identifying relevant features and building effective models. Combining multiple physiological measures poses some challenges, including feature extraction techniques, data alignment, synchronization, and selection of suitable fusion methods. Additionally, multimodal data tends to be larger and more complex than single-modality data, requiring significant computational resources and expertise in data processing and analysis. Despite these challenges, there is a growing need for research that explores the benefits of multimodal analysis in eye-tracking research. By developing models that can utilise multiple data modalities, researchers can have new insights into cognitive load analysis and classification.
4.6 Generalizability in Eye-Tracking Data
Eye-tracking data are susceptible to bias, as most experiments are conducted under controlled conditions with a limited number of participants. It is thus challenging to develop effective DL-based methods that require large data sets with labels for training with many model hyperparameters. As an example, the study in [59] identified that a small data set constituted a probable cause for the low accuracy of the CNN model used in the experiments. The limited size of eye-tracking data samples can pose significant challenges for developing reliable ML and DL models. When small data sets are used, many models tend to under/over-fit, meaning that they become too closely tailored to the training data; compromising their generalization in classifying new data. This is particularly problematic for eye-tracking studies, as the limited size and variability of data sets cannot sufficiently capture the range of factors that influence cognitive load. Acquiring high-quality physiological data for affective analysis is a crucial consideration that requires careful attention and a well-designed experimental setup [156]. When studying cognitive load, researchers commonly employ two approaches. The first is the standard lab setting, where participants are comfortably seated in front of a visible screen. This controlled environment provides stability and minimal noise, ensuring data quality. However, a challenge with this setup is obtaining genuine cognitive load data that accurately represents real-world scenarios. The stimuli used in the lab may not fully reflect the complexity and variability of cognitive load experienced in everyday life, as they are artificially determined with manually assigned labels. Moreover, the ratings assigned to these materials may deviate significantly due to variations in individuals' cognitive load even when exposed to the same stimuli. The lack of a well-defined and thoroughly tested experimental paradigm further hampers the acquisition of high-quality physiological data for affect analysis. Therefore, it is necessary to invest significant effort into developing an experimental framework and constructing an extensive open-source database, which are crucial milestones in the study of cognitive load.
A notable observation from the reviewed studies is the uniformity in participant demographics, age and gender representation, which raises concerns about the broader applicability of their findings [157]. Many studies, especially those using proprietary datasets, lacked comprehensive demographic information, such as ethnicity or race, crucial for understanding sample diversity. Instead, they often focused on narrow age ranges or specific demographic groups, as seen in the works of Rahman et al. [59], Okafuji et al. [66], and He et al. [115]. While this targeted approach aids-controlled experimentation, it may limit the relevance of findings to more diverse populations. The lack of diversity across studies could introduce biases and hinder extrapolation to real-world scenarios with greater demographic variability. Additionally, the absence of standardized reporting practices regarding participant demographics impedes assessing biases or confounding factors that could influence cognitive load classification outcomes. Moreover, most ML/DL models developed were not publicly available for further evaluation, complicating the assessment of their robustness and generalizability. Without access to models and datasets, validating and benchmarking their performance across diverse populations becomes challenging, limiting opportunities for independent verification and replication of findings. The lack of comprehensive details and transparency surrounding both data and models presents a significant obstacle to systematically evaluating the robustness and potential biases inherent in cognitive load classification research. Without sufficient information about datasets, architectures, and parameters, it's hard to assess the reliability and generalizability of findings, undermining the credibility of individual studies and hindering efforts to replicate and validate results across different settings and populations.
Furthermore, many studies appear to use relatively constrained experimental settings and tasks, potentially limiting their relevance to real-world scenarios. For instance, Okafuji et al. [66] conducted their study in a simulated driving environment with a small participant pool, raising questions about generalizability to actual road conditions. Similarly, Fan et al. [62] focused on fixation count heatmaps, which may not fully capture cognitive load experiences across various tasks and contexts. Incorporating datasets that mirror the diversity of the target population holds the key to fortifying the robustness and generalizability of cognitive load classification models. For instance, the study by Vaitheeshwari et al. [130] exemplifies this approach by integrating Galvanic Skin Response (GSR) features alongside eye-tracking data to predict cognitive load levels. Their research underscores the potential benefits of amalgamating multiple physiological measures, shedding light on avenues for enhancing model performance in real-world applications. By embracing a multifaceted approach to data collection, researchers can glean deeper insights into the complex interplay between cognitive processes and physiological responses, thereby enriching the efficacy and versatility of cognitive load classification models. Moreover, the adoption of rigorous validation techniques is paramount in accurately assessing the reliability and generalizability of machine learning and deep learning models. Techniques such as cross-validation, particularly when applied across diverse datasets, serve as invaluable tools for evaluating model performance under varying conditions and demographic compositions. The study conducted by Hijazi et al. [104], which integrated eye-tracking and Heart Rate Variability (HRV) features to explore the correlation between cognitive workload and cardiac response, highlights the significance of robust validation methodologies. By subjecting models to comprehensive validation processes encompassing diverse populations and contexts, researchers can instill greater confidence in the reliability and applicability of cognitive load classification models across a spectrum of real-world scenarios. Furthermore, the utilization of diverse datasets and rigorous validation methodologies not only bolsters the credibility of individual studies but also fosters a culture of transparency and accountability within the research community.
To address these limitations, future research should prioritize collecting diverse datasets encompassing a broader range of demographic factors and experimental conditions. Greater diversity in training data enables models to learn nuanced patterns, enhancing performance and generalizability across real-world scenarios. Additionally, further research is needed to generate affective data that better captures real-world cognitive load, which could involve exploring methods like virtual reality, driving simulators and flying simulators equipment to induce more direct and accurate cognitive load experiences that closely mimic real-world situations. In most studies, the number of subjects involved is usually small, typically ranging from two or three to a maximum of thirty individuals. This limited sample size poses challenges when attempting to generalize the performance of classifiers to subjects who have not undergone training. To address this issue, two potential approaches have been devised. The first approach involves including a larger number of subjects from diverse age groups and backgrounds to enhance the classifier's performance and generalizability. The second approach is to train a specific classifier for each user when the user population is small, as classifiers demonstrate superior performance when trained on individual subjects. By adopting either of these approaches, the limitations imposed by a restricted sample size can be mitigated. The absence of readily available and researcher-friendly datasets has led many researchers to create their own databases. The lack of a centralized database can be attributed to several factors. Each research team adopts its own unique approach, resulting in a lack of consensus on the techniques for emotion classification or the preferred model for cognitive load. This lack of agreement makes it challenging to establish a common ground for dataset construction. Moreover, copyright issues further impede researchers' access to and utilisation of participant data, including essential information such as gender, age, demographics, and even medical databases. Accessing and utilising such data for comparative analysis is often restricted unless the respective organisation has made it publicly accessible. These copyright constraints pose additional barriers to the establishment of a centralised database that can serve as a valuable resource for the research community. There are several strategies that researchers can use to mitigate these issues and improve model performance. One approach is to use transfer learning, where a pre-trained model that has been trained on a large data set is fine-tuned on a smaller data set. Transfer learning can help to improve the accuracy of models on smaller data sets by leveraging the pre-existing knowledge and weights from a larger data set, making it possible to improve the performance of the model with fewer data [158,159]. To further facilitate the development of effective models using transfer learning, it is recommended that authors open source their models for future research. Another strategy is to generate synthetic training data sets using generative models, such as GANs. GANs are DL models that can learn to generate synthetic data samples that closely resemble the distribution of the original data set [160]. By using GANs to generate additional data samples, researchers can expand the size of their training data set and improve the accuracy of their models [161].
5. Conclusions
In this paper, we conducted a systematic review of 27 papers selected using the PRISMA protocol to explore the state-of-the-art studies in machine ML/DL-based eye-tracking methods for assessing cognitive load. Our review focused on examining these studies from the perspectives of models, data, and tasks, providing a detailed analysis of the methodologies and findings within this interdisciplinary field. The reviewed studies utilize a diverse array of eye-tracking features, including but not limited to pupil size, fixations, saccades, blink rate, and eye gaze. Each study employs its unique framework, resulting in different combinations of these features for classifying cognitive load. This variation underscores the necessity for a comprehensive understanding of available features and their potential contributions to cognitive load classification tasks. It also highlights the importance of selecting the most relevant features to improve model performance and accuracy. Our review identifies several key contributions in the field. First, it highlights specific eye movement patterns that are consistently associated with cognitive load, such as changes in pupil size and fixation duration. These patterns provide valuable insights into how cognitive load manifests in eye-tracking data, which can be leveraged to develop more effective ML and DL models. Second, the study emphasizes the gaps and opportunities within various DL/ML approaches, particularly in feature extraction. For instance, the extraction of spatio-temporal features from eye-tracking data with different semantic labels can significantly enhance the interpretability of the models. Moreover, the fusion of multiple physiological and brain signals, such as combining eye-tracking data with EEG or HRV, has shown promise in enhancing model accuracy and generalizability. This multimodal approach provides a detailed understanding of cognitive load and can lead to the development of more robust and reliable models.
Furthermore, this paper has addressed the limitations of ML techniques used in the field, which have often relied on hand-tuned features to address the challenge of complex decision spaces. Instead, the potential of DL should be harnessed to directly learn new features from the data. DL can be used as a tool to understand how eye tracking behaviour changes with different task and cognitive workload. Traditional feature extraction cannot unify the different tasks, but deep learning may potentially do so, especially with foundation models today with zero and few shot learning. If these models can demonstrate zero-shot learning for different tasks, we can reverse engineer the features and the models provide new insight into the biology of eye tracking versus cognitive workload. The adoption of DL methods could lead to more sophisticated and data-driven feature extraction, enabling the models to capture intricate relationships within the eye-tracking data. This presents a new opportunity to understand what these features are by applying XAI methods to work backwards from successful DL classifiers. There is probably significant variability in the eye tracking pattern from day-to-day and session-to-session for the same person and same cognitive workload. This natural variation is difficult to identify and separate with conventional feature design. But with DL, there is some hope that this can be done, because of the strong denoising properties that DL networks can learn.
Additionally, we identified that many of the cited inference methods were only tested under controlled laboratory conditions and lack evaluation in real-world scenarios. This limitation raises concerns about the generalizability of these findings. However, companies with access to extensive eye-tracking data from consumer devices may possess larger sets of training data, greater technical expertise, and more financial resources than the researchers cited in this paper, potentially bridging this gap. It is also important to acknowledge that the included studies often did not address gender and demographic issues, which could influence the generalizability of the findings. As the adoption of eye-tracking technology continues to grow, it is imperative that the research community and industry stakeholders address these privacy challenges. This involves developing and implementing privacy-preserving technologies, such as anonymization and secure data storage methods. Adding noise to this data representation might not protect private attributes, as the added noise could easily be removed by smoothing. Instead, we recommend using statistical or aggregated feature representations that summarize temporal and appearance statistics of a variety of eye movements, such as fixation, saccades, and blinks, if the eye-tracking data should be made publicly available. Additionally, a robust legal and ethical framework is essential to guide the collection, use, and sharing of eye-tracking data, ensuring that individuals' privacy rights are protected.
However, it is important to note that model performance is influenced by various factors such as data quality, feature selection, and parameter tuning. Therefore, one should carefully consider these factors when selecting a classifier for performing eye-tracking data analysis. Consequently, future should be dedicated to the development of a comprehensive framework for effectively harnessing AI-based algorithms in the analysis of physiological signals. Multi-modality data fusion shows promise in addressing limitations associated with cognitive load analysis and classification based solely on eye-tracking data. However, small sample sizes commonly encountered in eye-tracking studies hinder generalization, highlighting the need for diverse populations or subject-specific classifiers to improve the robustness of findings. Furthermore, the long-term monitoring of cognitive load using wearable devices requires further refinement. Progress in this field is thwarted by the absence of a centralised database and restricted data accessibility, which impede collaborative efforts and overall advances. Despite the challenges, the potential of ML and DL to revolutionize the field of cognitive load assessment using eye-tracking data is immense. As the amount of data generated continues to grow and computing power increases, these technologies offer promising avenues for more accurate and insightful analyses. Future research should focus on addressing the identified gaps, exploring innovative applications, and developing robust privacy-preserving techniques.
Acknowledgments
This research was supported by the Australian Research Council (ARC) (Project ID: DE210101623).
References
- Anmarkrud, Ø.; Andresen, A.; Bråten, I. Cognitive load and working memory in multimedia learning: Conceptual and measurement issues. Educ. Psychol. 2019, vol. 54(no. 2), 61–83. [Google Scholar] [CrossRef]
- Paas, F.; van Merriënboer, J. J. Cognitive-load theory: Methods to manage working memory load in the learning of complex tasks. Curr. Dir. Psychol. Sci. 2020, vol. 29(no. 4), 394–398. [Google Scholar] [CrossRef]
- Sepp, S.; Howard, S. J.; Tindall-Ford, S.; Agostinho, S.; Paas, F. Cognitive load theory and human movement: Towards an integrated model of working memory. Educ. Psychol. Rev. 2019, vol. 31, 293–317. [Google Scholar] [CrossRef]
- Sweller, J. The role of evolutionary psychology in our understanding of human cognition: Consequences for cognitive load theory and instructional procedures. Educ. Psychol. Rev. 2022, vol. 34(no. 4), 2229–2241. [Google Scholar]
- Abdurrahman, U. A.; Zheng, L.; Haruna, U. Assessing the Effects of Landmarks and Routes on Neuro-Cognitive Load Using Virtual Environment; pp. 645–656.
- Skulmowski; Xu, K. M. Understanding cognitive load in digital and online learning: A new perspective on extraneous cognitive load. In Educational psychology review; 2022. [Google Scholar]
- Yang, S.; Wilson, K.; Roady, T.; Kuo, J.; Lenné, M. G. Beyond gaze fixation: Modeling peripheral vision in relation to speed, Tesla Autopilot, cognitive load, and age in highway driving. Accid. Anal. Prev. 2022, vol. 171, 106670. [Google Scholar] [CrossRef] [PubMed]
- Ehrmann, D. E.; Gallant, S. N.; Nagaraj, S.; Goodfellow, S. D.; Eytan, D.; Goldenberg, A.; Mazwi, M. L. Evaluating and reducing cognitive load should be a priority for machine learning in healthcare. Nat. Med. 2022, vol. 28(no. 7), 1331–1333. [Google Scholar] [CrossRef] [PubMed]
- Ringhand, M.; Siebke, C.; Bäumler, M.; Petzoldt, T. Approaching intersections: Gaze behavior of drivers depending on traffic, intersection type, driving maneuver, and secondary task involvement. Transp. Res. Part F. Traffic Psychol. Behav. 2022, vol. 91, 116–135. [Google Scholar] [CrossRef]
- Kirchner, W. K. Age differences in short-term retention of rapidly changing information. J. Exp. Psychol. 1958, vol. 55(no. 4), 352. [Google Scholar] [CrossRef] [PubMed]
- Broadbent, D. P.; D'Innocenzo, G.; Ellmers, T. J.; Parsler, J.; Szameitat, A. J.; Bishop, D. T. Cognitive load, working memory capacity and driving performance: a preliminary fNIRS and eye tracking study. Transp. Res. Part F. Traffic Psychol. Behav. 2023, vol. 92, 121–132. [Google Scholar] [CrossRef]
- Stroop, J. R. Studies of interference in serial verbal reactions. J. Exp. Psychol. vol. 18(no. 6), 643, 1935.
- Brüggemann, T.; Ludewig, U.; Lorenz, R.; McElvany, N. Effects of mode and medium in reading comprehension tests on cognitive load. Comput. Educ. 2023, vol. 192, 104649. [Google Scholar] [CrossRef]
- Howie, E. E.; Dharanikota, H.; Gunn, E.; Ambler, O.; Dias, R.; Wigmore, S. J.; Skipworth, R. J.; Yule, S. Cognitive Load Management: An Invaluable Tool for Safe and Effective Surgical Training. J. Surg. Educ. 2023. [Google Scholar] [CrossRef] [PubMed]
- Malakul, S.; Park, I. The effects of using an auto-subtitle system in educational videos to facilitate learning for secondary school students: learning comprehension, cognitive load, and satisfaction. Smart Learn. Environ. 2023, vol. 10(no. 1), 1–17. [Google Scholar] [CrossRef] [PubMed]
- Rude, S. S.; Wenzlaff, R. M.; Gibbs, B.; Vane, J.; Whitney, T. Negative processing biases predict subsequent depressive symptoms. Cogn. Emot. 2002, vol. 16(no. 3), 423–440. [Google Scholar] [CrossRef]
- Bowler, J. O.; Mackintosh, B.; Dunn, B. D.; Mathews, A.; Dalgleish, T.; Hoppitt, L. A comparison of cognitive bias modification for interpretation and computerized cognitive behavior therapy: effects on anxiety, depression, attentional control, and interpretive bias. J. Consult. Clin. Psychol. 2012, vol. 80(no. 6), 1021. [Google Scholar] [CrossRef] [PubMed]
- Liu, Y.; Yu, Y.; Ye, Z.; Li, M.; Zhang, Y.; Zhou, Z.; Hu, D.; Zeng, L.-L. Fusion of Spatial, Temporal, and Spectral EEG Signatures Improves Multilevel Cognitive Load Prediction. IEEE Transactions on Human-Machine Systems, 2023. [Google Scholar]
- Karmakar, S.; Kamilya, S.; Dey, P.; Guhathakurta, P. K.; Dalui, M.; Bera, T. K.; Halder, S.; Koley, C.; Pal, T.; Basu, A. Real time detection of cognitive load using fNIRS: A deep learning approach. Biomed. Signal Process. Control 2023, vol. 80, 104227. [Google Scholar] [CrossRef]
- Fietz, J.; Pöhlchen, D.; Binder, F. P.; B. W. Group; Czisch, M.; Sämann, P. G.; Spoormaker, V. I. Pupillometry tracks cognitive load and salience network activity in a working memory functional magnetic resonance imaging task. Hum. Brain Mapp. 2022, vol. 43(no. 2), 665–680. [Google Scholar]
- Wang, Q.; Yang, S.; Liu, M.; Cao, Z.; Ma, Q. An eye-tracking study of website complexity from cognitive load perspective. Decis. Support Syst. 2014, vol. 62, 1–10. [Google Scholar] [CrossRef]
- Ujbanyi, T.; Katona, J.; Sziladi, G.; Kovari, A. Eye-tracking analysis of computer networks exam question besides different skilled groups; pp. 000277–000282.
- Parameshwari, B. M.; Madhurya, B.; Rao, K. U. Preparation of papers a cost effective prototype for electrooculogram for effective eye tracking. Int. J. Innov. Manag. Technol. 2013, vol. 4(no. 5), 494. [Google Scholar]
- Clay, V.; König, P.; Koenig, S. Eye tracking in virtual reality. J. Eye Mov. Res. 2019, vol. 12(no. 1). [Google Scholar]
- Klaib, F.; Alsrehin, N. O.; Melhem, W. Y.; Bashtawi, H. O.; Magableh, A. A. Eye tracking algorithms, techniques, tools, and applications with an emphasis on machine learning and Internet of Things technologies. Expert Syst. With Appl. 2021, vol. 166, 114037. [Google Scholar] [CrossRef]
- Sharafi, Z.; Sharif, B.; Guéhéneuc, Y.-G.; Begel, A.; Bednarik, R.; Crosby, M. A practical guide on conducting eye tracking studies in software engineering. Empir. Softw. Eng. 2020, vol. 25, 3128–3174. [Google Scholar] [CrossRef]
- Wu, Y.; Zhang, Z.; Zhang, Y.; Zheng, B.; Aghazadeh, F. Pupil response in visual tracking tasks: The impacts of task load, familiarity, and gaze position. Sensors 2024, vol. 24(no. 8), 2545. [Google Scholar] [CrossRef] [PubMed]
- Kok, E. M.; Jarodzka, H. Before your very eyes: The value and limitations of eye tracking in medical education. Med. Educ. 2017, vol. 51(no. 1), 114–122. [Google Scholar]
- Meißner, M.; Pfeiffer, J.; Pfeiffer, T.; Oppewal, H. Combining virtual reality and mobile eye tracking to provide a naturalistic experimental environment for shopper research. J. Bus. Res. 2019, vol. 100, 445–458. [Google Scholar] [CrossRef]
- Aksu, Ş. H.; Çakıt, E.; Dağdeviren, M. Mental Workload Assessment Using Machine Learning Techniques Based on EEG and Eye Tracking Data. Appl. Sci. vol. 14(no. 6), 2282, 2024.
- Li, Q.; Luximon, Y.; Zhang, J.; Song, Y. Measuring and classifying students' cognitive load in pen-based mobile learning using handwriting, touch gestural and eye-tracking data. Br. J. Educ. Technol. 2024, vol. 55(no. 2), 625–653. [Google Scholar]
- Khan, M. A.; Asadi, H.; Zhang, L.; Qazani, M. R. C.; Oladazimi, S.; Kiong, L. C.; Lim, C. P.; Nahavandi, S. Application of artificial intelligence in cognitive load analysis using functional near-infrared spectroscopy: A systematic review. Expert Syst. With Appl. 2024, 123717. [Google Scholar] [CrossRef]
- Khan, M. A.; Asadi, H.; Hoang, T.; Lim, C. P.; Nahavandi, S. Measuring Cognitive Load: Leveraging fNIRS and Machine Learning for Classification of Workload Levels 313–325.
- Page, M. J.; McKenzie, J. E.; Bossuyt, P. M.; Boutron, I.; Hoffmann, T. C.; Mulrow, C. D.; Shamseer, L.; Tetzlaff, J. M.; Akl, E. A.; Brennan, S. E. The PRISMA 2020 statement: an updated guideline for reporting systematic reviews. Syst. Rev. 2021, vol. 10(no. 1), 1–11. [Google Scholar]
- Ouzzani, M.; Hammady, H.; Fedorowicz, Z.; Elmagarmid, A. Rayyan—a web and mobile app for systematic reviews. Syst. Rev. 2016, vol. 5, 1–10. [Google Scholar] [CrossRef] [PubMed]
- Chen, G.; Chen, J.; Zhao, X.; Fu, L.; Zhang, P. Cognitive Load Influences Wristwatch ‘’s Legibility and Purchase Preference: an Eye Tracking Study. Displays 2023, 102375. [Google Scholar] [CrossRef]
- Scott, G. G.; Hand, C. J. Motivation determines Facebook viewing strategy: An eye movement analysis. Comput. Hum. Behav. 2016, vol. 56, 267–280. [Google Scholar] [CrossRef]
- Frischen; Bayliss, A. P.; Tipper, S. P. Gaze cueing of attention: visual attention, social cognition, and individual differences. Psychol. Bull. 2007, vol. 133(no. 4), 694. [Google Scholar] [CrossRef] [PubMed]
- Martinez-Marquez, D.; Pingali, S.; Panuwatwanich, K.; Stewart, R. A.; Mohamed, S. Application of eye tracking technology in aviation, maritime, and construction industries: a systematic review. Sensors 2021, vol. 21(no. 13), 4289. [Google Scholar] [CrossRef] [PubMed]
- Gibaldi; Vanegas, M.; Bex, P. J.; Maiello, G. Evaluation of the Tobii EyeX Eye tracking controller and Matlab toolkit for research. Behav. Res. Methods 2017, vol. 49, 923–946. [Google Scholar]
- Gunawardena, N.; Ginige, J. A.; Javadi, B. Eye-tracking technologies in mobile devices Using edge computing: a systematic review. ACM Comput. Surv. 2022, vol. 55(no. 8), 1–33. [Google Scholar] [CrossRef]
- Wangwiwattana, C.; Ding, X.; Larson, E. C. Pupilnet, measuring task evoked pupillary response using commodity rgb tablet cameras: Comparison to mobile, infrared gaze trackers for inferring cognitive load. Proc. ACM Interact. Mob. Wearable Ubiquitous Technol. 2018, vol. 1(no. 4), 1–26. [Google Scholar] [CrossRef]
- Anton, N.; Zhou, G.; Hornbeck, T.; Nagle, A.; Norman, S.; Shroff, A.; Yu, D. Detailing experienced nurse decision making during acute patient care simulations. Appl. Ergon. 2023, vol. 109, 103988. [Google Scholar] [CrossRef] [PubMed]
- Matsumoto, Y.; Takahashi, H.; Murai, T.; Takahashi, H. Visual processing and social cognition in schizophrenia: relationships among eye movements, biological motion perception, and empathy. Neurosci. Res. 2015, vol. 90, 95–100. [Google Scholar] [CrossRef] [PubMed]
- Pozharliev, R.; Rossi, D.; De Angelis, M. A picture says more than a thousand words: Using consumer neuroscience to study instagram users' responses to influencer advertising. Psychol. Mark. 2022, vol. 39(no. 7), 1336–1349. [Google Scholar] [CrossRef]
- Mathur. What Are You Looking At? Using Gaze Following to Understand Web Browsing on E-commerce Sites: Insights from Eye-Tracking: An Abstract 41–42.
- Chu, Z.; Wang, J.; Jiang, X.; Liu, C.; Li, L. MIND-VR: A Utility Approach of Human-Computer Interaction in Virtual Space based on Autonomous Consciousness 134–138. [CrossRef] [PubMed]
- De Lillo, M.; Foley, R.; Fysh, M. C.; Stimson, A.; Bradford, E. E.; Woodrow-Hill, C.; Ferguson, H. J. Tracking developmental differences in real-world social attention across adolescence, young adulthood and older adulthood. Nat. Hum. Behav. 2021, vol. 5(no. 10), 1381–1390. [Google Scholar] [CrossRef] [PubMed]
- Olsen. The Tobii I-VT fixation filter. Tobii Technol. 2012, vol. 21, 4–19. [Google Scholar]
- Huang, M. X.; Bulling, A. SacCalib: reducing calibration distortion for stationary eye trackers using saccadic eye movements 1–10.
- Mitre-Hernandez, H.; Sanchez-Rodriguez, J.; Nava-Muñoz, S.; Lara-Alvarez, C. Classifying the difficulty levels of working memory tasks by using pupillary response. PeerJ 2022, vol. 10, e12864. [Google Scholar] [CrossRef] [PubMed]
- Mitre-Hernandez, H.; Carrillo, R. C.; Lara-Alvarez, C. Pupillary Responses for Cognitive Load Measurement to Classify Difficulty Levels in an Educational Video Game: Empirical Study. JMIR Serious Games 2021, vol. 9(no. 1), e21620. [Google Scholar] [CrossRef] [PubMed]
- Roy, K.; Akhtar, M. N.; Mahadevappa, M.; Guha, R.; Mukherjee, J. A novel technique to develop cognitive models for ambiguous image identification using eye tracker. IEEE Trans. Affect. Comput. 2017, vol. 11(no. 1), 63–77. [Google Scholar] [CrossRef]
- Bafna, T.; Bækgaard, P.; Hansen, J. P. Mental fatigue prediction during eye-typing. PLoS ONE 2021, vol. 16(no. 2), e0246739. [Google Scholar]
- Zhou, F.; Yang, X. J.; de Winter, J. C. Using eye-tracking data to predict situation awareness in real time during takeover transitions in conditionally automated driving. IEEE Trans. Intell. Transp. Syst. 2021, vol. 23(no. 3), 2284–2295. [Google Scholar] [CrossRef]
- Bachurina, V.; Sushchinskaya, S.; Sharaev, M.; Burnaev, E.; Arsalidou, M. A machine learning investigation of factors that contribute to predicting cognitive performance: Difficulty level, reaction time and eye-movements. Decis. Support Syst. 2022, vol. 155, 113713. [Google Scholar] [CrossRef]
- Liao, Y.; Li, S. E.; Wang, W.; Wang, Y.; Li, G.; Cheng, B. Detection of driver cognitive distraction: A comparison study of stop-controlled intersection and speed-limited highway. IEEE Trans. Intell. Transp. Syst. 2016, vol. 17(no. 6), 1628–1637. [Google Scholar] [CrossRef]
- Kaczorowska, M.; Plechawska-Wójcik, M.; Tokovarov, M. Interpretable machine learning models for three-way classification of cognitive workload levels for eye-tracking features. Brain Sci. 2021, vol. 11(no. 2), 210. [Google Scholar] [CrossRef] [PubMed]
- Rahman, H.; Ahmed, M. U.; Barua, S.; Funk, P.; Begum, S. Vision-based driver’s cognitive load classification considering eye movement using machine learning and deep learning. Sensors 2021, vol. 21(no. 23), 8019. [Google Scholar] [CrossRef] [PubMed]
- Rizzo; Ermini, S.; Zanca, D.; Bernabini, D.; Rossi, A. A machine learning approach for detecting cognitive interference based on eye-tracking data. Front. Hum. Neurosci. 2022, vol. 16. [Google Scholar]
- Sabab, S. A.; Kabir, M. R.; Hussain, S. R.; Mahmud, H.; Rubaiyeat, H. A.; Hasan, M. K. VIS-iTrack: Visual Intention Through Gaze Tracking Using Low-Cost Webcam. IEEE Access 2022, vol. 10, 70779–70792. [Google Scholar] [CrossRef]
- Fan, K.; Cao, J.; Meng, Z.; Zhu, J.; Ma, H.; Ng, A. C. M.; Ng, T.; Qian, W.; Qi, S. Predicting the Reader’s English Level From Reading Fixation Patterns Using the Siamese Convolutional Neural Network. IEEE Trans. Neural Syst. Rehabil. Eng. 2022, vol. 30, 1071–1080. [Google Scholar] [CrossRef] [PubMed]
- Kaczorowska, M.; Plechawska-Wójcik, M.; Tokovarov, M.; Krukow, P. Automated Classification of Cognitive Workload Levels Based on Psychophysiological and Behavioural Variables of Ex-Gaussian Distributional Features. Brain Sci. 2022, vol. 12(no. 5), 542. [Google Scholar] [CrossRef] [PubMed]
- Cao, Y.; Miura, S.; Kobayashi, Y.; Kawamura, K.; Sugano, S.; Fujie, M. G. Pupil variation applied to the eye tracking control of an endoscopic manipulator. IEEE Robot. Autom. Lett. 2016, vol. 1(no. 1), 531–538. [Google Scholar] [CrossRef]
- Hirayama, T.; Mase, K.; Miyajima, C.; Takeda, K. Classification of driver's neutral and cognitive distraction states based on peripheral vehicle behavior in driver's gaze transition. IEEE Trans. Intell. Veh. 2016, vol. 1(no. 2), 148–157. [Google Scholar] [CrossRef]
- Okafuji, Y.; Sugiura, T.; Osugi, R.; Zhang, C.; Wada, T. A Machine Learning-Based Approach to Analyze Information Used for Steering Control. IEEE Access 2021, vol. 9, 94239–94250. [Google Scholar] [CrossRef]
- Pillai, P.; Balasingam, B.; Kim, Y. H.; Lee, C.; Biondi, F. Eye-gaze metrics for cognitive load detection on a driving simulator. IEEE/ASME Trans. Mechatron. 2022, vol. 27(no. 4), 2134–2141. [Google Scholar] [CrossRef]
- Martino, F.; Pereira-da-Mota, A. F.; Amorim-de-Sousa, A.; Castro-Torres, J. J.; González-Méijome, J. M. Pupil size effect on binocular summation for visual acuity and light disturbance. Int. Ophthalmol. 2022, 1–13. [Google Scholar]
- Kujur; Bhattacharya, A.; Sharma, G.; Kumar, J. Prediction of Workload under Distraction using Supervised Learning Algorithms; pp. 1–5.
- Pradhan; Kumar, E. Cogn. Workload Estim. Using Eye Track. A Rev. 544–552.
- Lévêque, L.; Bosmans, H.; Cockmartin, L.; Liu, H. State of the art: Eye-tracking studies in medical imaging. Ieee Access 2018, vol. 6, 37023–37034. [Google Scholar] [CrossRef]
- Van Orden, K. F.; Limbert, W.; Makeig, S.; Jung, T.-P. Eye activity correlates of workload during a visuospatial memory task. Hum. Factors 2001, vol. 43(no. 1), 111–121. [Google Scholar] [CrossRef] [PubMed]
- Ayres, P.; Lee, J. Y.; Paas, F.; van Merriënboer, J. J. The validity of physiological measures to identify differences in intrinsic cognitive load. Front. Psychol. 2021, vol. 12, 702538. [Google Scholar]
- Yang, F.-Y.; Tsai, M.-J.; Chiou, G.-L.; Lee, S. W.-Y.; Chang, C.-C.; Chen, L.-L. Instructional suggestions supporting science learning in digital environments based on a review of eye tracking studies. J. Educ. Technol. Soc. 2018, vol. 21(no. 2), 28–45. [Google Scholar]
- McMonnies, W. The clinical and experimental significance of blinking behavior. J. Optom. 2020, vol. 13(no. 2), 74–80. [Google Scholar] [CrossRef] [PubMed]
- Ktistakis, E.; Skaramagkas, V.; Manousos, D.; Tachos, N. S.; Tripoliti, E.; Fotiadis, D. I.; Tsiknakis, M. COLET: A dataset for COgnitive workLoad estimation based on eye-tracking. Comput. Methods Programs Biomed. 2022, vol. 224, 106989. [Google Scholar] [CrossRef] [PubMed]
- Niedźwiecka. Look me in the eyes: Mechanisms underlying the eye contact effect. Child Dev. Perspect. 2020, vol. 14(no. 2), 78–82. [Google Scholar] [CrossRef]
- Asadi, H.; Bellmann, T.; Qazani, M. C.; Mohamed, S.; Lim, C. P.; Nahavandi, S. A Novel Decoupled Model Predictive Control-based Motion Cueing Algorithm for Driving Simulators. IEEE Trans. Veh. Technol. 2023, no. 99, 1–12. [Google Scholar] [CrossRef]
- Asadi, H.; Mohammadi, A.; Mohamed, S.; Qazani, M. R. C.; Lim, C. P.; Khosravi, A.; Nahavandi, S. A model predictive control-based motion cueing algorithm using an optimized nonlinear scaling for driving simulators; pp. 1245–1250.
- Maniarasu, P.; Shasane, P. H.; Pai, V. H.; Kuzhuppilly, N. I.; Ve, R. S.; Ganeshrao, S. Ballae. Does the sampling frequency of an eye tracker affect the detection of glaucomatous visual field loss? Ophthalmic Physiol. Opt. 2024, vol. 44(no. 2), 378–387. [Google Scholar]
- Cheng; Luo, X.; Mei, X.; Chen, H.; Huang, J. A systematic review of eye-tracking studies of construction safety. Front. Neurosci. 2022, vol. 16, 891725. [Google Scholar]
- Rosch, J. L.; Vogel-Walcutt, J. J. A review of eye-tracking applications as tools for training. Cogn. Technol. Work 2013, vol. 15, 313–327. [Google Scholar]
- Goldberg, J. H.; Wichansky, A. M. Eye tracking in usability evaluation: A practitioner's guide. In the Mind's Eye; Elsevier, 2003; pp. 493–516. [Google Scholar]
- Min-Allah, N.; Jan, F.; Alrashed, S. Pupil detection schemes in human eye: a review. Multimed. Syst. 2021, vol. 27(no. 4), 753–777. [Google Scholar] [CrossRef]
- Mohsin, H.; Abdullah, S. H. Pupil detection algorithm based on feature extraction for eye gaze; pp. 1–4.
- Fuhl, W.; Tonsen, M.; Bulling, A.; Kasneci, E. Pupil detection for head-mounted eye tracking in the wild: an evaluation of the state of the art. Mach. Vis. Appl. 2016, vol. 27, 1275–1288. [Google Scholar] [CrossRef]
- Kassner, M.; Patera, W.; Bulling, A. Pupil: an open source platform for pervasive eye tracking and mobile gaze-based interaction. 1151–1160. [CrossRef]
- Andersson, R.; Larsson, L.; Holmqvist, K.; Stridh, M.; Nyström, M. One algorithm to rule them all? An evaluation and discussion of ten eye movement event-detection algorithms. Behav. Res. Methods 2017, vol. 49, 616–637. [Google Scholar]
- Vázquez Romaguera, T.; Vázquez Romaguera, L.; Castro Piñol, D.; Vázquez Seisdedos, C. R. Pupil center detection approaches: a comparative analysis. Comput. Y Sist. 2021, vol. 25(no. 1), 67–81. [Google Scholar] [CrossRef]
- Han, S. Y.; Kwon, H. J.; Kim, Y.; Cho, N. I. Noise-robust pupil center detection through CNN-based segmentation with shape-prior loss. IEEE Access 2020, vol. 8, 64739–64749. [Google Scholar] [CrossRef]
- Coe, B. C.; Huang, J.; Brien, D. C.; White, B. J.; Yep, R.; Munoz, D. P. Automated analysis pipeline for extracting saccade, pupil, and blink parameters using video-based eye tracking. Vision 2024, vol. 8(no. 1), 14. [Google Scholar] [CrossRef] [PubMed]
- Keskin, M.; Ooms, K.; Dogru, A. O.; De Maeyer, P. Exploring the cognitive load of expert and novice map users using EEG and eye tracking. ISPRS Int. J. Geo-Inf. 2020, vol. 9(no. 7), 429. [Google Scholar] [CrossRef]
- Čegovnik, T.; Stojmenova, K.; Jakus, G.; Sodnik, J. An analysis of the suitability of a low-cost eye tracker for assessing the cognitive load of drivers. Appl. Ergon. 2018, vol. 68, 1–11. [Google Scholar] [CrossRef] [PubMed]
- Desmet; Diependaele, K. An eye-tracking study on the road examining the effects of handsfree phoning on visual attention. Transp. Res. Part F. Traffic Psychol. Behav. 2019, vol. 60, 549–559. [Google Scholar] [CrossRef]
- Walter, K.; Bex, P. Cognitive load influences oculomotor behavior in natural scenes. Sci. Rep. 2021, 11, 12405. [Google Scholar] [CrossRef] [PubMed]
- Schmidt, K.; Gamer, M.; Forkmann, K.; Bingel, U. Pain affects visual orientation: an eye-tracking study. J. Pain 2018, vol. 19(no. 2), 135–145. [Google Scholar] [CrossRef] [PubMed]
- Zhang, W.; Liu, H. Toward a reliable collection of eye-tracking data for image quality research: Challenges, solutions, and applications. IEEE Trans. Image Process. 2017, vol. 26(no. 5), 2424–2437. [Google Scholar] [CrossRef] [PubMed]
- Walker, C.; Walker, C. “Eye-Tracking the Reader Experience,” An Eye-Tracking Study of Equivalent Effect in Translation: The Reader Experience of Literary Style 2021, 215–289.
- Chang, R. C.; Tsai, M. J. Visual behavior patterns of successful decision makers in crime scene photo investigation: An eye tracking analysis. J. Forensic Sci. 2022, vol. 67(no. 3), 1072–1083. [Google Scholar] [CrossRef] [PubMed]
- Shi, L.; Bhattacharya, N.; Das, A.; Gwizdka, J. True or false? Cognitive load when reading COVID-19 news headlines: an eye-tracking study 107–116. [PubMed]
- Tsai, M.-J.; Wu, A.-H.; Bråten, I.; Wang, C.-Y. What do critical reading strategies look like? Eye-tracking and lag sequential analysis reveal attention to data and reasoning when reading conflicting information. Comput. Educ. 2022, vol. 187, 104544. [Google Scholar] [CrossRef]
- Hollander, J.; Huette, S. Extracting blinks from continuous eye-tracking data in a mind wandering paradigm. Conscious. Cogn. 2022, vol. 100, 103303. [Google Scholar] [CrossRef] [PubMed]
- Goodwin, S.; Prouzeau, A.; Whitelock-Jones, R.; Hurter, C.; Lawrence, L.; Afzal, U.; Dwyer, T. VETA: Visual eye-tracking analytics for the exploration of gaze patterns and behaviours. Vis. Inform. 2022, vol. 6(no. 2), 1–13. [Google Scholar] [CrossRef]
- Hijazi, H.; Couceiro, R.; Castelhano, J.; De Carvalho, P.; Castelo-Branco, M.; Madeira, H. Intelligent biofeedback augmented content comprehension (tellback). IEEE Access 2021, vol. 9, 28393–28406. [Google Scholar] [CrossRef]
- Oppelt, M. P.; Foltyn, A.; Deuschel, J.; Lang, N. R.; Holzer, N.; Eskofier, B. M.; Yang, S. H. ADABase: A Multimodal Dataset for Cognitive Load Estimation. Sensors 2023, vol. 23(no. 1), 340. [Google Scholar]
- Yousefi, M. S.; Reisi, F.; Daliri, M. R.; Shalchyan, V. Stress Detection Using Eye Tracking Data: An Evaluation of Full Parameters. IEEE Access 2022, vol. 10, 118941–118952. [Google Scholar] [CrossRef]
- Boake, C. From the Binet–Simon to the Wechsler–Bellevue: Tracing the history of intelligence testing. J. Clin. Exp. Neuropsychol. 2002, vol. 24(no. 3), 383–405. [Google Scholar] [CrossRef] [PubMed]
- Sabab, S. A.; Hussain, S. R.; Mahmud, H.; Kabir, M. H.; Hasan, M. K. EYE POINTER: A real time cost effective computer controlling system using eye and head movement. [CrossRef]
- Degirmenci, M.; Yuce, Y. K.; Perc, M.; Isler, Y. Statistically significant features improve binary and multiple Motor Imagery task predictions from EEGs. Front. Hum. Neurosci. 2023, vol. 17. [Google Scholar]
- Ram, P.; Sinha, K. Revisiting kd-tree for nearest neighbor search; pp. 1378–1388.
- Jo, J.; Seo, J.; Fekete, J.-D. A progressive kd tree for approximate k-nearest neighbors; pp. 1–5.
- Breiman, L. Random forests. In Machine learning; 2001; vol. 45, pp. 5–32. [Google Scholar]
- Goldhahn; Eckart, T.; Quasthoff, U. Building Large Monolingual Dictionaries at the Leipzig Corpora Collection: From 100 to 200 Languages. [CrossRef]
- Ghandorh, H.; Khan, M. Z.; Khan, M. A.; Alsofayan, Y. M.; Alahmari, A. A.; Khan, A. A. Predicting ICU Admission for COVID-19 Patients in Saudi Arabia: A Comparative Study of AdaBoost and Bagging Methods. Int. J. Adv. Comput. Sci. Appl. 2024, vol. 15(no. 3). [Google Scholar]
- He, D.; Wang, Z.; Khalil, E. B.; Donmez, B.; Qiao, G.; Kumar, S. Classification of driver cognitive load: Exploring the benefits of fusing eye-tracking and physiological measures. Transp. Res. Rec. 2022, vol. 2676(no. 10), 670–681. [Google Scholar] [CrossRef]
- Khan, M. A.; Asadi, H.; Qazani, M. R. C.; Lim, C. P.; Nahavandi, S. Functional near-infrared spectroscopy (fNIRS) and Eye tracking for Cognitive Load classification in a Driving Simulator Using Deep Learning. in DSC Europe VR, Strasbourg, France, 2024. [Google Scholar]
- Lundberg, S. M.; Lee, S.-I. A unified approach to interpreting model predictions. Adv. Neural Inf. Process. Syst. 2017, vol. 30. [Google Scholar]
- Muruganantham, P.; Wibowo, S.; Grandhi, S.; Samrat, N. H.; Islam, N. A systematic literature review on crop yield prediction with deep learning and remote sensing. Remote Sens. 2022, vol. 14(no. 9), 1990. [Google Scholar] [CrossRef]
- Ghandorh, H.; Khan, M. Z.; Alsufyani, R.; Khan, M.; Alsofayan, Y. M.; Khan, A. A.; Alahmari, A. A. An ICU Admission Predictive Model for COVID-19 Patients in Saudi Arabia. Int. J. Adv. Comput. Sci. Appl. 2021, vol. 12(no. 7). [Google Scholar]
- Esfe, M. H.; Kamyab, M. H.; Toghraie, D. Statistical review of studies on the estimation of thermophysical properties of nanofluids using artificial neural network (ANN). Powder Technol. 2022, 117210. [Google Scholar] [CrossRef]
- Boulila, W.; Ghandorh, H.; Khan, M. A.; Ahmed, F.; Ahmad, J. A novel CNN-LSTM-based approach to predict urban expansion. Ecol. Inform. 2021, vol. 64, 101325. [Google Scholar] [CrossRef]
- Khan, M. A.; Khan, M. A.; Ahmed, F.; Mittal, M.; Goyal, L. M.; Hemanth, D. J.; Satapathy, S. C. Gastrointestinal diseases segmentation and classification based on duo-deep architectures. Pattern Recognit. Lett. 2020, vol. 131, 193–204. [Google Scholar] [CrossRef]
- Mahesh, T.; Saravanan, C.; Ram, V. A.; Kumar, V. V.; Vivek, V.; Guluwadi, S. Data-driven intelligent condition adaptation of feature extraction for bearing fault detection using deep responsible active learning. IEEE Access, 2024. [Google Scholar]
- Bhatt, D.; Patel, C.; Talsania, H.; Patel, J.; Vaghela, R.; Pandya, S.; Modi, K.; Ghayvat, H. CNN variants for computer vision: History, architecture, application, challenges and future scope. Electronics 2021, vol. 10(no. 20), 2470. [Google Scholar] [CrossRef]
- Li, Z.; Kamnitsas, K.; Glocker, B. Analyzing overfitting under class imbalance in neural networks for image segmentation. IEEE Trans. Med. Imaging 2020, vol. 40(no. 3), 1065–1077. [Google Scholar] [CrossRef] [PubMed]
- Chakraborty, T.; KS, U. R.; Naik, S. M.; Panja, M.; Manvitha, B. Ten years of generative adversarial nets (GANs): a survey of the state-of-the-art. Mach. Learn. Sci. Technol. 2024, vol. 5(no. 1), 011001. [Google Scholar] [CrossRef]
- Gasparini; Grossi, A.; Bandini, S. A deep learning approach to recognize cognitive load using ppg signals; pp. 489–495.
- Najafabadi, M. M.; Villanustre, F.; Khoshgoftaar, T. M.; Seliya, N.; Wald, R.; Muharemagic, E. Deep learning applications and challenges in big data analytics. J. Big Data 2015, vol. 2(no. 1), 1–21. [Google Scholar] [CrossRef]
- Li; Wang, X.; Liu, C.; Wang, Y.; Li, P.; Tang, H.; Yao, L.; Zhang, H. Dual-input neural network integrating feature extraction and deep learning for coronary artery disease detection using electrocardiogram and phonocardiogram. IEEE Access 2019, vol. 7, 146457–146469. [Google Scholar] [CrossRef]
- Vaitheeshwari, R.; Yeh, S.-C.; Wu, E. H.-K.; Chen, J.-Y.; Chung, C.-R. Stress Recognition Based on Multiphysiological Data in High-Pressure Driving VR Scene. IEEE Sens. J. 2022, vol. 22(no. 20), 19897–19907. [Google Scholar] [CrossRef]
- Wang; Zheng, X.; Hao, T.; Yu, Y.; Xu, K.; Wang, Y. Research on mental load state recognition based on combined information sources. Biomed. Signal Process. Control 2023, vol. 80, 104341. [Google Scholar] [CrossRef]
- Ding, Y.; Cao, Y.; Duffy, V. G.; Wang, Y.; Zhang, X. Measurement and identification of mental workload during simulated computer tasks with multimodal methods and machine learning. Ergonomics 2020, vol. 63(no. 7), 896–908. [Google Scholar] [CrossRef] [PubMed]
- Chandler, P.; Sweller, J. Cognitive load while learning to use a computer program. Appl. Cogn. Psychol. 1996, vol. 10(no. 2), 151–170. [Google Scholar] [CrossRef]
- Brünken, R.; Plass, J. L.; Leutner, D. Assessment of cognitive load in multimedia learning with dual-task methodology: Auditory load and modality effects. Instr. Sci. 2004, vol. 32, 115–132. [Google Scholar] [CrossRef]
- Antonenko, P. D.; Niederhauser, D. S. The influence of leads on cognitive load and learning in a hypertext environment. Comput. Hum. Behav. 2010, vol. 26(no. 2), 140–150. [Google Scholar] [CrossRef]
- Sweller. Cognitive load theory. In Psychology of learning and motivation; Elsevier, 2011; pp. 37–76. [Google Scholar]
- Aben, B.; Stapert, S.; Blokland, A. About the distinction between working memory and short-term memory. Front. Psychol. 2012, vol. 3, 301. [Google Scholar]
- Bunjak; Černe, M.; Popovič, A. Absorbed in technology but digitally overloaded: Interplay effects on gig workers’ burnout and creativity. Inf. Manag. 2021, vol. 58(no. 8), 103533. [Google Scholar] [CrossRef]
- Meshkati, N.; Loewenthal, A. An eclectic and critical review of four primary mental workload assessment methods: A guide for developing a comprehensive model. In Advances in Psychology; 1988; vol. 52, pp. 251–267. [Google Scholar]
- Damos, D. L.; Bloem, K. A. Type A behavior pattern, multiple-task performance, and subjective estimation of mental workload. Bull. Psychon. Soc. 1985, vol. 23(no. 1), 53–56. [Google Scholar] [CrossRef]
- Jovanović, M.; Jevremović, A.; Pejović-Milovančević, M. Intelligent interactive technologies for mental health and well-being. Artif. Intell. Theory Appl. 2021, 331–353. [Google Scholar] [CrossRef]
- Chen, S.; Epps, J. Using task-induced pupil diameter and blink rate to infer cognitive load. Human–Computer Interact. 2014, vol. 29(no. 4), 390–413. [Google Scholar] [CrossRef]
- Szulewski; Roth, N.; Howes, D. The use of task-evoked pupillary response as an objective measure of cognitive load in novices and trained physicians: a new tool for the assessment of expertise. Acad. Med. 2015, vol. 90(no. 7), 981–987. [Google Scholar] [CrossRef] [PubMed]
- Jiang, H.; Hou, Y.; Miao, H.; Ye, H.; Gao, M.; Li, X.; Jin, R.; Liu, J. Eye tracking based deep learning analysis for the early detection of diabetic retinopathy: A pilot study. Biomed. Signal Process. Control 2023, vol. 84, 104830. [Google Scholar] [CrossRef]
- Längkvist, M.; Karlsson, L.; Loutfi, A. A review of unsupervised feature learning and deep learning for time-series modeling. Pattern Recognit. Lett. 2014, vol. 42, 11–24. [Google Scholar] [CrossRef]
- Zheng, Y.; Zhang, R.; Mao, Y. Regularizing neural networks via adversarial model perturbation; pp. 8156–8165.
- Sims, S. D.; Putnam, V.; Conati, C. Predicting confusion from eye-tracking data with recurrent neural networks. arXiv 2019, arXiv:1906.11211. [Google Scholar]
- Han; Wang, Y.; Tian, Q.; Guo, J.; Xu, C.; Xu, C. Ghostnet More Featur. From Cheap Oper. 1580–1589.
- Zhu, Y.; Newsam, S. Densenet for dense flow; pp. 790–794.
- Sabour, S.; Frosst, N.; Hinton, G. E. Dynamic routing between capsules. Adv. Neural Inf. Process. Syst. 2017, vol. 30. [Google Scholar]
- Carvalho, D. V.; Pereira, E. M.; Cardoso, J. S. Machine learning interpretability: A survey on methods and metrics. Electronics 2019, vol. 8(no. 8), 832. [Google Scholar] [CrossRef]
- Imrie, F.; Davis, R.; van der Schaar, M. Multiple stakeholders drive diverse interpretability requirements for machine learning in healthcare. Nat. Mach. Intell. 2023, 1–6. [Google Scholar]
- Simeunović; Schubnel, B.; Alet, P.-J.; Carrillo, R. E.; Frossard, P. Interpretable temporal-spatial graph attention network for multi-site PV power forecasting. Appl. Energy 2022, vol. 327, 120127. [Google Scholar] [CrossRef]
- Ribeiro, T.; Singh, S.; Guestrin, C. Why should i trust you?" Explaining the predictions of any classifier; pp. 1135–1144.
- Zhang, J.; Yin, Z.; Chen, P.; Nichele, S. Emotion recognition using multi-modal data and machine learning techniques: A tutorial and review. Inf. Fusion 2020, vol. 59, 103–126. [Google Scholar] [CrossRef]
- Saganowski, S.; Komoszyńska, J.; Behnke, M.; Perz, B.; Kunc, D.; Klich, B.; Kaczmarek, Ł. D.; Kazienko, P. Emognition dataset: emotion recognition with self-reports, facial expressions, and physiology using wearables. Sci. Data 2022, vol. 9(no. 1), 158. [Google Scholar]
- Espigares-Jurado, F.; Munoz-Leiva, F.; Correia, M. B.; Sousa, C. M.; Ramos, C. M.; Faísca, L. Visual attention to the main image of a hotel website based on its position, type of navigation and belonging to Millennial generation: An eye tracking study. J. Retail. Consum. Serv. 2020, vol. 52, 101906. [Google Scholar] [CrossRef]
- Haque, R. U.; Pongos, A. L.; Manzanares, C. M.; Lah, J. J.; Levey, A. I.; Clifford, G. D. Deep convolutional neural networks and transfer learning for measuring cognitive impairment using eye-tracking in a distributed tablet-based environment. IEEE Trans. Biomed. Eng. 2020, vol. 68(no. 1), 11–18. [Google Scholar]
- Ray; Kolekar, M. H.; Balasubramanian, R.; Hafiane, A. Transfer Learning Enhanced Vision-based Human Activity Recognition: A Decade-long Analysis. Int. J. Inf. Manag. Data Insights 2023, vol. 3(no. 1), 100142. [Google Scholar] [CrossRef]
- Bourou, S.; El Saer, A.; Velivassaki, T.-H.; Voulkidis, A.; Zahariadis, T. A review of tabular data synthesis using GANs on an IDS dataset. Information 2021, vol. 12(no. 09), 375. [Google Scholar] [CrossRef]
- Baek, K.; Shim, H. Commonality in Natural Images Rescues GANs: Pretraining GANs with Generic and Privacy-free Synthetic Data 7854–7864.
Figure 1.
PRISMA [34] flowchart illustrating the process of selecting studies.
Figure 1.
PRISMA [34] flowchart illustrating the process of selecting studies.
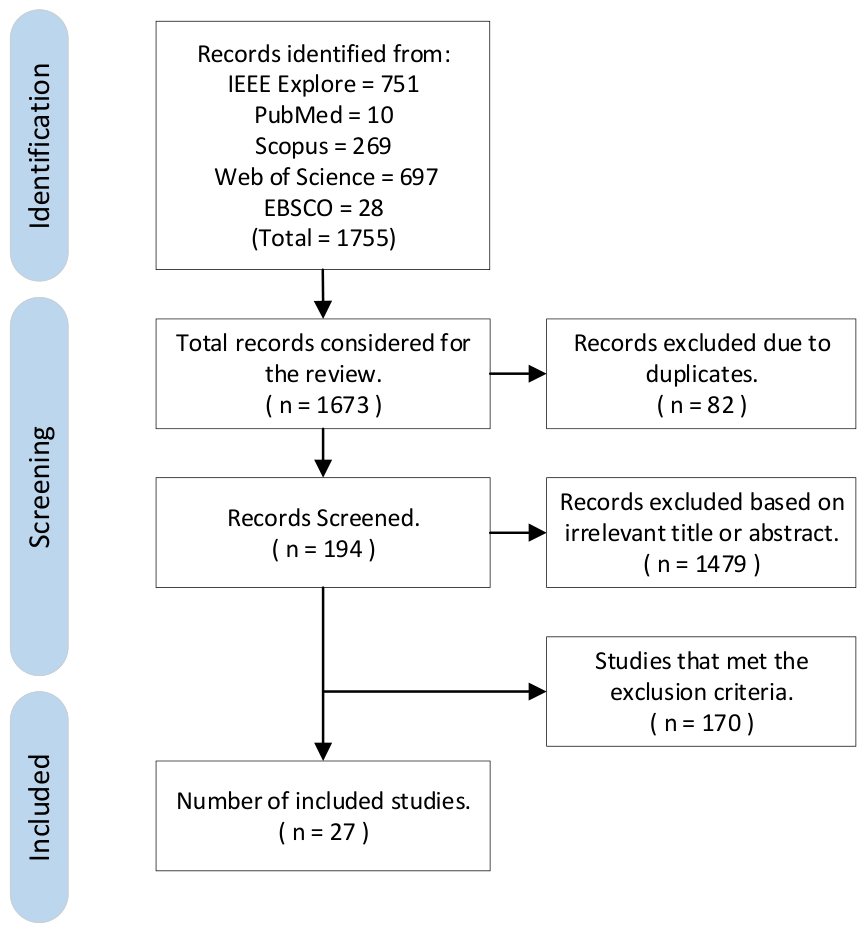
Figure 2.
Process of capturing eye movements, extracting features, and classifying cognitive states using eye-tracking data.
Figure 2.
Process of capturing eye movements, extracting features, and classifying cognitive states using eye-tracking data.

Figure 3.
Comparative distribution of eye-tracking features employed in cognitive load classification.
Figure 3.
Comparative distribution of eye-tracking features employed in cognitive load classification.
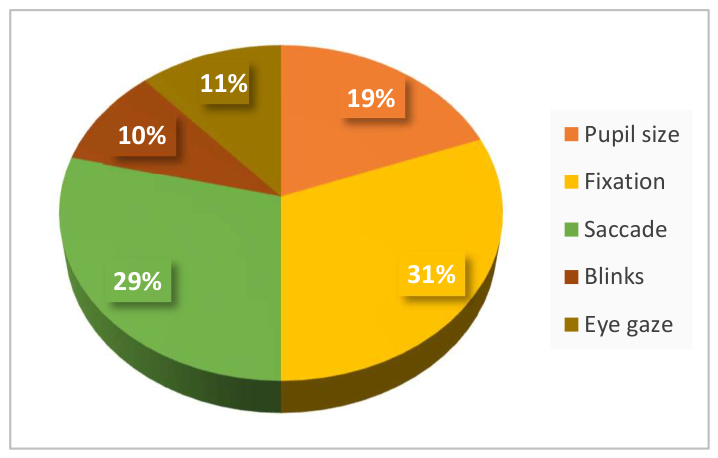
Figure 4.
Analysis of Machine Learning and Deep Learning Algorithm Usage in Eye-Tracking Research.
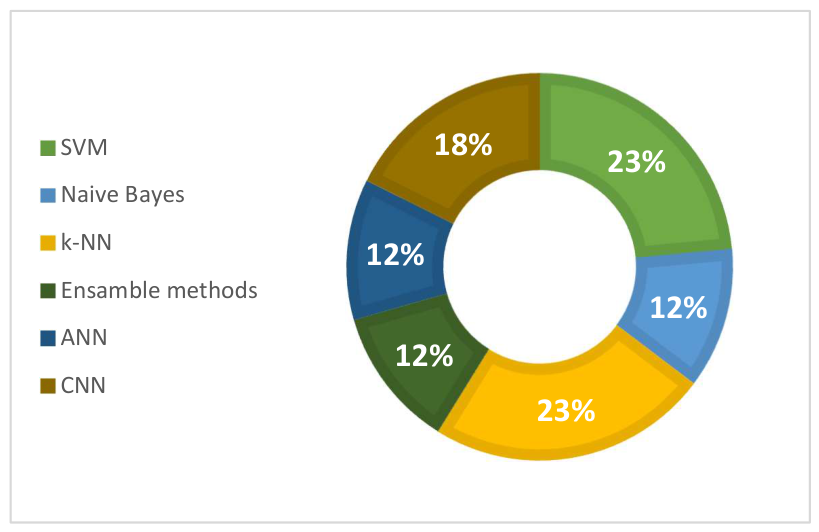
Figure 5.
Taxonomy of cognitive load classification using eye-tracking features.
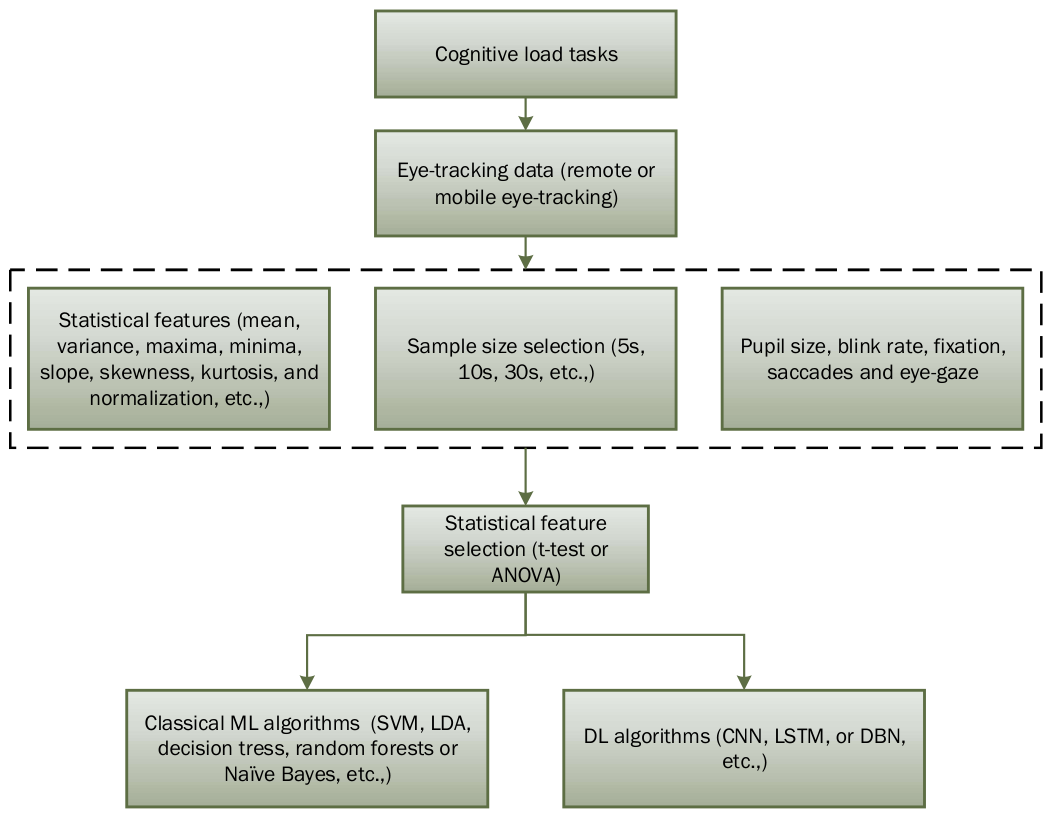
Figure 6.
Distribution of studies using eye-tracking data alone versus those incorporating additional physiological signals for cognitive load classification.
Figure 6.
Distribution of studies using eye-tracking data alone versus those incorporating additional physiological signals for cognitive load classification.
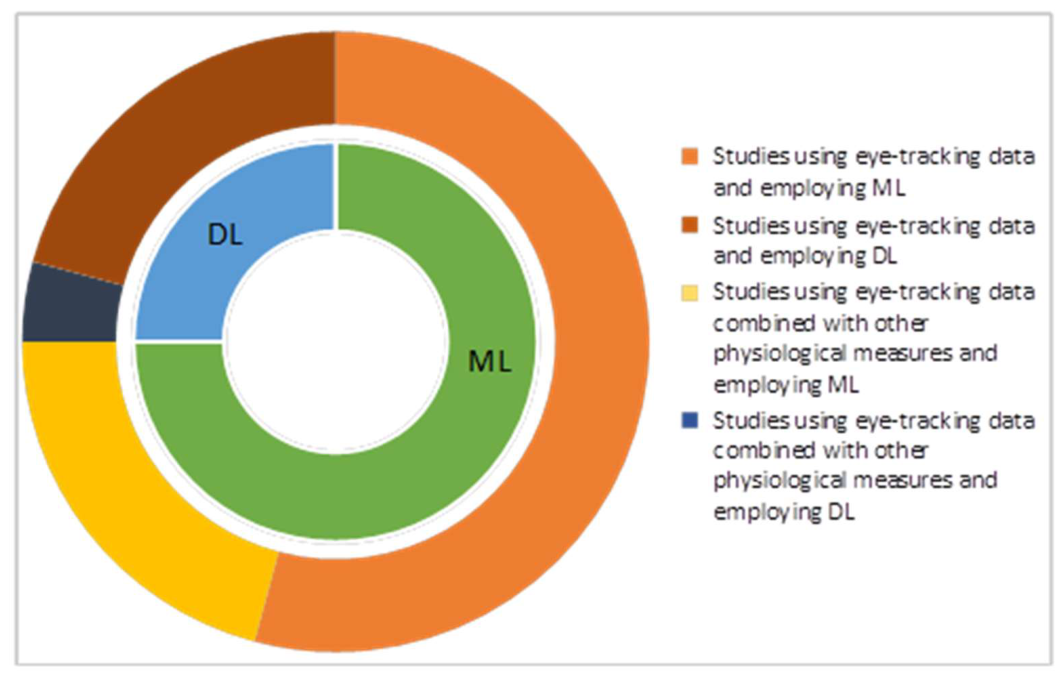
Figure 7.
Challenges in utilising ML/DL for eye-tracking data.
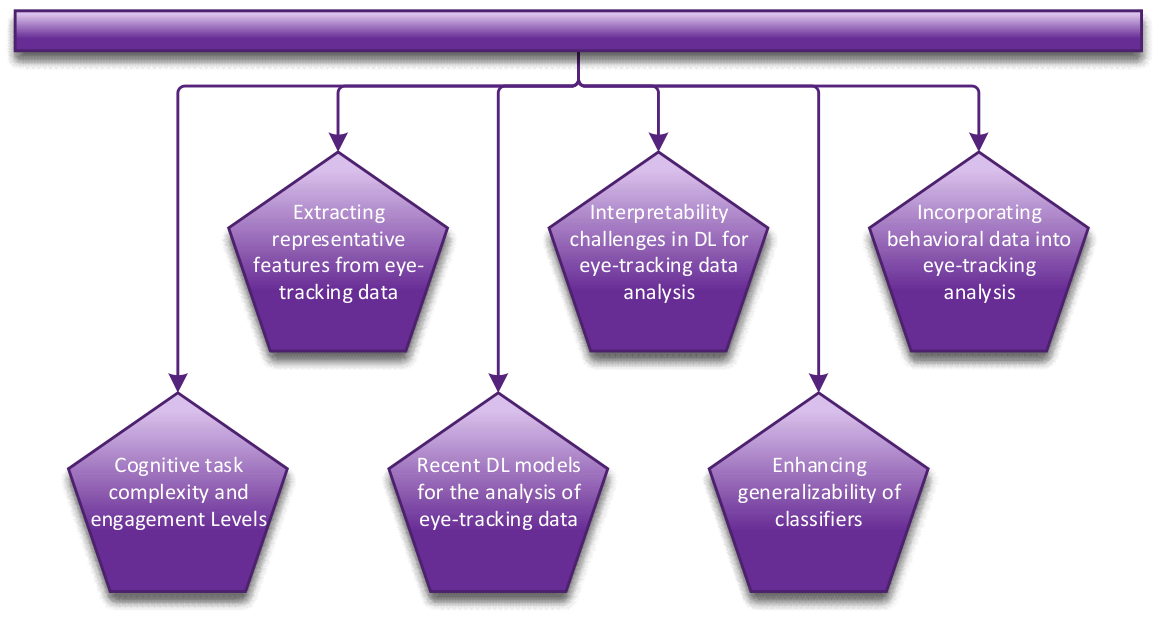

Table 1.
Search strings applied to each subject area.
| Subject area | Query terms |
|---|---|
| Cognitive load | "cognitive load" OR "dual task" OR "working memory" OR "mental load" OR "mental effort" OR "germane load" OR "intrinsic load" OR "extraneous load" OR "extraneous cognitive load" |
| Artificial intelligence | "deep learning" OR "machine learning" OR "artificial intelligence" OR predict* OR classif* OR detect* OR quantif* OR recogni* |
| Eye-tracking | eye* OR gaz* OR fixat* OR saccad* OR pupil* OR ocul* OR "gaze track*" OR "eye move*" OR "eye track*" |
Table 2.
Eye behaviour features.
| Eye behaviour | Features | Sources |
|---|---|---|
| Pupil size | Pupil diameter | [51,52,53,54,55,56,57,58] |
| Pupil dilation | [51,52] | |
| Fixation | Fixation velocities | [59] |
| Fixation duration | [55,56,57,58,59,60,61] | |
| Fixation count | [56,60,61,62,63] | |
| Saccade | Saccade velocities | [57,59,60] |
| Saccade duration | [55,58,59,63] | |
| Saccade frequency | [57] | |
| Mean duration of saccades | [58,60] | |
| Amplitude of saccades | [56,58,60,63] | |
| Saccade angle | [60] | |
| Blinks | Blink number | [56,58,63] |
| Mean duration of blinks | [58] | |
| Blink frequency | [54] | |
| Eye gaze | Vertical/horizontal position of gaze | [57] |
| Eye rotation | [57,64,65] | |
| Gaze distribution maps | [66] | |
| Entropy of gaze transitions | [67] |
Table 3.
Overview of Eye-Tracking based Classification Techniques.
| Author | Task | Eye features | Validation | Model | Accuracy | Other metrics | Test subjects |
|---|---|---|---|---|---|---|---|
| Rahman et al. (2021) [59] | 12 scenarios in the driving simulator (auditory n-back task) | Saccades and fixation | 5-fold CV | SVM and CNN | SVM = 92% and CNN = 91% | SVM (Sensitivity = 0.9, specificity = 0.94 and precision = 0.94) and CNN (Sensitivity = 0.91, specificity =0.9 and precision = 0.9) |
33 participants (33 males and 0 females) |
| Fan et al. (2022) [62] | English paragraphs chosen from the close tests of four exams of CET-4 and CET-6 | Fixation | 5-fold CV | Siamese network model | 92.5% | Sensitivity = 0.9, Specificity = 0.950, AUC = 0.956, F1-score = 0.923 | 80 participants (40 were in the Pass group with 24 women and 40 in the non-pass group with 18 women) |
| Mitre-Hernandez et al. (2022) [51] | Digit memorization task | Pupil size | 5-fold CV | Random forest | -- | F1-score = 82%, precision = 0.82 and recall = 0.81 | 24 participants |
| Mitre-Hernandez et al. (2021) [52] | Refraction video games with different difficulty levels | Pupil size | -- | Random forest | 87.5% | -- | 14 participants (10 male and 4 female) between 16 and 37 years old |
| Kaczorowska et al. (2021) [58] | Digit symbol substitution test (DSST) | Fixations, saccades and blinks | -- | Multi-layer perceptron | 0.97 ± 0.05 | Recall = 0.97±0.05, precision = 0.98±0.04, F1-score = 0.97±0.05, and ROC = 0.99±0.01 | 29 participants (23 males and six females) aged 20 to 24, mean = 20.61 years, standard deviation = 1.54 |
| Bachurina et al. (2022) [56] | Colour matching task (n-back) | Pupil size, saccades and blinks | Leave one out CV | XGBoost regression mode |
-- | R2 = 0.828 | 57 participants (23 male and 34 female) |
| Rizzo et al. (2022) [60] | Stroop task | Fixations and saccades | 5-fold CV | ANN | -- | -- | 64 subjects (32 male and 32 female) average age = 30,2 ± 11,72) |
| Kaczorowska et al. (2022) [63] | Digit symbol substitution test (DSST) [107] | Saccade, fixation and blinks | -- | Random forest | 95.97% | F1-score = 95.98 | 30 participants (23 males and 7 females) aged 20 to 24 (M = 20.45; SD = 1.62); |
| Ktistakis et al. (2022) [76] | CAPTCHA Puzzle of 21 images. Cognitive load is induced by the time and difficulty of puzzle images |
Fixation, saccade, blink and pupil size |
5-fold CV | Gaussian Naive Bayes | 88% | -- | 47 participants (21 male and 26 female). Mean age = 32 ± 8 years (range: 18–47 years) |
| Liao et al. (2016) [57] | Driving in an urban and in speed limited environment | Eye gaze, fixation, pupil size and saccade | Leave-one-out | SVM with Radial Basis Function (RBF) | -- | Correct rate (CR) for Urban environment = 95.8 ± 4.4 and CR for highway environment = 93.7 ± 5.0% | 27 participants |
| Cao et al. (2016) [64] | Transfer of rubber pegs in a surgery simulator | Eye gaze, pupil size and eye-gaze | 10-fold CV | SVM and Probabilistic Neural Network (PNN) | SVM = 88.6%, PNN = 97.2% | -- | 12 participants (10 male, 2 female) average age 23 years |
| Hirayama et al. (2016) [65] | Driving a vehicle | Eye gaze | Leave-one-map-out | k-NN | 95.4% | -- | 40 participants (20 males and 20 females) average = 37.3 years old (with a range of 22 to 58 years old) |
| Roy et al. (2017) [53] | Young girl and Old Woman image (YGOW) and the Duck and rabbit (DR) | Fixation and pupil size | 10-fold CV | Decision trees, linear discriminant analysis, QDA, SVM (linear, quadratic, and cubic kernel function), bagged trees and k-NN | -- | -- | 24 participants |
| Okafuji et al. (2021) [66] | Controlling the steering wheel of a car at a constant speed of 45km/h and 90km/hr | Eye Gaze | -- | FB Delay PilotNet (CNN-based model) | -- | -- | 3 participants (3 males only) |
| Bafna et al. (2021) [54] | Eye-typing is used to induce 6 levels of mental workload |
Pupil size and blinks | 5-fold CV | Random forest regression | -- | MAE = 0.943, variance = 23.049% | 19 participants (9 males, 10 females) |
| Zhou et al. (2021) [55] | 33 situation awareness videos of driving a car | Fixations, pupil size and saccades |
10-fold CV | LightGBM | -- | RMSE, 0.121, MAE = 0.096, Corr = 0719 | 32 participants (29 males, 3 females) between 22 and 29 years old (M=24.2, SD=1.8) |
| Pillai et al. (2022) [67] | n-back (0-back and 2-back), Detection Response Task, and driving in a simulator | Pupil size, eye-gaze, fixations, and blinks | 1-fold CV | Naive Bayes | -- | -- | 16 participants ranging in age from 18 to 60 years (M = 22, SD = 3) |
| Sabab et al. (2022) [61] | Visual intention for perceiving textual or graphical information | Fixations | 10-fold CV | SVM (linear kernel function) | 92.19% | AUC = 0.9548, Precision = 0.9307, Recall = 0.9212, F1-score = 0.9206 | 31 participants (Mean: 28.32 years, SD: 10.30 years, Male: 66.67%, Female: 33.33%) |
Table 4.
Comparative analysis of studies utilizing SVM for cognitive workload classification.
| Study | Strengths | Limitations |
|---|---|---|
| Liao et al. [57] | Used SVM Recursive Feature Elimination (SVM-RFE) for feature selection, enhancing model efficiency. | Fusion of eye features and driving performance features didn't significantly improve results. Combination of features might not always lead to better results. |
| Cao et al. [64] | Used cognitive process and eye-tracking technology to improve accuracy and efficiency of endoscope operation. | SVM yielded higher intention estimation accuracy, but PNN was more effective in controlling endoscope direction using intentional gaze segments. |
| Roy et al. [53] | Analysed eye-tracking data using various ML classifiers to understand cognitive behaviours. Provided insights into classifier performance for cognitive behaviour analysis. |
Focus on analysing ML classifiers rather than specific problem-solving. No direct comparison of cognitive behaviour understanding effectiveness between classifiers. |
| Sabab et al. [61] | Proposed a pipeline-based approach for efficient extraction of eye features for visual attention task classification. Identified significant features contributing to visual attention task classification. |
SVM achieved better accuracy and other metrics, but RF had higher AUC. SVM had slightly lower AUC compared to RF. Limited information about the broader impact of the proposed method beyond classification. |
Table 5.
Comparative analysis of studies utilizing Naive Bayes for cognitive workload classification.
Table 5.
Comparative analysis of studies utilizing Naive Bayes for cognitive workload classification.
| Study | Strengths | Limitations |
|---|---|---|
| Pillai et al. [67] | Highlighted the effectiveness of Signal to Noise Ratio (SNR) in selecting useful features for classification. Provided the importance of entropy-based eye features in cognitive load classification. |
Focused on specific eye features, potentially missing broader context. The study did not directly address the effectiveness of Naive Bayes itself, but rather emphasized the feature selection process. |
| Ktistakis et al. [76] | Conducted a comprehensive evaluation of multiple ML algorithms, including Naive Bayes, for cognitive load assessment using eye-tracking data. Utilized two-way ANOVA analysis for optimal feature selection, enhancing classification accuracy. |
The study did not directly focus on the advantages or disadvantages of Naive Bayes algorithm itself, but rather its performance in comparison to other algorithms. |
Table 6.
Comparative analysis of studies utilizing Random forests for cognitive workload classification.
Table 6.
Comparative analysis of studies utilizing Random forests for cognitive workload classification.
| Study | Strengths | Limitations |
|---|---|---|
| Mitre-Hernandez et al. [51] | Demonstrated Random Forest's superior performance in classifying cognitive workload. | Did not directly compare Random Forest with other ML algorithms. |
| Mitre-Hernandez et al. [52] | Highlighted the importance of appropriate statistical tests for non-normally distributed data in eye-tracking studies. | Focused more on statistical tests and findings rather than in-depth exploration of Random Forest. |
| Kaczorowska et al. [63] | Employed ex-gaussian statistics for feature selection and achieved high accuracy (96%). Identified significant features from eye tracking data, contributing to the understanding of cognitive workload. |
Did not extensively compare Random Forest with other algorithms or feature selection techniques. |
| Bafna et al. [54] | Utilized Hidden Markov Model for labelling and showed Random Forest's superior performance in classifying mental workload. | Focused more on model comparison and selection than on in-depth exploration of Random Forest. |
Table 7.
Comparative analysis of studies utilizing Ensemble ML methods for cognitive workload classification.
Table 7.
Comparative analysis of studies utilizing Ensemble ML methods for cognitive workload classification.
| Study | Strengths | Limitations |
|---|---|---|
| Zhou et al. [55] | Employed the Shapley Additive Explanation (SHAP) algorithm for feature selection, enhancing model interpretability. Compared performance using relevant indicators (RMSE, MAE, correlation) with other ML models. |
Lacked comprehensive exploration of different hyper-parameter settings or model variations. |
| Bachurina et al. [56] | Explored important factors for classification, offering insights into the relevance of eye movement features. | No direct analysis of XGBoost's limitations or potential challenges. |
Table 8.
Comparative analysis of studies utilizing ANN for cognitive workload classification.
| Study | Strengths | Limitations |
|---|---|---|
| Kaczorowska et al. [58] | Conducted feature selection and explored multiple ML algorithms, including Multilayer Perceptron (MLP), for cognitive workload classification. Demonstrated the performance of MLP in comparison with traditional models (SVM, logistic regression). |
Limited discussion on tuning hyper-parameters or exploring variations in MLP architecture. |
| Rizzo et al. [60] | Highlighted significant fixation features and compared the performance of various algorithms. Demonstrated the challenges of selecting appropriate features and the potential limitations of random forest for the task. |
Focused only on specific fixation and saccade features, potentially missing broader context of cognitive load classification. |
Table 9.
Comparative analysis of studies utilizing CNN for cognitive workload classification.
| Study | Strengths | Limitations |
|---|---|---|
| Rahman et al. [59] | Utilized both eye-tracking data and camera images to extract saccade and fixation information for cognitive load classification. Explored various ML and DL classifiers, including SVM, LR, LDA, k-NN, DT, CNN, and LSTM, for cognitive load prediction. Highlighted the importance of cross-validation for model evaluation. |
Smaller dataset size could have impacted the accuracy of CNN models. Focus on accuracy without in-depth analysis of potential limitations or challenges of using CNN or other models. |
| Okafuji et al. [66] | Established a strong association between eye gaze data and steering wheel performance, showcasing the potential of DL models in driver behaviour analysis. | Limited sample size and scope may affect generalizability of findings to more complex driving scenarios. |
| Fan et al. [62] | Explored the use of Siamese networks trained on fixation count heatmaps for classification of eye-tracking data. Demonstrated feasibility of Siamese networks for classification tasks using eye-tracking data. |
Performance difference between models was not significant, potentially requiring further investigation or optimization. |
Table 10.
Summary of Eye-Tracking and Physiological Signal Classification Techniques.
| Author | Task | Physiological measures | Validation | Model | Accuracy | Other metrics | Test subjects |
|---|---|---|---|---|---|---|---|
| Vaitheeshwari et al. (2022) [130] | Battlefield environment developed in Unity 3d game engine | Galvanic skin response (GSR) sensor, and eye-tracking |
5-fold CV | LSTM | 99.7% | -- | 20 male participants aged between 20 and 23 |
| Yousefi et al. (2022) [106] | Stroop task and a mathematical stressor task | Pupil diameter (PD) and electrodermal activity (EDA) |
10-fold CV (Stroop task) and Leave-One-Out (mathematical Task) |
Linear discriminant analysis classifier | Stroop task = 88.43% and mathematical task = 91.1% | -- | 15 participants (8 males and 7 females with an average age of 26.93 ± 2.05) |
| Oppelt et al. (2023) [105] | n-back and playing songs while watching a car simulation video | Eye tracking, Electrocardiography (ECG), Electrodermal Activity (EDA), Electromyography (EMG) Photoplethysmogram (PPG), respiration rate, and skin temperature, Facial regions |
Nested k-fold cross-validation with 10 inner folds as the validation set and 10 outer folds |
XGBoost classifier | -- | AUC = 0.91 ± 0.02 and F1-score = 0.82 ± 0.06 | 51 participants (26 male, 24 female subjects and 1 subject that did not want to state gender and age) |
| Hijazi et al. (2021) [104] | Tellback task (Cognitive load of programmers) | Eye tracking and Heart Rate Variability (HRV) | 5-fold CV | SVM | 83 ± 0.75 % | Precision = 0.89, recall = 0.79, and F1-score = 0.83 | 30 participants |
| He et al. (2022) [115] | n-back task (1 and 2) while driving a car in a simulation environment | Eye tracking, heart rate (HR), ECG and galvanic skin response (GSR) | 10-fold CV | Random forests | 97.8% | 33 participants (18 males and 15 females) average age = 27.6 and SD = 4.45 | |
| Wang et al. (2023) [131] | Impact sensitivity experiment | EEG and eye movement | 5-fold CV | SVM and random forests | SVM = 94.9 % and RF = 94.3 % | SVM (AUC = 0.984) and RF (AUC = 0.961) | 21 male participants (mean age was 23.1 ± 2.4 years) |
Disclaimer/Publisher’s Note: The statements, opinions and data contained in all publications are solely those of the individual author(s) and contributor(s) and not of MDPI and/or the editor(s). MDPI and/or the editor(s) disclaim responsibility for any injury to people or property resulting from any ideas, methods, instructions or products referred to in the content. |
© 2026 by the authors. Licensee MDPI, Basel, Switzerland. This article is an open access article distributed under the terms and conditions of the Creative Commons Attribution (CC BY) license (http://creativecommons.org/licenses/by/4.0/).
Copyright: This open access article is published under a Creative Commons CC BY 4.0 license, which permit the free download, distribution, and reuse, provided that the author and preprint are cited in any reuse.


