Submitted:
12 June 2026
Posted:
17 June 2026
You are already at the latest version
Abstract
The energy transition requires substantial investments in renewable energy sources and in policy tools that effectively guide market participants' decisions. We examine whether the European Emissions Trading System has effectively driven renewable energy deployment in the power sector. Combining panel econometric analysis of installed renewable capacity across European Member States, a cross-country survey of 127 firms in six EU ETS countries, and an hourly, market-based estimation of inframarginal rents across a panel of eight Member States, we find that public support mechanisms consistently drive renewable-capacity expansion. The EU Allowance price does not exhibit a significant direct effect on renewable deployment after controlling for structural and market variables. In electricity markets, the ETS primarily operates through mechanisms that shape wholesale electricity prices and carbon-cost pass-through, generating persistent inframarginal revenues for low-carbon technologies through marginal price formation. A comparison between regulatory CO₂ factors used for indirect ETS cost compensation and observed market-based pass-through indicators reveals materially divergent magnitudes across Member States, with regulatory-to-observed ratios ranging from 1.2x in Italy to 46.2x in Sweden. The evidence suggests that, in European electricity markets, the ETS currently operates more directly as a wholesale-price transmission and revenue-redistribution mechanism than as an autonomous driver of renewable investment deployment.
Keywords:
ETS
; carbon price
; renewable energy
; inframarginal rents
; emission trading
; electricity market
; SDG 7
; energy market
; subsidies
; EU
1. Introduction
In today’s geo-economic landscape, carbon pricing schemes must achieve two goals: reducing emissions and safeguarding the competitiveness of economic systems [1]. Reaching Sustainable Development Goal 7 (SDG 7) requires holistic approaches that combine environmental policies and market-based instruments. The EU Emissions Trading System (ETS) has, since its introduction, represented one of the most advanced applications of a market-based environmental policy instrument within a large, integrated economic area [2,3]. Unfolding its role in the decarbonisation of the power sector is prominent because electricity generation is fully exposed to the carbon price and therefore offers the most direct setting in which to verify whether the ETS has effectively generated observable adjustment dynamics. Without moving towards a more sustainable energy mix via increasing installed renewable energy capacity, economic growth and energy intensity worsen environmental quality, and environmental taxes can play a remarkable role in shaping policies; in fact, decoupling of growth from environmental impacts is more effective in countries with greater ecological capacity [4]. No wonder that decarbonisation policies increasingly rely on a combination of carbon pricing, regulatory intervention, industrial policy, infrastructure deployment and public support mechanisms intended to accelerate technological transformation and guide long-term investment decisions.
In the power sector, the carbon price directly affects the marginal cost of fossil-based generation, alters the relative competitiveness of generation technologies, and may therefore influence both short-term dispatch decisions and medium-term investment choices [5,6]. For this reason, the power sector serves as a benchmark for assessing whether the ETS has effectively contributed to decarbonising the energy mix [7,8]. Recent literature on drivers of renewable energy development suggests that both carbon pricing and subsidies matter. Still, they act differently: targeted subsidies more directly drive renewable energy investment, while ETS works best when revenues or carbon prices are high and well-designed [9,10,11].
We argue that public support schemes play a primary role in driving renewable energy investments, and the ETS carbon price signal primarily serves as a complementary mechanism rather than an autonomous investment driver. This consideration defines the research scope of this study: to what extent has the EU ETS effectively served as a direct driver of renewable energy deployment in the European power sector? We tested our hypotheses by designing a mixed-methods empirical strategy that combines three complementary perspectives and research questions (RQs). First, an econometric analysis covering European Member States for 2013-2024 to test RQ1, i.e., whether the EUA price has a significant direct effect on installed renewable capacity. Second, an international survey of approximately 127 firms across six EU ETS countries collected evidence from market participants on perceived investment drivers, which is RQ2. Third, to answer RQ3, an hourly market-based methodology was developed to estimate the effective transmission of ETS carbon costs into wholesale electricity prices and the resulting inframarginal rents accruing to low-carbon technologies, applied to a panel of eight Member States over 2021-2024. Evidence confirms that public support mechanisms emerge as a robust driver of renewable-capacity expansion, underscoring the central role of subsidies, long-term contractual arrangements, and revenue-stabilisation mechanisms in supporting investment decisions and project bankability [11,12], while the ETS operates in parallel; it is associated with renewable development anyway. The most economically material effect of the ETS in power markets is the generation of persistent inframarginal revenues for low-carbon technologies through marginal price formation. At the same time, comparisons between regulatory CO₂ factors used for indirect ETS cost compensation and observed market-based pass-through indicators reveal significant divergences across Member States.
The key message is that, within European electricity markets, the EU ETS currently operates more directly as a wholesale electricity-price transmission and revenue-redistribution mechanism than as a sufficiently autonomous and stable driver of renewable investment deployment. Future reform discussions increasingly require a more explicit assessment of the interactions among carbon pricing, electricity-market design, renewable-support schemes, and long-term investment-favourable conditions.
The remainder of the paper is organised as follows. Section 2 reviews the three strands of literature relevant to the analysis (the policy-mix debate, investor decision-making and bankability, and carbon-cost pass-through with inframarginal rents) and derives the three working hypotheses from each strand, together with the conceptual background of the mixed-methods approach. Section 3 presents the research design, the analytical framework, the survey methodology and the inframarginal-rents identification strategy. Section 4 reports the econometric results, survey evidence and empirical estimates of ETS-related inframarginal rents and indirect-compensation factors. Section 5 discusses the findings in light of the existing literature and highlights the policy implications, and Section 6 concludes.
2. Literature Review
This section reviews the three strands of literature on which the empirical analysis is built. First, it examines the interaction between carbon pricing and support schemes for renewable energy, the policy-mix debate, from which Hypothesis 1 (H1) is derived. Second, it reviews the investor decision-making and project feasibility in renewable energy, from which Hypothesis 2 (H2) is derived. Finally, this section reviews carbon-cost pass-through, marginal price formation in wholesale electricity markets and inframarginal rents, which relates to Hypothesis 3 (H3). Each hypothesis is stated in null and alternative form at the end of the corresponding subsection, immediately after the literature that motivates it.
Carbon pricing and the policy mix for renewable deployment
In the canonical economic-environmental framework, a credible carbon price internalises the externality and, through its impact on wholesale electricity prices, improves the relative competitiveness of low-carbon technologies. From this perspective, the ETS should, in theory, act as a direct driver of investment in renewable energy, incentivising the reallocation of capital towards lower-emission technologies [7]. Based on this approach, the conditions under which a cap-and-trade system can coexist effectively with other climate policy instruments, such as environmental taxes and direct subsidies, are analysed, highlighting the issue of policy overlap and interaction, a central aspect of this analysis [5]. Another study provides one of the first systematic reviews of the interaction between emissions trading schemes and renewable energy support mechanisms, showing how the two instruments can operate in a complementary or substitutive manner depending on the configuration of the incentive regime and the stringency of the emissions cap [13].
Two distinct positions have emerged in the subsequent literature. On one hand, several contributions argue that, with appropriate design improvements, the EUA price signal can be made strong enough to act as a primary investment driver. Flachsland et al. revisit the case for an EU EUA price floor and argue that, despite the recent reform and the Market Stability Reserve, design flaws related to credibility, myopia and waterbed effects persist and that a price floor would enhance the predictability of the EUA price and therefore its role as an investment signal [14]. Pahle et al. develop a complementary argument from the angle of policy sequencing: barriers to climate-policy stringency can be overcome over time through deliberate sequencing of instruments, with carbon pricing progressively ratcheting up as political and economic constraints are relaxed [15]. On this view, the EUA price retains the potential to become a sufficient driver of renewable investment once policy credibility issues are addressed. Empirical support for this position is provided by another study that uses a synthetic-control approach on sectoral emissions data and estimate that the EU ETS saved more than one billion tonnes of CO₂ between 2008 and 2016, equivalent to a 3.8 per cent reduction relative to a counterfactual without the EU ETS, even during the period of historically low allowance prices, providing direct evidence that the system can deliver measurable abatement before reform [16].
On the other hand, an increasing corpus of literature suggests that, in practice, direct support instruments dominate the EUA price as drivers of renewable deployment. Lecuyer and Quirion [17] show, in a model with uncertainty over electricity demand, renewable costs and gas prices, that feed-in tariffs are welfare-improving as a “safety net” against ETS over-allocation: when the cap is set higher than emissions that would have occurred without the ETS, renewable subsidies still ensure abatement that the carbon price alone fails to deliver. For example, it is argued that subsidy-type renewable instruments outperform renewable portfolio standards in terms of emission reductions once carbon pricing is in place [18]. Another work compares capacity-based and energy-based subsidies for the 2030 EU power market and conclude that capacity subsidies spur more renewable investment than energy subsidies for a given budget, while higher carbon prices reduce the cost of capacity subsidies more than that of energy subsidies, a result that points to subsidies as the operative investment instrument and to the carbon price as a complementary cost-reduction channel rather than as an autonomous driver Ozdemir et al. (2020) while a similar article, examining the case for supporting renewable electricity, develops a learning-by-doing argument that justifies initial subsidies in their own right, independently of any carbon-price effect [6].
Recent reviews on policy mixes for the energy transition also highlight a broadly consistent conclusion. Rastegar et al., in a systematic literature review on environmental policies and renewable-energy innovation, document that targeted subsidies and feed-in instruments are repeatedly identified as the most effective tools for early renewable energy deployment. At the same time, carbon pricing tends to play a complementary role [9]. Moroz and Lyeonov reach a similar conclusion in their bibliometric review of financial and fiscal instruments supporting renewable-energy sources [19]. Liu et al., in their empirical analysis of G7 countries, find that environmental regulation and financial development jointly drive the renewable transition, with direct support instruments persistently dominant [11]; Lin and Jia show that an ETS without revenue recycling into renewables may even reduce renewable generation [10]. Another study provides evidence that higher permit volumes (looser caps) are associated with a lower share of renewables [20]. At the same time, a previous analysis documents that overlapping policies and recession effects drove the post-2008 collapse of the EUA price, a reminder that the EUA price signal is itself endogenous to the broader policy mix [21].
The question our study addresses is whether the EUA price has been a direct driver of renewable-capacity deployment, or whether public support mechanisms have absorbed the bulk of the explanatory power. This translates into the following pair of hypotheses. H1.0 The EUA price signal alone has a statistically significant positive effect on installed renewable capacity, once macroeconomic conditions are controlled for; i.e., the EUA price has operated as a direct driver of renewable deployment in the EU power sector. H1.1 Public support mechanisms are the dominant driver of installed renewable capacity, while the EUA price has no independent effect once direct support is controlled for; the two instruments may also interact (overlap effects).
Investor decision making
Our second analysis shifts focus to businesses and investors, examining how decision-makers actually weigh up carbon prices against direct subsidies when investing capital in the production and storage of renewable energy. As outlined by Borenstein[22], within a framework of internalised externalities, the carbon price should be the dominant marginal signal for investment in low-carbon technologies. If this view holds at the level of investment decisions, then the price of EUAs should be perceived by investors as the most important driver of investment.
A growing empirical literature, however, points in a different direction, highlighting that direct support, regulatory predictability and revenue-stabilisation instruments outweigh carbon-pricing instruments in shaping investor behaviour [12]. It has also been reported that investment in renewable energy and clean technology is driven primarily by long-term financial structures and revenue-stabilisation mechanisms, with carbon-pricing instruments playing a comparatively secondary role in actual capital allocation [23]. To the same token, financial development and environmental regulation jointly support the renewable transition, with revenue-stabilisation instruments being decisive at the level of project finance[11].
Theoretical and modelling contributions reinforce this picture. Bublitz et al. review electricity-market design and document that, under capacity remuneration mechanisms and the presence of long-term contracts, the marginal value of the carbon price for investment decisions is partially absorbed by other revenue streams [24]. Aflaki and Netessine show that, in market and intermittency conditions typical of European electricity systems, carbon taxes alone can even reduce incentives to invest in intermittent renewables because of how risk and supply variability interact with revenue formation [25].
We test whether investors and energy utilities perceive the EUA price as the most important investment driver for renewable-generation and storage projects, or whether they consider subsidies above the EUA price as drivers of investment decisions for renewable-generation and storage projects.
carbon cost pass-through, marginal pricing and inframarginal rents
The mechanism by which the EU ETS actually shapes wholesale electricity prices and the resulting distribution of rents across generation technologies is a prominent aspect as well. Sijm et al., in their analysis of free-allocation effects in the power sector, document that European power companies pass on the cost of EU ETS allowances through electricity prices, with empirical and model-based pass-through rates ranging from 60% to 100% of CO₂ costs in Germany and the Netherlands [26]. They show that the pass-through rate is not constant: it depends on the carbon intensity of the marginal production unit and on market- and technology-specific factors. The structural consequence of this pass-through, under marginal pricing, is the generation of inframarginal rents for low-carbon technologies that do not bear equivalent carbon costs but receive the market price set by fossil units. Keppler and Cruciani[27] provide the first quantitative assessment of these ETS-related rents for the European power sector during the early phases of the EU ETS, establishing the analytical framework that the present study extends to a more recent period and to a broader country panel. Fabra and Reguant[28] deepen the theoretical and empirical analysis of pass-through in the Spanish wholesale electricity market and confirm that, under marginal pricing, carbon costs are substantially passed through, with the magnitude depending on market structure and on the technology setting the marginal price. The above-mentioned studies converge in reporting that ETS pass-through and inframarginal rents are not transient features of the early phases of the system but a structural property of marginal-pricing electricity markets in which fossil technologies set the price.
Recent contributions show that the identity of the price-setting technology is heterogeneous across countries and over time, with direct implications for empirical pass-through. For example, fossil-fuel-based plants set electricity prices in Europe approximately 58% of the time, with natural gas alone setting the price 39% of the time, while generating only around 34% of electricity [29]. This mismatch between the share of generation and the share of price-setting is what produces inframarginal rents for non-fossil technologies. Increasing wind and photovoltaic generation lowers spot prices through the merit-order effect; this result is the mirror image of the inframarginal-rent mechanism and confirms that wholesale prices in European markets are sensitive to which technology sets the margin [30]. Blume-Werry et al. provide a comparative analysis of price-setting technologies across European electricity markets, confirming substantial cross-country heterogeneity [31]. Duttilo and Lisi [32] estimate the EU ETS pass-through rate in the power system and confirm that its magnitude is materially shaped by the frequency of fossil price-setting and the carbon intensity of the marginal unit.
This body of evidence has direct implications for the State aid framework for indirect ETS cost compensation. The framework relies on regulatory CO₂ emission factors derived from structural averages of fossil generation within predefined regional areas. If the actual pass-through varies materially with the frequency of fossil price-setting, then structural averages may diverge from observed market-based factors [29]. The empirical extent of this divergence has so far received limited systematic attention in the literature, and is one of the empirical contributions of this paper.
Our hypothesis on price formation and pass-through is stated as follows. H3.0 Observed market-based ETS pass-through, estimated from hourly identification of the price-setting technology, is broadly aligned with the regulatory CO₂ factors used in the State aid framework for indirect ETS cost compensation. H3.1 Observed market-based pass-through factors diverge materially from regulatory CO₂ factors, particularly in Member States where the marginal price is set by fossil generation only in a minority of hours; ETS-related inframarginal rents accruing to non-fossil generation are accordingly substantial and persistent.
Each of the three hypotheses derived above is best tested through a distinct empirical lens: panel econometrics for H1, an investor survey for H2, and an hourly market-based estimation for H3. To address the complexity of decarbonisation under the EU ETS, we adopt a triangulation approach that combines multiple methods, datasets, and analytical perspectives to provide a more robust and comprehensive interpretation of the empirical evidence. Triangulation means using multiple methods and data sources to study the same phenomenon. Reading the three lenses together, as triangulation prescribes, provides us with the insight to test the same overarching question under three different conceptual backgrounds; their convergence strengthens the credibility of our inference.
3. Materials and Methods
Firstly, the section presents the analytical framework used to assess the drivers of renewable capacity development, including the econometric specification of the panel model, the dependent and explanatory variables, the geographical and temporal coverage, and the identification strategy. It then describes the international survey on the drivers of investment in renewable energy and storage systems. The identification strategy for pricing technologies and the estimation of the transfer of ETS carbon costs to wholesale electricity prices are then analysed. Finally, the methodological scope and limitations are discussed. Figure 1 illustrates the empirical strategy. The analysis is organised around three specific research questions. The goal is to understand to what extent the EU ETS has effectively served as a direct driver of renewable-energy deployment in the European power sector over the period 2013-2024, and through which transmission channels does its carbon-price signal actually operate.
RQ1. What are the drivers of renewable-capacity deployment in the EU power sector, and what is the role of the overlap between the EUA price signal and public support mechanisms? RQ2. How do renewable investors (utilities, project developers and financial intermediaries) rank the relative importance of carbon pricing, subsidies, long-term support schemes and regulatory stability when making investment decisions in renewable generation and storage? RQ3. To what extent are ETS costs effectively passed through into wholesale electricity prices, and what is the magnitude of the resulting inframarginal rents accruing to non-fossil generation, including in comparison with the regulatory CO₂ factors used for indirect ETS cost compensation?
3.1. Data Management
Econometric Analysis
The dependent variable is the installed renewable capacity in MW (source: EMBER). The key explanatory variables are: support schemes (source: EURO-STAT. General government expenditure by function. Sector: General government. COFOG99: Fuel and energy. ESA 2010: Subsidies. Online data code: gov_10a_exp). i.e., the costs of EUA that reflect mainstream ideas on the role of carbon price on energy sector decarbonisation (Source: EEX), and that is the interaction between subsidies and EUA. Control variables include verified energy-sector emissions, serving as a decarbonisation pressure proxy (source: Emission Trading System Union Registry, “Verified emission 2024”), and gross domestic product (GDP) to control for the economic cycle (Source: EUROSTAT). Table 1 describes the variables used in the drivers of renewable capacity development analysis.
Survey
The survey sample (127 respondents) is balanced across countries: Italy accounts for 25.1% of responses, followed by France (20.5%), Spain (19.9%), Germany (20.3%), Poland (7.1%) and Sweden (7.1%). Medium-sized and large firms dominate the sample, and 37.8% of respondents are C-level executives. Table 2 describes the variables analysed from the survey.
Price-Setting Technologies and ETS Pass-Through
The hourly panel covers eight EU Member States—Belgium, France, Germany, Italy, the Netherlands, Poland, Spain and Sweden—and is assembled from the ENTSO-E Transparency Platform. Four ENTSO-E datasets are used: day-ahead prices (12.1.D), aggregated generation per type (16.1.B/C), actual total load (6.1.A) and physical flows/scheduled commercial exchanges (12.1.F/G). Dataset codes refer to the corresponding articles of Commission Regulation (EU) No 543/2013. Raw data are read with the original tab-separated layout, column names are normalised, and timestamps are coerced to UTC and floored at hourly frequency. The technical parameters are reported in Table 3.
Each record is assigned to one of the eight target countries by matching the ENTSO-E map code, area code and area display name. Table 4 shows descriptive statistics.
The aggregation rule prefers the exact country row whenever available; otherwise the country value is obtained by summing subzone values for load, generation and cross-border flows—applied in particular to Italy (seven bidding zones) and Sweden (SE1–SE4), with the German–Luxembourg DE-LU price area treated as a single national observation. For multi-zone countries, the national price is computed as the load-weighted average of zonal prices. Generation by technology is reduced to six standardised categories—gas, coal, nuclear, wind, solar and hydro—by string-matching the ENTSO-E production type field. Cross-border physical flows are processed as directional pairs; same-country zone-to-zone flows are excluded to avoid double-counting. Fuel price series (TTF gas and international coal benchmarks) are retrieved from FactSet, and EUA market prices from EEX.
3.2. Empirical Analysis
We adopt a mixed methods approach to provide a more robust and comprehensive interpretation of the empirical evidence via triangulation of methods and data sources. In economics, it is valued mainly for improving credibility, validity, and causal inference by reducing bias introduced by a single method. In economics, it often means combining quantitative statistical analysis with qualitative evidence to better reflect reality, enabling the integration of different insights [33]. Triangulation supports empirically based hypothesis construction and theory modification [34], method innovation [35], and rebalancing fields dominated by a single paradigm by institutionalising multiple methods to avoid systematic bias [33,36]. Although divergent results may be common, we agree that they can yield a more insightful understanding and new concepts rather than a single approach [37]. The triangulation strategy adopted in this work allows for a better understanding of the interaction between the EUA price signal, technological maturity, infrastructure constraints, and investment behaviour in different electricity markets.
Drivers of Renewable Development
To assess whether the EU ETS carbon price has operated as an implicit economic signal supporting the decarbonisation of the European power sector, the empirical strategy is organised to investigate whether the same price signal may have contributed to renewable investment dynamics, proxied by installed renewable capacity. From a theoretical perspective, the EUA price is expected to influence renewable investments indirectly, by increasing wholesale electricity prices and improving the competitiveness of low-carbon technologies. However, this transmission may be partial or uncertain due to market design, regulatory interventions and price volatility [21,24]. By contrast, renewable subsidies act more directly on investment decisions by improving expected returns and reducing financing constraints [38]. The empirical framework allows the testing of three key hypotheses: whether renewable subsidies are a significant and robust driver of installed capacity; whether the EUA price has an independent effect on renewable investment; and whether the interaction between the two instruments suggests complementarity or substitution effects. The analysis is based on a panel covering European Member States over the period 2013-2024 as formalised in Equation 1.
The model is estimated as a two-way fixed-effects panel with country fixed effects and year fixed effects , with standard errors clustered at the country level to account for heteroskedasticity and serial correlation [39]. This framework is particularly relevant in the European context, where multiple policy instruments coexist and may generate overlapping or interacting signals. The model investigates the main determinants of renewable energy capacity development across countries, focusing on the role of EUA price and incentives. This relates to a broader issue: whether different climate policy tools act as complements or substitutes in fostering the energy transition.
Survey on Renewable Energy Investment Drivers
An international survey was commissioned across six European countries (Italy, France, Spain, Germany, Poland and Sweden), focusing on the main EU economies participating in the ETS. The survey targeted companies operating in the energy sector and financial intermediaries specialising in investments in green technologies, aiming to collect 127 responses. Respondents were selected from energy utilities and project developers active in renewable energy generation and storage, as well as from financial intermediaries and investors specialised in green and low-carbon technologies. The questionnaire is divided into an introductory section on demographic and professional characteristics, a section on route-to-market strategies and revenue structures, a central section on factors boosting investment in renewable energy and storage and a section on market, regulatory and financial constraints. Most questions use five-point Likert scales, allowing for comparable measurement of the degree of importance respondents attribute to the various factors considered.
Price-Setting Technologies and ETS Pass-Through
The estimation of ETS-related inframarginal rents is grounded in a set of simplifying but economically consistent assumptions regarding the functioning of wholesale electricity markets. The analysis builds on the marginal pricing framework, according to which electricity prices are determined on an hourly basis by the marginal unit, defined as the last generation technology dispatched to meet demand [29,31]. Under this assumption, the observed day-ahead market price is interpreted as a proxy for the marginal cost of the price-setting technology.
The empirical implementation combines hourly electricity market data with daily fuel price series and EUA prices. Day-ahead electricity prices and hourly generation by technology are matched with daily observations of fuel prices (TTF for gas and international coal benchmarks). Within this framework, the marginal cost of fossil technologies is constructed by explicitly accounting for plant efficiency and emission intensity. Fuel prices are converted into electricity-equivalent marginal costs by dividing them by the assumed conversion efficiency of the relevant technology, while the carbon cost component is added by multiplying the EUA price by the corresponding emission factor per unit of electricity produced, as formalised in Equation 2 and Equation 3.
And
Baseline assumptions are η_gas = 0.55 for combined-cycle gas turbines, η_coal = 0.38 for coal-fired generation, EF_gas = 0.37 tCO₂/MWh and EF_coal = 0.90 tCO₂/MWh, consistent with standard engineering values reported by the International Energy Agency [40], the Intergovernmental Panel on Climate Change [41] and European Commission Joint Research Centre [42] the . A prudential residual-load threshold of 0.20 (residual load over total load) is introduced to exclude hours characterised by very low residual demand conditions, where standard merit-order dynamics may be less representative of actual price formation.
The identification of the marginal technology follows a rule-based classification operationalising the merit-order logic. For each hour, observed electricity prices are compared with the estimated marginal costs of gas and coal. When the observed price is compatible with the estimated marginal cost of gas and gas-fired generation is active, the hour is classified as “Gas”; when the observed price is compatible with the estimated marginal cost of coal and coal generation is active, the hour is classified as “Coal”; remaining observations are assigned to a residual category. On this basis, an effective ETS transmission factor is constructed by assigning to each hour the emission factor of the identified marginal technology and aggregating over time. Inframarginal rents are then estimated by isolating the ETS-related component of electricity prices and attributing it to inframarginal generation (wind, solar and hydro), which does not bear equivalent carbon costs but receives the market price set by fossil units.
3.3. Methodological Limitations
The triangulation approach adopted in this study enhances the robustness of the findings by combining econometric evidence, survey results and analyses based on market data. However, the research is not without its limitations. The econometric analysis is constrained by data availability and the relatively limited time period considered, which encompasses a succession of exceptional events, including the COVID-19 pandemic, the subsequent energy crisis and geopolitical tensions. This makes it difficult to identify the specific effect of the ETS’s price signal. Furthermore, the survey covers six European countries and a relatively small number of respondents. Although the sample includes decision-makers directly involved in investment processes, it cannot be considered statistically representative of the entire population of market operators. Moreover, the survey focuses primarily on energy utilities, project developers and financial investors, without systematically including other relevant stakeholders. The ETS-related inframarginal rents estimation approach should be interpreted as a stylised representation of market dynamics. It does not explicitly account for cross-border electricity flows and their impact on marginal pricing, network constraints and congestion effects, or situations in which non-fossil technologies—such as hydro, nuclear or storage—set the marginal price. Strategic bidding behaviour and other market imperfections are not modelled. As a result, the estimated marginal technologies and the associated ETS pass-through should be regarded as representative indicators of underlying market conditions rather than exact hour-by-hour reconstructions. The analysis relies on publicly accessible market and generation data; National Regulatory Authorities and ACER could potentially develop more granular assessments within the broader market-monitoring framework established by Regulation (EU) No 1227/2011 on wholesale energy market integrity and transparency (REMIT).
4. Results
The results are organised around four subsections that progressively move from the determinants of renewable-capacity expansion to the transmission of carbon costs into wholesale electricity prices. First, the econometric evidence on the drivers of renewable capacity development tests the relative roles of public subsidies, the EUA price and their interaction within a two-way fixed-effects framework. Second, the survey evidence on investment drivers summarises how senior decision-makers in the six surveyed countries rank the relative importance of subsidies, regulatory stability, long-term support schemes, procurement mechanisms and the EUA price for both renewable generation and energy storage projects. Third the quantification of ETS-related inframarginal rents across the eight Member States analysed over 2021–2024, isolating the carbon-cost component embedded in wholesale electricity prices and estimating its magnitude in each country and year. Finally, the comparison of the regulatory CO₂ factors used within the EU State aid framework for indirect ETS cost compensation with the observed market-based factors derived from the empirical methodology highlights the divergence between structural and market-based pass-through indicators across Member States.
4.1. Drivers of Renewable Capacity Development
The evidence in Table 5 indicates that renewable energy investment decisions are policy-driven and that the EUA signal alone is insufficient, consistent with [17,18]. A 1% increase in public subsidies is associated with a 0.28% increase in renewable capacity, and the effect remains statistically significant after clustering standard errors at the country level, confirming the role of public support schemes. In contrast, the EUA price does not exhibit a statistically significant direct effect on installed renewable capacity, confirming that carbon pricing alone is insufficient to drive renewable investment. The interaction term between subsidies and EUA price is negative and weakly significant, suggesting that the effectiveness of subsidies declines as the carbon price increases—a result consistent with partial overlap effects within the broader policy mix.
The marginal effects shown in Figure 2 confirm the results obtained from the econometric estimates. In all three specifications, the impact of renewable energy support mechanisms is positive and statistically significant when the price of EUAs is low or intermediate. However, the marginal effect of subsidies gradually decreases as the carbon price rises. In Model 1, for example, the elasticity of renewable capacity with respect to subsidies falls from around 0.20 at the lowest levels of the EUA price to values close to 0.03–0.04 at the highest levels observed in the sample. A similar trend also emerges in Models 2 and 3, highlighting the considerable robustness of the result across the different specifications adopted.
From an economic perspective, these results suggest a partial overlap between the EU ETS price signal and direct support mechanisms. When the carbon price is low, subsidies play a particularly significant role in expanding installed capacity. Conversely, as the price of EUAs rises, part of this incentive is already provided indirectly by the market through higher electricity prices and the improved competitiveness of low-emission technologies. Consequently, the additional contribution of subsidies tends to decrease progressively, whilst remaining positive throughout the entire observed period. Overall, the empirical evidence suggests that subsidies and carbon pricing do not operate as perfectly complementary instruments, nor as complete substitutes: their effect appears instead to be characterised by a relationship of decreasing complementarity.
4.2. Survey Evidence: Investment Drivers
For renewable energy generation projects, natural gas price emerges as the most influential driver, followed by long-term public support schemes with durations exceeding 10 years, regulatory stability and policy certainty, public support schemes and structured procurement mechanisms. The EUA price records a comparatively lower average score. For energy storage systems, regulatory stability and policy certainty are the most important factors, followed by capital expenditure, public subsidies and incentives and development costs; in this case, the EUA price records an average value. Across both segments, respondents consistently attribute higher importance to subsidies, long-term support schemes and regulatory stability than to the EUA price alone, confirming that market participants view public intervention and risk-reduction mechanisms as more decisive than carbon pricing alone [12,19].
Figure 3 shows that, for renewable energy generation projects, natural gas prices are the most influential factor, followed by regulatory stability and public subsidies. For storage projects, regulatory stability, capital investment and public subsidies receive the highest scores. Conversely, whilst still considered relevant, the price of EUAs consistently ranks below the other key factors influencing investment in both generation and storage projects. What is above is consistent with findings reporting that market participants view public intervention and risk-reduction mechanisms as more decisive than carbon pricing alone [12,19].
4.3. Price-Setting Technologies and ETS Pass-Through
The application of the methodological framework confirms the existence of substantial inframarginal rents across all countries analysed. The magnitude of estimated rents varies significantly: in 2022, Germany recorded €5.76 bn, France €3.29 bn, Italy €2.47 bn, Spain €2.14 bn, Poland €1.64 bn, the Netherlands €0.89 bn and Belgium €0.38 bn; by 2024, values had moderated to €2.10 bn (Italy), €1.48 bn (Germany), €0.96 bn (Spain), €0.88 bn (Poland), €0.86 bn (France), €0.40 bn (the Netherlands) and €0.13 bn (Belgium). Two elements are particularly relevant, as shown in Table 6. First, the magnitude of inframarginal rents appears closely linked to the frequency with which gas-fired generation acts as the marginal technology, rather than to the absolute level of the carbon price [31]. Second, the persistence of these rents over time indicates that the ETS-related component of electricity prices is not limited to temporary market conditions or exceptional scarcity episodes but represents a structural feature of electricity markets in which fossil technologies continue to play a central role in price formation [28,29]. Taken together, these results support the interpretation that one of the main observable effects of the ETS in the power sector operates through the price-formation channel and the associated generation of persistent inframarginal rents.
Regulatory CO₂ Factors Versus Observed Market-Based Factors
A comparison between the maximum regional CO₂ emission factors defined in Annex III of Commission Communication C/2026/196—used within the State aid framework for indirect ETS cost compensation—and the observed market-based factors derived from the empirical methodology reveals materially divergent magnitudes as in Table 7. Average observed market-based factors over 2021–2024 are 0.36 tCO₂/MWh for Italy (against a regulatory factor of 0.44, ratio 1.2x), 0.23 for France (0.43, ratio 1.9x), 0.21 for Spain (0.47, ratio 2.2x), 0.25 for Germany (0.73, ratio 2.9x), 0.17 for Belgium (0.37, ratio 2.2x), 0.27 for the Netherlands (0.44, ratio 1.6x), 0.27 for Poland (0.78, ratio 2.9x) and 0.01 for Sweden (0.60, ratio 46.2x). The Swedish case is particularly illustrative: despite a very limited observed frequency of fossil-fuel marginal price-setting conditions during the period analysed, the standardised regulatory CO₂ factor remains comparatively elevated. The divergence does not reflect statistical inconsistency but rather the fundamental distinction between two different conceptual approaches: regulatory parameters rely on structural characteristics of electricity systems (weighted average CO₂ intensity of fossil-based generation within predefined geographical areas), whereas market-based indicators measure the effective transmission of carbon costs into wholesale electricity prices through observed marginal price-setting conditions.
The four results indicate that the EU ETS operates in the European power sector primarily as a wholesale-price transmission and inframarginal-rent generation mechanism rather than as an autonomous driver of renewable investment. Subsidies and long-term contracts remain the dominant drivers of capacity expansion, ETS-related inframarginal rents are substantial across the eight Member States, and regulatory CO₂ factors diverge materially from market-based indicators.
5. Discussion and Policy Implications
Our results contribute to a long-standing strand of literature on the role of carbon pricing in driving low-carbon investment. Previous studies have produced mixed conclusions. Some have argued that, in specific market and intermittency conditions, carbon taxes alone can weaken renewable investment incentives or be less effective than dedicated subsidies [25]. Others have shown that an ETS without recycling revenues into renewables may reduce renewable generation by cutting overall demand and raising renewable costs, while using most ETS revenue to support all renewables can make the ETS important for renewable generation [10]. For the EU specifically, higher carbon prices have been shown to reduce the differences between subsidy types, though subsidies remain important alongside the ETS [38]; another study has found that higher permit volumes are associated with a lower share of renewables [20], and recent reviews stress that policy mixes combining subsidies, carbon pricing, green bonds and other fiscal instruments are typically used in practice, with subsidies/FITs crucial for early deployment and carbon pricing increasingly important as markets mature [19,23]. Our findings advance the literature. First, the econometrics analysis confirms, with a longer and updated time horizon, that public support remains the dominant statistically significant driver of renewable-capacity expansion and that the EUA price does not exhibit an independent effect on installed renewable capacity. This result is consistent with previous findings suggesting subsidies outperform other approaches [17]. The added value of our work lies in the triangulation between econometric, survey and market-based evidence: the survey results corroborate the econometric findings from the perspective of market participants, while the estimation of inframarginal rents provides a quantitative measure of the alternative channel through which the ETS operates in practice. Second, the estimation of ETS-related inframarginal rents extends previous analytical frameworks [26,27] to a more recent period (2021-2024) and to a broader panel of eight Member States, exploiting the granularity of ENTSO-E hourly data. The estimates confirm the structural and persistent nature of the price-formation channel, in line with recent evidence on gas as marginal price-setter [29] and on the role of carbon-cost pass-through [32,43]. The comparison between regulatory CO₂ factors and observed market-based factors highlights an issue that has received limited attention. While the State aid framework for indirect compensation has been the subject of significant policy debate, the empirical extent of the divergence between structural and market-based indicators has rarely been systematically documented. The evidence developed here suggests that, in several Member States, the effective carbon-cost pass-through embedded in wholesale electricity prices may be materially lower than the maximum structural CO₂ factors used to define the compensation envelope. This finding has direct implications for the consistency of compensation schemes within the EU: a mechanism originally designed to mitigate distortions associated with carbon-leakage risks could, under certain conditions, contribute to new forms of asymmetry if standardised structural parameters progressively diverge from observed market-based pass-through dynamics as electricity systems decarbonise.
Thus, the role of the ETS in the power sector should be assessed by distinguishing between different transmission channels. The ETS may operate simultaneously as a carbon-cost internalisation mechanism for fossil generation, as a wholesale electricity-price transmission mechanism, and as an implicit revenue-transfer mechanism generating persistent inframarginal revenues for low-carbon generation technologies not directly exposed to equivalent carbon costs. The coexistence of explicit renewable-support mechanisms financed by public resources and persistent ETS-related inframarginal revenues may generate cumulative remuneration effects that are not fully captured in conventional assessments of ETS effectiveness and renewable-support efficiency. The growing development of long-term contractual arrangements, together with the broader evolution of the European electricity-market design framework under Regulation (EU) 2024/1747, reflects this structural transition toward a more differentiated relationship between short-term electricity-price formation and long-term low-carbon investment remuneration [9].
5.1. Policy Implications
The evidence developed here has direct implications for the design of the EU ETS in the power sector during the next reform cycle. The econometric finding that public support mechanisms emerge as a robust driver of renewable-capacity expansion, while the EUA price does not exhibit an independent effect on installed renewable capacity over 2013-2024, indicates that carbon pricing alone is not sufficient to steer investment decisions and that subsidies, long-term contracts and regulatory stability remain essential to support project bankability.
The survey evidence further supports the econometric results by showing that investors and energy utilities perceive public subsidies, long-term support schemes, and regulatory stability as the main drivers of renewable energy investments. At the same time, the ETS carbon-price signal is considered comparatively less influential. In particular, respondents consistently assign higher importance to direct support mechanisms than to the EUA price itself.
With regards to the inframarginal analysis, the complementary finding that ETS-related inframarginal rents accruing to non-fossil generation are substantial and structurally persistent indicates that the ETS operates predominantly through a price-formation and revenue-redistribution channel rather than as a primary investment-orienting mechanism. The coexistence of explicit renewable-support schemes financed through public resources and persistent ETS-related inframarginal revenues calls for a more explicit assessment of cumulative remuneration effects, in line with the broader evolution of the European electricity-market design framework under Regulation (EU) 2024/1747, which progressively encourages long-term contractual arrangements such as Contracts for Difference and Power Purchase Agreements as instruments capable of stabilising investor revenues without relying solely on short-term wholesale-price signals. The substantial divergence between the regulatory CO₂ factors defined in Annex III of Commission Communication C/2026/196 and the observed market-based factors derived from the empirical methodology has direct implications for the design of the State aid framework for indirect ETS cost compensation. In several Member States, the effective carbon-cost pass-through embedded in wholesale electricity prices may be materially lower than the maximum structural CO₂ factors used to define the compensation envelope, which means that compensation schemes calibrated on structural averages could progressively diverge from observed market dynamics as electricity systems continue to decarbonise.
A future revision of the framework should therefore consider a more explicit anchoring of the regulatory pass-through parameters to empirical, market-based indicators, alongside the existing structural approach, to preserve the proportionality and consistency of the compensation mechanism across the EU internal market. Taken together, these implications indicate that the effectiveness of the ETS in the power sector should be assessed by distinguishing between three transmission channels — carbon-cost internalisation in fossil generation, wholesale electricity-price transmission, and implicit revenue redistribution to low-carbon technologies — and that the next phase of ETS reform should be assessed jointly with the calibration of complementary support schemes and indirect-compensation rules, recognising that the carbon-price signal transmitted to industrial and electricity consumers reflects the interaction between regulatory scarcity, electricity-market design and the broader architecture of public-support instruments.
6. Conclusions
We have assessed renewable energy deployment in Europe over the period 2013-2024 by combining econometric analysis, an international survey, and a market-based estimation of inframarginal rents over 2021-2024. We conclude that (i) public support mechanisms are the dominant driver of renewable-capacity expansion, (ii) investors consider direct incentives rather than the indirect role of EUA price, and (iii) the ETS in power markets operates through price formation and inframarginal rents, and the regulatory CO₂ factors used for indirect ETS cost compensation diverge from observed market-based pass-through indicators. Accordingly, the EU ETS currently operates more directly as a wholesale-price transmission and revenue-redistribution mechanism than as an autonomous and stable driver of renewable investment. Our policy advice is that future reform increasingly requires a more explicit assessment of the interactions among carbon pricing, electricity-market design, renewable-support schemes, and long-term investment bankability conditions.
Author Contributions
Conceptualisation, G.DF and M.B, Methodology, G.DF and M.B, ; Formal Analysis, G.DF, M.B, B.J.; Data Curation, B.J; Writing—Review & Editing, G.DF, M.B, B.J.
Funding
This research received no external funding.
Data Availability Statement
The original data presented in the study are openly available in Zotero at https://doi.org/10.5281/zenodo.20467726.
Conflicts of Interest
The authors declare no conflict of interest.
References
- Beccarello, M.; Di Foggia, G. Emissions Trading System: Bridging the Gap Between Environmental Targets and Fair Competition. Environ. Res. Commun. 2023, 5, 085009. [Google Scholar] [CrossRef]
- Convery, F.J. Origins and Development of the EU ETS. Environ. Resour. Econ. 2009, 43, 391–412. [Google Scholar] [CrossRef]
- Ellerman, A.D.; Marcantonini, C.; Zaklan, A. The European Union Emissions Trading System: Ten Years and Counting. Rev. Environ. Econ. Policy 2016, 10, 89–107. [Google Scholar] [CrossRef]
- Kostakis, I. An Empirical Investigation of the Nexus Among Renewable Energy, Financial Openness, Economic Growth, and Environmental Degradation in Selected ASEAN Economies. J. Environ. Manag. 2024, 354, 120398. [Google Scholar] [CrossRef] [PubMed]
- Sorrell, S. Carbon Trading in the Policy Mix. Oxf. Rev. Econ. Policy 2003, 19, 420–437. [Google Scholar] [CrossRef]
- Newbery, D. Evaluating the Case for Supporting Renewable Electricity. Energy Policy 2018, 120, 684–696. [Google Scholar] [CrossRef]
- Borenstein, S. The Private and Public Economics of Renewable Electricity Generation. J. Econ. Perspect. 2012, 26, 67–92. [Google Scholar] [CrossRef]
- Hu, J.; Crijns-Graus, W.; Lam, L.; Gilbert, A. Ex-Ante Evaluation of EU ETS During 20132030: EU-Internal Abatement. Energy Policy 2015, 77, 152–163. [Google Scholar] [CrossRef]
- Rastegar, H.; Eweje, G.; Sajjad, A. The Impact of Environmental Policy on Renewable Energy Innovation: A Systematic Literature Review and Research Directions. Sustain. Dev. 2024, 32, 3859–3876. [Google Scholar] [CrossRef]
- Lin, B.; Jia, Z. Is Emission Trading Scheme an Opportunity for Renewable Energy in China? A Perspective of ETS Revenue Redistributions. Appl. Energy 2020, 263, 114605. [Google Scholar] [CrossRef]
- Liu, W.; Shen, Y.; Razzaq, A. How Renewable Energy Investment, Environmental Regulations, and Financial Development Derive Renewable Energy Transition: Evidence from G7 Countries. Renew. Energy 2023, 206, 1188–1197. [Google Scholar] [CrossRef]
- Kilinc-Ata, N.; Dolmatov, I.A. Which Factors Influence the Decisions of Renewable Energy Investors? Empirical Evidence from OECD and BRICS Countries. Environ. Sci. Pollut. Res. 2022, 30, 1720–1736. [Google Scholar] [CrossRef] [PubMed]
- del Río González, P. The Interaction Between Emissions Trading and Renewable Electricity Support Schemes. An Overview of the Literature. Mitig. Adapt. Strateg. Glob. Change 2006, 12, 1363–1390. [Google Scholar] [CrossRef]
- Flachsland, C.; Pahle, M.; Burtraw, D.; Edenhofer, O.; Elkerbout, M.; Fischer, C.; Tietjen, O.; Zetterberg, L. How to Avoid History Repeating Itself: The Case for an EU Emissions Trading System (EU ETS) Price Floor Revisited. Clim. Policy 2019, 20, 133–142. [Google Scholar] [CrossRef]
- Pahle, M.; Burtraw, D.; Flachsland, C.; Kelsey, N.; Biber, E.; Meckling, J.; Edenhofer, O.; Zysman, J. Sequencing to Ratchet up Climate Policy Stringency. Nat. Clim. Change 2018, 8, 861–867. [Google Scholar] [CrossRef]
- Bayer, P.; Aklin, M. The European Union Emissions Trading System Reduced CO 2 Emissions Despite Low Prices. Proc. Natl. Acad. Sci. 2020, 117, 8804–8812. [Google Scholar] [CrossRef] [PubMed]
- Lecuyer, O.; Quirion, P. Interaction Between CO2 Emissions Trading and Renewable Energy Subsidies Under Uncertainty: Feed-in Tariffs as a Safety Net Against over-Allocation. Clim. Policy 2019, 19, 1002–1018. [Google Scholar] [CrossRef]
- Wang, Y.; Cui, X.; Bu, W.; Li, L. How to Design Renewable Energy Support Policies with Imperfect Carbon Pricing? Front. Environ. Sci. 2022, 10. [Google Scholar] [CrossRef]
- Moroz, A.; Lyeonov, S. Stimulating Financial-Fiscal Instruments of Supporting Development of Renewable Energy Sources: Bibliometric Analysis. Financ. Mark. Inst. Risks 2024, 8, 179–203. [Google Scholar] [CrossRef]
- Podolchuk, D. Exploring the Relationship Between the EU Emissions Trading System and Renewable Energy Development in the EU. Int. Sci. J. Manag. Econ. Financ. 2023, 2, 1–12. [Google Scholar] [CrossRef]
- Koch, N.; Fuss, S.; Grosjean, G.; Edenhofer, O. Causes of the EU ETS Price Drop: Recession, CDM, Renewable Policies or a Bit of Everything?new Evidence. Energy Policy 2014, 73, 676–685. [Google Scholar] [CrossRef]
- Borenstein, S. The Private and Public Economics of Renewable Electricity Generation. J. Econ. Perspect. 2012, 26, 67–92. [Google Scholar] [CrossRef]
- Li, B. The Role of Financial Markets in the Energy Transition: An Analysis of Investment Trends and Opportunities in Renewable Energy and Clean Technology. Environ. Sci. Pollut. Res. 2023, 30, 97948–97964. [Google Scholar] [CrossRef] [PubMed]
- Bublitz, A.; Keles, D.; Zimmermann, F.; Fraunholz, C.; Fichtner, W. A Survey on Electricity Market Design: Insights from Theory and Real-World Implementations of Capacity Remuneration Mechanisms. Energy Econ. 2019, 80, 1059–1078. [Google Scholar] [CrossRef]
- Aflaki, S.; Netessine, S. Strategic Investment in Renewable Energy Sources: The Effect of Supply Intermittency. Manuf. Serv. Oper. Manag. 2017, 19, 489–507. [Google Scholar] [CrossRef]
- Sijm, J.; Neuhoff, K.; Chen, Y. CO 2 Cost Pass-Through and Windfall Profits in the Power Sector. Clim. Policy 2006, 6, 49–72. [Google Scholar] [CrossRef]
- Keppler, J.H.; Cruciani, M. Rents in the European Power Sector Due to Carbon Trading. Energy Policy 2010, 38, 4280–4290. [Google Scholar] [CrossRef]
- Fabra, N.; Reguant, M. Pass-Through of Emissions Costs in Electricity Markets. Am. Econ. Rev. 2014, 104, 2872–2899. [Google Scholar] [CrossRef]
- Zakeri, B.; Staffell, I.; Dodds, P.E.; Grubb, M.; Ekins, P.; Jääskeläinen, J.; Cross, S.; Helin, K.; Castagneto Gissey, G. The Role of Natural Gas in Setting Electricity Prices in Europe. Energy Rep. 2023, 10, 2778–2792. [Google Scholar] [CrossRef]
- Cludius, J.; Hermann, H.; Matthes, F.Chr.; Graichen, V. The Merit Order Effect of Wind and Photovoltaic Electricity Generation in Germany 20082016: Estimation and Distributional Implications. Energy Econ. 2014, 44, 302–313. [Google Scholar] [CrossRef]
- Blume-Werry, E.; Faber, T.; Hirth, L.; Huber, C.; Everts, M. Eyes on the Price: Which Power Generation Technologies Set the Market Price? Econ. Energy Environ. Policy 2021, 10. [Google Scholar] [CrossRef]
- Duttilo, P.; Lisi, F. Carbon Cost Pass-Through Rate in Power System: Evidence from Italy Under the EU ETS. 2026. [Google Scholar] [CrossRef]
- Downward, P.; Mearman, A. Retroduction as Mixed-Methods Triangulation in Economic Research: Reorienting Economics into Social Science. Camb. J. Econ. 2006, 31, 77–99. [Google Scholar] [CrossRef]
- Erzberger, C.; Prein, G. Triangulation: Validity and Empirically-Based Hypothesis Construction. Qual. Quant. 1997, 31, 141–154. [Google Scholar] [CrossRef]
- Richter, N.F.; Tudoran, A.A. Elevating Theoretical Insight and Predictive Accuracy in Business Research: Combining PLS-SEM and Selected Machine Learning Algorithms. J. Bus. Res. 2024, 173, 114453. [Google Scholar] [CrossRef]
- Nielsen, B.B.; Welch, C.; Chidlow, A.; Miller, S.R.; Aguzzoli, R.; Gardner, E.; Karafyllia, M.; Pegoraro, D. Fifty Years of Methodological Trends in JIBS: Why Future IB Research Needs More Triangulation. J. Int. Bus. Stud. 2020, 51, 1478–1499. [Google Scholar] [CrossRef]
- Farquhar, J.; Michels, N.; Robson, J. Triangulation in Industrial Qualitative Case Study Research: Widening the Scope. Ind. Mark. Manag. 2020, 87, 160–170. [Google Scholar] [CrossRef]
- Özdemir, Ö.; Hobbs, B.F.; van Hout, M.; Koutstaal, P.R. Capacity Vs Energy Subsidies for Promoting Renewable Investment: Benefits and Costs for the EU Power Market. Energy Policy 2020, 137, 111166. [Google Scholar] [CrossRef]
- Martin, R.; Muûls, M.; Wagner, U.J. The Impact of the European Union Emissions Trading Scheme on Regulated Firms: What Is the Evidence After Ten Years? Rev. Environ. Econ. Policy 2016, 10, 129–148. [Google Scholar] [CrossRef]
- CO2 Emissions from Fuel Combustion; OECD.
- Climate Change 2022—Mitigation of Climate Change; Intergovernmental Panel on Climate Change (IPCC); Cambridge University Press, 2023.
- European Commission. Joint Research Centre. Institute for Energy and Transport. Study on the state of play of energy efficiency of heat and electricity production technologies.; Publications Office: LU, 2012. [Google Scholar]
- Bai, Y.; Okullo, S.J. Drivers and Pass-Through of the EU ETS Price: Evidence from the Power Sector. Energy Econ. 2023, 123, 106698. [Google Scholar] [CrossRef]
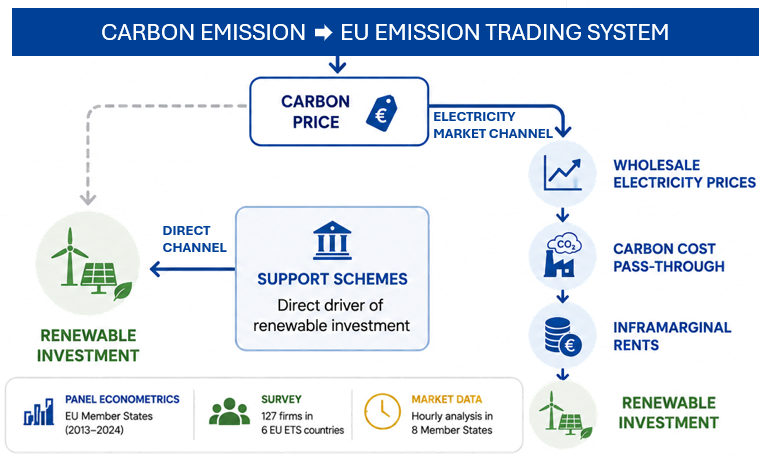
Figure 1.
Research framework. Source: the authors. The first investigates the interaction between support schemes, EUA price signals and policy overlap through panel econometric analysis. The second examines the role of investment conditions and perceived investment drivers through an international survey of firms and investors. The third analyses ETS-related inframarginal rents and electricity price formation through the identification of price-setting technologies and market-based pass-through estimation. Solid boxes denote conceptual constructs and outputs; dashed boxes denote hypotheses (H1-H3) and methods.

Figure 2.
Marginsl effects.

Figure 3.
Survey insights. Source: Authors’ elaboration based on 127 survey responses across six European countries. The survey is part of a wider research program on the effectiveness of the EU ETS.
Figure 3.
Survey insights. Source: Authors’ elaboration based on 127 survey responses across six European countries. The survey is part of a wider research program on the effectiveness of the EU ETS.


Table 1.
Descriptive statistics res.
| Variable | Description | Obs | Mean | Std. Dev. | Min | Max |
| cap | Capacity (MW) | 359 | 10,882.44 | 22,222.85 | 0.00 | 165,564 |
| esub | Support schemes | 341 | 2,425.46 | 5,930.94 | 0.00 | 50,744 |
| eua | EUA (€/t) | 360 | 31.64 | 29.66 | 4.33 | 83.66 |
| eve | Verified emissions (power sector) | 360 | 27,000 | 54,600 | 0.00 | 352,000 |
| gdp | GDP per capita | 359 | 38,145 | 30,733.24 | 5,870.00 | 185,840 |
| eua_fsh | EUA × fossil share | 348 | 2,246.21 | 2,191.22 | 117.88 | 7,168.66 |
Source: the authors.
Table 2.
Descriptive statistics of survey data.
| factor | N | Mean | SD | Min | Max |
| Capital expendit | 249 | 4.056 | 0.887 | 1 | 5 |
| EUA price | 248 | 3.931 | 0.895 | 1 | 5 |
| Natural gas pric | 253 | 4.111 | 0.866 | 1 | 5 |
| Procurement (e.g) | 253 | 4.028 | 0.852 | 1 | 5 |
| Public subsidies | 252 | 4.099 | 0.843 | 2 | 5 |
| Regulatory stabi | 251 | 4.139 | 0.805 | 2 | 5 |
Table 3.
Technical parameters.
| Parameter | Value | Notes |
| Gas efficiency | 0.55 | Average CCGT conversion efficiency |
| Coal efficiency | 0.38 | Average coal plant conversion efficiency |
| Gas emission factor | 0.37 tCO₂/MWh | CO₂ intensity per MWh of electricity generated |
| Coal emission factor | 0.90 tCO₂/MWh | CO₂ intensity per MWh of electricity generated |
| Residual threshold | 0.20 | Residual load / total load threshold |
In residual threshold the residual-load threshold is introduced as a prudential operational assumption aimed at excluding hours characterised by very low residual demand conditions, where standard merit-order dynamics may be less representative of actual price formation mechanisms.
Table 4.
Descriptive statics maarginal price.
| Variable | Obs | Mean | Std. dev. | Min | Max |
| Gas share | 32 | 0.449 | 0.234 | 0.001 | 0.875 |
| Coal share | 32 | 0.060 | 0.088 | 0.000 | 0.293 |
| Other share | 32 | 0.491 | 0.252 | 0.041 | 0.999 |
| Gas Hours | 32 | 3937.750 | 2049.529 | 12.000 | 7689 |
| Coal Hours | 32 | 526.406 | 768.819 | 0.000 | 2566 |
| Other Hours | 32 | 4301.844 | 2212.024 | 363.000 | 8748 |
| Observed Factor | 32 | 0.220 | 0.119 | 0.001 | 0.437 |
Table 5.
Regression analysis of drivers of renewable capacity development.
| Renewable development | M1 | M2 | M3 |
| Public subsidies | 0.284** | 0.414 | 0.258** |
| (0.125) | (0.257) | (0.122) | |
| EUA | 0.767 | 0.611 | |
| (0.985) | (0.999) | ||
| EUA × fossil share | -0.053* | -0.046 | |
| (0.030) | (0.029) | ||
| ln_energy_VE | -0.037 | -0.001 | 0.002 |
| (0.042) | (0.032) | (0.031) | |
| ln_GDP | 0.118 | 0.357 | 0.286 |
| (0.340) | (0.375) | (0.359) | |
| L.ln_euarel | -0.166 | ||
| (0.700) | |||
| L.ln_efsub × L.ln_euarel | -0.041 | ||
| (0.031) | |||
| Constant | 5.336 | 4.617 | 3.337 |
| (3.620) | (4.652) | (3.597) | |
| Observations | 306 | 295 | 295 |
| R-squared | 0.805 | 0.812 | 0.813 |
| Country FE / Year FE / Clustered SE | Yes | Yes | Yes |
Source: Authors’ elaboration. Robust standard errors in parentheses. *** p<0.01, ** p<0.05, * p<0.1. M1: EUA price, EU27; M2: relative EUA price (EUA × fossil share); M3: EU27 + NO. All values in log.
Table 6.
Estimated ETS-related inframarginal rents by country and year (€b, 2021-2024).
| Country | 2021 | 2022 | 2023 | 2024 |
| Italy | 1.66 | 2.47 | 2.28 | 2.10 |
| Spain | 1.99 | 2.14 | 1.43 | 0.96 |
| France | 1.71 | 3.29 | 1.78 | 0.86 |
| Belgium | 0.19 | 0.38 | 0.24 | 0.13 |
| Germany | 2.46 | 5.76 | 2.27 | 1.48 |
| Poland | 0.77 | 1.64 | 1.28 | 0.88 |
| Netherlands | 0.44 | 0.89 | 0.53 | 0.40 |
Source: Authors’ elaboration based on hourly ENTSO-E data, FactSet fuel prices (TTF gas and international coal benchmarks) and EEX EUA prices.
Table 7.
Comparison between EU CO₂ factors and observed market-based factors (2021-2024).
| Country | EU CO₂ factor (tCO₂/MWh) | Observed market-based factor | Reg./obs. ratio |
| Italy | 0.44 | 0.36 | 1.2× |
| France | 0.43 | 0.23 | 1.9× |
| Spain | 0.47 | 0.21 | 2.2× |
| Germany | 0.73 | 0.25 | 2.9× |
| Belgium | 0.37 | 0.17 | 2.2× |
| Netherlands | 0.44 | 0.27 | 1.6× |
| Poland | 0.78 | 0.27 | 2.9× |
| Sweden | 0.60 | 0.01 | 46.2× |
Source: Authors’ elaboration based on hourly ENTSO-E data, FactSet fuel prices, EEX EUA prices, and Annex III of Commission Communication C/2026/196.
Disclaimer/Publisher’s Note: The statements, opinions and data contained in all publications are solely those of the individual author(s) and contributor(s) and not of MDPI and/or the editor(s). MDPI and/or the editor(s) disclaim responsibility for any injury to people or property resulting from any ideas, methods, instructions or products referred to in the content. |
© 2026 by the authors. Licensee MDPI, Basel, Switzerland. This article is an open access article distributed under the terms and conditions of the Creative Commons Attribution (CC BY) license (http://creativecommons.org/licenses/by/4.0/).
Copyright: This open access article is published under a Creative Commons CC BY 4.0 license, which permit the free download, distribution, and reuse, provided that the author and preprint are cited in any reuse.


