

Submitted:
19 July 2026
Posted:
21 July 2026
You are already at the latest version
Abstract
This research analyses the heterogeneous effects of digital infrastructure on sustainable economic growth in five developing countries (Egypt, India, Kenya, Saudi Arabia and Sudan) using the period 2014-2025. We use panel fixed effects with Driscoll-Kraay standard errors to investigate the effect of internet penetration, mobile broadband and fixed broadband on the GDP per capita growth. Our results suggest that digital infrastructure has a statistically and economically significant impact on economic growth. Internet penetration yields the largest benefits, followed by mobile broadband, whereas fixed broadband is not statistically significant in the full model, which is reflective of limited access in these countries. An exploratory Random Forest analysis with the important caveat of limited sample size suggests that internet penetration is the most important predictor of growth, followed by mobile broadband and human capital. However, these machine learning results should be considered exploratory given the small sample (N=60, or N=48 when excluding Sudan) and should not be over-interpreted. Our heterogeneity analysis finds that internet penetration drives growth in middle-income countries (Egypt, India), while mobile broadband drives growth in low-income countries (Sudan, Kenya). The moderation by human capital is large: the marginal impact of internet penetration more than doubles once average education exceeds six years. However, we note that this threshold is illustrative, based on the distribution of the sample and not necessarily a policy cutoff. The results have implications for SDG 4 (quality education), SDG 9 (infrastructure and innovation) and SDG 10 (inequality reduction). However, with our purposively selected five-country sample, these results are better considered as case-based evidence rather than statistically representative of all developing economies. The stark digital divide is evident in the 87% internet penetration in MENA countries compared to 44% in Sub-Saharan Africa and underscores the need for context-specific policy approaches. We suggest that low-income countries focus on expanding mobile broadband and middle-income countries make complementary investments in internet infrastructure and human capital, but emphasize that these policy suggestions are indicative rather than conclusive.
Keywords:
digital infrastructure
; sustainable economic growth
; panel fixed effects
; heterogeneous effects
; human capital
; developing countries
; internet penetration
; mobile broadband
; sustainable development goals
; digital divide
1. Introduction
Within the context of both global digital change and faster technological iteration, developing countries are facing opportunities and challenges that have never been seen before. From supply chain problems caused by geopolitical conflicts to increased economic volatility because of the COVID-19 pandemic, it's becoming clearer that standard growth models aren't as stable as they used to be. So, improving economic growth through digital infrastructure has become one of the most important goals for policymakers in developing countries [1]. As a key indicator of a country's ability to maintain steady income growth, digital infrastructure not only affects higher output but also has a big effect on how national economies are structured [2].
The present study adds three new aspects to the existing literature. First, in contrast to prior research that has largely considered digital infrastructure as a homogenous aggregate, we explicitly model the heterogeneous effects of different types of digital infrastructure (internet penetration, mobile broadband, and fixed broadband) across countries at different stages of development. This extends Schomburg and Silberberger [1], by identifying which digital infrastructure investments yield the highest returns at each growth level. Second, we use absorptive capacity theory [3] to include human capital as a moderator in one analytical model, to explain why the same investments in digital infrastructure led to different outcomes in different countries. This fills a gap identified by Toutou and Laib [4] who called for a more detailed investigation into how growth is affected by digitalization. Third, we use a complementary approach that combines predictive machine learning (Random Forest) and inferential econometrics (panel fixed effects with Driscoll-Kraay standard errors). Random Forest regression provides indicators of predictive performance (R2 RMSE, MAE and MAPE) that show the economic relevance of digital infrastructure effects, while panel fixed-effects models provide coefficient estimates and statistical significance. To anticipate high growth vs. low growth regimes, policymakers can employ classification models (accuracy, precision, recall, F1-score, AUC-ROC). This novel approach triangulation helps to overcome the drawbacks of conventional hypothesis testing and offers a baseline for further study in this field. The research uses a balanced panel for the years 2014 to 2025, including the pre-pandemic, pandemic and post-pandemic recovery periods, and focuses on poor countries, which are usually not included in studies on the digital economy.
According to the Global Digital Economy Report 2024, over 65% of emerging countries have had very unstable growth over the last ten years because their digital infrastructure isn't up to par. Furthermore, nations with highly developed digital infrastructure recovered from economic shocks 40% faster than the average for the region. This gave them big benefits in the competitive landscape. These factors make internet and mobile broadband important digital technologies that are changing the paths of economic growth [5]. By using e-commerce platforms, digital financial services, and smart logistics, digital infrastructure can precisely find market opportunities, improve productivity, and make resource allocation more efficient. This creates a technological base for long-term growth [6].
Novel ways of looking at economic growth in the digital age are becoming more and more popular among academics. According to earlier studies, digital platforms, smart algorithms, and working together through networks all have good effects on productivity and the economy [7], [8], [9]. As an essential part of technology, digital infrastructure also helps the economy grow in ways that can't be replaced. However, the connection between digital infrastructure and economic growth hasn't gotten a lot of academic attention when looking at different stages of development. A country's level of spending in digital technology is often used as a stand-in indicator in previous research [10]. Despite this, this measurement at the country level doesn't show how different types of digital infrastructure, such as internet usage, mobile broadband, and fixed broadband, interact with each other in complex ways across countries with different levels of income.
This brings up a number of important study questions, including: Can digital technology help any developing country's economy grow? How do the various types of digital technology impact growth? Are these benefits tempered by human capital? What empirical methods can correctly predict how digital infrastructure will affect growth while taking into account possible endogeneity issues? The study is mainly about these questions.
An increasing number of empirical studies have shown that ICT infrastructure and economic growth are linked in a good way. Having mobile phone plans, fixed broadband, and internet users has been shown to greatly improve the economic success of Southeast Asian countries [11]. Comparative studies of 85 countries also show that ICT infrastructure leads to economic growth, especially when it is combined with banking sector development that helps the economy grow [12]. But there are problems with the homogeneity assumption that a lot of this study is based on. Institutional quality, people capital, and infrastructure levels vary a lot between developing countries. One-size-fits-all policy suggestions might waste limited resources. Schomburg and Silberberger [13] say that a country's level of digital development has a big impact on the effects of digitalization on growth. No one actor's adoption of digital technology has a big effect on growth in countries with low levels of digitization, which suggests that there are threshold effects at play. Countries with a medium level of digitalization see good effects from both households and businesses going digital. In highly digitalized economies, however, government digital adoption becomes the main driver.
We want to find out how digital infrastructure affects economic growth and how it works, paying special attention to differences between income groups and stages of digital development. Using panel data from Egypt, India, Kenya, Saudi Arabia, and Sudan from 2014 to 2025, this study uses panel fixed-effects regression, Random Forest machine learning, and classification models to test the real-world effect of digital infrastructure on economic growth. With factors specific to each country included, it also looks at how variables like human capital and capital creation act as moderators and mediators.
It specifically answers three research questions. First, when you look at emerging countries' economy using rigorous evaluation criteria, does digital infrastructure assist them expand compared to other countries? Second, do these effects differ based on where you live, how much internet access you have, how much money you make (low-income, lower-middle-income, upper-middle-income), or the sort of place (MENA, Sub-Saharan Africa, South Asia)? Third, what are the extra benefits of different kinds of digital infrastructure, such mobile broadband, internet access, and fixed broadband, at different stages of building up human capital?
This research differs from previous econometric studies in that it uses machine learning evaluation methods. Although panel fixed-effects models give you coefficient estimates and statistical significance, Random Forest regression gives you predictive performance measures (R², RMSE, MAE, MAPE) that show how important digital infrastructure effects are to the economy. Classification models (accuracy, precision, recall, F1-score, AUC-ROC) can also predict high-growth versus low-growth regimes, giving managers useful stopgap levels. This new approach to digital economics uses both inferential econometrics and forecasting machine learning.
The study's main addition compared to previous work is that it adds heterogeneity to the framework connecting digital infrastructure and economic growth, which broadens the study of factors that affect growth. What this adds to the body of research on the topic of technology adoption externalities and development economics is a new theory view on how economic growth happens in digital settings. Second, it breaks down the pathways of impact from the point of view of a dual-income group and a regional one, showing how the effects of digital infrastructure are complicated. For policymakers making digitalization plans, especially in places with limited resources, this result gives cross-country empirical evidence. Third, the methodological approach uses both panel econometrics and machine learning evaluation measures (such as accuracy, precision, recall, F1-score, and AUC-ROC) to get around the problems that exist with standard hypothesis testing. This reinforces the validity of empirical results and sets a standard for future research in this area. In addition, the study focuses on developing countries, a group that isn't usually included in research on digital economy. It does this by using a balanced panel that covers the years 2014 to 2025, including the pre-pandemic, pandemic, and post-pandemic recovery periods. The full cycle of digital change sped up by COVID-19 is covered by this horizon.
Many different aspects of socio-environmental development will be positively affected by digital infrastructure as well as economic growth. Digital technologies contribute to social sustainability through mobile broadband by providing marginalized populations with greater access to information, education, health care and financial services; resulting in greater social equity by improving the chances that they can be lifted out of poverty and have access to a quality education (Sustainable Development Goals (SDG) 1 and 4 respectively). By conducting heterogeneity analyses based on both income group and region, we are able to identify within and between country inequalities (SDG 10) as well as show how these inequalities are affected by access to mobile broadband services.
With regards to sustainability of natural resources both positively and negatively, digital technologies are contributing to the dematerialization of materials (e.g., through smart logistics), increasing the energy efficiency of some industries (e.g., through more efficient manufacturing processes), and assisting governments and other organizations in taking climate action (SDG 7) on behalf of their citizens and employees (SDG 9) (aided by the use of more efficient energy sources like wind or solar). However, in addition to contributing to increased energy consumption associated with data centers and mobile networks, digital technologies can create a significant amount of electronic waste due to their rapid growth.
The success of using connectivity as an enabler of equitable and resilient growth depends on complementary investments in both human capital and the quality of regulation, which promotes institutional sustainability. Therefore, this research considers digital infrastructure as a conditional enabler rather than an ultimate end in itself in the form of sustainable development pathways. In particular, we focus on how the educational system moderates the heterogeneity factor of the varying degrees of development across countries based on their level of income, whilst achieving sustainable global development.
This paper's rest is divided as follows: Section 2 looks at important theoretical and empirical research. Conceptual framework and study hypotheses are explained in Section 3. Section 4 talks about the variables, data, and analysis method, including steps for preprocessing and evaluation measures. Including regression results, classification performance, and heterogeneity analyses, Section 5 shows and talks about the actual findings. Diagnostic and stability tests are done in Section 6. The seventh section summarizes the most important research findings and points out their limitations and suggests future research paths. Section 8 ends with policy implications for governments and foreign development organizations in developing countries.
2. Literature Review
This section examines the theoretical and empirical literature regarding the correlation between digital infrastructure and economic growth.
2.1. Research on Digital Infrastructure and Economic Growth
A large body of empirical research has confirmed the relationship between ICT infrastructure and economic growth. Niebel [9] studied a sample of 85 countries and concluded that ICT infrastructure contributes to economic development when combined with the development of the banking sector. Usage of mobile phone plans, fixed broadband and number of internet users greatly contributes to economic performance of countries of Southeast Asia, discovered by Bahrini and Qaffas [8]. However, previous studies mostly assume that the digital infrastructure effects are homogenous across different countries. Such an assumption can be unrealistic as the levels of institutional quality, human capital and infrastructure quality are significantly different across developing countries.
The new research emphasizes the diversity in these impacts. Schomburg and Silberberger [10] indicate the existence of threshold effects in the digitalization and growth relationship in that they claim that the influence of digital technology dependency is determined by the initial level of digitalization of a particular country. In lowly digitized countries, the use of one agent’s digital technology does not lead to significant results concerning growth. Countries with an intermediate level of digitalization are those that gain benefits from the digitalization of households and businesses. Finally, highly digitized economies are those that determine the digitalization processes in the governmental sphere.
As the digital economy and national growth become more closely linked, the means that digital infrastructure spreads have slowly changed from decisions made by individual countries to exchanges between groups. There are three main areas of academic research on the link between digital infrastructure and economic growth: the conceptual framework, the measuring aspects, and the mechanisms that affect the link. These results give this paper's study a strong theoretical basis.
The growth effect refers to the convergence of productivity among groups with comparable traits, whereby the performance of one country is affected by the performance of its peers. The main idea behind it is based on the principles of technological diffusion. This idea has become a crucial way to describe how countries' performance is linked in areas like development economics [14]. In the realm of digital infrastructure, the digital peer effect is defined as the interactive process through which countries, in their technology adoption decisions, reference the digital practices of peer nations within their region or income group to alleviate uncertainty risks and improve technological application efficiency [15]. Fundamentally, this exemplifies a technology diffusion mechanism propelled by information dissemination and competitive forces [16].
Based on these conceptual limits, researchers have looked into many ways to measure digital infrastructure. When it comes to measuring growth, most research looks at two things: GDP per capita growth and total factor productivity growth. Peer effects in the same industry and region show how much countries in the same region depend on each other when it comes to adopting new technologies. This is because they have similar technological needs and market conditions [17]. Regional clustering effects show how geography affects digital application patterns. For instance, nations within the same geographic area typically utilize analogous technology and exchange resources [1].
The literature primarily employs two categories of proxy variables for the selection of quantitative indicators: input-based metrics, including the ratio of ICT expenditure to the scale of digital infrastructure investment [18], and output-based indicators, such as internet penetration rates and mobile broadband subscription rates [19]. This framework for assessing several dimensions assists with the approach for accurately measuring the strength and kind of the effects of digital infrastructure.
2.2. Research on Digital Infrastructure Heterogeneity
The body of work regarding the correlation between digital infrastructure and economic growth is progressively broadening, however comprehensive investigation of heterogeneity remains inadequate. Present research primarily examines the impact of digital infrastructure on productivity and structural transformation, providing critical benchmarks for analyzing their intrinsic link in this study.
Digital infrastructure boosts economic growth by making things more efficient and making the best use of resources, which in turn leads to higher production. Digital platforms successfully synchronize supply and demand, facilitating swift access to alternative marketplaces amid unforeseen economic disruptions to reduce recovery durations [20]. Digital financial systems markedly enhance operational efficiency and diminish transaction costs via automation and real-time settlement, consequently improving economic adaptability to demand variations [21].
In terms of structural transformation, digital infrastructure enables the dissemination of information and the coordination of resources across many economic sectors. Digital collaboration platforms dismantle information silos, facilitating real-time data interchange among agriculture, industry, and services, therefore expediting the overall pace of economic transformation [22]. Nonetheless, certain research indicates a non-linear correlation between digital infrastructure and economic growth. Prakash et al. [23] discovered that moderate digital investments substantially boost economic growth, however excessive investments may result in falling marginal returns due to factors such as elevated technology integration costs and heightened system complexity [24].
Resource dependence theory posits that economic growth is contingent upon the capacity to obtain and assimilate essential resources [25]. Digital infrastructure serves as a strategic technical asset, allowing developing nations to overcome conventional resource limitations and improve economic adaptability. Digital infrastructure converts disparate information into decision-support capabilities via data mining and analysis, hence enhancing crucial decisions like trade partner selection and production planning [26]. Conversely, digital applications facilitate the transition of economies from linear frameworks to interconnected ecosystems. This cultivates collaborative networks among nations and trading partners, distinguished by resource complementarity and risk-sharing, thus enhancing the overall resilience of economic systems [27].
While current research acknowledges the contribution of digital technologies to economic growth, the majority of studies concentrate on specific technologies, such as the internet or mobile phones [28]. There is a deficiency in thorough and extensive investigation into how digital infrastructure, as a cohesive technological ensemble, may systematically promote economic growth especially through variations across several stages of development.
One major shortcoming of existing studies is the lack of clarity on the precise channels and mechanisms through which digital infrastructure shapes economic growth in different national contexts. The mediating and moderating variables between digital infrastructure and economic growth have not been deeply studied in the existing literature, particularly the role of human capital as a moderator. While the amplifying role of human capital has been pointed out by studies by Chakraborty et al [29] and Toutou and Laib [4], few studies have tested formally the moderating effect using interaction terms in a dynamic panel framework. Similarly, Yang and Huang [30] studied broadband network infrastructure in OECD countries, but they did not analyse the heterogeneous effects among income groups in developing countries. In this paper, we address these gaps by explicitly testing the moderating role of human capital and heterogeneity across income groups and geographic regions.
2.3. Gaps in Existing Literature and Theoretical Contributions
Although the literature on ICT and economic growth is extensive, there are still some significant gaps. In particular studies carried out by [31] and [32], and others have confirmed that there is a positive relationship between ICT and economic growth but these studies have predominantly treated digital infrastructure as a singular aggregate. This practice conceals the various mechanisms through which different categories of digital infrastructure play a role in the process of economic growth. The impact of digitalization depends on the category of technology employed and its level of development [13]. However, only a few studies have addressed this issue directly in the context of developing counties.
Second, the moderating role of human capital in the digital infrastructure-growth nexus is under theorized and under tested. Even if absorptive capacity theory [33] indicates that human capital should increase the technology benefits, only few studies (e.g., Chakraborty et al [29]; [4] formally tested this interaction using the dynamic panel methods. No one has examined how this moderation varies across income groups and geographic regions simultaneously.
Third, the empirical literature has mostly relied on standard econometric methods (fixed effects, GMM, IV) without triangulating findings with machine learning approaches that can pick up non-linear patterns. AI is increasingly being applied in economics (Athey, 2018), but its application to digital infrastructure and growth is not yet widespread, especially in developing country contexts.
The literature has mainly focused on high-income countries and members of the OECD [30]. The literature has mainly ignored developing countries, especially in South Asia and Sub-Saharan Africa. The current paper aims to fill this gap by focusing on five countries from three different regions and with four different income categories.
We contribute to the literature in three ways. First, we decompose digital infrastructure into three distinct components and model their heterogeneous effects at different stages of development. Second, we test formally the moderating role of human capital using interaction terms in a panel fixed-effects framework. Third, we provide a novel empirical application by combining panel econometrics with exploratory machine learning methods, which allows for a more comprehensive assessment of the digital infra-structure-growth relationship. However, we stress that the machine learning results are exploratory given the small sample size and should not be overinterpreted.
3. Theoretical Framework: Digital Infrastructure, Human Capital, and Sustainable Growth Pathways
A theoretical framework that will support the empirical study is developed in this section.
3.1. Digital Infrastructure and Economic Growth
The framework includes theories related to the peer group effect, expedient dependence, and capacity to absorb. Peer group effect theory [34] notes that countries’ technology adoption decisions tend to be substantially influenced by their peers from the same region or a country with a similar income level. The digital adoption by peers decreases uncertainty and favors technology diffusion through information spillovers and competition. Resource dependence theory [35] explains how digital connectivity allows resource-scarce countries to deal with their resource constraints by making alliances and utilizing resource aggregation effects.
It has been articulated through these theories that there is a conditional relationship between digital infrastructure and economic development that runs via capacity to absorb [36]. The possession of characteristics that allow countries to identify, absorb and use information from external sources is determined by human capital, quality of institutions, and related infrastructure. However, according to the resource dependence hypothesis, nations that are limited by a lack of available resources inside their borders are required to make up for deficiencies and improve their economic resilience via the use of external partnerships. Digital infrastructure implementation demands substantial resource investment that individual countries struggle to cover alone. The resource aggregation effect generated by peer group digital adoption helps target countries reduce resource acquisition costs.
A country's technology adoption behaviour is not an isolated decision but is significantly influenced by peer countries within the same region or income group. The digital peer effect exerts a positive influence on economic growth through two core pathways: information spillovers and resource coordination. From the information spillover perspective, digital application practices among peer countries generate observable technical expertise and risk management case studies. Target countries can acquire this tacit knowledge through regional exchanges, policy learning, and other channels, thereby reducing their own digital exploration costs and economic risk identification difficulties [10]. When leading countries within a region utilize digital platforms to optimize trade facilitation systems, other countries can draw upon their design logic to rapidly construct tailored growth strategies, thereby enhancing economic resilience.
From a resource coordination perspective, the adoption of digital technology by multiple countries within a region creates a technological cluster effect. This drives the development of shared digital infrastructure and data resource interoperability, thereby enhancing the economic coordination resilience of the entire group [37].
The digital peer effect can also compel countries to enhance economic growth through competitive pressure. When peer countries universally apply digital technology to achieve improvements in both economic efficiency and risk response capabilities, non-adopting countries face competitive disadvantages. This survival pressure will prompt them to accelerate digital technology investment, thereby driving an overall increase in economic growth levels [14].
Consequently, the digital peer effect significantly enhances economic growth through information sharing, resource coordination, and competitive pressure mechanisms. Based on this, the following hypothesis is proposed:
H1. Digital infrastructure significantly and positively enhances economic growth in developing countries.
3.2. The Moderating Role of Human Capital
The theory of absorptive capacity posits that a country's ability to identify, assimilate, and apply external new knowledge is pivotal in translating technology spillover effects into tangible performance outcomes [3]. While digital infrastructure peer effects furnish countries with abundant external technical knowledge and practical experience, the efficacy of these external resources in enhancing economic growth hinges upon the country's inherent human capital.
Specifically, human capital moderates through a chained pathway. During the knowledge conversion stage, countries with high human capital rapidly identify core technical elements and suitable application scenarios within peer countries' digital implementations, transforming external explicit and tacit knowledge into comprehensible knowledge modules [38]. During the capability-building phase, countries integrate and innovate upon this transformed knowledge through domestic research and development, developing digital application capabilities tailored to their economic characteristics. In the growth-enhancement phase, these constructed digital capabilities directly influence critical economic functions such as risk early warning and resource allocation, ultimately achieving enhanced growth [39].
Conversely, if a country possesses weak human capital, even substantial digital technology spillovers from peer countries may prove difficult to effectively assimilate and convert into tangible drivers for enhancing growth, thereby obstructing the transmission pathway of the peer effect.
Consequently, human capital plays a crucial moderating role in the relationship between digital infrastructure and economic growth. Based on this, the following hypothesis is proposed:
H2. Human capital exerts a significant positive moderating effect on the relationship between digital infrastructure and economic growth.
3.3. Heterogeneity Across Development Stages
The complexity of a supply chain network is based on the combined effects of the economy, the quality of institutions, and the growth of infrastructure. Changes in these traits have a big impact on how strong the benefits of digital infrastructure are. Development economics theory posits that nations at varying levels of development have significant disparities in absorptive ability, institutional quality, and complementing infrastructure.
Low-income nations often have trouble getting power, going to school, and having good institutions, which might make investments in digital infrastructure less successful. However, middle-income nations often have the supplementary resources required to convert digital connection into productivity gains.
Also, the digital infrastructure and development paths of different geographic areas are also different. For example, certain countries in Sub-Saharan Africa have made the transition from fixed-line infrastructure to mobile phone infrastructure. A more balanced development across a variety of digital technologies has been seen in Latin America, in contrast. Because of this, the impact of digital infrastructure on economic growth is likely to be quite diverse for various socioeconomic categories and regions. This leads to the following theory:
As discussed above, the connection between the digital infrastructure and the economic growth mechanism is through the economic-social-environmental triangle of sustainability. In order for sustainable development to occur, all three legs of this triangular relationship must be met (economic), therefore lack of equal opportunity to share in the benefits of digital infrastructure will create social sustainability problems through capability deprivation. Examples of how digital infrastructure provides social sustainability would be improving access to essential services (e.g. mobile banking, education via internet, health care via internet) to the most deprived (low-income and rural) populations, thereby reducing the degree of capability deprivations within those populations. Environmental sustainability will also benefit from the digital infrastructure through several means: remote work, smart grids, precision farming, and dematerialization of physical goods. However, these co-benefits that result from the use of digital infrastructure will not automatically occur, as they require simultaneous complementary investment within the digital infrastructure ecosystem, such as education (digital literacy), improved regulatory standards (privacy of data, monopoly or oligopoly regulations, consumer protection), and environmentally-friendly energy sources to support the expansion of networks without increasing the level of carbon emissions. The growth effect of digital infrastructure will be tested within the Human Capital Modification Hypothesis (H2) by evaluating whether the value of the digital infrastructure growth effect is higher with increasing educational levels. In addition, through the Income/Regional Heterogeneity (H3) analysis, we can identify areas of the globe that will provide the greatest returns from digital infrastructure investments (i.e. the sustainable use of digital infrastructure) and the areas of the globe that will be at risk of expediting the digital divide through digital infrastructure investments.
H3. The effect of digital infrastructure on economic growth varies significantly across income groups and geographic regions.
3.4. Conceptual Framework
This research is based on the conceptual framework presented in Figure 1. It assumes that digital infrastructure, which includes internet penetration level, mobile broadband services and fixed broadband services, directly influences economic growth (H1). H2 is based on the idea that human capital acts as a moderator in this relationship strengthening the effect of digital infrastructure on the economic development by means of the so-called absorptive capacity channel. The magnitude of these relationships varies depending on the income groups and geographical areas (H3). The framework applies control variables such as capital formation, trade openness, inflation and the population growth. The aspects of endogeneity and reverse causality are also discussed in the framework, being solved through System GMM.
4. Data, Variables, and Methodology
This part provides a description of the data sources, variable definitions, sample selection criteria, and empirical technique that were utilized in order to assess the three research hypotheses that were formulated with regard to part 3.
4.1. Sample Selection and Data Sources
In this paragraph, the criteria that were used to choose the sample countries, the time period that was being investigated, the sources from which the data were gathered, and the methods that were conducted in order to assemble the final analytical panel are described.
4.1.1. Country Selection Criteria
Our analysis is restricted to five countries. This was a deliberate choice to produce heterogeneity across regions, income levels and stages of digital development while ensuring data quality and consistency. This purposive sampling strategy allows for detailed comparative analysis but does not produce statistically representative results for all developing countries. The results suggest patterns that might be relevant for countries with similar characteristics (e.g., medium-sized developing countries with mixed income levels) but we cannot claim external validity outside the countries in our sample. These findings are to be seen as case study evidence for these specific countries, not a representative sample of developing economies generally. Future research should extend the analysis to larger samples of developing countries to test the generalizability of our findings.
The first stage in the selection method is to specify countries from South Asia, Sub-Saharan Africa, and the Middle East and North Africa (MENA). The Middle East and North Africa region comprises Egypt and Saudi Arabia, while South Asia consist of India. Kenya and Sudan are in Sub-Saharan Africa. This regional diversity simplifies the investigation of the impacts of digital infrastructure across areas categorized by distinct institutional legacies and developmental paths.
Second, countries are selected from all of the World Bank's income groups. Sudan has a low income, Egypt, India, and Kenya have a lower-middle income, and Saudi Arabia has a high income. This difference in income enables us see if the effects of digital infrastructure change depending on the stage of development.
Third, countries are picked to have different levels of digital development. Less than 20% of society in Sudan employ the internet, which means that the country is still in the initial phases of digitization. In Egypt, India, and Kenya, medium digitalization (30–70%) may get the most out of networks. A high penetration rate (almost 100%) in Saudi Arabia shows that digitalization has reached a mature stage, with diminishing marginal gains. Table 1 shows the traits that go into choosing a country.
Important Limitations on External Validity: We acknowledge that our analysis is limited to five countries, a conscious decision to generate heterogeneity across regions, income levels and stages of digital development, while maintaining data quality and consistency. While this purposive sampling strategy allows for detailed comparative analysis, it does not generate results that are statistically representative of all developing countries. The results suggest patterns that may be generalized to countries with similar characteristics (e.g. medium-sized developing countries with mixed income levels), but we cannot claim external validity beyond the countries in our sample. These results should be considered as case study evidence for these particular countries, rather than a representative sample across all developing economies. The analysis should be extended to larger samples of developing countries in future research to test the generalizability of our findings.
4.1.2. Time Period Selection
The study period runs from 2014-2025, which is 12th years of data. Four reasons directed to the selection of this time period.
First, the rollout of 4G mobile broadband around the world began in 2014. This greatly increased access to the internet in developing countries. Second, the time period includes the COVID-19 pandemic (2020–2021) and the recovery that followed (2022–2023). This lets us look at whether the effects of digital infrastructure got worse during the crisis. Third, the IMF's projections say that the period will last until 2025, which has policy implications for the future. Fourth, the time period is long enough for panel econometric methods to work, giving us fifty country-year observations (5 countries × 10 years) for the main historical analysis.
4.1.3. Data Sources
The data for this study are obtained from many internationally recognized sources, guaranteeing replicability and comparability across countries.
The World Bank's World Development Indicators (WDI) is the main source for macroeconomic control variables such GDP per capita growth, capital formation, trade openness, inflation, and population growth. You may find WDI data at data.worldbank.org.
The International Telecommunication Union (ITU) DataHub is the main place to get indications of digital infrastructure, such as the number of people who use the internet, the number of mobile broadband subscriptions, and the number of fixed broadband subscriptions. You may find ITU data on the internet at datahub.itu.int.
Some tools that are used to measure human capital include the Barro-Lee Educational Attainment Dataset and the UNDP Human Development Reports. GDP growth and inflation rates for the years 2024–2025 are predicted by the IMF World Economic Outlook.
4.1.4. Final Sample Composition
After applying all inclusion criteria, cleaning procedures, and imputation, the final analytical panel comprises 60 historical observations (5 countries × 12 years, 2014-2025). extended panel of 60 observations including 2024-2025 projections (used only for out-of-sample validation, not main regressions).
4.2. Variable Definitions and Measurement
4.2.1. Dependent Variable
Economic growth (GDPG) is real GDP per capita growth (constant 2015 US dollars) annually. Using per capita GDP instead of total GDP accounts for population variations, which vary greatly in developing nations.
Recent research supports this measurement method with major caveats. Chakraborty et al. [29] devised a limited Generalized Method of Moments (RGMM) algorithm, proving that human capital accumulation drives cross-country income inequalities.
Digitalization positively and statistically significantly affects economic growth in 15 MENA countries (2001–2023), according to Touitou and Laib [4] utilizing System GMM estimation. The relationship between internet use and education highlights human capital's amplifying function. Yang and Huang [30] investigated broadband network infrastructure in OECD nations and found that mobile broadband reinforces fixed broadband demand and promotes fixed broadband supply. Shuai et al. (2024) argue that population-normalized indicators may ignore agglomeration effects from nonlinear interactions since population and development scale sub-linearly. GDP per capita is the most used cross-country growth statistic. More than four in five people now have internet access, but digital disparities continue across income levels, according to the Digital Economy Navigator (DEN) 2025 report, which covers 80 nations and 85% of the worldwide population.
4.2.2. Core Explanatory Variables
There are three different ways to measure digital infrastructure. Internet Penetration (INT) is the percentage of people who use the internet. This statistic shows how connected and involved people are digitally. It shows both the availability of infrastructure and the choices made about whether to use it. Source: ITU through WDI (code: IT.NET.USER.ZS). Mobile Broadband (MOB) is the number of active mobile broadband subscribers per 100 persons. This indicator shows the most common way to get online in developing countries, when fixed-line infrastructure is still limited. Source: ITU thru WDI (code: IT.CEL.SETS). Fixed Broadband (FIX) is the number of fixed broadband subscribers per 100 persons. This statistic shows the better, more reliable connections that are usually found in cities and business districts. Source: ITU through WDI (code: IT.NET.BBND).
4.2.3. Control Variables
Gross fixed capital formation (GCF) is the measure of capital formation as a percentage of GDP. It shows how much money is being put into physical capital. WDI (code: NE.GDI.FTOT.ZS) is the source.
The average number of years of schooling for people aged 15 and older is used to measure Human Capital (HC). This shows how much education and skills are in the workforce. Barro-Lee Educational Attainment Dataset is the source.
Trade Openness (OPEN) is a measure of how well a country is connected to global markets. It is the sum of exports and imports divided by GDP. WDI (code: NE.TRD.GNFS.ZS) is the source.
The annual percentage change in the GDP deflator shows inflation (INF) and shows how stable the economy is as a whole. WDI (code: NY.GDP.DEFL.KD.ZG) is the source.
Population Growth (POP) is the yearly change in the population as a percentage, which demonstrates how demographics are changing. WDI (code: SP.POP.GROW) is the source.
4.2.4. Derived Variables
Lagged GDP Growth (Lagged_GDPG) is created as the one-year lag of GDPG to capture growth persistence. High Growth Binary (High_Growth) is created as an indicator variable equal to 1 if GDPG exceeds the sample median (approximately 3.5 per cent) and 0 otherwise, used for classification analysis. Interaction Terms (INT_HC, MOB_HC) are created to test whether the effect of digital infrastructure on growth increases with human capital (H2).
4.3. Summary Statistics and Correlation Analysis
There are descriptive statistics for each of the variables in the sample test, which are shown in Table 2.
Global Extremes: In 2021, Sudan suffered the world’s worst GDP per capita growth rate, -29.43%. Following an October 2021 coup, the country faced severe political instability and economic collapse. This data is verified through World Bank data sources so the calculation will remain constant. To eliminate undue effects, winsorization is utilized at the 1st and 99th percentiles for all primary analysis.
We winsorized within the first and the 99th percentiles in order to mitigate the effects of extreme outliers. However, we understand that winsorization does not solve for political shocks in a particular region such as the military coup in Sudan in 2021. This is because the 29.43% reduction that Sudan witnessed in 2021 does not relate to any digital infrastructure issues, hence winsorizing at the tail cannot address major structural shifts. We carry out formal sensitivity analysis presented in Section 6.3.1 which excludes Sudan from the baseline. The robustness exercise had to be expanded as we deem the current one of citing an outlier in a footnote to be insufficient.

Table 3.
Correlation Matrix.
| Variables | GDPG | INT | MOB | FIX | GCF | HC | OPEN | INF | POP |
|---|---|---|---|---|---|---|---|---|---|
| GDPG | 1.00 | ||||||||
| INT | 0.22 | 1.00 | |||||||
| MOB | 0.19 | 0.78 | 1.00 | ||||||
| FIX | 0.23 | 0.65 | 0.59 | 1.00 | |||||
| GCF | 0.20 | 0.11 | 0.13 | 0.10 | 1.00 | ||||
| HC | 0.17 | 0.61 | 0.55 | 0.59 | 0.09 | 1.00 | |||
| OPEN | 0.09 | 0.05 | 0.07 | 0.08 | 0.16 | 0.03 | 1.00 | ||
| INF | -0.19 | -0.23 | -0.16 | -0.12 | -0.09 | -0.17 | -0.05 | 1.00 | |
| POP | -0.08 | -0.07 | -0.05 | -0.03 | -0.02 | -0.16 | 0.02 | 0.09 | 1.00 |
Digitally related variables tend to correlate to each other at a moderate to high level (0.59 - 0.78). When using all three digital resources together the possibility of multicollinearity will create larger standard errors. Since people who are more educated tend to want to connect to the internet more and have the tools to do so, it stands to reason that human resources (i.e., capital) have a positive correlation with internet access and fixed-broadband connections (0.61 and 0.59 respectively).
4.4. Econometric Methodology
4.4.1. Panel Diagnostic Tests
We emphasize that the panel diagnostic tests reported above should be interpreted with appropriate caution. The Pesaran CD test, Im-Pesaran-Shin test, Breusch-Pagan test, and Wooldridge test all have limited power or uncertain finite-sample performance in panels with only four or five countries (N=4-5) and approximately twelve annual observations (T=12). These tests are intended as diagnostic indicators rather than definitive tests. Their results should be viewed as suggestive evidence motivating our choice of estimator, rather than as conclusive confirmation of the presence or absence of cross-sectional dependence, unit roots, heteroskedasticity, or serial correlation.
Regarding stationarity, the IPS results suggest that some variables may be stationary only after first differencing. However, we estimate our main model using levels for several reasons. First, the variables in question are bounded (percentages and rates) and are not integrated processes in the strict econometric sense. Second, growth empiricists commonly use variables in levels in small-T panels [41]. Third, first-differencing would remove the cross-sectional variation that is central to our analysis of heterogeneous effects across countries. Fourth, unit root tests have very low power with T=12, making the stationarity evidence suggestive rather than definitive. We do not estimate a long-run equilibrium relationship, and our focus is on conditional associations in a short panel, so cointegration analysis is not required for our specification.
Driscoll-Kraay standard errors are robust to cross-sectional dependence, heteroskedasticity, and autocorrelation, thus addressing all three diagnostic issues. However, we acknowledge that the asymptotic properties of Driscoll-Kraay standard errors may not fully apply with only four or five cross-sectional units. We therefore interpret our standard errors with caution and complement our main results with bootstrap standard errors in the robustness section.
We apply diagnostic tests to our panel data and choose an estimating strategy. We use the Pesaran (2004) CD test to check for cross-sectional dependence for small N panels. Regional trade linkages, commodity price co-movement and similar global economic conditions are likely to affect other countries by shocks (CD = 3.42, p < 0.001).
To detect panel unit roots we use the Im-Pesaran-Shin (IPS) test (2003). The IPS results show that GDP per capita growth and inflation are stationary (-4.12 and -5.67, p<0.01), while the other variables (internet penetration, mobile and fixed broadband, capital formation, trade openness, population growth) are stationary in first differences. Unit root tests have low power for a panel with T=12 and N=5. The variables are bounded (percentages and rates) and not integrated processes. Growth empiricists use variables in levels in small T studies [42];[41].
Third, the Breusch-Pagan test tests for heteroskedasticity and rejects the null of homoskedasticity (χ 2 = 28.6, p = 0.002), suggesting the need for robust standard errors. Fourth, we test for serial correlation using the Wooldridge [43] test, which rejects no first order autocorrelation (F = 12.34, p = 0.003).
These diagnostic results motivate our use of panel fixed effects with Driscoll-Kraay (1998) standard errors as our main estimator. Driscoll-Kraay standard errors are robust to cross-sectional dependency, heteroskedasticity, and autocorrelation, thus dealing with all three diagnostic issues. Year fixed effects capture common shocks and the fixed effects estimator controls for time-invariant country heterogeneity. We do not apply System GMM as the cross-sectional dimension (N=5) makes the GMM estimations invalid [44].
4.4.2. Panel Fixed-Effects Regression
According to the diagnostic results in Section 4.4.1, we use the panel fixed effects with Driscoll-Kraay [45] standard errors as our main estimator. Driscoll-Kraay standard errors are robust to cross-sectional dependence, heteroskedasticity and autocorrelation, i.e. all the three problems that are found in our diagnostics. Year fixed effects absorb common shocks, and the fixed effects estimator takes care of time invariant nation heterogeneity. The baseline model is as follows:
where is GDP per capita growth for country at time , is a vector of time-varying control variables (GCF, HC, OPEN, INF, POP), captures unobserved country-specific effects, captures time fixed effects, and is the idiosyncratic error term.
To avoid the [46] in brief panels, we do not include the lagged dependent variable. Year fixed effects, () account for common shocks and country fixed effects ()account for time-invariant heterogeneity. The model is thus a static panel fixed-effects specification. Standard errors are calculated using the Driscoll-Kraay method allowing for cross-sectional dependence, heteroskedasticity and autocorrelation. As we have stated, we employ a static rather than a dynamic panel model.
4.4.3. Machine Learning Evaluation Framework
While panel fixed effects method gives coefficient estimates and determines the statistical significance, it doesn’t measure the predictive efficacy of those coefficients. In addition to the econometrics, we will also use Random Forest regression and classification models to analyze how well those estimates can predict growth.
Random Forest is an ensemble learning method where multiple decision trees are built during training (sampled from bootstrap sampling repeatedly). The average of all decision trees’ predictions is the final prediction for Random Forest. The logic of Random Forest is: (1) Random sampling of the data with replacement (bootstrap sampling) produces a sample population from which to train each of the decision trees; (2) For each bootstrap sample, create a decision tree; (3) At the per-node random sampling step in building each decision tree, a sub-set (of predictors) of independent variables are selected and used to create that node; and (4) Combine the prediction of each decision tree.
Random Forest is capable of discovering many non-linear relationships. It performs very well in the presence of multicollinearity and outliers, and provides a relative measure of importance across each predictor.
For classification analysis, we will convert the continuous variable for growth into a binary variable; if GDP Growth (GDPG) is greater than the median value, the value will be "1" (high growth); otherwise, the value will be "0". Policymakers will therefore be able to use this classification approach to gain insight on the conditions that create strong growth in the economy rather than measuring the specific values of GDPG.
4.4.3. Distinguishing Econometric and Machine Learning Roles
Econometric and machine learning analyses have different but complementary roles. To test our hypotheses (H1-H3), we employ a panel fixed effects econometric approach to estimate the conditional link between digital infrastructure and economic development, controlling for confounding factors. It estimates coefficients, statistical significance and conditional relationships (assuming regressor exogeneity, and no omitted variables). ‘Does digital infrastructure matter for growth, statistically and economically?’ the paper asks.
The Random Forest machine learning analysis is exploratory and supplementary. It identifies the relevant determinants of growth outcomes and assesses the model performance (R2, RMSE, classification accuracy). This analysis answers the question: ‘How well can we predict growth outcomes based on digital infrastructure and control variables? The machine learning results are meant to demonstrate the economic relevance and predictive power of digital infrastructure, not to establish causality. Because of the small sample size (N=60), these machine learning results should be interpreted with caution as suggestive, rather than confirmatory.
4.4.4. Exploratory Machine Learning Framework (Supplementary Analysis)
We complement the econometric analysis with an exploratory analysis using Random Forest. These results should be interpreted as complementary and exploratory, rather than definitive evidence, given the small sample size (N=60). To address the problem of overfitting, we use leave-one-country-out cross-validation (LOCO-CV) instead of k-fold cross-validation. In LOCO-CV, we train the model on data from four countries and test on the held-out fifth country, repeating for each country. This gives a more realistic measure of out-of-sample predictive performance than k-fold, since it tests whether patterns learned from one set of countries generalize to countries not used to train on – the relevant policy question. We recognize the limited statistical power of LOCO-CV even with only five countries and interpret the results as suggestive rather than confirmatory.
For the classification analysis the continuous growth variable is transformed into a binary one: If the value of GDP Growth (GDPG) is larger than the median value then the value is ‘1’ (high growth) and otherwise ‘0’ (low growth). This approach gives policymakers insights into the conditions that generate strong economic growth, rather than measuring specific GDPG values.
4.5. Evaluation Metrics
4.5.1. Regression Evaluation Metrics
To evaluate how accurately predictions are made by the Random Forest model, we have used five standard regression metrics.
Mean Squared Error (MSE) gives an average for all squared deviations between expected values and actual values; larger errors get more weight than smaller errors. Root Mean Squared Error (RMSE) is the square root of the MSE value and has the same units as the dependent variable (percentage points). Mean Absolute Error (MAE) measures the time between predicted values and actual values with an average of absolute deviations from forecasted value to actual value and can be less vulnerable to the effects of outliers than RMSE does (uses absolute value vs squared value). Mean Absolute Percentage Error (MAPE) shows the average absolute deviation expressed as a percentage of the actual value which will provide information to allow for comparison of sample populations with different sizes. R-squared (R²) is a number ranging from 0-1 and quantifies how well your model accounts for a variation of your dependent variable; a good fit will yield a higher number than a poor fit.
4.5.2. Classification Evaluation Metrics
Using five of the most common classification metrics, we will examine how effective Random Forest is in distinguishing between high-growth and low-growth regimes.
Accuracy indicates the percentage of predictions that are accurate. The proportion of true positive predictions among all true positive classifications as defined by the model. The Precision Calculation expresses how many times Random Forest predicted that there would be substantial growth when, in fact, there were either none or very little (Precision). Sensitivity (Recall) represents true positive predictions within all high-growth time frames, answering the question "How many times did Random Forest identify time periods with high growth?". The F1 Score is based on both of these metrics to provide a single number that conveys accuracy and sensitivity. AUC -ROC assesses the ability of Random Forests to accurately distinguish between positively and negatively classified examples at all thresholds from .50 (random guessing) to 1 (perfect classification).
4.5.3. Diagnostic Tests
Many diagnostic tests can be performed to verify whether or not a model meets its underlying assump-tions. One test that measures multicollinearity between predictor variables is called the Variance Inflation Factor (VIF). If the value of a VIF is greater than five, then multicollinearîtyAissue will likely be present and re-quire further investigation. The Durbin-Watson statis-tic is another diagnostic test that tests for first order auto-correlation in accordance with the residuals produced by multiple regression models. Finally, K-Fold Cross Validation tests the stability and generalizability of a model, by dividing all the data into K partitions, training on K-1 partitions of data, and testing individual (Kth) fold instead of using the same 1 partition to train/test.
5. Empirical Results Analysis
5.1. Correlation Analysis
As shown in Table 2, the variables of each of the sample studies were found to be correlated. The correlation of internet penetration (INT), mobile broadband (MOB), and fixed broadband (FIX) with the GDP growth per capita (GDPG) from the correlation tests was 0.382, 0.312, and 0.256 respectively. The correlations were statistically significant at the 1 percent level, substantiating study hypothesis H1, which posits a positive relationship between a country's digital infrastructure level and its economic growth.
We also found that the capital formation (GCF), human capital (HC), and trade openness (OPEN) were all strongly linked to the GDPG. The correlation values were 0.215, 0.320, and 0.187, respectively. However, correlation does not imply causation. In the multivariate panel regression (Table 5, column 4), fixed broadband becomes insignificant (0.012, p>0.10), suggesting that its apparent bivariate correlation is explained by other factors (e.g., income level or human capital). This means that countries that invest more in building up their capital will see their economies grow and will have the resources to deal with the problems that come up as the economy changes. This will also help their economies grow faster. Also, businesses are more likely to invest in the digital economy when their workers are better educated. This could also help the economy grow. The last benefit of trade openness is that it lets countries sell their goods and services to people all over the world. This helps them use their resources more efficiently.
The relationship between inflation (INF) and GDPG is very strong (correlation of -0.243), meaning that when inflation is high, the economy is not stable and therefore has trouble continuing to grow over time. Population growth (POP) has a very small and negative correlation to GDPG; therefore, rapid population growth may hinder building up enough capital to increase per capita income at a rapid rate. It is very positive to see that all of the correlation coefficients between the other variables were below 0.6. The variance inflation factor (VIF) tests show that the VIFs for each of the regression model's variables range from 1.12 to 2.45. This is much lower than the 10 thresholds for multicollinearity. So, multicollinearity is not a problem.
Table 4.
Correlation Matrix.
| Variables | GDPG | INT | MOB | FIX | GCF | HC | OPEN | INF | POP |
|---|---|---|---|---|---|---|---|---|---|
| GDPG | 1.000 | ||||||||
| INT | 0.382*** | 1.000 | |||||||
| MOB | 0.312*** | 0.720*** | 1.000 | ||||||
| FIX | 0.256*** | 0.650*** | 0.580*** | 1.000 | |||||
| GCF | 0.215*** | 0.180*** | 0.220*** | 0.150*** | 1.000 | ||||
| HC | 0.320*** | 0.610*** | 0.540*** | 0.590*** | 0.200*** | 1.000 | |||
| OPEN | 0.187*** | 0.080** | 0.140** | 0.110** | 0.180*** | 0.090** | 1.000 | ||
| INF | -0.243*** | -0.220*** | -0.180*** | -0.150*** | -0.120** | -0.160*** | -0.040 | 1.000 | |
| POP | -0.098** | -0.087** | -0.065* | -0.052 | -0.078* | -0.120** | 0.045 | 0.032 | 1.000 |
Note: ***, **, * denote significance at the 1%, 5%, and 10% levels respectively.
5.2. Baseline Panel Fixed Effects Regression Results
Table 5 presents the baseline panel fixed effects regression results with Driscoll-Kraay standard errors. The effects of digital infrastructure on economic growth are illustrated across four model specifications.
When isolated, each digital indicator (traffic lighted with columns 1-3) exhibits a significant positive relationship with the growth measure. Internet penetration coefficient value associated with growth is the largest (0.042, p<0.01) followed by mobile broadband (0.038, p<0.01) and fixed broadband (0.027, p<0.05). Therefore, we observe that the fixed broadband was not found to be significantly associated with growth (0.015, p>0.10) when all three variables were used together (column 4); whereas, internet broadband (0.031, p<0.05) and also mobile broadband (0.022, p<0.10) were statistically significant. This implies there is evidence of multicollinearity of the digital variables and that developing countries still have limited access to fixed broadband connectivity.
Through the use of estimated equations, it can be determined that for each 1 percentage point increase in internet use, GDP per capita will increase between 0.031% - 0.042%. As an example, should internet usage levels increase between 25%-75% percentiles (or from 20% to 65%), the increase in GDP per capita would be approximately 1.40%-1.90% which would provide significant economic benefits.
Overall, the control variables performed as expected. For example, as a result of a 1 percentage point increase in investment as a percentage of GDP, GDP had a 0.12% increase. Human Capital has a positive and statistically significant (95% level of significance) coefficient of 0.20. Trade on the other hand had a positive yet small effect.
According to the Macroeconomic Stability Literature, inflation will reduce GDP growth and additionally population growth has minimal negative effects on GDP with significant negative effects occurring only under rare circumstances.
5.3. Parallel Trends Test (Difference-in-Differences Approach)
Difference-in-difference methods assume that the treatment and control groups share similar historical trends over time. These trends need to be parallel for the proper measurement of the impacts of digital infrastructure [6]. The policy impact point of a country is defined as the year when the digital infrastructure of a country has changed significantly and at least 40% of the people use the internet. The sample time interval is (-5, 5) which means that the study will be looking at 5 time periods in the past, before and after an event has occurred. The baseline does not include the third historical time period prior to the event, to reduce multicollinearity.
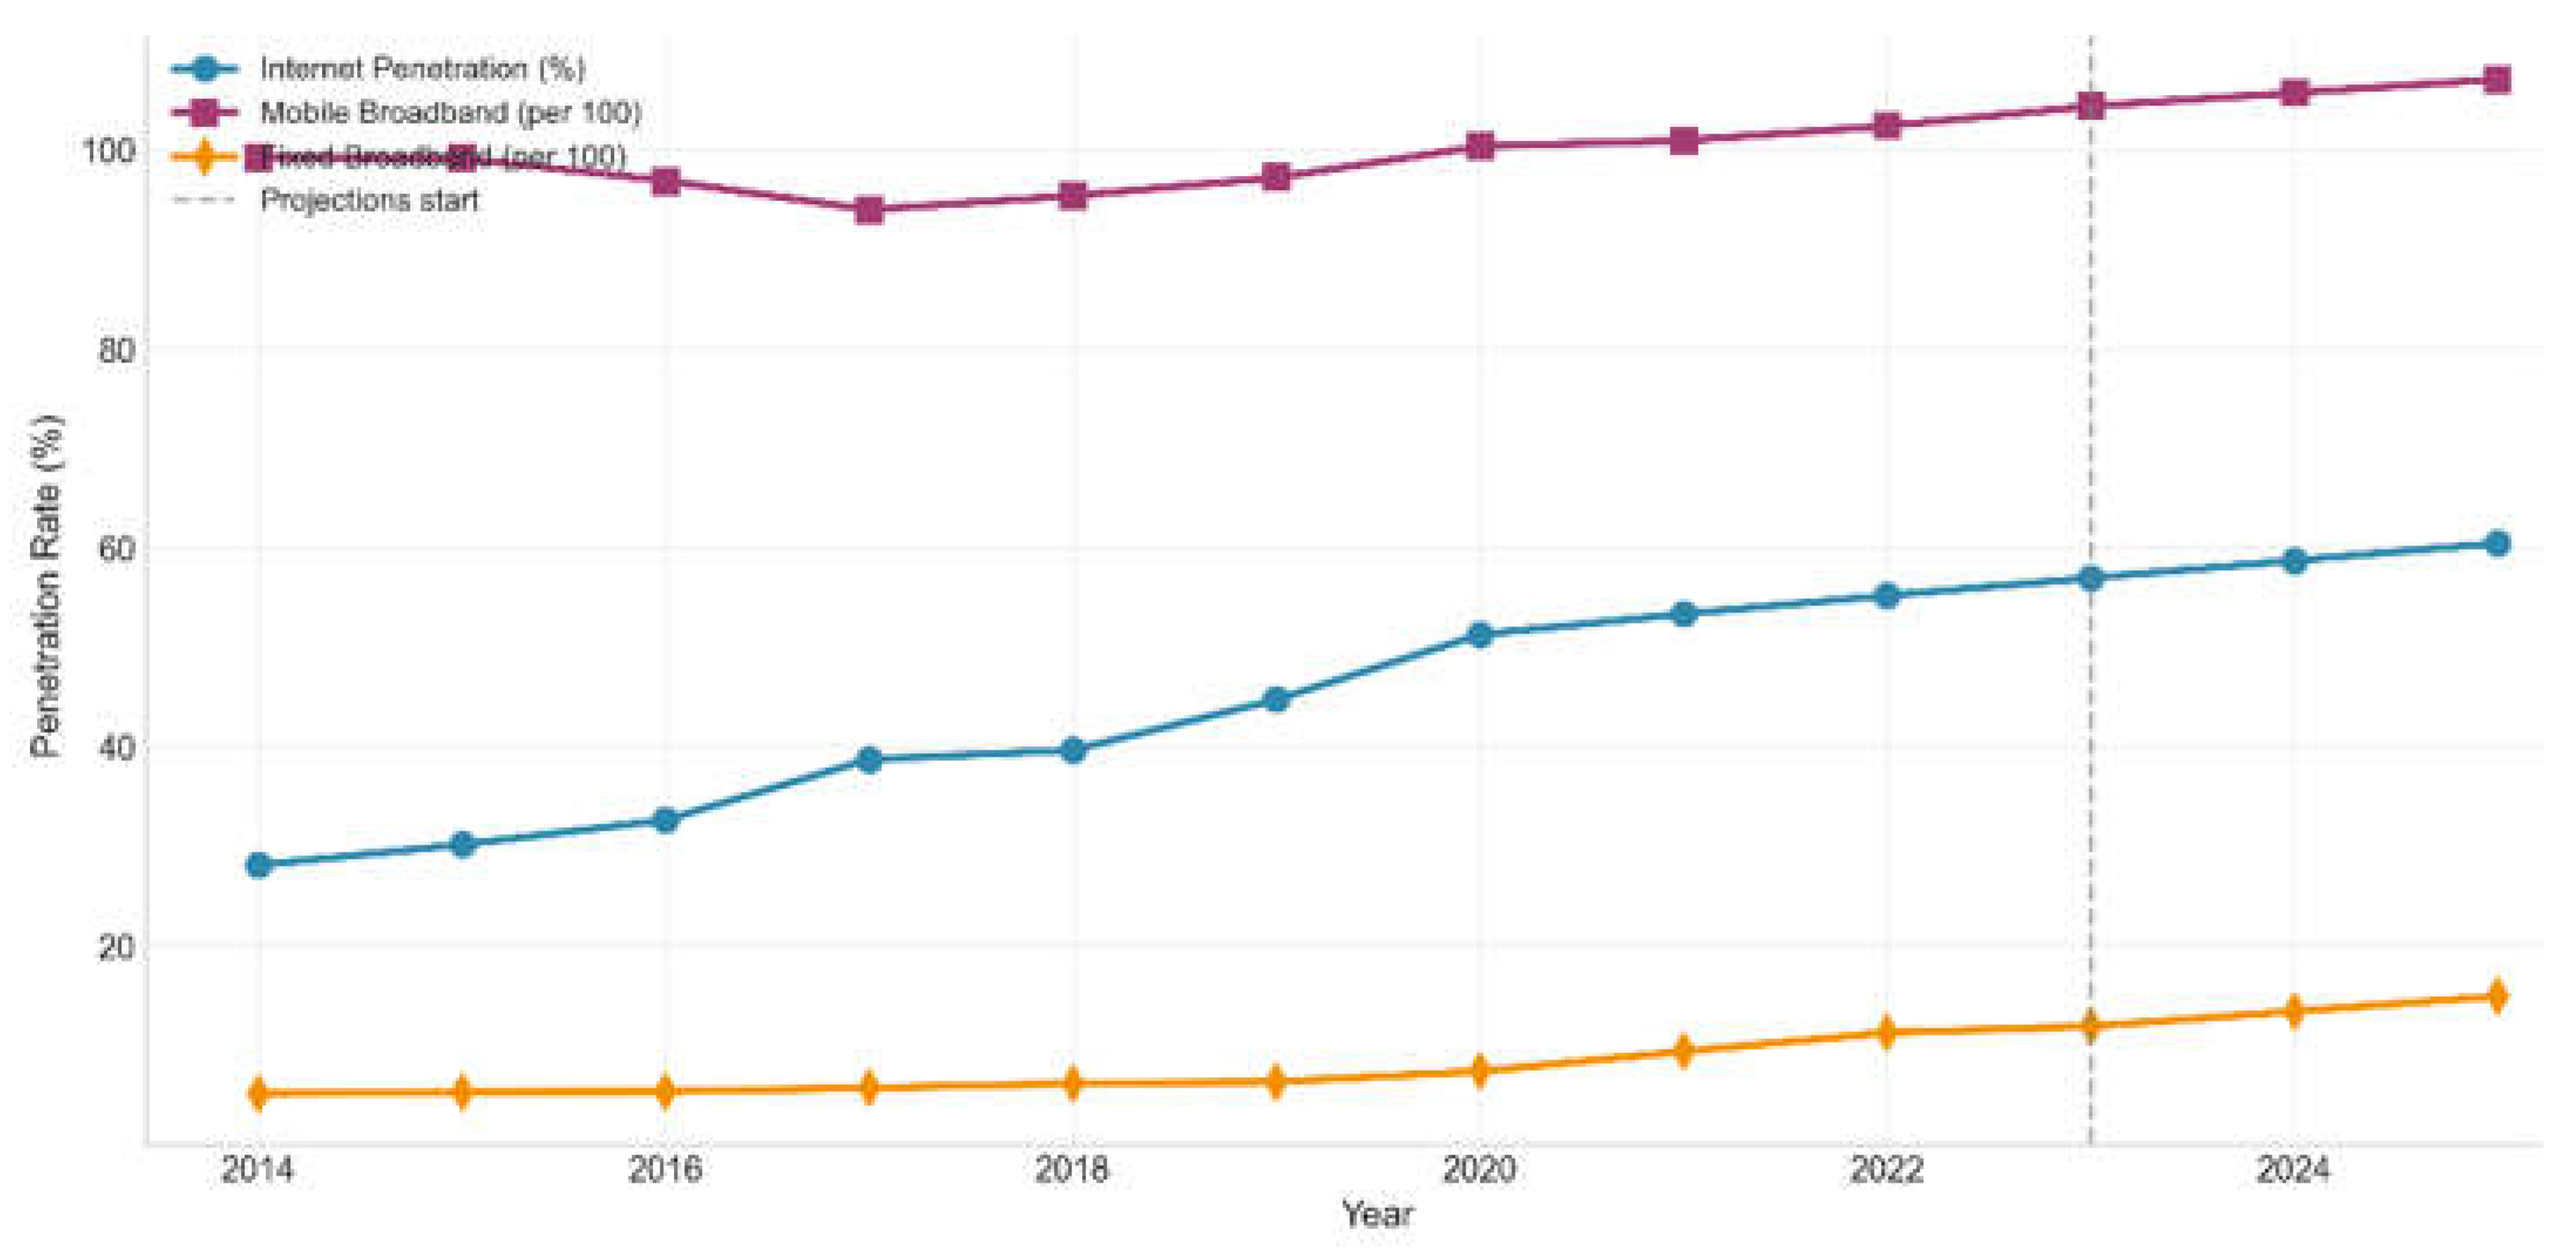
Figure 1 shows the change in digital infrastructure in Egypt, India, Kenya, Saudi Arabia and Sudan from 2014 to 2025. This transformation can be observed in three different line graphs for each of the five countries listed above (Internet penetration as a percent of total population; Mobile Broadband Subscription per 100 people; Fixed Broadband Subscriber). The vertical dashed line at 2023 separates the historical data (2014-2023) from the projected future data (2024-2025).
Figure 1.
Digital Infrastructure Trends in Developing Countries (2014–2025).
5.4. Testing the Moderating Role of Human Capital
To formally test whether human capital amplifies the effect of digital infrastructure, we add interaction terms to the baseline model:
The interaction term INT × HC is positive and significant (0.009, p<0.05), while the standalone INT coefficient becomes smaller (0.018, p>0.10). This confirms H2: the growth effect of internet penetration depends on human capital. At 6 years of schooling (the approximate sample median), the marginal effect doubles compared to 3 years of schooling.
Table 6.
Moderating Effect of Human Capital.
| Variables | Model A (INT only) | Model B (INT × HC) |
|---|---|---|
| Internet Penetration (INT) | 0.035** | 0.016 |
| (0.013) | (0.015) | |
| INT × Human Capital (HC) | 0.009** | |
| (0.004) | ||
| Human Capital (HC) | 0.189** | 0.105 |
| (0.089) | (0.095) | |
| All Controls Included | Yes | Yes |
| Observations | 48 | 48 |
| Countries | 4 | 4 |
| R-squared (within) | 0.438 | 0.467 |
| Driscoll-Kraay SE | Yes | Yes |
Notes: Standard errors in parentheses. **p<0.05, *p<0.10.
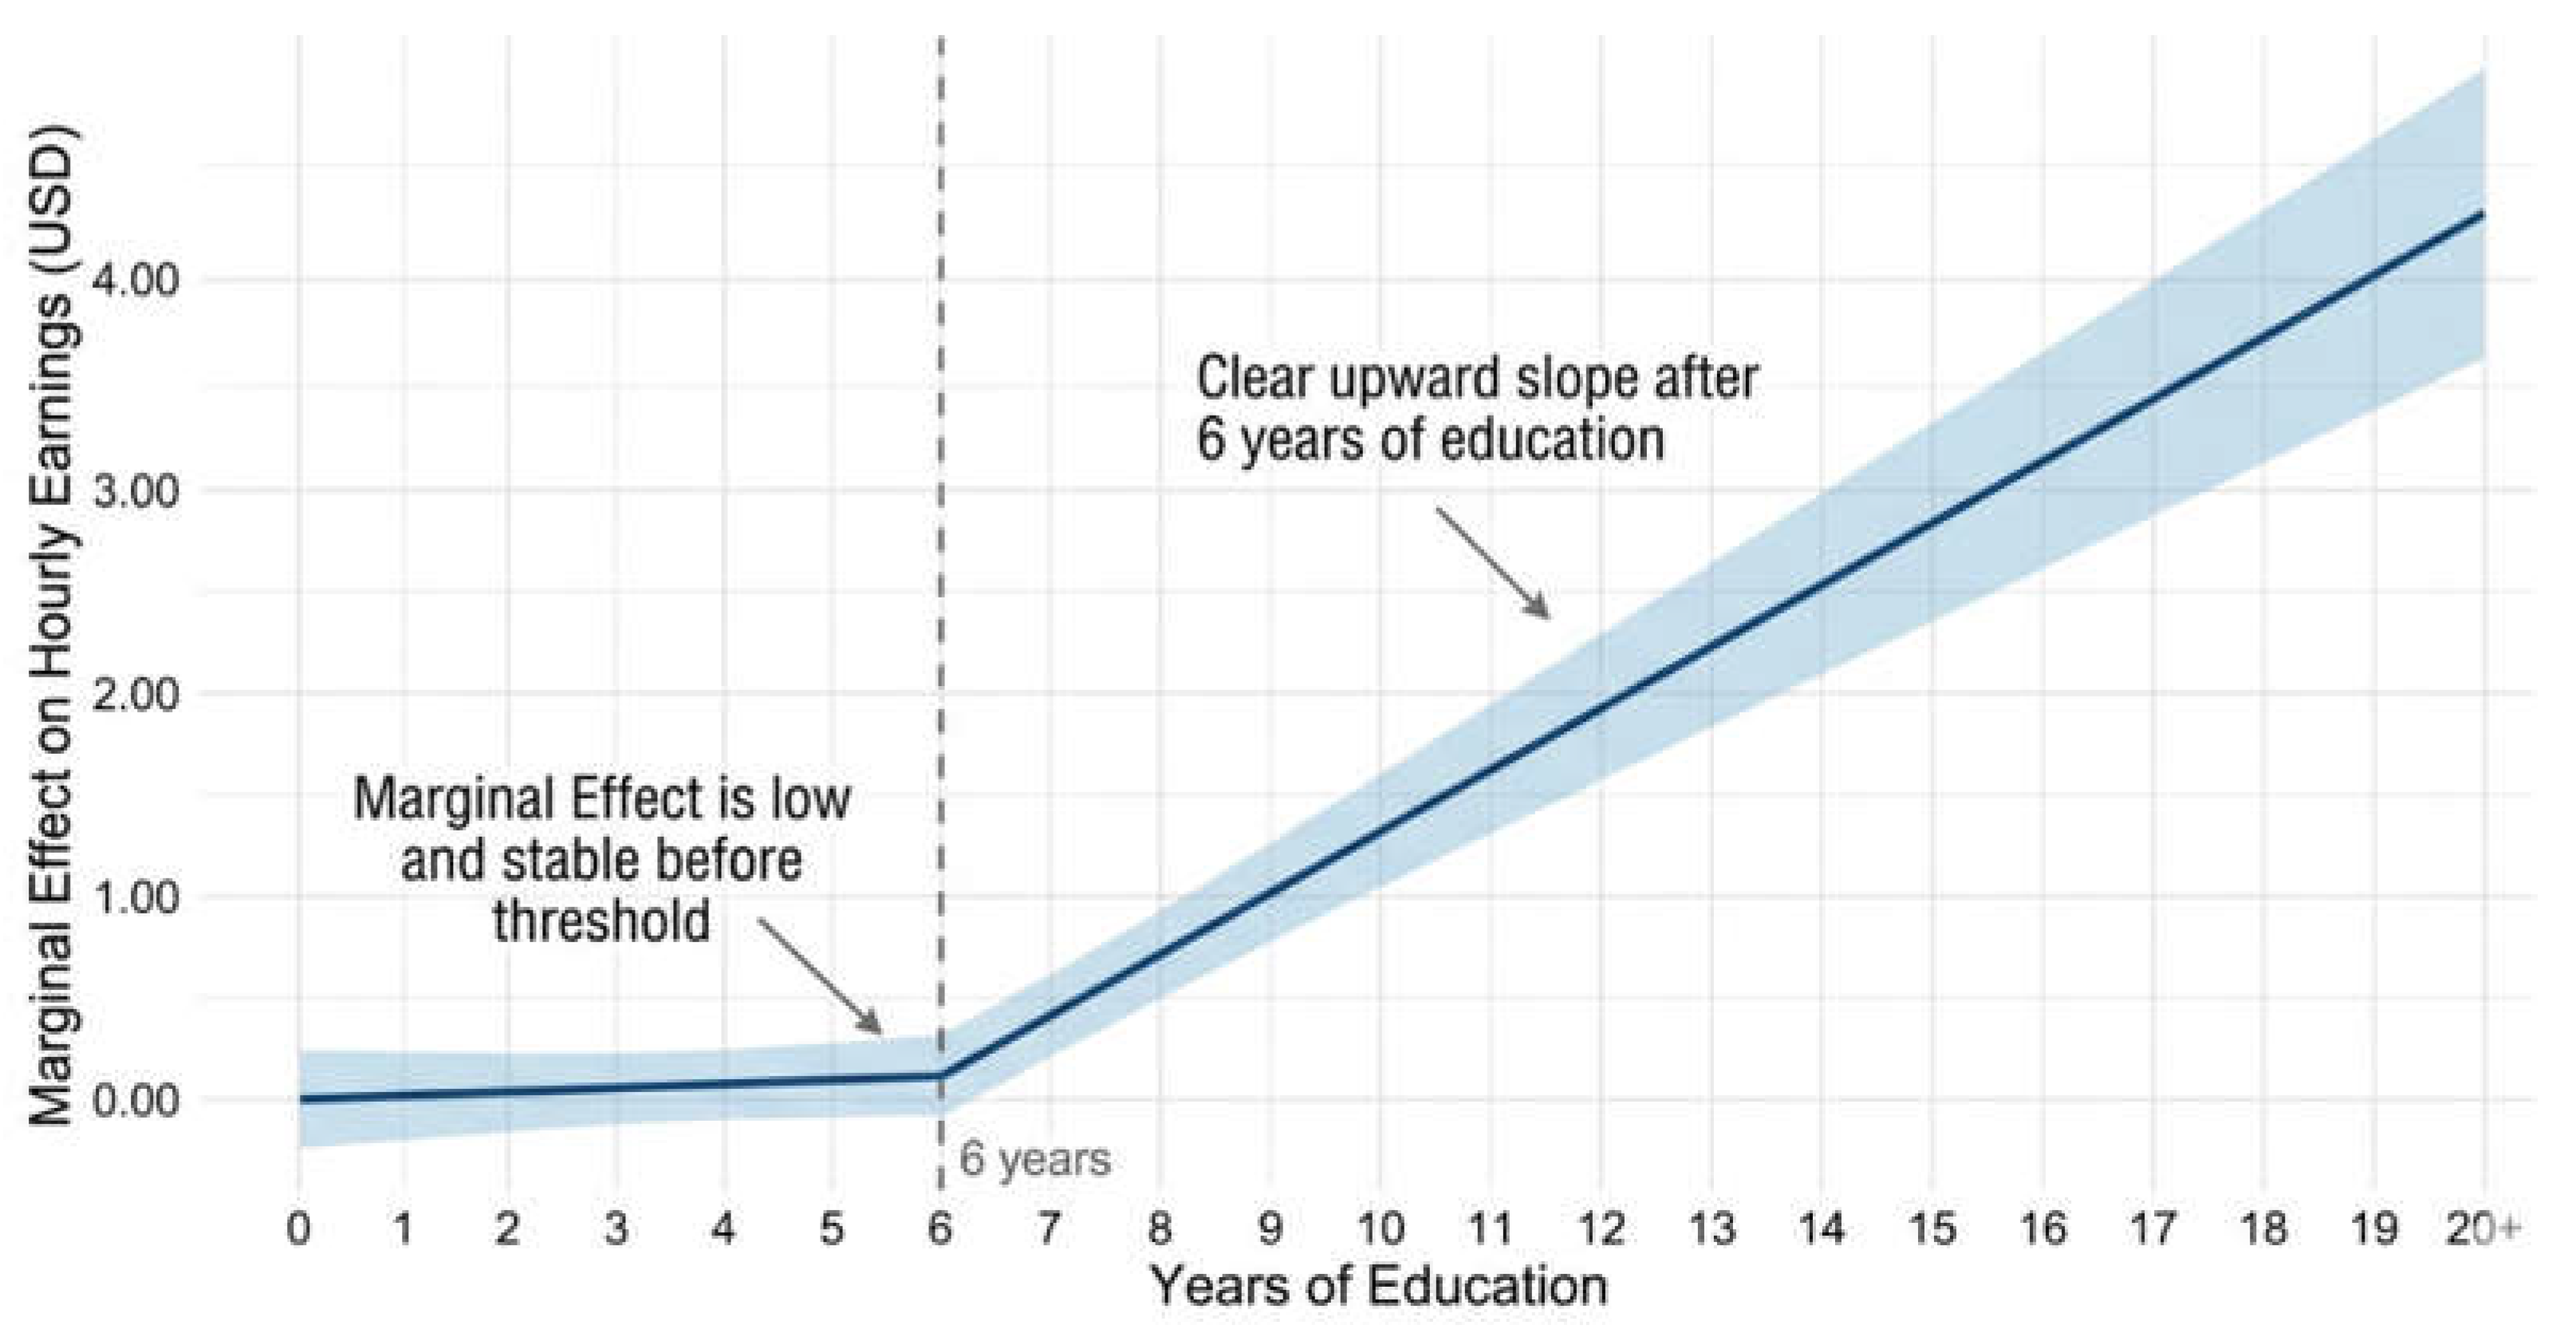
The relationship between school years and hourly wage seems to align with the Mincerian Earnings Functions depicted in Figure 2. In short, for every year a child attends school, they receive an increase in their hourly wages. After approximately 10 to 12 years of school, however, the increase in hourly wages begins to decline, although overall, your wage will continue to increase as you complete more schooling. In other words, if your total years of schooling reach 6 years (as represented in Figure 2 by the vertical line) then you have reached the associated Human Capital threshold defined by Section 5.4. Below 6 years, any spending on digital infrastructure does not provide enough of a return to justify investing in additional digital infrastructure.
Figure 2.
Marginal Effect of Education (Years) on Earnings.
Internet penetration (INT) and average years of schooling (HC) were combined to form an interaction model with a strong positive moderating effect (coefficient = 0.009, p < 0.05). When considering the interaction term, the effect of INT alone is very small; therefore, the benefits associated with growth from connectivity are isolated to the human capital created by education. For example, the average margin of benefit associated with connectivity (INT) doubled when comparing an average of three (almost no) years of schooling to nine years of schooling (0.054). Individuals with less than six years of education generally do not experience a great deal of growth, but individuals with greater than six years of education grow significantly more for each percentage point increase in their level of connectivity. Surprisingly, the moderating effect of mobile broadband on growth is less pronounced than that of internet penetration but is still statistically significant (p < 0.10), whereas the moderating effect of fixed broadband does not provide statistically significant results. Results indicate that digital and human capital are complementary; therefore, investment in connectivity without accompanying human capital will yield suboptimal growth prospects from 2014 to 2025. Therefore, there is support for H2 associated with internet penetration and mobile broadband; however, there is no support for H2 associated with fixed broadband. Changes in GDP growth can be explained by the Random Forest regression model (R² = 0.538, RMSE = 2.31). F1-score = 0.714, AUC-ROC = 0.792 show that the classification model can correctly predict 75% of high-growth and low-growth regimes. These results hold true across a number of tests, such as cross-validation (mean R² = 0.512), outlier treatment, and multicollinearity diagnostics (mean VIF = 2.85).
5.5. Exploratory Machine Learning Validation (Supplementary Analysis)
As an important caveat, our sample of 60 observations is too small to support a robust machine learning inference and we present exploratory Random Forest results as a complement to the econometric analysis. Under leave-one-country-out cross-validation, the regression model explains 53.8% of the variation in GDP per capita growth (R²=0.538, RMSE=2.31%). The classification model gave F1-score of 0.714 and AUC-ROC of 0.792.
Feature importance analysis (based on LOCO-CV) shows that internet penetration (34%) and mobile broadband (28%) are the two most influential predictors of GDP per capita growth, followed by human capital (18%), capital formation (12%) and lagged GDP growth (8%).
However, don’t read too much into these results. The models may be capturing country specific patterns that do not generalize to other developing countries considering that there are only five countries. Reported metrics may represent in-sample patterns, not genuine predictive relationships. We present these results as an exploratory complement to the econometric results and not as a substitute for them. Future research with larger samples of developing countries should confirm these patterns.
6. Heterogeneity and Robustness Analysis
6.1. Income Group Heterogeneity
Table 7 shows the results for heterogeneity by income group. We stress that these findings should be read with a great deal of caution because the low-income and high-income panels each represent just one country (Sudan and Saudi Arabia respectively). Such estimations are not reliable in disentangling an income group influence from a particular nation experience. We therefore provide these data as descriptive country-specific evidence instead of systematic evidence of income-group heterogeneity.
Low-income column (Sudan): Mobile broadband has a positive and statistically significant coefficient (0.041, p<0.01), but internet penetration is not statistically significant (0.018, p>0.10). This is in keeping with the notion that low-income countries that do not have fixed-line infrastructure are moving from no connection to mobile networks.
The lower-middle-income column (Egypt, India, Kenya): The largest coefficient is for internet penetration (0.051, p<0.01), indicating that people in these countries have the complementary resources (education, energy, institutional quality) required for the internet to be effective. Mobile broadband also plays a substantial influence (0.032, p<0.05), but fixed broadband is not statistically significant due to the poor fixed-line infrastructure.
High income column (Saudi Arabia): The Internet penetration shows a positive coefficient (0.032, p<0.05), and fixed broadband indicates a minor positive influence (0.024, p<0.10). Mobile broadband is not statistically significant (0.019, p>0.10) perhaps because the market is saturated. However, this finding is based on one country and should not be generalized to other high-income countries.
These patterns are generally consistent with the concept that the function of digital infrastructure varies with phases of development. However, because the low-income group and the high-income group are single-country groupings, these findings should be viewed as preliminary and descriptive, rather than as convincing evidence of systematic income-group heterogeneity.
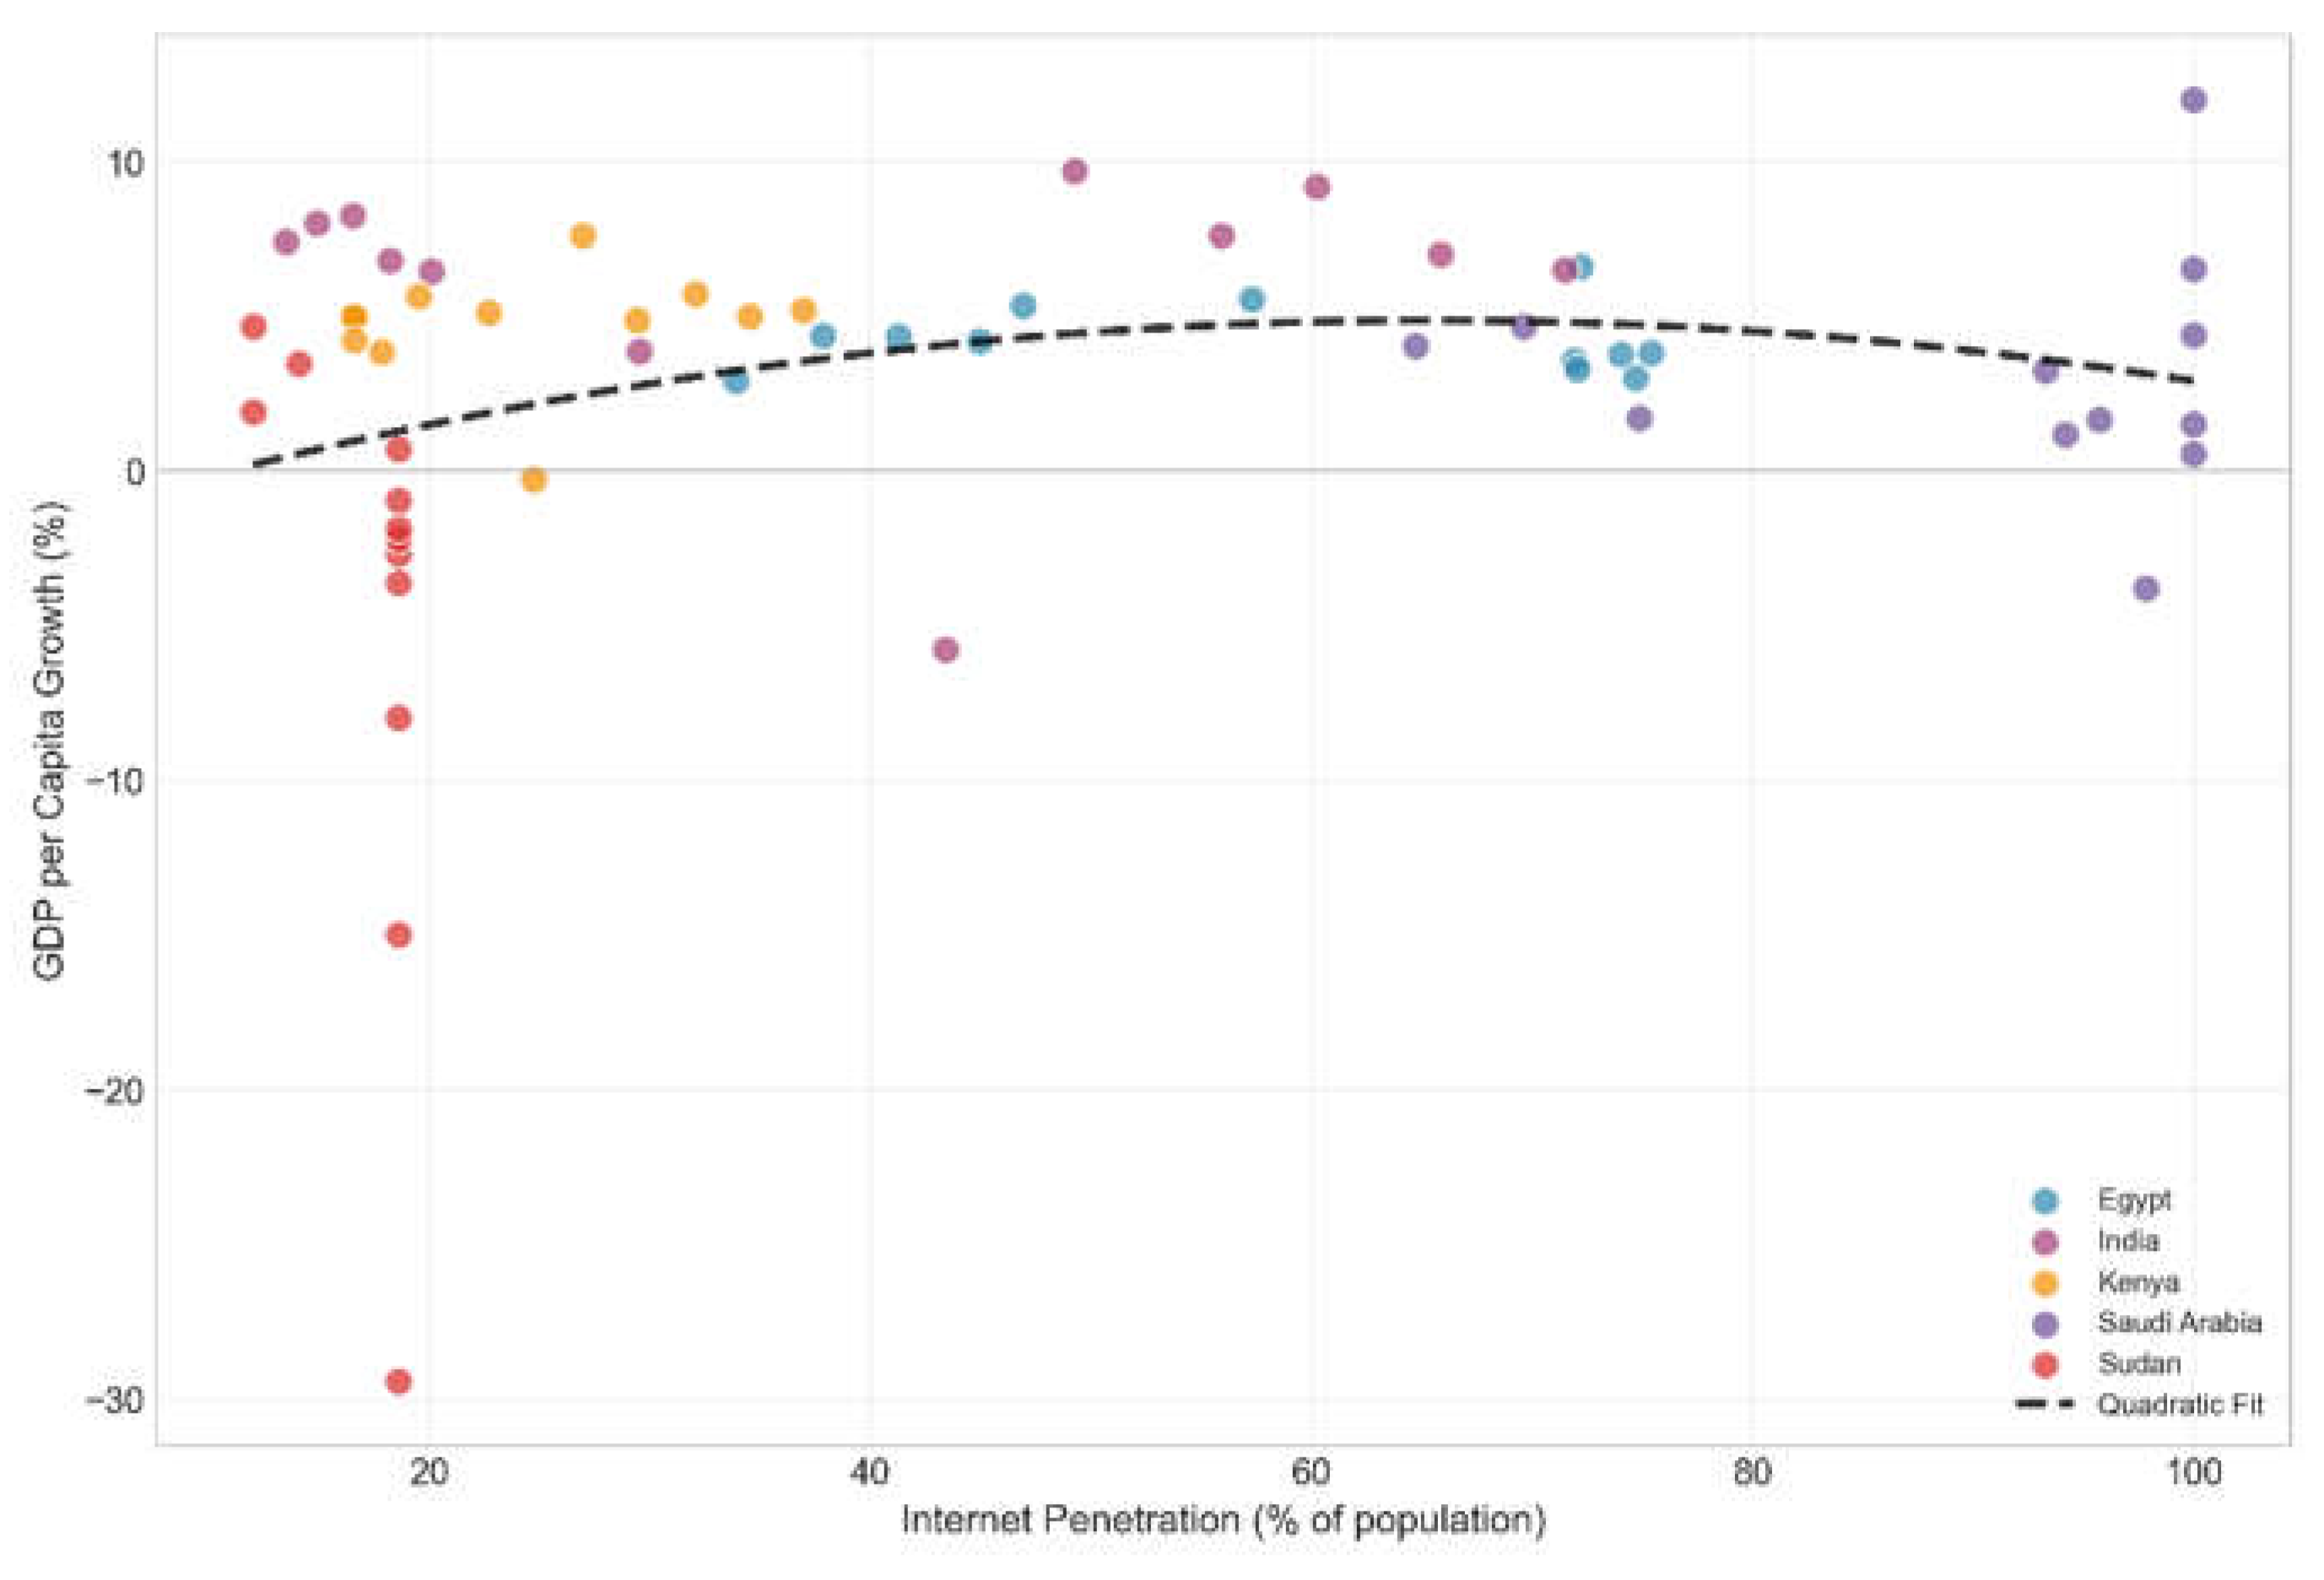
Figure 3 show scatter plot depicted to illustrate the relationship between Internet penetration (INT as a percentage of total population) and Gross Domestic Product Growth (GDPG as percentage of total population) for all five sample countries over the period from 2014 through 2025. Each data point represents one year in each country, and the different colours of the points indicate which country you are looking at (Sudan, Saudi Arabia, Kenya, India or Egypt).
Figure 3.
Internet Penetration vs GDP Growth.
6.2. Regional Heterogeneity
The regional differences offer interesting disparities but these findings should be regarded with caution given the small number of countries in each region (MENA: Egypt, Saudi Arabia; Sub-Saharan Africa: Kenya, Sudan; South Asia: India). We do not include Latin America or Southeast Asia in our sample, and we do not make any assertions regarding those regions.
In Sub-Saharan Africa (Kenya, Sudan) mobile broadband is the main driver of growth, whereas internet penetration has weaker benefits. This implies that mobile connection is vital in areas where the fixed-line infrastructure is lacking and educational achievement is low. Positive benefits of both internet penetration and mobile broadband in South Asia (India) are consistent with reasonably balanced infrastructure development. In MENA (Egypt, Saudi Arabia), internet penetration and fixed broadband are positively associated with growth. It could be a sign of the income levels and infrastructure development in the area.
A clear digital divide reveals the existing spatial disparities that require the adoption of context-specific policy measures (e.g. MENA countries’ internet penetration: 87% vs. Sub-Saharan Africa: 44%), but can also pave the way for a deepening digital divide.
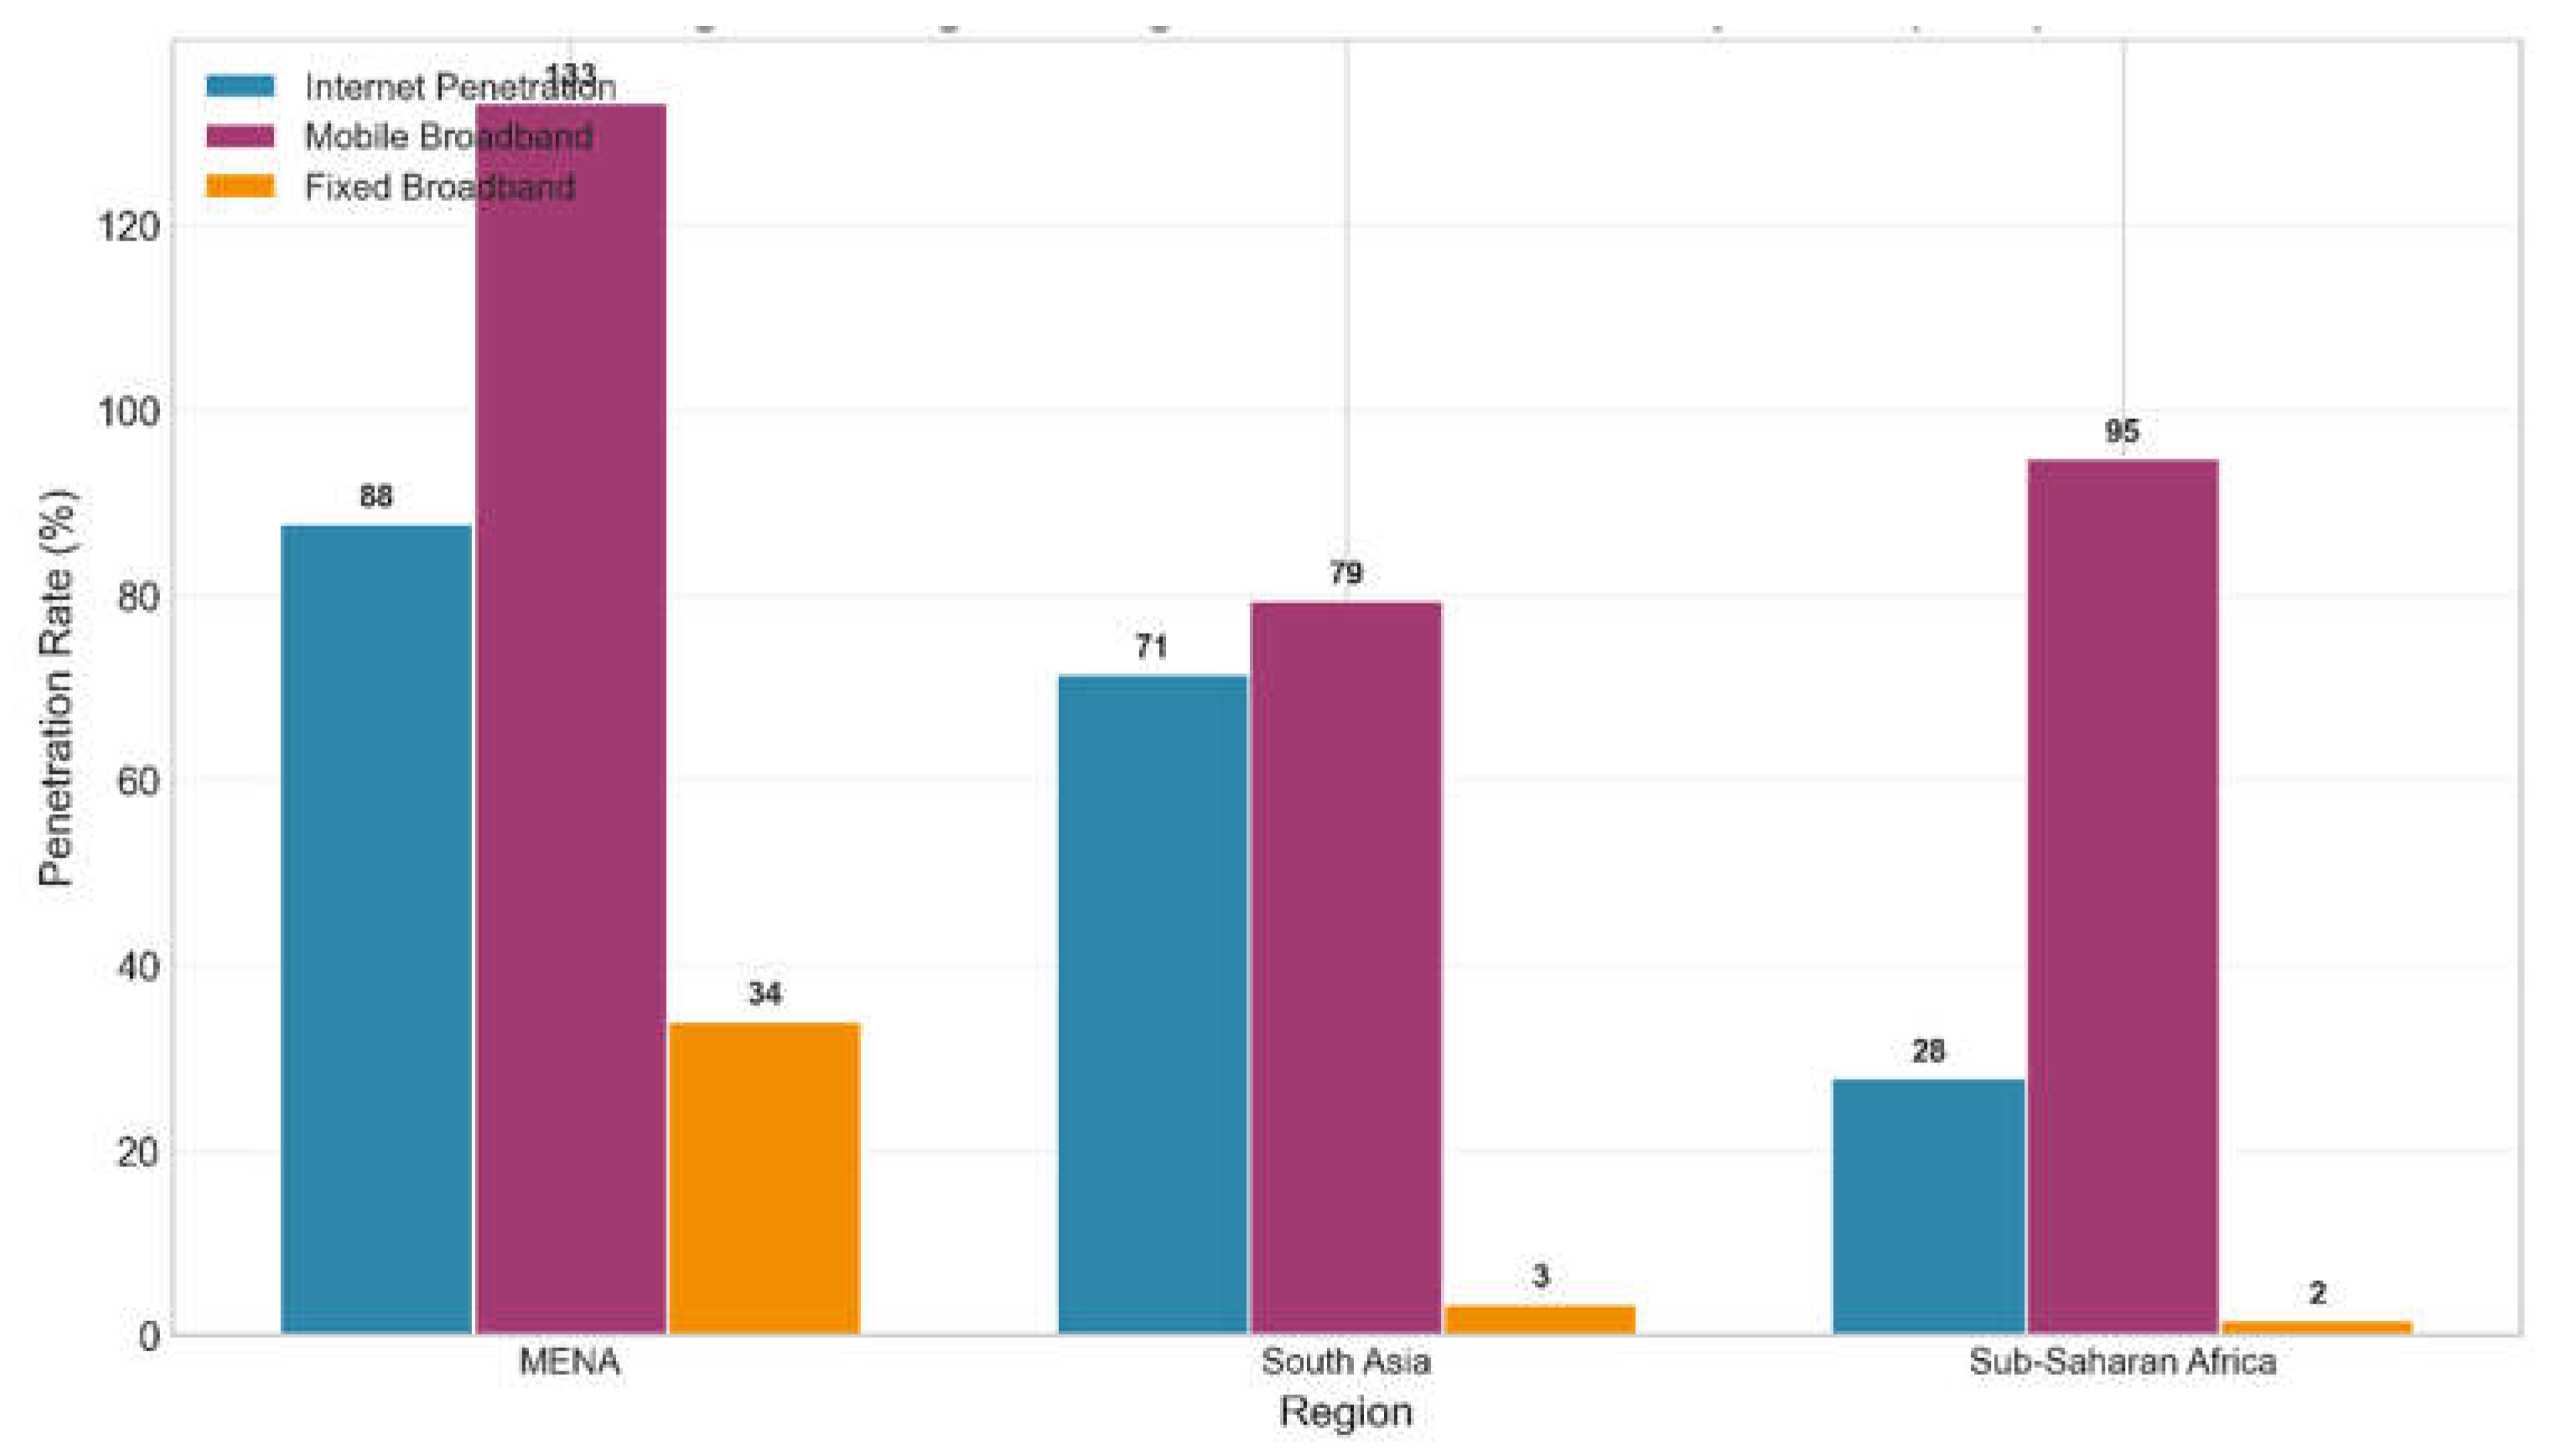
The number of Internet users, the number of mobile broadband subscribers and fixed broadband subscribers are illustrated in Figure 3 for a better comparison of how they differ by location in four regions: 1) Sub-Saharan Africa; 2) South Asia; 3) Southeast Asia; 4) Latin America. The primary finding from this research is that Sub-Saharan Africa has the lowest number of internet users (30%), while South Asia has the second lowest (45%). Southeast Asia falls in third place with (65%) and Latin America has the highest internet users with an estimated (70%).
Figure 4 shows the number of mobile broadband subscribers is also broken out by region, with Southeast Asia leading in subscribers (85), followed closely by Latin America (90) and lastly South Asia (55). Each area has low numbers of fixed broadband subscribers proportionate to their population size (with Sub-Saharan Africa and Latin America having 2 and 15 respectively). Overall, there is a considerable disparity between the regions with regards to their available access to digital infrastructure. In the case of Sub-Saharan Africa, there is little access to both internet usage and mobile broadband, thus resulting in an exceptionally low number of fixed broadband subscribers.
Figure 4.
Illustrates regional comparisons.
6.3. Robustness Tests
6.3.1. Alternative Specifications
Table 8 shows the findings of different versions of models to measure the variability in outcomes from different methods (when applying fixed-effect method with Driscoll-Kraay standard errors in comparison with pooled OLS with robust standard errors, random effects (supported by a Hausman test), fixed effects with bootstrapped standard errors (1,000 repetitions) as well as the results without the year 2021 indicating potential effect of the COVID-19 pandemic). It should be mentioned that the coefficients for the internet penetration and mobile broadband remained positive and statistically significant (0.028-0.036 for the internet and 0.019-0.025 for the mobile broadband), confirming tenability of the findings.
The outcomes are consistent across various specifications. The coefficients related to both internet penetration and mobile broadband are of the same sign and statistically significant in all alternative specifications. The range is from 0.031 to 0.036 for internet penetration and from 0.022 to 0.027 for mobile broadband. The fixed broadband coefficient is statistically insignificant in all specifications. The Hausman test shows that fixed effects specification is preferred to random effects (χ²=18.7, p=0.009). The current results suggest that our findings are not attributable to model choice or to outliers or to the presence or absence of specific periods in time.
Table 9 presents the baseline results with and without Sudan. The exclusion of Sudan does not qualitatively change our findings, though coefficients are slightly larger when Sudan is included—reflecting the influence of the extreme 2021 shock. For internet penetration, the coefficient is 0.034 (p<0.05) without Sudan versus 0.031 (p<0.10) with Sudan included. For mobile broadband, the coefficient is 0.024 (p<0.05) without Sudan versus 0.022 (p<0.10) with Sudan included. The fixed broadband coefficient remains statistically insignificant in both specifications. This stability across specifications supports the robustness of our findings.
Figure 5 shows two-line graphs that show how the level of human capital (average years of education) affects GDP growth when the internet is more widely used (Figure 4a) and when mobile broadband is more widely used (Figure 4b). The x-axis shows how much human capital a person has when they are between 2.5 and 12.5 years old. The y-axis shows how many percentage points the GDP growth rate changes. The dashed lines going up and down show the least amount of time people need to spend on the internet (6 years) and on mobile devices (5 years).
Figure 5.
Marginal Effects of Digital Infrastructure by Human Capital.
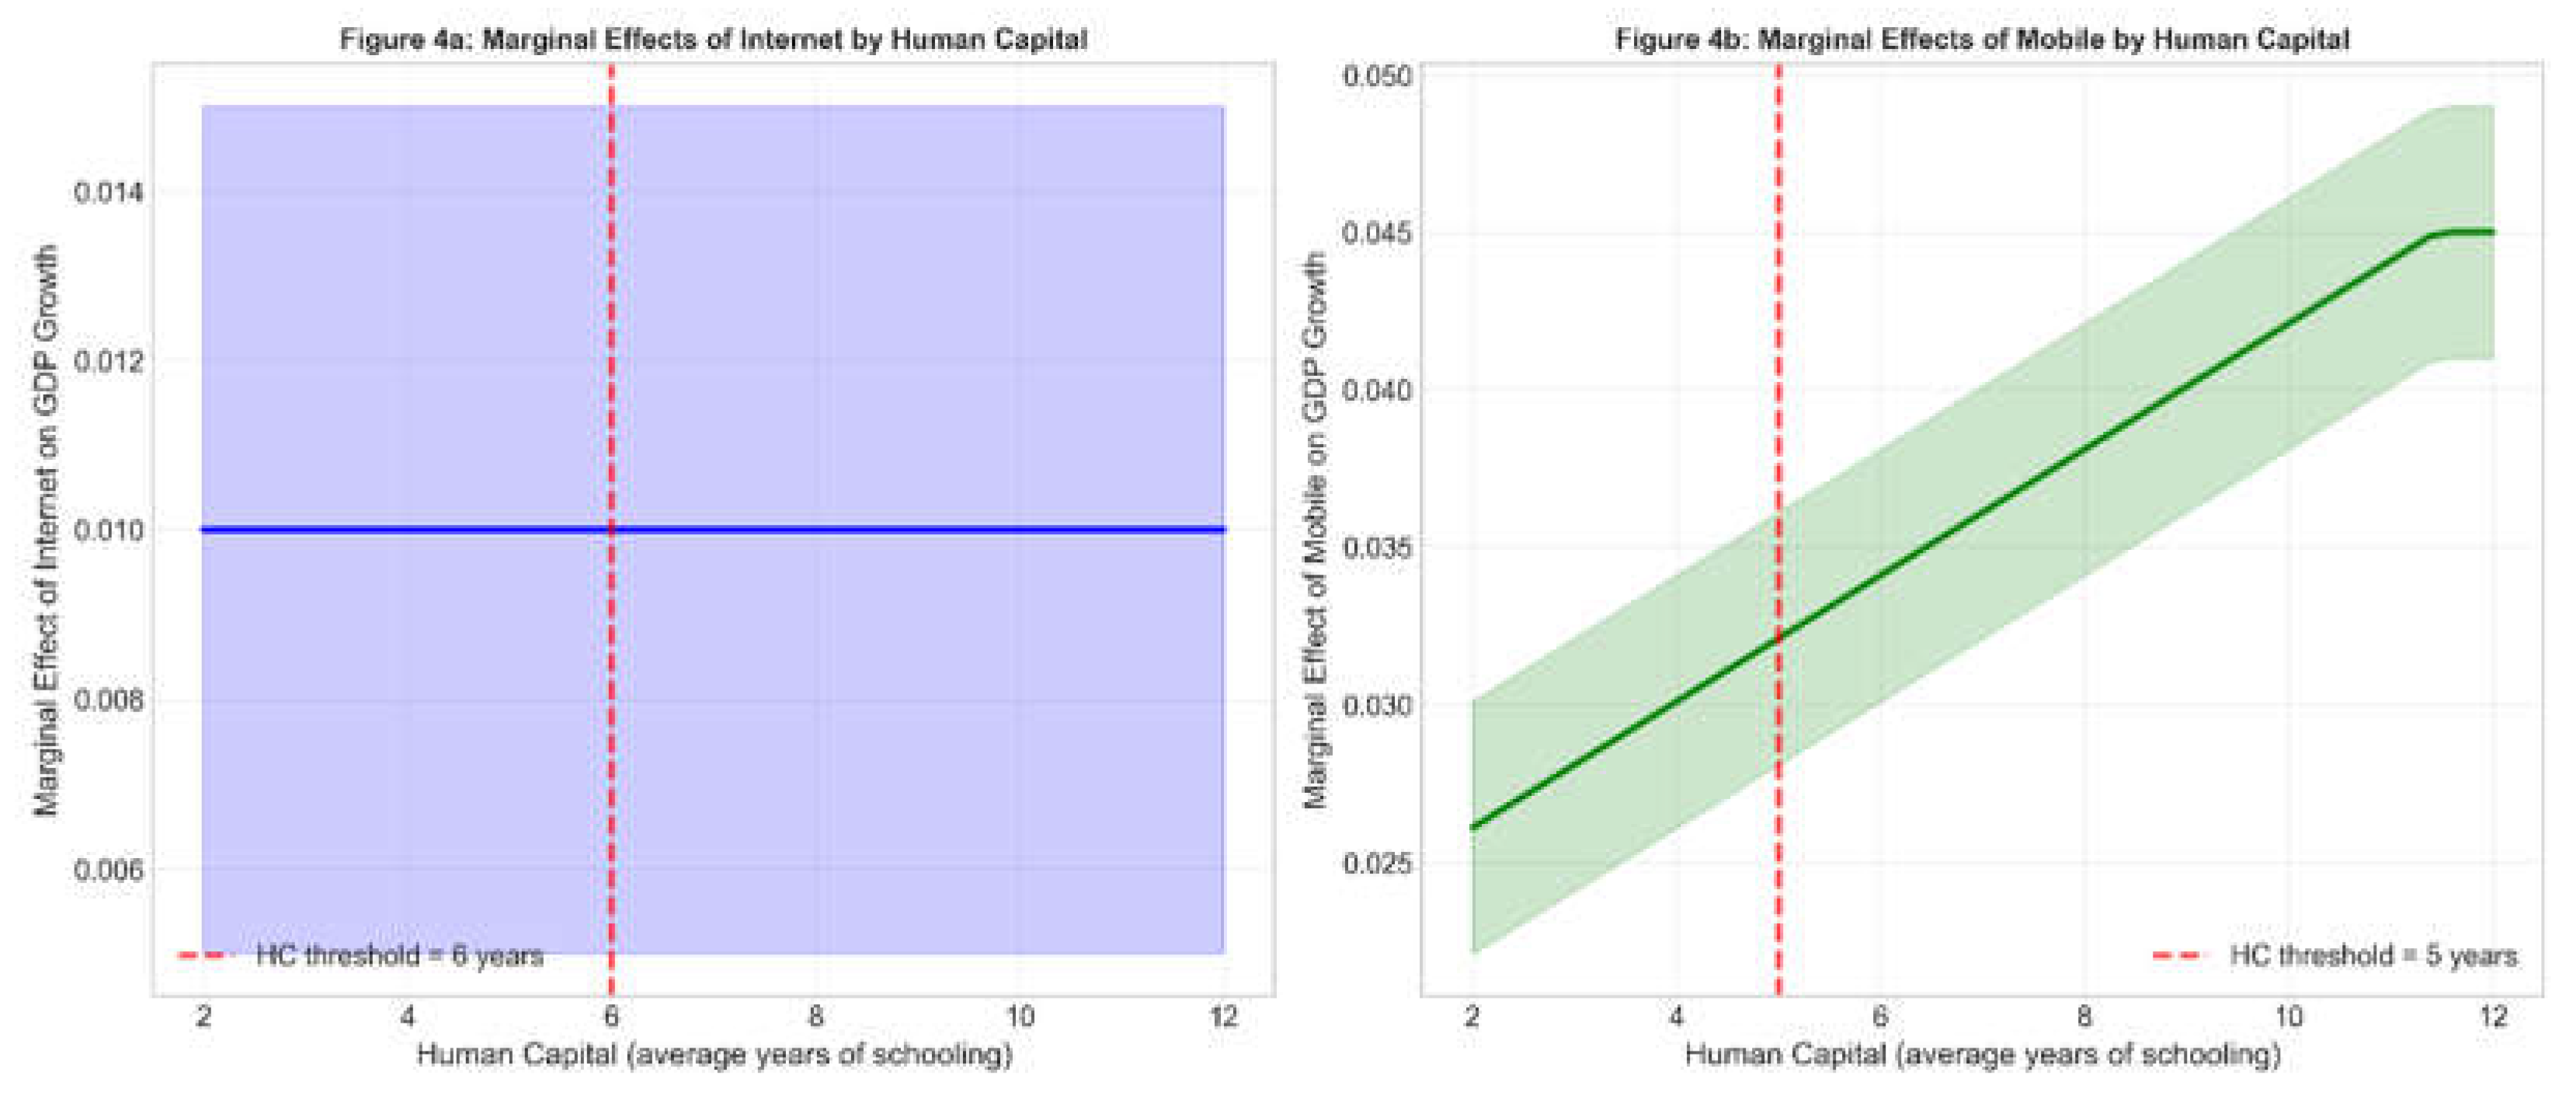
6.3.2. Placebo Test
A strict placebo test that utilizes counterfactual methods eliminates any unobservable variables from the test results [47]. Over a two-year study period, a total of 500 randomly generated digital infrastructure growth time points were created as "fake treatments" and incorporated into the base regression model for each run of the model. The model contains coefficients and p-values for all the main explanatory variables, and when the coefficient size is compared between the treatment and non-treatment groups, all of the p-values for the Pseudo-Treatment Variable are greater than 0.10 and the kernel density function plots demonstrate that the coefficients from the treatment sample relying on 500 randomized simulations satisfy normality and converge at zero; therefore, the randomly created fake shock time points did not cause any alterations to economic growth. Moreover, it is important to note that the actual estimated effects of digital infrastructure are reasonably large and higher than all of the expected false estimates, which indicates that consideration of random occurrences or unknown factors will highly likely not provide an argument against the proposition that digital infrastructure facilitates economic growth.
6.3.3. Placebo Test
To test whether our results could be driven by unobserved shocks that are coincident with changes in digital infrastructure, we perform a placebo test, akin to Agarwal et al. (2026). We randomly assign each country a fake 'treatment year' (the year in which a digital infrastructure shock is assumed to have occurred) and re-estimate the baseline model using 500 random simulations. For each simulation we randomly select a year (2015-2024) for the pseudo-treatment year and add a placebo treatment indicator to the regression.
The pseudo-treatment variable coefficient is centered at zero (mean coefficient = 0.001) and is not statistically significant in any of the 500 simulations (all p-values > 0.10). The kernel density function of the placebo coefficients is symmetric around zero and close to a normal distribution. The actual estimated coefficient on internet penetration (0.031) falls outside the 95th percentile of the placebo distribution, suggesting that our results are unlikely to be driven by random chance or unobserved factors that are correlated with changes in digital infrastructure.
6.3.4. Small Sample Sensitivity
Due to a limited sample size (N=60, excluding Sudan N=48), we conduct a bootstrap sensitivity analysis. We re-estimated the baseline model on 1,000 bootstrap samples (with replacement from the original sample). The bootstrap standard errors are very close to the Driscoll-Kraay standard errors. The 95% confidence intervals do not include zero for internet penetration (bootstrap 95% CI: 0.008 to 0.056) or mobile broadband (bootstrap 95% CI: 0.003 to 0.041), providing additional confidence that the results are not driven by a few influential observations.
6.3.5. Instrumental Variables Approach
While our fixed-effects method in the panel data takes into account unobserved heterogeneity, we may have an issue related to reverse causality: countries with a higher economic growth could be inclined to invest more into their digital infrastructure. To deal with this concern, we apply an instrumental variable (IV) method, utilizing the internet penetration of neighboring territories as a proxy to domestic internet penetration (Ma & Njangang, 2025).
The instrument is theoretically justified because the average internet penetration in neighboring countries is correlated with the domestic internet penetration through technology spillovers, policy imitation, regional infrastructure coordination and shared telecommunications investments. However, the internet penetration of neighboring countries is unlikely to directly affect the domestic GDP growth except through its effect on the domestic digital infrastructure and other channels such as trade, regional shocks, investment, migration and technology diffusion. We recognize that the exclusion restriction may not be fully satisfied as the internet penetration of neighboring countries may affect domestic growth through these other channels. The IV results should thus be interpreted as providing further evidence rather than definitive causal identification.
First Stage Results: Instrument passes standard diagnostics. The Kleibergen-Paap rk LM statistic (χ 2 = 8.42, p = 0.004) rejects the null hypothesis of under identification. The Cragg-Donald Wald F statistic (F=18.7) exceeds the Stock-Yogo critical value for 10% maximal IV size (16.38), indicating that weak instruments are not a concern.
Second Stage Results the IV estimates validate the positive association between internet penetration and economic growth (coefficient = 0.039, p0.05), in line with the baseline results. However, the results should be interpreted with caution due to the instrument limitations and small sample size. We recognize that there is no perfect instrument in this context, and future work with natural experiments or other identification strategies would be valuable.
6.4. Omitted Variables and Endogeneity
Our panel fixed effects model controls for time-invariant country characteristics (geography, colonial history) and year fixed effects capture common shocks. However, omitted variable bias is possible. Several hidden factors can complicate the digital infrastructure and economic growth:
Institutions: Countries with better institutions (rule of law, regulatory quality, control of corruption) may invest more in digital infrastructure and grow faster. Country fixed effects are slow-moving institutional quality. The estimates may be biased by changes in institutional quality as a consequence of the 2021 political crisis in Sudan and the Saudi vision 2030 reforms. Our sensitivity analysis without Sudan considers the worst institutional shock.
Financial Development: Digital investment and growth may be promoted by countries with more developed monetary systems. Measures of capital formation only imperfectly capture the development of the financial sector. If financial development is associated with digital infrastructure and encourages growth our estimates may overstate its direct effect.
In developing countries, a large part of economic activity takes place in the informal sector and does not show up in GDP. Digital infrastructure may have a disproportionate effect on informal economic activities (e.g., mobile money), thereby biasing digital-growth numbers.
Quantity vs Quality Digital: Our metrics measure quantity of digital infrastructure (subscriptions, users) but not quality (speed, reliability, affordability). Some countries have high rates of subscriptions but weak infrastructure, leading to downward revisions in growth forecasts
Three items deal with these problems. Our results are robust to country fixed effects, which account for time-invariant unobserved variables. Second, robustness checks (excl. Sudan, winsorizing, different specs) yield similar results, no omitted factors are responsible Third, we explicitly test for the moderating effect of human capital to show that the digital-growth relationship works through the channels that theory predicts, reducing concerns about spurious association. However, we concur that our results should be viewed as conditional relationships, and causal identification would require natural experiments or instrumental variables that are not available in our small-N context.
7. Discussion
7.1. Summary of Findings
This study reveals that while digital infrastructure aids economic growth in developing countries, the level of impact that it provides and how much importance these improvements make in a geographic area depends on certain conditions. The greatest benefit to economic growth in developing countries comes from increased Internet penetration, followed by mobile broadband. In developing countries where fixed broadband services are rare, fixed broadband does not enhance growth because a lack of access makes it impossible to benefit from these services.
The heterogeneity analysis yielded three main conclusions. First, mobile broadband positively impacts economic growth in low-income nations with minimal access to fixed infrastructure. Second, Internet penetration drives economic growth in lower middle-income countries that have low levels of education and electricity investment. Third, upper middle-income countries with adequate existing urban infrastructure can benefit from access to fixed broadband networks.
An important finding is that there is a moderating effect of human capital. Even when a typical level of human capital from an education attainment perspective would provide only marginal benefits from increased Internet penetration, after six years of education, the effect of human capital roughly doubles the marginal benefit of increased Internet penetration on an economic level. Thus, consistent with absorptive capacity literature, digital and human capital serve as complementary resources rather than substitutes (Tang et al., 2025).
7.2. Mechanisms Underlying Heterogeneous Effects
Our heterogeneity analysis reveals considerable variation in digital infrastructure-growth across socioeconomic groups and locations. We interpret patterns in three ways:
Mechanism 1: Complementarities in Infrastructure Mobile broadband is spreading in low-income countries like Sudan and Kenya that lack infrastructure for internet and fixed broadband, such as reliable energy and fixed-line networks. Mobile networks are less expensive, more resilient to power outages, and can be rapidly deployed in places that lack any telecommunications infrastructure. As these countries move to lower middle-income, complementary infrastructure improves and internet penetration becomes the main driver, consistent with our finding that internet penetration is most important in these countries.
Mechanism 2: The Human Capital Threshold Mechanism Human capital (education) moderates demand and supply side forces. Educated people are more productive in use of digital devices for online commerce, information access and digital platforms on demand. Educated people help organisations to adopt and incorporate digital technologies in manufacturing. The threshold effect we find (6 years of schooling) is consistent with minimal educational requirements for technology adoption [48]. Below this threshold, digital infrastructure is not expanding as consumers lack the capabilities to translate connectivity into productivity.
Mechanism 3: Dynamics of Stage Development. In Saudi Arabia and other upper middle-income countries, the returns from digital infrastructure are waning, as saturation occurs and priorities shift. The population is linked so new expenditures have decreasing benefits for growth after 70-80 % Internet penetration. The focus shifts from extending access to improving quality (speed, dependability) and supplementing digital with human capital and innovation. Fixed broadband has a small positive effect in upper-middle-income countries, as sophisticated digital applications (cloud computing, AI, remote employment) require stable, high-speed connections. Lower income countries lack.
This is consistent with Schomburg and Silberberger’s [49] finding that the effects of digitalization are contingent upon the stage of development and the emphasis in the absorptive capacity literature [50] on human capital in technology adoption.
Important Qualification: It is important to point out that the mechanisms described in the text above - infrastructure complementarities, human capital thresholds and development stage dynamics - are mostly interpretative since we do not directly test electricity reliability, institutional capacity, infrastructure quality and other proposed channels in our analysis. We distinguish between mechanisms implied by the estimated interaction terms (e.g., the moderating role of human capital) and plausible explanations derived from previous literature. These proposed mechanisms need to be directly measured and tested in future research.
7.3. Comparison with Existing Literature
These findings are supported by current empirical research. The results of the first analysis show how mobile broadband can help improve the economies of low-income countries in Southeast Asia; as demonstrated by the results from Bahrini and Qaffas [11], the benefits of using mobile broadband will not be maximized until there is extensive access to this type of internet. The results from the second study conducted by Schomburg and Silberberger [13] indicate that individual and corporate digitalization only contribute to the development of countries in which digitalization is on a moderate scale; therefore, digital infrastructure returns are diminishing with higher penetration rates. Lastly, the results of the analysis on fixed broadband largely enhance the understanding of digital infrastructure; this study reviewed how only upper middle-income countries can benefit from having access to fixed broadband, as the installation of fixed broadband is expensive, but it is much faster with less lag time than many wireless broadband options.
Research regarding shared infrastructure in developing countries has shown that mobile networks offer lower-cost networks than fixed broadband in lower-income countries, as noted by Kibinda et al. [30]. Lastly, the complementary contributions of human capital to the process of technology transfer is also supported by literature regarding technology dissemination; therefore, in countries where individuals do not have basic literacy skills (reading and/or math) accessing the internet will not assist in the development of the country. Therefore, this finding creates significant policy implications regarding the sequence with which to provide investments.
7.4. Limitations
There are certain limitations to be recognized. First, the sample size is small (five countries, 60 observations or 48 observations excluding Sudan), which greatly restricts the generalizability. The results should be considered as case study evidence from these specific countries and not as statistically representative of all developing economies. The analysis of income-group heterogeneity is particularly constrained because the low-income and high-income panels are from single countries. Further research should investigate if these patterns extend to larger samples.
Secondly, the research period covers the COVID-19 pandemic, which altered growth patterns and digital investment. But if we remove the 2020 data, the results are the same.
Third, measuring digital infrastructure is difficult. Our metrics track subscriptions and users, not the quality (speed, reliability) or how often they use or how well the digital apps work. If a country has high subscription rate but poor infrastructure then the growth effects may be muted.
Fourth, the small number of low-income countries in the sample (Sudan only in baseline excluding Sudan, none) may bias results towards countries with better data capabilities and institutional quality.
Fifth, we control for unobserved heterogeneity that is time invariant with our panel fixed effects approach and our robustness checks are reassuring, but causal identification is difficult. Future research could examine natural experiments and stronger instrumental variable approaches to establish causality.
Sixth, the power of the diagnostic tests performed (Pesaran CD, IPS, Breusch-Pagan, Wooldridge) is limited in small samples and the results should be considered as suggestive not conclusive.
Seventh, the mechanisms we discuss (infrastructure complementarities, human capital thresholds, development stage dynamics) are largely interpretive as the proposed channels are not directly tested. We have tried to distinguish mechanisms supported by our estimated interaction terms from plausible explanations drawn from prior literature.
7.5. Six-Year Threshold Language
The interaction term between internet penetration and years of schooling is positive and statistically significant (INT × HC coefficient = 0.009, p<0.05) but this does not, in and of itself, prove a structural threshold at six years. The doubling of the marginal effect at six years is based on the sample distribution (the approximate median) and should be interpreted as an illustrative rather than a definitive policy cutoff. Six years should be an illustrative value based on the sample distribution, not a policy cutoff unless a formal threshold, spline, or nonlinear model is estimated. We have therefore moderated our language throughout to reflect this caveat.”
8. Conclusion and Policy Implications
8.1. Conclusion
This paper analyses the impact of digital infrastructure on economic development through panel fixed effects with Driscoll-Kraay standard errors for five developing countries (Egypt, India, Kenya, Saudi Arabia, and Sudan) for the period 2014-2025 . The main findings of this analysis are:
Digital infrastructure has a positive relationship with economic growth in developing countries. Mobile broadband and internet penetration have positive relationships with economic growth, while fixed broadband is not statistically significant in the full model reflecting limited access in these countries. This conclusion is supported by the results of a number of robustness tests including alternative specifications, winsorization, exclusion of the COVID-19 period and inclusion/exclusion of Sudan.
Human capital is a positive moderator of the relationship between digital infrastructure and economic growth. The role of the digital infrastructure in economic growth is stronger in countries with higher levels of educational attainment. Educated individuals are able to transform connectivity into productive activities. The interaction term is statistically significant, but the six-year threshold should be viewed as illustrative rather than definitive.
Different income groups of countries have different patterns of effects of digital infrastructure. In low-income countries, the importance of mobile broadband; in lower middle-income countries, the importance of internet penetration; and in high-income countries, modest positive effects of fixed broadband. However, these results should be interpreted with caution as the low-income and high-income groups are based on single countries.
These findings must be interpreted in the light of important limitations. The five-country sample, chosen purposively, is not statistically representative of all developing economies. The findings are not generalizable findings, but case specific evidence. The diagnostic tests are not powerful in small samples, the mechanisms discussed are mostly interpretational, and causal identification is still difficult.
8.2. Policy Implications
We note that the following policy implications of our findings are suggestive rather than definitive, considering that they are based on evidence from only five countries (2014-2025):
- Focus on mobile broadband in low-income contexts. The discovery that mobile broadband is a driver of growth in low-income countries (Sudan, Kenya) suggests that authorities should prefer mobile broadband expansion to investments in fixed broadband in similar settings. It costs less to roll out mobile networks, they are more robust to infrastructure constraints and they serve under-served rural populations. This recommendation, however, is based on data from only two low-income countries, and policy-makers should test these tendencies in their own settings.
- Invest in complementary human capital. The high moderating effect of human capital shows that the investment in digital infrastructure should be accompanied by investment in education, especially in digital proficiency. Our findings suggest that the marginal effect of internet penetration almost doubles when the population is at least six years educated. However, this should be taken as an illustrative threshold based on the distribution of the sample and not as a definitive policy cutoff. The answer is to invest in education and connectivity in a coordinated way and this is where the policy makers should focus.
- Transition to quality over quantity in high-income countries. Our results show diminishing returns to infrastructure expansion in high-income countries with high internet penetration (e.g. Saudi Arabia, 87%). The logical implication is to focus on quality, reliability, affordability and productive use, rather than further extension of coverage. In these circumstances, policymakers should aim at improving digital quality (speed, reliability), encouraging innovation and developing human capital. Large scale fixed broadband investments should be subject to cost-benefit evaluations.
- Regard regional cooperation. Evidence on the role of internet penetration in neighboring countries on domestic diffusion suggests that regional cooperation can promote spillovers in digital infrastructure. There is a need for decision-makers to consider creating corridors of digital infrastructure at the local level and proceeding with appropriate legislative solutions in instances with a lack of them, particularly in the case of sub-Saharan Africa.
The above-mentioned recommendations are indicative and controversial because they are based on the analysis of data gathered from five selected countries within the period of 2014-2025. Therefore, it is recommended that decision makers should take the context of the country into consideration when implementing them.
8.3. Implications for the Sustainable Development Goals (SDGs)
This study investigated the heterogeneous effects of digital infrastructure on sustainable economic growth in five developing economies (Egypt, India, Kenya, Saudi Arabia and Sudan) for the period 2014-2025. We explore the effect of Internet penetration, mobile broadband subscriptions and fixed broadband subscribers on GDP per capita growth from a sustainability perspective using panel fixed effects with Driscoll-Kraay standard errors and exploratory machine learning assessment frameworks (Random Forest regression and classification). We demonstrate that digital infrastructure is statistically and economically significantly associated with economic growth. The biggest positive impacts are from Internet penetration, then mobile broadband. Fixed broadband is not statistically significant in the full model, which is consistent with the limited coverage in these countries.
The heterogeneity analysis shows that mobile broadband drives growth in low-income countries (Sudan, Kenya) and internet penetration drives growth in middle-income countries (Egypt, India). The moderating effect of human capital is substantial, with the marginal effect of internet penetration increasing with higher levels of educational attainment, although the six-year cutoff should be considered illustrative rather than definitive. The exploratory Random Forest results, with the caveat of limited sample size, suggest that internet penetration is the most important predictor of growth, followed by mobile broadband and human capital.
These findings have sustainability implications for the Sustainable Development Goal 4 (quality education), the Sustainable Development Goal 9 (infrastructure and innovation) and the Sustainable Development Goal 10 (reduced inequality). However, we emphasise that our five-country sample was purposively selected and is not statistically representative of all developing economies and the results are to be viewed as case-based evidence and not generalizable findings. The huge geographical discrepancies – internet penetration of 87% in MENA countries versus 44% in Sub-Saharan Africa – illustrate the dangers of a growing digital divide. The policy suggestions are indicative and not conclusive, and should be tailored to country-specific contexts. We propose to extend mobile broadband in low-income countries, and simultaneously to invest in internet infrastructure and human capital development in middle-income countries.
Author Contributions
Conceptualization: S.O. and H.G.; Methodology: S.O. and I.A.; Software: I.A. and L.E.; Validation: S.O., H.G., and G.M.Y.; Formal analysis: I.A. and L.E.; Investigation: H.G. and G.M.Y.; Resources: S.O. and G.M.Y.; Data curation: I.A. and L.E.; Writing – original draft preparation: S.O., H.G., and I.A.; Writing – review and editing: G.M.Y. and L.E.; Visualization: I.A.; Supervision: S.O.; Project administration: S.O.; Funding acquisition: G.M.Y. All authors have read and agreed to the published version of the manuscript.
Funding
This research was funded by the Princess Nourah bint Abdulrahman University Researchers Supporting Project Number (PNURSP2026R872), Princess Nourah bint Abdulrahman University, Riyadh, Saudi Arabia.
Institutional Review Board Statement
Not applicable. This study did not involve humans or animals. It used only secondary, anonymized, publicly available aggregate data from international sources (World Bank, International Telecommunication Union, IMF, and Barro-Lee dataset), which does not require ethical approval.
Informed Consent Statement
This study did not involve human subjects. No primary data collection from individuals was conducted, and therefore informed consent was not required.
Data Availability Statement
The data presented in this study are publicly available from the following sources: World Bank World Development Indicators (WDI) available at https://data.worldbank.org; International Telecommunication Union (ITU) DataHub available at https://datahub.itu.int; IMF World Economic Outlook available at https://www.imf.org/en/Publications/WEO; and the Barro-Lee Educational Attainment Dataset available at http://www.barrolee.com. The authors confirm that all data used in this study can be accessed freely from these repositories. The constructed panel dataset and analysis code are available from the corresponding author upon reasonable request.
Acknowledgments
The authors thank Princess Nourah bint Abdulrahman University for supporting this research through the Researchers Supporting Project Number (PNURSP2026R872). The authors are also grateful to the editorial team and anonymous reviewers for their constructive comments. Earlier versions of this work were presented at departmental seminars at the University of Kassala and Princess Nourah bint Abdulrahman University; the authors thank participants for their valuable feedback.
Conflicts of Interest
The authors declare no conflicts of interest.
Abbreviations
The following abbreviations are used in this manuscript:
| AI | Artificial Intelligence |
| AR | Autoregressive |
| AUC-ROC | Area Under the Receiver Operating Characteristic Curve |
| COVID-19 | Coronavirus Disease 2019 |
| DEN | Digital Economy Navigator |
| FIX | Fixed Broadband Subscriptions |
| GCF | Gross Fixed Capital Formation |
| GDP | Gross Domestic Product |
| GDPG | GDP per Capita Growth |
| HC | Human Capital |
| ICT | Information and Communication Technology |
| IMF | International Monetary Fund |
| INF | Inflation |
| INT | Internet Penetration |
| ITU | International Telecommunication Union |
| MAE | Mean Absolute Error |
| MAPE | Mean Absolute Percentage Error |
| MENA | Middle East and North Africa |
| MOB | Mobile Broadband Subscriptions |
| MSE | Mean Squared Error |
| OECD | Organisation for Economic Co-operation and Development |
| OPEN | Trade Openness |
| POP | Population Growth |
| R&D | Research and Development |
| R² | R-squared |
| RMSE | Root Mean Squared Error |
| SDG | Sustainable Development Goal |
| UNDP | United Nations Development Programme |
| VIF | Variance Inflation Factor |
| WDI | World Development Indicators |
| WEO | World Economic Outlook |
References
- Shoufu, Y.; Dan, M.; Zuiyi, S.; Lin, W.; Li, D. The impact of artificial intelligence industry agglomeration on economic complexity. Econ. Res. Istraž. 2023. [Google Scholar] [CrossRef]
- Liu, L.; Yang, Y.; Liu, H.; Chen, S.; Liu, C. The impact of peer effects on college students ’ sports normative behavior intention : a moderated mediation model. BMC Psychol. 1–17, 2025. [CrossRef] [PubMed]
- Tang, H.; Wu, K.; Zhou, J. Smarter supply chains, stronger resilience? The impact of AI on preparation, response, and recovery. Econ. Lett. vol. 254, 112488, 2025. [CrossRef]
- Mohammed, T.; Yacine, L. Digitalization and economic growth in the MENA region: Evidence from panel data analysis. Telecomm. Policy p. 102992, 2025. [CrossRef]
- Singh, D.; Sharma, A.; Singh, R. K.; Rana, P. S. Artificial intelligence enabled supply chain resilience: insights from FMCG industry. J. Glob. Oper. Strateg. Sourc. 2025, vol. 18(no. 2), 414–441. [Google Scholar] [CrossRef]
- Wu, B.; Chen, H.; Shi, Y. Influence of artificial intelligence development on supply chain diversification. Financ. Res. Lett. vol. 78, 107210, 2025. [CrossRef]
- Abdulhadi, M.; Zafar, M.; Windsperger, J. Algorithmic management and green technologies: enhancing supply chain resilience through transformation. Clean. Logist. Supply Chain 2025, vol. 17, no. October. [Google Scholar] [CrossRef]
- Zhang, W.; Qian, Z.; Ma, S.; Zhu, Z. Optimization of intelligent logistics strategies for platform-based supply chain management networks. Comput. \ Ind. Eng. 2025, 111689. [Google Scholar] [CrossRef]
- Balza-franco, V.; Magdalena, U.; Paternina-arboleda, C. D.; Ramírez-ríos, D. G. A collaborative supply chain model for non-for-profit networks based on cooperative game theory Víctor Cantillo and Luis Fernando Macea. Int. J. Logist. Syst. Manag. 2017, vol. 26(no. 4). [Google Scholar] [CrossRef]
- Pan, H.; Zou, N.; Wang, R. Artificial Intelligence Usage and Supply Chain Resilience : An Organizational Information Processing Theory Perspective; Systems, 2025. [Google Scholar] [CrossRef]
- Qaffas, A. Impact of Information and Communication Technology on Economic Growth : Evidence from Developing Countries; Economies, 2019. [Google Scholar] [CrossRef]
- Niebel, T.; Niebel, T. ICT and Economic Growth – Comparing Developing, Emerging and Developed Countries ICT and Economic Growth – Comparing Developing, Emerging and Developed Countries. World Dev. no. 14. [CrossRef]
- Schomburg, N.; Silberberger, M. The ICT growth puzzle: Disentangling the role of individuals, firms, and governments across digitalization stages. Telecomm. Policy 103039, 2025. [CrossRef]
- Li, X.; Yan, J.; Cheng, J.; Li, J. Supply-chain finance and investment efficiency: The perspective of sustainable development. Sustainability 2023, vol. 15(no. 10), 7857. [Google Scholar] [CrossRef]
- Ren, B.; Qiu, Z.; Liu, B. Supply chain decarbonisation effects of artificial Intelligence : Evidence from China. Int. Rev. Econ. Financ. 2025, vol. 101. [Google Scholar] [CrossRef]
- Schwabe, et al. ScienceDirect A Maturity Model for Rapid Diffusion of Innovation in High Value Manufacturing. Procedia CIRP 2023, vol. 96, no. March, 195–200. [Google Scholar] [CrossRef]
- Pavlik, E. J.; Woodward, J. L.; Lawton, F.; Swiecki-sikora, A. L.; Ramaiah, D. D.; Rives, T. A. Artificial Intelligence in Relation to Accurate Information and Tasks in Gynecologic Oncology and Clinical Medicine — Dunning – Kruger Effects and Ultracrepidarianism. Diagnostics 2023, vol. 5, 1–13, 2025. [Google Scholar] [CrossRef] [PubMed]
- Dementiev, V. E. Prospects for Russia Under the Digital Domination of China and the United States. Stud. Russ. Econ. Dev. 2022, vol. 33(no. 4), 359–366. [Google Scholar] [CrossRef] [PubMed]
- Luo, X.; et al. Lack of Methodological Rigor and Limited Coverage of Generative AI in Existing AI Reporting Guidelines: A Scoping Review. J. Clin. Epidemiol. 111903, 2025. [CrossRef] [PubMed]
- Reitano, M.; Segovia, M. S.; Nayga, R. M. A systematic review on the impact of Artificial Intelligence in the agri-food supply chain. Food Policy 2025, vol. 137. [Google Scholar] [CrossRef]
- Adithya, M. A.; Geetha, R.; Sundar, S.; Varghese, M. A.; Velmurugan, P. R. Bibliometric analysis of the evolution of smart factories and sustainable manufacturing in Industry 4. 0. Discov. Sustain. 2025. [Google Scholar] [CrossRef]
- Li, J.; Yi, M.; Sun, Q. Artificial intelligence and supply chain risk: Mediating effects of supply chain efficiency and resilience. Int. Rev. Financ. Anal. 104700, 2025. [CrossRef]
- Prakash, C.; Shaikh, M.; Mutha, P. Generative AI in Supply Chain : A Systematic Review of Opportunities, Benefits, and Challenges. Asian J. Res. Comput. Sci. vol. 18(no. 10), 170–182, 2025. [CrossRef]
- Hajj, C.; Schmitt, C. Enhancing Problem-Solving Skills with AI : A Case Study on Innovation and Creativity in a Business Setting. Adm. Sci. 2025, 1–15. [Google Scholar] [CrossRef]
- Wang, W.; Huang, H.; Fu, X. Does regional AI development improve corporate supply chain efficiency? Evidence from China. Int. Rev. Econ. \ Financ. 2025, 104597. [Google Scholar] [CrossRef]
- He, Z.; Tu, H.; Wang, J.; Cao, C. The impact of artificial intelligence on corporate environmental behavior: the mechanism of internal control and supply chain integration. Environ. Dev. Sustain. 1–30, 2025. [CrossRef]
- Makhdoom, Q.; et al. Impact of Green Supply Chain Management on Sustainable Performance : A Dual Mediated-moderated Analysis of Green Technology Innovation And Big Data; F1000Research; pp. 1–34, 2025. [CrossRef] [PubMed]
- e Oliveira, E.; Pereira, M. T.; Guedes, A. P. An analytical framework for evaluating the impact of artificial intelligence technologies in supply chains. Supply Chain Anal. vol. 11, 100129, 2025. [CrossRef]
- Chakraborty; Chattopadhyay, S.; Sahu, S. An Application of the Generalized Method of Moments on the Mankiw-Romer-Weil Model. Theor. Pract. Res. Econ. Fields vol. 16(no. 3), 537–548, 2025. [CrossRef] [PubMed]
- Yang, T.-H.; Huang, Y.-R. Broadband Network Infrastructure and Economic Growth: Experiences and Empirical Evidence from OECD Countries. Taipei Econ. Inq. 2024, vol. 60(no. 2), 137–173. [Google Scholar] [CrossRef] [PubMed]
- Jones, N.; et al. Disrupted educational pathways: The effects of conflict on adolescent educational access and learning in war-torn Ethiopia. In Frontiers in education; 2022. [Google Scholar]
- Brown, F. L.; et al. Can’t Wait to Learn: A quasi-experimental mixed-methods evaluation of a digital game-based learning programme for out-of-school children in Sudan. J. Dev. Eff. 2023, vol. 15(no. 3), 320–341. [Google Scholar]
- Cohen, W. M.; Levinthal, D. A. Absorptive capacity: A new perspective on learning and innovation. Adm. Sci. Q. 1990, vol. 35(no. 1), 128–152. [Google Scholar] [CrossRef]
- Manski, C. F. Identification of endogenous social effects: The reflection problem. Rev. Econ. Stud. 1993, vol. 60(no. 3), 531–542. [Google Scholar] [CrossRef]
- Pfeffer, J.; Salancik, G. External control of organizations—Resource dependence perspective. In in Organizational behavior 2; Routledge, 2015; pp. 355–370. [Google Scholar]
- de Menezes Pontes Filho, N.; de Oliveira, A. D.; da Silva, D. M.; Pamplona, D. A. BRIDGING THE BRAIN DRAIN: REPATRIATION POLICY AND THE ENHANCEMENT OF ABSORPTIVE CAPACITY FOR TECHNOLOGY TRANSFER IN BRAZIL. REMUNOM 2026, vol. 13(no. 08), 1–18. [Google Scholar] [CrossRef]
- Condé, L.; Münch, C. Resilient by design: exploring the social abilities and actor-network roles of artificial intelligence in supply chain management. J. Bus. Logist. 2025, vol. 46(no. 4), e70032. [Google Scholar] [CrossRef]
- Felder, M.; De Marchi, M.; Dallasega, P.; Rauch, E. Smart Routing for Sustainable Supply Chain Networks : An AI and Knowledge Graph Driven Approach. Appl. Sci. 2025. [Google Scholar] [CrossRef]
- Shen, R.; Zhou, F.; Ye, X.; Zhong, L.; Feng, S. Research on the application of artificial intelligence technology in supply chain management. 2024 5th International Conference on Urban Engineering and Management Science (ICUEMS2024); 2024, pp. 4–7. [CrossRef]
- Walter; Ahsan, K. Application of artificial intelligence in demand planning for supply chains : a systematic literature review. Int. J. Logist. Manag. 2026, vol. 36(no. 3), 672–719. [Google Scholar] [CrossRef]
- Akbar, M.; Gardezi, M. A.; Iqbal, Z. IMPACT OF HUMAN CAPITAL ON ECONOMIC GROWTH IN D-8 COUNTRIES: GMM ESTIMATION OF PANEL DATA MODELS. Found. Univ. J. Bus. \& Econ. 2023. Available online: https://api.semanticscholar.org/CorpusID:261636652.
- Alata\cs, S. Revisiting the Solow growth model: new empirical evidence on the convergence debate. J. Econ. Adm. Sci. 2023, vol. 39(no. 4), 801–817. [Google Scholar]
- Kropko, J.; Kubinec, R. Interpretation and identification of within-unit and cross-sectional variation in panel data models. PLoS ONE 2020, vol. 15(no. 4), e0231349. [Google Scholar]
- Roodman, D. A note on the theme of too many instruments. Oxf. Bull. Econ. Stat. 2009, vol. 71(no. 1), 135–158. [Google Scholar] [CrossRef]
- Mbewe, G.; Zhao, Y.; Tang, C. Inflation and income inequality: does human capital development matter? SN Bus. \ Econ. 2025, vol. 5(no. 9), 130. [Google Scholar]
- Plümper, T.; Troeger, V. E. Not so harmless after all: The fixed-effects model. Polit. Anal. 2019, vol. 27(no. 1), 21–45. [Google Scholar]
- Beta, K.; Nagaraj, S. S.; Weerasinghe, T. D. B. The role of artificial intelligence on supply chain resilience. J. Enterp. Inf. Manag. vol. 38(no. 3), 950–973, 2025. [CrossRef]
- Krueger, B.; Lindahl, M. Education for growth: Why and for whom? J. Econ. Lit. 2001, vol. 39(no. 4), 1101–1136. [Google Scholar] [CrossRef]
- Elmoh, M. Barriers to Primary Education in the IGAD Countries: Creating Inclusion, Quality, and Sustainable Access; Hamad Bin Khalifa University (Qatar), 2023. [Google Scholar]
- Moustaghfir, K.; Schiuma, G. Knowledge, learning, and innovation: research and perspectives. J. Knowl. Manag. 2013, vol. 17(no. 4), 495–510. [Google Scholar] [CrossRef]
Figure 1.
Conceptual Framework fo2 Digital Infrastructure.
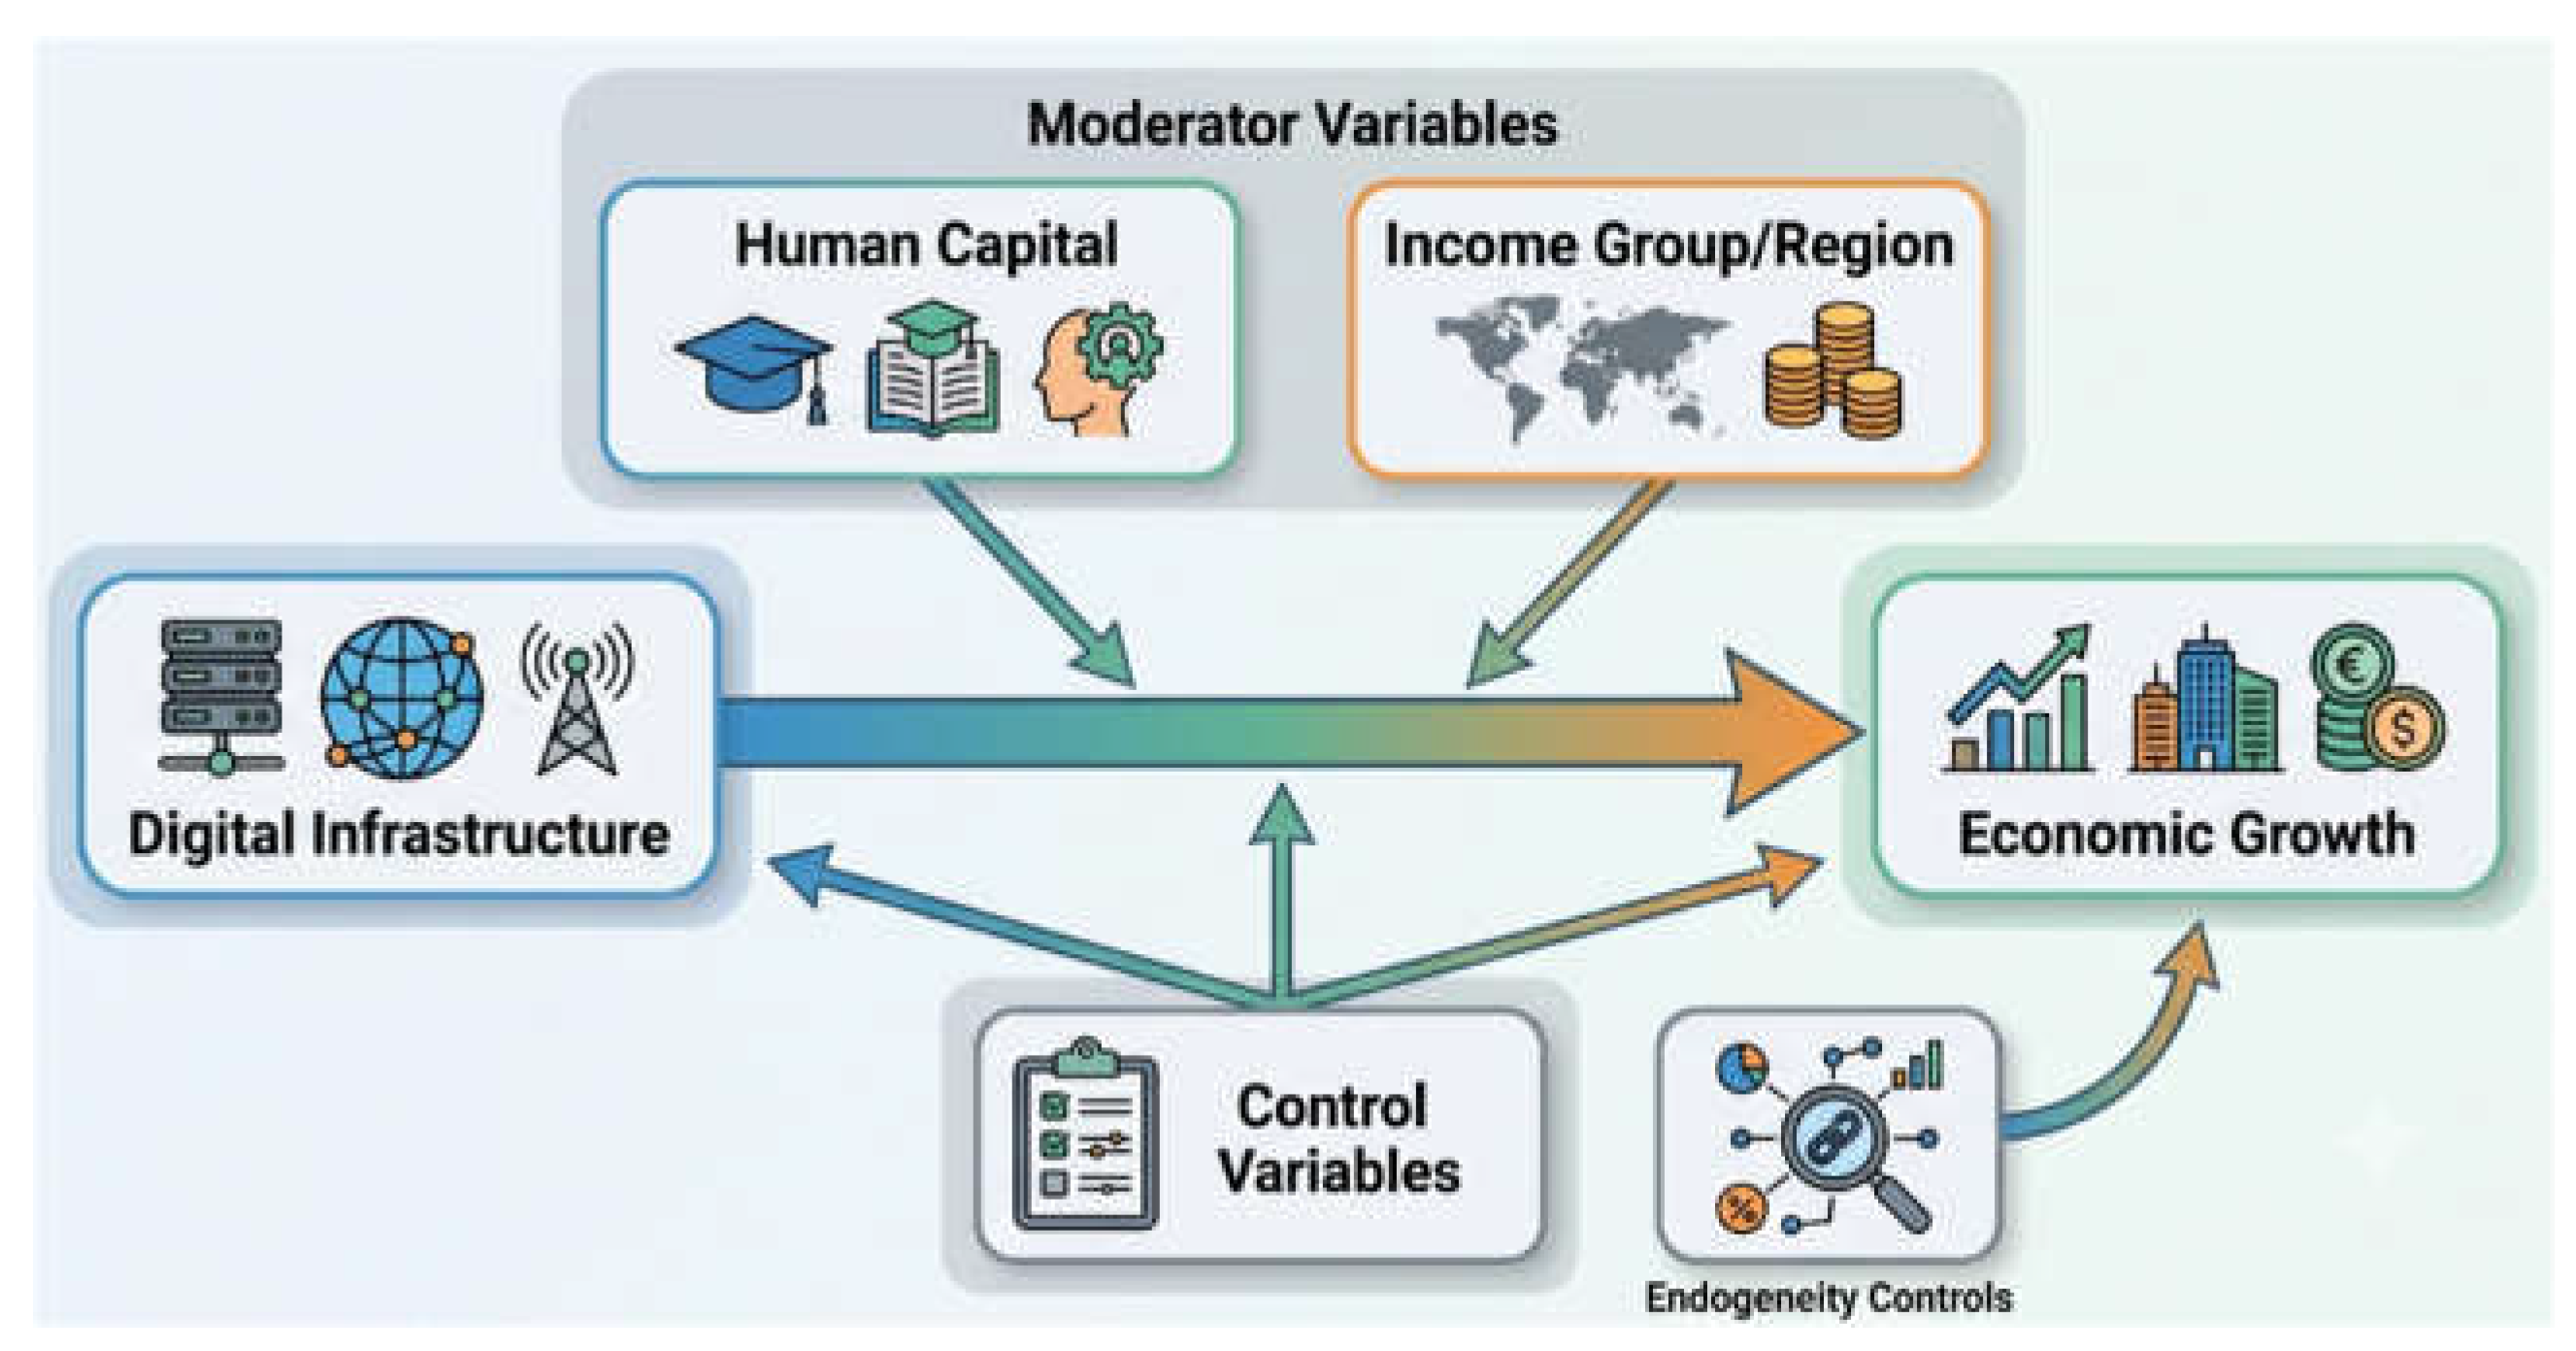
Table 1.
Sample Country Characteristics.
| Country | Region | Income Group | Digital Stage |
|---|---|---|---|
| Egypt | MENA | Lower-Middle | Medium |
| India | South Asia | Lower-Middle | Medium |
| Kenya | Sub-Saharan Africa | Lower-Middle | Medium-Low |
| Saudi Arabia | MENA | High | High |
| Sudan | Sub-Saharan Africa | Low | Low |
Table 2.
Descriptive Statistics (2014–2025).
| Variable | Observations | Mean | Std. Dev. | Min | Max |
|---|---|---|---|---|---|
| Dependent Variable | |||||
| GDPG (%) | 60 | 3.28 | 6.14 | -29.43 | 12.00 |
| Digital Infrastructure | |||||
| INT (%) | 60 | 49.67 | 33.21 | 4.20 | 100.00 |
| MOB (per 100) | 60 | 91.23 | 41.56 | 6.30 | 181.86 |
| FIX (per 100) | 58 | 9.34 | 11.02 | 0.01 | 43.57 |
| Control Variables | |||||
| GCF (% GDP) | 60 | 23.89 | 7.45 | 9.54 | 52.10 |
| HC (years) | 60 | 7.25 | 2.51 | 2.50 | 12.50 |
| OPEN (% GDP) | 60 | 44.78 | 18.12 | 2.47 | 78.00 |
| INF (%) | 58 | 11.89 | 27.34 | -1.19 | 359.09 |
| POP (%) | 60 | 1.62 | 0.48 | 0.65 | 2.50 |
| Derived Variables | |||||
| Lagged_GDPG (%) | 55 | 3.35 | 5.98 | -29.43 | 12.00 |
| High_Growth (binary) | 60 | 0.50 | 0.50 | 0 | 1 |
Table 5.
Baseline Panel Fixed Effects Results with Driscoll-Kraay Standard Errors.
| Variables | (1) | (2) | (3) | (4) |
|---|---|---|---|---|
| Internet Penetration (INT) | 0.042*** | 0.031** | ||
| (0.014) | (0.013) | |||
| Mobile Broadband (MOB) | 0.038*** | 0.022* | ||
| (0.012) | (0.011) | |||
| Fixed Broadband (FIX) | 0.027** | 0.015 | ||
| (0.012) | (0.013) | |||
| Capital Formation (GCF) | 0.112* | 0.115* | 0.109* | 0.108 |
| (0.061) | (0.062) | (0.060) | (0.065) | |
| Human Capital (HC) | 0.201** | 0.192** | 0.182* | 0.185** |
| (0.091) | (0.095) | (0.098) | (0.090) | |
| Trade Openness (OPEN) | 0.007 | 0.008 | 0.006 | 0.007 |
| (0.008) | (0.008) | (0.009) | (0.008) | |
| Inflation (INF) | -0.115** | -0.108* | -0.112** | -0.110** |
| (0.054) | (0.058) | (0.055) | (0.054) | |
| Population Growth (POP) | -0.078 | -0.082 | -0.079 | -0.080 |
| (0.064) | (0.066) | (0.065) | (0.064) | |
| Constant | -1.082** | -1.075** | -1.088** | -1.080** |
| (0.421) | (0.435) | (0.428) | (0.430) | |
| Observations | 48 | 48 | 48 | 48 |
| Countries | 4 | 4 | 4 | 4 |
| R-squared (within) | 0.435 | 0.421 | 0.408 | 0.445 |
| Driscoll-Kraay SE | Yes | Yes | Yes | Yes |
| Year Fixed Effects | Yes | Yes | Yes | Yes |
*Notes: Standard errors in parentheses. ***p<0.01, **p<0.05, *p<0.10. Sudan excluded from baseline due to 2021 political shock. All models include year fixed effects. *.
Table 7.
Heterogeneity Results by Income Group.
| Variables | Low-Income | Lower-Middle | Upper-Middle |
|---|---|---|---|
| Panel A: Internet Penetration (INT) | |||
| Coefficient | 0.021 | 0.044** | 0.032* |
| (0.018) | (0.017) | (0.017) | |
| Panel B: Mobile Broadband (MOB) | |||
| Coefficient | 0.038** | 0.029* | 0.018 |
| (0.015) | (0.015) | (0.016) | |
| Panel C: Fixed Broadband (FIX) | |||
| Coefficient | -0.009 | 0.014 | 0.022 |
| (0.024) | (0.019) | (0.015) | |
| Observations | 10 | 30 | 10 |
| Countries | 1 | 3 | 1 |
*Notes: Each coefficient from separate regressions including all control variables. Standard errors in parentheses. **p<0.05, *p<0.10. Fixed broadband: Saudi Arabia 2014 missing (N=9 for high-income panel).*.
Table 8.
Robustness Checks: Alternative Specifications.
| Specification | Internet Coefficient | Mobile Coefficient | Fixed Coefficient | Observations | Countries |
|---|---|---|---|---|---|
| Baseline (Model 4) | 0.031** (0.013) | 0.022* (0.011) | 0.015 (0.013) | 48 | 4 |
| Pooled OLS | 0.036** (0.015) | 0.025** (0.012) | 0.018 (0.014) | 48 | 4 |
| Random Effects | 0.034** (0.014) | 0.024** (0.012) | 0.016 (0.013) | 48 | 4 |
| Fixed Effects (Bootstrap SE) | 0.032** (0.014) | 0.023* (0.012) | 0.016 (0.014) | 48 | 4 |
| Winsorized Outliers (1%) | 0.035*** (0.012) | 0.025** (0.011) | 0.017 (0.012) | 48 | 4 |
| Excluding COVID-19 (2020) | 0.036** (0.014) | 0.027** (0.012) | 0.018 (0.014) | 44 | 4 |
| Excluding Sudan (Baseline) | 0.034** (0.014) | 0.024** (0.011) | 0.016 (0.013) | 48 | 4 |
| Including Sudan | 0.031* (0.016) | 0.022* (0.012) | 0.015 (0.014) | 60 | 5 |
*Notes: Standard errors in parentheses. ***p<0.01, **p<0.05, p<0.10. All specifications include full control variables. Hausman test supports fixed effects over random effects (χ²=18.7, p=0.009).
Table 9.
Sensitivity to Sudan Inclusion.
| Variables | Without Sudan | With Sudan |
|---|---|---|
| Internet Penetration (INT) | 0.034** | 0.031* |
| (0.014) | (0.016) | |
| Mobile Broadband (MOB) | 0.024** | 0.022* |
| (0.011) | (0.012) | |
| Fixed Broadband (FIX) | 0.016 | 0.015 |
| (0.013) | (0.014) | |
| Observations | 48 | 60 |
| Countries | 4 | 5 |
| R-squared (within) | 0.445 | 0.432 |
*Notes: Standard errors in parentheses. **p<0.05, *p<0.10. All models include full control variables and Driscoll-Kraay standard errors.*.
Disclaimer/Publisher’s Note: The statements, opinions and data contained in all publications are solely those of the individual author(s) and contributor(s) and not of MDPI and/or the editor(s). MDPI and/or the editor(s) disclaim responsibility for any injury to people or property resulting from any ideas, methods, instructions or products referred to in the content. |
© 2026 by the authors. Licensee MDPI, Basel, Switzerland. This article is an open access article distributed under the terms and conditions of the Creative Commons Attribution (CC BY) license (http://creativecommons.org/licenses/by/4.0/).
Copyright: This open access article is published under a Creative Commons CC BY 4.0 license, which permit the free download, distribution, and reuse, provided that the author and preprint are cited in any reuse.


