

Submitted:
13 June 2026
Posted:
15 June 2026
You are already at the latest version
Abstract
Sorghum (Sorghum bicolor L. Moench) is a key cereal for rainfed and drought-prone agro-ecosystems due to its C4 physiology and genetic diversity for stress adaptation. Drought tolerance in sorghum emerges from coordinated trait networks involving phenology, canopy development, transpiration regulation, photosynthetic resilience, and root-mediated water capture, rather than single traits. This review synthesises understanding of these interconnected mechanisms. Despite strong physiological knowledge, largescale deployment of drought-adaptive traits remains limited by phenotyping bottlenecks, particularly for dynamic and below-ground processes. We evaluate advances in remote and proximal sensing as scalable phenotyping tools, including multispectral and hyperspectral imaging, LiDAR, thermal sensing, and solar-induced fluorescence, with emphasis on their ability to detect early drought responses. We highlight the role of radiative transfer models such as PROSAIL (PROSPECT + Scattering by Arbitrarily Inclined Leaves) and SCOPE (Soil Canopy Observation, Photochemistry and Energy Fluxes) in linking spectral observations to key above-ground traits, including leaf area index, chlorophyll content, photosynthetic capacity, and plant water status. These approaches also enable indirect inference of below-ground function. Finally, we discuss emerging hybrid frameworks integrating sensing, modelling, and machine learning to link canopy signals with root function, providing a pathway toward physiology-informed, predictive breeding for improved drought resilience under climate variability.
Keywords:
drought adaptation
; high-throughput phenotyping
; machine learning
; radiative transfer modelling
; remote sensing
; sorghum
1. Introduction
Climate variability and the increasing frequency of drought events pose a major challenge to global crop production, particularly in rainfed agricultural systems where yield depends strongly on seasonal water availability. Rising temperatures and shifts in rainfall patterns are expected to increase the intensity and unpredictability of drought stress, making the development of drought-resilient cropping systems a key priority for ensuring food security [1]. Drought adaptation in crops is not controlled by a single trait but is an emergent property of the interaction of multiple physiological and developmental processes. These include phenological timing, canopy development, transpiration regulation, photosynthetic performance, and root-mediated water uptake (Figure 1). Their effectiveness depends not only on individual expression but also on how they are coordinated across growth stages and in response to water limitation. For example, in sorghum, the well-studied stay-green phenotype reflects an integrated drought-adaptive strategy linking canopy development, water capture, and water use, leading to sustained photosynthetic function during grain filling and consequently reducing carbon stress-induced senescence. [2,3].
Despite advances in plant physiology and genetics, the deployment of drought-adaptive traits in breeding programs remains constrained by phenotyping limitations. Many key traits, particularly those related to root function, water-use dynamics, and temporal stress responses, are difficult to measure non-destructively and at scale under field conditions. Traditional phenotyping approaches are often labour-intensive and limited to single time points, restricting their ability to capture the dynamic nature of crop responses to drought across environments [4,5].
Advances in remote and proximal sensing technologies provide new opportunities to address these challenges. Multispectral and hyperspectral imaging, thermal sensing, LiDAR, and solar-induced chlorophyll fluorescence enable high-throughput monitoring of canopy structure, biochemical properties, and physiological status across spatial and temporal scales. These technologies enable repeated, non-destructive measurement of crop traits under field conditions, supporting large-scale phenotyping. However, sensor-derived observations alone provide limited biological interpretation and often lack transferability across environments without retraining. Integrating these data within a mechanistic framework is therefore essential for generating biologically meaningful insights [6].
As such, radiative transfer models (RTMs) link spectral observations to plant traits by simulating radiation interactions within leaves and canopies. Models such as PROSAIL and SCOPE are widely used to retrieve key variables including leaf area index, chlorophyll content, canopy temperature, and photosynthetic activity from remote sensing data [7,8]. When combined with machine learning approaches, these models enable scalable retrieval of physiologically meaningful traits, while maintaining a connection to underlying biological processes. These hybrid frameworks enable process-based phenotyping rather than purely empirical prediction. However, a major frontier is the integration of above-ground sensing with below-ground trait inference. Root systems play a central role in drought adaptation through their capacity to acquire water from the soil profile. However, root growth and function are inherently influenced by the surrounding soil environment, including factors such as soil nutrients, texture, structure, compaction, bulk density, and water-holding capacity, which collectively determine water availability to plants [9,10]. This interaction between roots and soil presents a challenge for large-scale phenotyping, as both below-ground traits and soil heterogeneity contribute to drought responses. Emerging studies suggest that canopy spectral and thermal dynamics can reflect root-mediated water use, providing a potential pathway to infer below-ground function indirectly using above-ground observations [11,12].
In this context, sorghum (Sorghum bicolor L. Moench) provides a valuable system for studying drought adaptation. As a C4 cereal widely grown in arid and semi-arid environments, sorghum exhibits substantial genetic variation in traits related to water use, canopy function, and root architecture. While previous studies primarily focused on above-ground traits or individual sensing approaches, this review synthesises the available literature (Supplementary Figure S1) to highlight the mechanistic links between canopy responses and below-ground function. This framework highlights opportunities to infer root-mediated water acquisition and drought resilience from above-ground observations, thereby bridging the gap between sensor-derived signals and adaptive traits relevant to breeding. By framing phenotyping within a process-based, physiology-driven context, this review aims to bridging the gap between sensing, modelling and genomics, and outlines a pathway toward predictive, data-driven breeding for drought-prone environments.
2. Sorghum: Production, Distribution and Agronomic Importance
Sorghum is one of the world’s most important cereal crops, ranking fifth in global importance after wheat, rice, maize, and barley [13]. It plays a crucial role in arid and semi-arid regions, where it’s not only a staple food for millions but also widely used as animal feed. More recently, it is gaining traction as a promising bioenergy crop [14,15]. It is often referred to as the “king of millets”, is cultivated across a wide range of agro-ecological regions, including Africa, China, the United States, Mexico, and India [16]. Increasing attention has been directed towards sorghum as a food crop, driven by its favourable nutritional profile and functional health attributes [17,18]. While sorghum serves as a food for human consumption in many parts of Asia and Africa, its production in countries such as Australia, Brazil, and the United States is largely oriented towards livestock feed systems [19,20]. In Australia, sorghum is mainly grown in the north-eastern grain belt (Queensland and northern New South Wales) under rainfed conditions (Figure 2). Based on recent ABARES statistics [21], sorghum ranks as Australia’s dominant summer grain crop by production volume, accounting for approximately 65-70% of total summer grain output. Cultivation typically covers 0.5-0.7 million hectares annually, depending on seasonal rainfall, with national sorghum production in recent seasons has ranged between ~1.8 and 2.5 million tonnes, depending on seasonal conditions, placing it well below major winter cereals such as wheat (~25-30 Mt) but comparable to or exceeding other summer crops such as rice and grain maize.
The importance of sorghum in Australian farming systems extends beyond production volume. The crop is particularly well suited to the highly variable climatic conditions of northern Australia, where grain production is frequently constrained by erratic rainfall, recurrent drought events, and a strong reliance on soil water stored during fallow periods [22]. Across Queensland and northern New South Wales, water availability is often the primary determinant of crop productivity [23]. The ability of sorghum to efficiently utilise stored soil moisture and maintain productivity under intermittent heat and water stress makes it a relatively low-risk summer cropping option in these environments.
Descriptive statistics derived from FAOSTAT data indicate substantial variability in sorghum metrics in Australia [13]. The mean area harvested (~ 550,970 ha), production (~ 1,686,332 t), and yield (~ 2,952 kg ha-1) in the last ten years exhibited moderate to high dispersion, with coefficients of variation (CV) of 31.7%, 43.3%, and 22.5%, respectively. The comparatively higher CV for production suggests stronger year-to-year fluctuations compared to yield and harvested area. Overall, the decadal trend implies that variability in production is strongly influenced by interannual environmental variability, particularly rainfall patterns and timing of drought occurrence, rather than changes in cultivated area alone [24]. This highlights the importance of understanding how crops respond dynamically to water limitation across seasons. In this context, scalable phenotyping approaches that capture temporal canopy responses and water-use dynamics become essential for linking environmental variability to crop performance and drought adaptation.
4. Drought Adaptation in Sorghum
Sorghum’s adaptability across diverse tropical and sub-tropical regions is largely attributed to its C4 photosynthetic pathway, which confers high photosynthetic efficiency, superior water use efficiency and enhanced heat tolerance traits that are especially advantageous under conditions of climate variability and limited resources especially on marginal lands where other cereals frequently underperform [25,26,27]. On soils with good water-holding capacity, as in the majority of the sorghum productions areas in Australia, drought adaptation emerges from coordinated trait networks that regulate when water (i.e., sub-soil moisture) is used, how rapidly it is depleted and how effectively canopy function is maintained during grain filling. Genotypes vary in phenology, canopy architecture, water-use regulation and root water capture and these differences shape stress exposure and yield stability in these particular environments [2].
4.1. Growth Stages and Phenological Development of Sorghum
Sorghum phenology is typically described as a sequence of clearly identifiable growth stages spanning vegetative development, the transition to reproduction, grain filling, and physiological maturity. A widely used staging framework numbers development from emergence through key leaf-collar stages, flag leaf, booting, flowering (anthesis), and then soft dough, hard dough and physiological maturity (Figure 3), which helps standardise field observations and management timing across environments [28]. Progress through these stages is strongly regulated by temperature (via thermal time) and, in many genotypes, by photoperiod sensitivity: longer daylengths above a cultivar-specific threshold can delay floral initiation and extend the vegetative phase, shifting the timing of panicle initiation and anthesis [29]. Within the vegetative phase, leaf appearance rate (often summarised as the phyllochron, °C d per leaf) provides a practical link between canopy development and phenological timing, with sowing date and temperature regimes altering the thermal time to key transitions such as panicle initiation [30]. Because these phenological controls also shape leaf area dynamics and radiation capture, many process-based crop models represent sorghum development using thermal-time driven stages to simulate both phenology and canopy expansion across genotypes and environments [31,32].
4.2. Drought Timing Matters: Pre-Flowering vs Post-Flowering Stress
In rainfed systems, drought may occur early (restricting canopy expansion and biomass accumulation), around flowering (high risk for seed set), or after flowering (limiting grain filling and increasing lodging risk). Genome-wide association studies (GWAS) have shown that post-anthesis drought is particularly damaging for grain yield and lodging because it pushes the crop to remobilise stem carbohydrates, while simultaneously losing green leaf area (LA) and hence photo-assimilate supply [33]. This “timing” lens is crucial because the same trait can be beneficial or harmful depending on when water becomes limiting. A recent study showed that canopy size before flowering was only weakly and, in some cases, negatively, associated with visual leaf-senescence scores. In contrast, canopy traits related to green leaf area measured after flowering, were strongly and positively correlated with stay-green breeding values (r ≈ 0.7-0.8). This indicates that maintenance of green LA during the post-anthesis period, rather than differences in early canopy expansion, underpinned the functional stay-green phenotype in sorghum - at least in the populations examined in the study [34].
4.3. Phenology and Developmental Plasticity: Escaping the Worst of It
Phenotypic plasticity refers to the capacity of a single genotype to express different phenotypes across environments, through changes in development, morphology or physiology [35]. In drought-prone rainfed systems, this matters because the environment is not just “dry versus wet” but highly variable in when water becomes limiting, how evaporative demand evolves, and how rapidly soil water is depleted. Plasticity therefore shapes whether stress coincides with the most drought-sensitive physiological stages, particularly flowering and early grain set, versus the later grain filling stages. In sorghum, plasticity is commonly expressed through shifts in flowering time and plant stature across environments. A recent multi-environment field analyses have demonstrated substantial plastic responses for these traits across diverse germplasm, indicating that environmental responsiveness is under partial genetic control [36]. At the mechanistic level, sorghum phenology is strongly regulated by photoperiod and temperature, and variation in photoperiod sensitivity functions as an adaptive switch, allowing genotypes to delay floral initiation under long days, or accelerate under short days Thereby aligning flowering with more favourable rainfall and radiation regimes in the tropical environments that sorghum has involved in [37]. Sorghum grown at higher latitudes is usually converted to be photo-period insensitive by the introgression of maturity genes to allow flowering during long days [38]. These responses extend beyond simple developmental regulation, as changes in flowering influence canopy longevity, seasonal radiation capture, and the timing of maximum water demand. A recent simulation study using Agricultural Production Systems Simulator (APSIM) show that maturity class interacts with seasonal rainfall patterns, and that sowing date × maturity combinations can operate as drought escape or risk management strategies depending on whether stress occurs pre-flowering, at flowering, or during grain filling. [39]. Viewed in this context, these responses highlight phenological plasticity as a timing mechanism that determines whether drought-adaptive traits act synergistically or fail under stress. Its importance lies less in escaping drought entirely, and more in shaping how and when drought is experienced by the crop.
4.4. Stay-Green: The Flagship Trait, but Not Just About “Greener Leaves”
The most influential drought-adaptation phenotype in Australian sorghum breeding has been functional stay-green, defined by delayed leaf and stem senescence during grain filling under water limitation. The key insight from physiological dissection is that stay-green is not simply a “leaf colour” trait. It is an emergent outcome of seasonal water-use dynamics and canopy development that preserves green leaf area when it matters most, sustaining grain filling and reducing lodging risk [2,3]. Research conducted on near-isogenic lines carrying a major stay-green QTL (Stg1-Stg4) showed that these loci influence (a) canopy size and architecture, (b) leaf anatomy and (c) root growth and water uptake. And collectively shifting water use away from the pre-flowering to the post-flowering period, i.e., conserving water to maintain green leaf area and hence photosynthesis during grain filling [2]. Complementary work demonstrated that individual stay-green alleles can enhance yield under drought by modifying canopy development and water uptake patterns, reinforcing the idea that the mechanism is partly “water budgeting” across the season rather than a single leaf-level tolerance switch [3]. One consistent finding is that stay-green genotypes often achieve a smaller canopy at flowering (via reduced tillering and/or smaller upper leaves), which reduces early-season water use and increases the likelihood that water remains available during grain filling [40]. In sorghum therefore, the physiology associated with the stay-green trait points to a whole-crop resource allocation strategy: conservative water use early, sustained function later.
4.5. Root Systems: Water Capture, Geometry and “Where” Uptake Happens
Avoidance of drought stress also depends heavily on the root system’s ability to access water at depth and later in the season. For sorghum, deep and effective rooting is frequently invoked, but the breeding-relevant question is more specific: which root architectures reliably translate into higher grain yield under late-season drought? Recent works link stay-green phenotypes to root traits such as greater root length in deeper layers and favourable nodal root angles. Experiments comparing stay-green with senescent genotypes showed that stay-green lines have greater root length in deeper soil profiles and a more conservative transpiration response under stress, supporting improved performance under reproductive-stage drought [41,42]. Therefore, in practical terms, roots contribute in two coupled ways: firstly, access: depth and distribution determine whether water remains available after flowering. Secondly, timing: interaction with canopy demand determines whether deep water is “saved” or “spent” too early. Therefore, root traits and canopy traits are best treated as a coordinated phenotype rather than independently optimised modules.
4.6. Water-Saving Traits: Transpiration Control Under High Evaporative Demand
In hot, dry air (high vapour pressure deficit, VPD), crops can lose water rapidly even when soil moisture is not yet limiting. A potentially valuable adaptation is limited transpiration (LT) at high VPD: stomata restrict water loss once atmospheric demand crosses a threshold, conserving soil water for later stages. An APSIM modelling study showed that breeding for LT could increase sorghum yield in drought-prone regions [43] with similar benefits reported in wheat [44]. Empirical studies in sorghum also point to meaningful genetic variation in transpiration response and its link to drought adaptation, although expression can be environment-dependent and may interact with soil hydraulic properties and canopy conductance [45]. The breeding challenge is that “water saving” can reduce carbon gain if stomata close too early or too strongly. The sweet spot is water saving that reallocates water use toward grain filling without collapsing assimilation.
4.7. Photosynthesis, Stomata, Hydraulics, and Intrinsic Water Use Efficiency
At the leaf level, drought adaptation involves stomatal regulation, maintenance of photosynthetic capacity, photoprotection, and hydraulic function. A recent physiology study examined intrinsic water use efficiency (iWUE) and found that some sorghum genotypes maintain iWUE under water stress by maintaining photosynthetic capacity, with links to aquaporin-associated haplotypes [46]. Aquaporins have been linked with the hydraulic movement of water. It also reinforces that drought adaptation is not purely stomatal but biochemical capacity and hydraulic pathways influence whether plants can keep assimilating when conditions tighten. Genetic studies also support substantial natural variation in photosynthetic traits under water limitation, offering targets for mapping and selection [47]. Functional stay-green emerges from the integration of reduced early-season water use, improved regulation of transpiration under high evaporative demand, maintenance of photosynthetic capacity during grain filling and access to deep soil water through root system architecture. Together, these traits determine when water is used, how rapidly it is depleted, and whether water availability is sustained to support post-anthesis canopy function and grain filling under drought.
4.8. Operationalising Drought-Adaptive Trait Networks
Collectively, drought adaptation in sorghum arises from coordinated regulation of canopy architecture, seasonal water use, photosynthetic function, senescence dynamics and root-mediated water capture. These processes determine when water is expended, how efficiently carbon is assimilated per unit water lost and whether functional leaf area is maintained to support grain filling under late season drought. Reviews on genomics-assisted sorghum improvement outline how phenology, stay-green, transpiration efficiency and root traits can be integrated through marker-assisted and genomic selection pipelines, providing a pathway to intentionally select for adaptive response patterns rather than single time-point traits [48]. However, stay-green can arise through multiple mechanisms. While enhanced water capture and conservative water use may contribute to improved drought adaptation, similar phenotypes can also result from reduced carbon demand associated with smaller canopies or lower yield potential. Consequently, breeding efforts should focus on identifying the physiological processes underpinning functional stay-green rather than selecting solely for the phenotype itself. Many key processes are inherently temporal and environment-dependent, making them challenging to capture using conventional phenotyping approaches. This creates a critical need for scalable tools that can quantify these dynamic responses in real time. Remote and proximal sensing technologies provide a pathway to address this gap by enabling continuous, high-throughput monitoring of canopy-level responses that are functionally linked to underlying physiological processes, thereby supporting their integration into breeding pipelines.
5. Remote Sensing in Agriculture: A Morphological, Biochemical and Physiological Phenotyping Framework
5.1. Evolution of Remote Sensing as a Tool for Enhancing Functional Phenotyping
Optical remote sensing exploits the fact that canopy reflectance is shaped by leaf biochemistry and canopy structure. The earliest use of satellite remote sensing in crop studies relied on coarse-resolution multispectral imagery from Landsat and NOAA platforms [49,50]. The evolution of remote sensing from coarse-resolution satellite observations to high-temporal, -spatial and -spectral resolutions, multi-sensor phenotyping platforms onboard UAVs now enables the accurate capturing of crop dynamics across spatial and temporal scales. Early work relied on aerial photography (initially balloon-based), with the first successful aerial photograph commonly traced to 1858 by Gaspard-Félix Tournacho - his pseudonym Nadar [51]. Space-based Earth observation accelerated in the 1960s with meteorological satellites, including TIROS-1 (launched 1 April 1960), which enabled synoptic monitoring of weather systems relevant to crop risk and drought surveillance [52]. NASA reports that the decisive step for agricultural applications came with Landsat 1 (ERTS-1) in 1972, which established systematic multispectral monitoring of Earth’s land surface and underpinned decades of land and crop observation [53].
While these early satellite systems provided proof of concept for quantitative crop monitoring, their spatial resolution (tens of metres), revisit frequency and vulnerability to cloud cover limited their direct utility for breeding-scale phenotyping [5]. To address these constraints, proximal and ground-based sensing platforms were developed in the late 1990s and early 2000s, including tractor-mounted sensors and field phenotyping carts that enabled high-resolution, plot-scale measurement of canopy spectral and thermal properties [54]. These systems provided precise physiological data but remained constrained by logistical challenges, limited throughput and reduced operational feasibility under tall canopies or wet soil conditions.
The advent of lightweight unmanned aerial vehicles (UAVs) in the last decade has transformed crop phenotyping by combining high spatial resolution, flexible deployment and multi-sensor integration. UAV platforms can acquire centimetre-scale multispectral, thermal and hyperspectral imagery, allowing on-demand, repeatable observation of breeding trials and production fields [55,56]. UAV-based phenotyping has been demonstrated across cereals, including sorghum, enabling quantification of canopy development, senescence progression, canopy temperature and biomass proxies under water-limited environments [57,58,59,60].
Modern platforms can carry multiple sensor types like multispectral + thermal + LiDAR (Table 1). Providing a rich range of datasets e.g., spectral indices reflect leaf chlorophyll and water content, while thermal imagery reveals whether the canopy is undergoing evaporative cooling or experiencing stress, and LiDAR or photogrammetry gives plant height and structural traits. Integrating these can provide a holistic picture of plant performance under drought [6]. Moreover, image analysis and machine learning can automatically extract features (like counting heads or measuring leaf angles) with consistency and high precision [61,62].
An emerging approach is the integration of these sensors into tractor-mounted high-throughput (HTTP) platforms, such as GECKO (Genotype and Environment Characterisation through Kinetic Observation), which allows comprehensive evaluation of important plant traits. The platform incorporates a Headwall NANO-Hyperspec pushbroom hyperspectral sensor and an Ocean Optics USB2000+ spectrometer. The NANO sensor acquires 640 spatial pixels and 270 spectral bands per scan across the 400-1000 nm spectral range with a bandwidth of approximately 6 nm, enabling detailed characterization of canopy spectral properties. In contrast, the Ocean Optics USB2000+ measures irradiance (down welling) across a broader spectral range (200-1100 nm) with configurable spectral resolution (~0.1-10 nm), providing reference measurements for reflectance calculations. During field operation, the NANO and Ocean Optics sensors were positioned approximately 3 m and 0.5 m above the canopy, respectively, while the platform travelled at a constant speed of approximately 1.1 m s-1 [73,74].
Collectively, these studies demonstrate that multi-sensor integration consistently improves trait retrieval accuracy, reinforcing the importance of combining structural, spectral and thermal information for robust phenotyping under field conditions. Transforming data collected from these sensors into meaningful and actionable information remains a critical area of research.
5.2. Spectral Reflectance as a Proxy for Canopy Structure, Chlorophyll Dynamics and Physiological Traits
Energy from the sun interacts with plant canopies across the electromagnetic spectrum, where incoming radiation can be absorbed, reflected, transmitted or re-emitted depending on leaf biochemical and structural properties.
- i)
- Optical remote sensing: At the leaf level, pigments such as chlorophyll strongly absorb radiation in the blue (~400-500 nm) and red (~600-700 nm) regions for photosynthesis, while a substantial portion of near-infrared radiation (~700-1300 nm) is reflected or transmitted due to internal leaf structure and air-cell interfaces [75]. At canopy scale, these absorption, reflection and transmission processes are further influenced by leaf area, orientation, and canopy architecture, shaping the spectral signals observed by remote sensors [76,77]. Thus, reflectance in the visible and red-edge spectral regions is strongly controlled by chlorophyll concentration and green leaf area, while near-infrared reflectance is primarily governed by canopy architecture and internal leaf scattering [7]. Vegetation indices derived from these spectral domains therefore provide scalable proxies for biomass accumulation, canopy development and senescence dynamics. A seminal milestone was the development of the Normalised Difference Vegetation Index (NDVI) formulation for broad-area vegetation monitoring using ERTS-1 (Landsat-1) data. This demonstrated that spectral reflectance ratios could be quantitatively linked to vegetation greenness and green biomass at continental scale [49,50]. Beyond greenness and structure, remote sensing has increasingly enabled early detection of physiological stress before visible senescence occurs.
- ii)
- Solar-Induced chlorophyll Fluorescence (SIF): SIF is the faint red and far-red light emitted by chlorophyll molecules when absorbed solar energy is re-emitted during photosynthesis [78]. It directly reflects the efficiency of photosystem II and responds rapidly to down-regulation of photosynthesis under drought and heat stress. Space-borne and airborne studies have demonstrated that declines in SIF precede reductions in greenness and biomass, providing early warning of physiological stress in crops [79,80]. SIF has further been shown to track gross primary productivity and photosynthetic down-regulation under water limitation, establishing its value as a functional stress indicator rather than a structural proxy [81,82].
- iii)
- Thermal remote sensing: Thermal infrared (TIR) sensing operates in the ~3-14 μm region of the electromagnetic spectrum and differs fundamentally from visible and near-infrared observations because it measures emitted radiance rather than reflected solar energy. At typical Earth-surface temperatures, vegetation and soil emit strongly within the long-wave infrared window (~8-14 µm), which allows retrieval of land surface or canopy temperature from airborne and satellite sensors [83,84]. This region is particularly important because it coincides with atmospheric transmission windows where absorption by gases such as water vapour is relatively low, enabling surface thermal emission to reach sensors with minimal attenuation [85]. Operational platforms therefore position thermal bands within this window; for example, Landsat 8/9 TIRS acquires data around 10.6-12.5 µm, while ASTER provides multiple thermal bands between approximately 8.1 and 11.6 µm for detailed surface temperature retrieval [86,87,88].
From a physiological perspective, canopy temperature represents an integrative signal of plant water status because it is governed by the surface energy balance and the degree of transpiration-driven evaporative cooling. Under adequate soil moisture, open stomata support transpiration and maintain cooler canopy temperatures, whereas water limitation restricts transpiration and results in canopy warming relative to the surrounding environment [89,90]. Thermal observations therefore provide a functional indicator of stomatal conductance and crop water status. When combined with optical measures of canopy development, thermal data enable interpretable, process-relevant indicators of drought response across scales. For instance, thermal-greenness frameworks such as the Temperature-Vegetation Dryness Index (TVDI) integrate canopy temperature with spectral indices (e.g., NDVI) to quantify evaporative cooling capacity relative to canopy size and have been widely applied to assess soil and plant water stress across cropping systems [91,92,93].
Table 2 summarises some of the commonly applied spectral and fluorescence-based vegetation indices, their physiological interpretation and their relevance for breeding drought-adaptive sorghum genotypes. The metrics capture complementary components of canopy structure, chlorophyll dynamics, photosynthetic regulation, transpiration cooling, and plant water status, providing scalable proxies for functional traits such as stay-green expression, radiation use efficiency, canopy dehydration, and stress tolerance. In drought-adaptive sorghum phenotypes, these remotely sensed derivatives align closely with key physiological processes such as, (i) delayed senescence and sustained chlorophyll content underpinning stay-green expression, (ii) conservative transpiration behaviour influencing canopy temperature, and (iii) structural canopy traits determining radiation interception and soil water depletion trajectories [4,6,73,94].
Importantly, the temporal trajectories of these signals provide insight into the timing and progression of stress responses, which is central to understanding post-anthesis drought adaptation. Repeated measurements increase the precision and heritability of sensing metrics like NDVI or canopy temperature, since each plot’s response can be tracked across developmental stages or stress progression [104].
5.3. Proximal Leaf- and Canopy-Level Sensors
At the proximal scale, leaf- and canopy-level sensors complement remote and aerial observations by directly quantifying the physiological processes that underlie spectral and thermal signals. These instruments provide mechanistic measurements of photosynthesis, water status, and canopy structure that are essential for calibrating and interpreting remote sensing metrics. Handheld fluorometers and gas-exchange systems such as LI-600 enable simultaneous measurement of leaf temperature, stomatal conductance and chlorophyll fluorescence parameters. These variables are directly linked to canopy energy balance and SIF emission mechanisms (LI-COR Biosciences; [105]). Proximal chlorophyll fluorescence measurements (e.g., Fv/Fm, ΦPSII) have been widely used to diagnose photoinhibition and drought-induced down-regulation of photosynthesis and are mechanistically consistent with canopy-scale SIF responses [105,106]. In addition, proximal measurements of vapour pressure deficit (VPD) and leaf temperature provide direct context for interpreting thermal imagery and transpiration-based drought responses [90]. In addition to fluorescence and gas exchange, portable chlorophyll meters such as the SPAD-502 provide rapid, non-destructive estimates of leaf chlorophyll concentration, which is closely associated with nitrogen status and photosynthetic capacity [107]. Structural traits can also be quantified using proximal instruments; for example, Ceptometers and optical canopy analysers are widely used to estimate LAI from measurements of radiation interception, providing key information on canopy development and light-use efficiency [108,109]. Handheld thermal sensors and infrared thermometers further extend proximal measurements by directly capturing canopy or leaf temperature, which reflects stomatal conductance and transpiration-driven evaporative cooling. These measurements provide ground-truthed indicators of plant water status and help interpret thermal imagery acquired from UAV or satellite platforms [89,90].
Together, these advances demonstrate that modern remote and proximal sensing no longer merely quantify canopy greenness, but capture integrative physiological responses including photosynthetic regulation, evaporative cooling capacity and photochemical stress. These sensing-derived metrics therefore provide mechanistically interpretable proxies for drought adaptation processes, such as transpiration regulation, stay-green expression and photosynthetic resilience. This forms a critical foundation for high-throughput physiological phenotyping.
5.4. Remote Sensing Limitations and Challenges
- i)
- Environmental Influences and Data Quality: Remote measurements can be perturbed by external conditions and thus needs to be carefully considered when applied. For example, variations in lighting conditions due to cloud (shadows) and sun angle can affect reflectance data quality, requiring careful calibration [110]. In addition, changes in ambient weather conditions like wind can move plants and reduce the accuracy of height or temperature readings. For remote sensing from drones and high-resolution satellites, cloud cover and atmospheric effects remain a challenge for optical imagery. Thus, data correction and standardization are needed to ensure comparability across time and location [34].
- ii)
- Spatial Resolution vs. Scale Trade-offs: High-resolution platforms like UAVs cover relatively small areas per flight (e.g., a few tens of hectares) and have limited flight endurance [111,112]. Whereas satellites cover vast areas but with coarser resolution, though this is improving with newer constellations [113]. For breeding trials, UAVs or ground systems are often preferred for resolution, but they are labour-intensive to deploy repeatedly. Scaling phenotyping to hundreds of field sites may still rely on a combination of satellite or aerial imaging for broad coverage and drones for finer sampling [57,111,112].
- iii)
- Data Management and Processing: Remote sensing generates huge data volumes (hundreds of gigabytes of images). Processing these into meaningful trait data requires computational infrastructure and expertise in image analysis. Specialized software is needed for stitching images (orthomosaics), extracting indices, or building 3D models, and algorithms (sometimes machine learning) are needed to translate raw sensor data into trait values. Breeding programs often face a bottleneck in bioinformatics capacity to handle this “big data” [114,115].
- iv)
- Cost and Practicality: While the cost of drones and sensors has decreased [116], deploying them routinely still requires investment and training. Equipment maintenance, regulatory compliance (for UAV flight permissions), and field logistics (launching/landing drones, etc.) add complexity. In some cases, simpler tools (like ground handheld sensors or fixed cameras) might be easier to integrate even if throughput is lower. The optimal phenotyping tool thus depends on specific project needs and resource constraints [115,117].
Despite these challenges, the trend in plant phenotyping is clearly toward greater use of remote sensing. The consensus from all the above recent literature is that the pros of remote sensing (speed, scale, novel trait insights) greatly outweigh the cons, especially as technology improves (Table 3). In summary, remote sensing has evolved from a niche research tool to a central component of modern crop phenotyping, enabling breeders to select for complex adaptive traits with unprecedented precision.
While remote sensing enables high-throughput quantification of canopy structural, biochemical and thermal traits associated with drought adaptation, these observations remain largely descriptive unless interpreted within a process-based crop growth framework [132]. Vegetation indices and thermal metrics capture canopy state and stress expression, but do not directly resolve how traits influence soil water use, radiation interception, carbon assimilation and yield formation across environments. Process-based models like RTMs provide this mechanistic context by explicitly representing canopy development, transpiration, photosynthesis and soil-plant-atmosphere water balance. Integrating remotely sensed trait dynamics into process-based models therefore allows translation of spectral and thermal signals into functional drought-adaptive parameters, forming the conceptual basis for hybrid phenotyping frameworks.
Hybrid frameworks (Figure 4) that integrate hyperspectral observations, RTM, and machine-learning inversion offer a promising pathway for bridging the gap between sensor-derived signals and biologically meaningful plant traits. By embedding physical and physiological constraints within the modelling process, these approaches enable the mechanistically informed retrieval of drought-adaptive traits while reducing the reliance on purely empirical relationships. Consequently, RTM-ML frameworks can improve model interpretability, enhance transferability across environments, and mitigate equifinality commonly associated with data-driven approaches. This transforms remote sensing from a high-throughput screening tool into a physiological phenotyping platform capable of supporting trait discovery, genetic analysis, and predictive breeding for drought resilience.
6. Physics-Derived Traits Using Leave-Canopy Reflectance-Transmittance Models
6.1. Application of Radiative Transfer Models for Phenotyping
RTMs are physics-based representations of how solar radiation interacts with plant leaves and canopies, allowing the translation of remote sensing observables into interpretable biophysical and biochemical traits [7]. By simulating the absorption, transmission and scattering of radiation across multiple wavelengths, RTMs provide a principled framework to estimate canopy attributes such as LAI, chlorophyll content and leaf water content from optical and thermal data, thereby addressing key limitations of empirical vegetation indices which often saturate at high canopy density or vary with background and illumination conditions [7,133]. Figure 5 illustrates the concept of RTM: incoming solar radiation interacts with leaves and soil through absorption, scattering, and transmission, generating canopy and soil reflectance signals. These signals are captured by remote sensing platforms and used within RTMs to simulate robust reflectance realistic to the field data and generate look-up tables. Machine-learning or inversion approaches then retrieve plant traits such as LAI, chlorophyll content, and other physiological parameters for crop monitoring and improvement.
(i) PROSPECT-SAIL model:
Among RTMs, PROSAIL, the coupled combination of the leaf optical model PROSPECT [134] and the canopy reflectance model SAIL [135,136], has become the most widely used model for crop trait retrieval in phenotyping studies. PROSPECT represents leaf reflectance and transmittance as a function of leaf structure and pigment concentrations, while SAIL describes directional reflectance from canopy architecture under varying sun-sensor geometries [133]. PROSAIL’s capacity to simulate reflectance spectra across visible to shortwave infrared bands has made it a cornerstone of trait inversion studies in many crops. However, PROSAIL enables retrieval of LAI and chlorophyll content from remote and proximal sensing platforms with acceptable accuracy (e.g., R2 values often above 0.7-0.8 for LAI and chlorophyll) when calibrated with field measurements [7,137].
In practical phenotyping applications, PROSAIL inversion has been implemented using look-up tables, optimisation algorithms or machine learning emulators to link observed reflectance to trait combinations, providing estimates that would otherwise require laborious and destructive measurement [138]. As already mentioned, these trait-dynamics such as, LAI, pigment composition and canopy water content are central to stay-green expression, transpiration efficiency and radiation use efficiency in sorghum.
(ii) SCOPE model:
Another prominent radiative transfer model is Soil Canopy Observation, Photochemistry and Energy (SCOPE), a one-dimensional, vertically integrated model that couples radiative transfer with canopy energy balance processes [8]. Unlike purely optical radiative transfer models, SCOPE couples leaf and canopy radiative processes with photosynthesis, fluorescence emission, transpiration and thermal energy balance, enabling the simultaneous simulation of reflectance, thermal radiance and SIF [139,140]. The model calculates radiation transport through a multilayer canopy as a function of solar and viewing geometry, leaf optical properties and canopy structure, while the biochemical module is based on the photosynthesis formulations of [141,142] for C3 and C4 species respectively. This integration allows SCOPE to provide mechanistic links between canopy spectral signals and underlying physiological processes such as photosynthetic capacity, stomatal conductance and water stress. As a result, SCOPE has become an important tool for functional phenotyping, enabling retrieval of traits related to photosynthesis, canopy temperature and water use from optical, thermal and fluorescence observations. Thus, making RTM-based retrievals particularly pertinent for high-throughput phenotyping targets.
6.2. A Hybrid Approach of Remote Sensing and RTM for Phenotyping
Assimilation of RTM-derived traits into crop models has therefore emerged as a powerful strategy to bridge observation and simulation. For example, LAI retrieved through PROSAIL inversion has been assimilated into APSIM to improve wheat performance, demonstrating that RTM-based canopy traits can directly enhance crop model realism [143,144].
More recently, SCOPE-based retrieval of maximum carboxylation capacity (Vcmax) and SIF has enabled coupling of photosynthetic capacity with crop growth and carbon balance models in terrestrial systems at field scale [81,82]. These advances move phenotyping beyond greenness and structure toward true physiological parameterisation, allowing breeding programs to target radiation-use efficiency, transpiration efficiency and photosynthetic resilience as selectable traits. A seminal demonstration of this approach for sorghum and wheat breeding has been provided by [120] study integrating hyperspectral sensing, PRO4SAIL and SCOPE radiative transfer models, and machine-learning inversion for biochemical, structural and photosynthetic trait retrieval in sorghum breeding populations. Using airborne hyperspectral imagery, their framework retrieved LAI, chlorophyll content, carotenoids, anthocyanins and Vcmax at the plot scale with high accuracy (R2 up to 0.94 for chlorophyll and > 0.78 for Vcmax) and further demonstrated that inclusion of modelled solar-induced fluorescence improved physiological trait inversion under stress conditions. Another example of the utility of hybrid RTM–ML frameworks was provided by a study, which estimated wheat grain protein content (GPC) across 6,355 ha of commercial production systems using Sentinel-2 time-series data [145]. Through inversion of the PRO4SAIL model, key biophysical traits, including chlorophyll content, leaf water content, leaf dry matter, and LAI, were retrieved and subsequently used as inputs to machine-learning models. The gradient-boosting approach outperformed single-date models, demonstrating the advantage of exploiting temporal trait dynamics. Among the retrieved variables, leaf water content was identified as the most influential predictor of GPC under severe drought conditions, highlighting the capacity of RTM-derived traits to capture physiologically meaningful drivers of crop performance [145].
Overall, radiative transfer models add a theoretical backbone to high-throughput phenotyping. They allow estimation of canopy attributes like LAI, chlorophyll, photosynthetic parameters and water content from spectral data with known confidence and they facilitate phenotype-to-process linkages by connecting what sensors see to what crop models simulate. For sorghum, where breeding increasingly targets physiological efficiency (RUE, transpiration efficiency, etc.), RTM-based phenotyping offers a powerful means to quantify those target traits across breeding populations and environments. While substantial advances have been made over recent decades to develop scalable, non-destructive phenotyping tools for above-ground drought-adaptive traits, the below-ground component of drought adaptation remains far more difficult to characterise at breeding scale.
7. Remote Sensing and Root Traits: Sensing the Hidden Half
7.1. Linking Above-Ground Sensing with Canopy Radiative Transfer and Root Function
Roots constitute the primary interface between crops and soil water, yet field-based root phenotyping remains constrained by labour, cost and scalability [146]. Consequently, breeders have largely relied on indirect selection via canopy traits, despite strong evidence that root system architecture and functional root activity critically regulate drought resilience and yield stability in cereals, including sorghum [147]. Recent high-throughput field studies in sorghum have demonstrated that plasticity in functional root traits such as maximum rooting depth and root activity indices strongly influences yield stability across contrasting environments, confirming that root function is not only genetically variable but also a central driver of drought adaptation [131,148]. The development of scalable phenotyping tools for root traits has now become a major focus of current research. [149] assessed four non-destructive methods, electrical resistance tomography (ERT), electromagnetic induction (EMI), penetrometer resistance, and neutron-probe measurements of soil water content to estimate wheat root activity based on soil-drying patterns across three growing seasons. Among these approaches, ERT and penetrometer resistance showed the strongest relationships with soil matric potential and were able to consistently differentiate between wheat genotypes. In contrast, EMI performed well only under moderate soil moisture conditions and was more suitable as a rapid screening tool. Overall, the study concluded that penetrometer resistance and ERT are the most reliable methods for high-throughput phenotyping of root activity, while EMI can be used for quick assessments when soil conditions are not excessively dry.
Emerging research now indicates that above-ground remote sensing traits can serve as scalable proxies for root system function. In barley, UAV-derived vegetation indices combined with machine learning have been shown to accurately predict field-measured root distribution and root system architecture across large breeding populations, enabling indirect phenotyping of below-ground traits using canopy spectral information alone. This breakthrough demonstrates that canopy reflectance and thermal signals encode information about root-mediated water uptake and soil exploration, providing a viable pathway to link above- and below-ground phenotyping at breeding scale [12]. The study by [150] on wheat evaluated a Seri × Babax recombinant inbred wheat population under irrigated and late season drought conditions and found that cooler canopy temperatures during grain filling accounted for approximately 60% of the yield variation under drought. Canopy temperature was strongly negatively correlated with root dry weight at 90-120 cm (r = -0.76) and positively correlated with root mass at 60-120 cm (r ≈ 0.99), indicating that deeper rooting contributed to cooler canopies.
Together, these advances establish the conceptual foundation for multi-scale, hybrid phenotyping frameworks in which remotely sensed canopy traits, radiative transfer modelling and crop growth simulation can be integrated to infer root function non-destructively. While this approach remains under-explored in sorghum, the availability of high-throughput functional root phenotyping platforms creates a compelling opportunity to develop scalable, physiology-driven pipelines for linking canopy signals to root system performance under drought.
8. Robust Phenotyping Approaches Needed to Enhance the Selection of Elite Varieties
8.1. Genetic Architecture of Sensing-Derived Phenotypes
High-throughput phenotyping has fundamentally transformed the scale and resolution at which genetic analyses of drought adaptation can be conducted by enabling repeated, non-destructive measurement of physiologically relevant traits under field conditions. Unlike traditional phenotyping approaches, which rely on destructive sampling or subjective visual scoring and are therefore limited in temporal resolution and mapping power, remote sensing and model-assisted phenotyping allow canopy biochemical and photosynthetic traits to be treated as genetically analysable phenotypes. Hyperspectral sensing combined with radiative transfer modelling and machine learning has been particularly effective in this context. For example, a study demonstrated that key physiological traits in sorghum, including chlorophyll content, carotenoids, specific leaf nitrogen (SLN), leaf mass per area (LMA), and photosynthetic capacity parameters such as Vcmax, Vpmax and Jmax, can be accurately retrieved from canopy spectra using the partial least square regression method (R2 up to 0.93 for Vpmax) and exhibit moderate to high heritability (H2 ≈ 0.5), confirming their suitability for quantitative genetic analysis [118]. Importantly, when these predicted traits were used in GWAS, multiple quantitative trait loci were identified for photosynthetic capacity traits such as Vcmax and Jmax, demonstrating that sensing-derived physiological phenotypes can be directly linked to underlying genetic architecture. Similar approaches in other cereals such as wheat further support this framework, where time-series vegetation indices (e.g., NDVI), canopy temperature and senescence metrics derived from UAV and satellite platforms have been successfully used as GWAS traits to identify loci associated with canopy development, expression of stay-green and yield stability under drought [151,152]. Although applications in sorghum remain relatively limited, studies using UAV-derived spectral and thermal traits have reported moderate to high genetic variance and significant associations with biomass and grain yield [34,153], indicating strong potential for integrating sensing-derived phenotypes into genomic analyses. Together, these advances demonstrate that high-throughput phenotyping can bridge physiology and genomics by enabling the genetic dissection of dynamic, process-based traits relevant to drought adaptation.
9. Advances in Knowledge for Drought Adaptation Must Remain on an Upward Trajectory
Although the evidences presented in this review exemplifies significant advances in better understanding drought adaptation in sorghum, substantial knowledge gaps remain a key limitation to translating of physiological insight into scalable breeding decisions. Much of the current literature is still dominated by canopy-level traits such as stay-green, leaf senescence scores, or biomass accumulation [154,155,156], while root system architecture, hydraulic function, and below-ground plasticity remain poorly characterised at population scale. Root traits are often measured destructively, in small subsets of genotypes, or under controlled conditions that fail to represent the complexity of field drought scenarios, resulting in limited integration of root function into breeding pipelines [157].
Remote sensing and proximal sensing technologies have expanded rapidly, yet their use has largely focused on canopy structure, greenness, and thermal responses, with relatively little emphasis on linking these signals to root activity, water uptake dynamics, and soil-plant hydraulic interactions. While radiative transfer models and machine-learning approaches have demonstrated strong potential for estimating canopy traits, their application for extracting mechanistic proxies of root function, radiation use efficiency, and stress resilience remains under-explored. Another critical gap lies in the limited temporal resolution of phenotyping strategies. The lack of harmonised multi-environment datasets combining canopy, root, environmental, and physiological measurements further constrains the development of transferable prediction models.
Addressing these gaps requires research priorities that have a stronger focus on
- Embedding these approaches within breeding-relevant field trials to enable selection under realistic drought scenarios.
10. Towards Predictive, Data-Driven Breeding
Hybrid modelling strategies that combine process-based radiative transfer models with machine-learning algorithms offer a particularly powerful pathway for trait retrieval. Radiative transfer models provide biophysical interpretability, while machine-learning approaches enable the scaling of these models to large breeding populations and heterogeneous field environments [120]. This synergy allows the prediction of physiological traits that are otherwise difficult or impractical to measure directly, creating opportunities for high-throughput screening of drought resilience. Importantly, predictive breeding frameworks enable genotype performance to be evaluated not only under observed conditions but also under simulated drought scenarios, facilitating anticipatory selection for future climate variability [161,162]. When integrated with genomic information, these phenotyping pipelines provide a foundation for linking remotely sensed functional traits to genetic architecture, enabling genomic prediction models that are informed by plant physiology rather than purely statistical yield correlations [118]. The transition towards a holistic sensing and data-driven breeding therefore represents a fundamental shift in sorghum improvement, moving from phenotype description to physiological prediction. Here we propose a novel integrated framework (Figure 6) as conceptual basis for linking functional canopy derivates to - root traits for enhanced drought resilience. Overall, it allows the fusion of proximal and remote sensing from satellite, UAV, handheld, and subsurface sensors across multiple scales. Thus, capturing canopy, environmental, and soil-root signals, which are then combined with process-based modelling using radiative transfer models (e.g., PROSAIL, SCOPE) and machine learning approaches to retrieve targeted morphological, biochemical and physiological traits. It is anticipated that these sensing-derived traits can be readily integrated with genomic association studies to improve understanding of the functional relationships between canopy processes and root function for crop improvement.
Finally, by integrating such technologies driven by high-resolution remote sensing, physics-based leaf-canopy modelling and targeted trait retrieval is essential for establishing robust mechanistic phenotyping frameworks. This approach will enable the selection of drought-tolerant sorghum varieties with improved adaptive plasticity and yield stability under increasingly variable environments.
Supplementary Materials
The following supporting information can be downloaded at: Preprints.org.
Author Contributions
Conceptualization, S.N. and A.P.; methodology, S.N.; software, S.N.; validation, S.N., A.P., D.Z., B.G., and D.J.; formal analysis, S.N., A.P., D.Z., B.G., and D.J.; investigation, S.N., A.P., D.Z., B.G., and D.J.; resources, S.N. and A.P.; data curation, S.N.; writing—original draft preparation, S.N.; writing—review and editing, S.N., A.P., D.Z., B.G., and D.J.; visualization, S.N. and A.P.; supervision, A.P., D.Z., B.G., and D.J.; project administration, A.P. All authors have read and agreed to the published version of the manuscript.
Funding
Funded by the Grain Research and Development Corporation (GRDC) (UOQ2312-009RTX) under the project “Overcoming the root phenotyping bottleneck in cereals.”.
Data Availability Statement
No new data were created or analysed in this study. Data sharing is not applicable to this article.
Acknowledgments
During the preparation of this article, the authors used Biorender.com and DALL-E (through OpenAI ChatGPT ) for the purposes of creating illustrations in the summary figures. The authors have reviewed and edited the output and take full responsibility for the content of this publication. S.N. acknowledges support from the Australian Government Research Training Program (RTP) Scholarship at The University of Queensland. The authors also acknowledge Dr. Ruizhu Jiang for guidance on mapping and visualisation of production data.
Conflicts of Interest
The authors declare no conflicts of interest. The funders had no role in the design of the study; in the collection, analyses, or interpretation of data; in the writing of the manuscript; or in the decision to publish the results.
Abbreviations
| roperties model | |
| PSII | Photosystem II |
| QLD | Queensland |
| QTL | Quantitative Trait Locus |
| R2 | Coefficient of determination |
| RF | Random Forest |
| RGB | Red, Green, Blue (imaging) |
| RMSE | Root Mean Square Error |
| RTM | Radiative Transfer Model |
| RUE | Radiation Use Efficiency |
| S2 | Sentinel-2 |
| SA2 | Statistical Area Level 2 |
| SAIL | Scattering by Arbitrarily Inclined Leaves (canopy reflectance model) |
| SCOPE | Soil Canopy Observation, Photochemistry and Energy fluxes model |
| SIF | Solar-Induced Fluorescence |
| SLN | Specific Leaf Nitrogen |
| SPAD/SPAD-502 | Soil Plant Analysis Development chlorophyll meter |
| SVC | Spectra Vista Corporation |
| TIR | Thermal Infrared |
| TIROS-1 | Television Infrared Observation Satellite-1 |
| TIRS | Thermal Infrared Sensor (Landsat 8/9) |
| TVDI | Temperature-Vegetation Dryness Index |
| UAV | Unmanned Aerial Vehicle |
| UQ | The University of Queensland |
| US | United States (of America) |
| USGS | United States Geological Survey |
| VIs | Vegetation Indices |
| VPD | Vapour Pressure Deficit |
| WDRVI | Wide Dynamic Range Vegetation Index |
| WI | Water Index |
| WUE | Water Use Efficiency |
Appendix A
Data Sources
To contextualise sorghum production dynamics in Australia, publicly available datasets were obtained from the Australian Bureau of Agricultural and Resource Economics and Sciences (ABARES), the Australian Bureau of Statistics (ABS), and the FAOSTAT database. Annual records of harvested area, grain production, and yield were compiled for Australia for the most recent ten-year period.
Spatial patterns of sorghum production were visualised using aggregated regional production statistics linked to Statistical Area Level 2 (SA2) boundary shapefiles. Spatial analyses were conducted using a reproducible R-based workflow in which tabular production data were joined to spatial polygons to generate regional production maps. These analyses were intended to provide descriptive and contextual insights into sorghum distribution rather than formal spatial modelling or causal inference.
Appendix B
Analytical Approach
Descriptive statistics were calculated to characterise interannual variability in sorghum production, harvested area, and yield. For each variable, the arithmetic mean.
where (xi) represents an annual observation and (n) is the total number of years included in the analysis.
Variability was quantified using the coefficient of variation (CV), calculated as:
where (s) is the sample standard deviation and () is the arithmetic mean. The coefficient of variation provides a dimensionless measure of variability, allowing comparison among variables with different units and magnitudes.
All statistical calculations and visualisations were performed using R (R Core Team, 2025).
References
- IPCC. Climate Change 2022: Impacts, Adaptation and Vulnerability. In Fact sheet: Food and Water; IPCC, 2022. [Google Scholar]
- Borrell, A.K.; Mullet, J.E.; George-Jaeggli, B.; van Oosterom, E.J.; Hammer, G.L.; Klein, P.E.; Jordan, D.R. Drought adaptation of stay-green sorghum is associated with canopy development, leaf anatomy, root growth, and water uptake. J. Exp. Bot. 2014, 65, 6251–6263. [Google Scholar] [CrossRef] [PubMed]
- Borrell, A.K.; van Oosterom, E.J.; Mullet, J.E.; George-Jaeggli, B.; Jordan, D.R.; Klein, P.E.; Hammer, G.L. Stay-green alleles individually enhance grain yield in sorghum under drought by modifying canopy development and water uptake patterns. New Phytol. 2014, 203, 817–830. [Google Scholar] [CrossRef] [PubMed]
- Furbank, R.T.; Tester, M. Phenomics--technologies to relieve the phenotyping bottleneck. Trends Plant Sci. 2011, 16, 635–644. [Google Scholar] [CrossRef] [PubMed]
- Araus, J.L.; Cairns, J.E. Field high-throughput phenotyping: the new crop breeding frontier. Trends Plant Sci. 2014, 19, 52–61. [Google Scholar] [CrossRef] [PubMed]
- Furbank, R.T.; Jimenez-Berni, J.A.; George-Jaeggli, B.; Potgieter, A.B.; Deery, D.M. Field crop phenomics: enabling breeding for radiation use efficiency and biomass in cereal crops. New Phytol. 2019, 223, 1714–1727. [Google Scholar] [CrossRef] [PubMed]
- Jacquemoud, S.; Verhoef, W.; Baret, F.; Bacour, C.; Zarco-Tejada, P.J.; Asner, G.P.; François, C.; Ustin, S.L. PROSPECT plus SAIL models: A review of use for vegetation characterization. Remote Sens. Environ. 2009, 113, S56–S66. [Google Scholar] [CrossRef]
- Van der Tol, C.; Verhoef, W.; Timmermans, J.; Verhoef, A.; Su, Z. An integrated model of soil-canopy spectral radiances, photosynthesis, fluorescence, temperature and energy balance. Biogeosciences 2009, 6, 3109–3129. [Google Scholar] [CrossRef]
- Craig, R. Basic characteristics of soils. In Soil Mechanics; Springer, 1983; pp. 1–38. [Google Scholar]
- Jin, K.; White, P.J.; Whalley, W.R.; Shen, J.; Shi, L. Shaping an Optimal Soil by Root-Soil Interaction. Trends Plant Sci. 2017, 22, 823–829. [Google Scholar] [CrossRef] [PubMed]
- Wasson, A.P.; Richards, R.A.; Chatrath, R.; Misra, S.C.; Prasad, S.V.; Rebetzke, G.J.; Kirkegaard, J.A.; Christopher, J.; Watt, M. Traits and selection strategies to improve root systems and water uptake in water-limited wheat crops. J. Exp. Bot. 2012, 63, 3485–3498. [Google Scholar] [CrossRef] [PubMed]
- Alahmad, S.; Smith, D.; Katsikis, C.; van der Meer, S.; Meijer, L.; Chenu, K.; Chapman, S.; Potgieter, A.; Wasson, A.; Baraibar, S. UAV Phenotyping for Predicting the Hidden Half of Barley. In Proceedings of the Plant and Animal Genome Conference/PAG, January 12-17, 2024), 2024; 31. [Google Scholar]
- (FAO), F.a.A.O.o.t.U.N. FAOSTAT Statistical Database. Available online: https://www.fao.org/faostat/en/#data/QCL (accessed on August).
- Silva, T.N.; Thomas, J.B.; Dahlberg, J.; Rhee, S.Y.; Mortimer, J.C. Progress and challenges in sorghum biotechnology, a multipurpose feedstock for the bioeconomy. J. Exp. Bot. 2022, 73, 646–664. [Google Scholar] [CrossRef] [PubMed]
- Khalifa, M.; Eltahir, E.A.B. Assessment of global sorghum production, tolerance, and climate risk. Front. Sustain. Food Syst. 2023, 7, 1184373. [Google Scholar] [CrossRef]
- Khaton, M.; Sagar, A.; Tajkia, J.; Islam, M.; Mahmud, M.; Hossain, A. Effect of moisture stress on morphological and yield attributes of four sorghum varieties. Progress. Agric. 2016, 27, 265–271. [Google Scholar] [CrossRef]
- Tanwar, R.; Panghal, A.; Chaudhary, G.; Kumari, A.; Chhikara, N. Nutritional, phytochemical and functional potential of sorghum: A review. Food Chem. Adv. 2023, 3, 100501. [Google Scholar] [CrossRef]
- Stefoska-Needham, A. Sorghum and health: An overview of potential protective health effects. J. Food Sci. 2024, 89, A30–A41. [Google Scholar] [CrossRef] [PubMed]
- Tonapi, V.A.; Talwar, H.S.; Are, A.K.; Bhat, B.V.; Reddy, C.R.; Dalton, T.J. Sorghum in the 21st century: food-fodder-feed-fuel for a rapidly changing world; Springer, 2020. [Google Scholar]
- Hossain, M.S.; Islam, M.N.; Rahman, M.M.; Mostofa, M.G.; Khan, M.A.R. Sorghum: A prospective crop for climatic vulnerability, food and nutritional security. J. Agric. Food Res. 2022, 8, 100300. [Google Scholar] [CrossRef]
- ABARES. 2024. Australian Crop Report: June 2024, Report no. 210. Australian Government Department of Agriculture, Fisheries and Forestry, Canberra. Australian Bureau of Agricultural and Resource Economics and Sciences. [Google Scholar]
- Sadras, V.O.; Rodriguez, D. The limit to wheat water-use efficiency in eastern Australia. II. Influence of rainfall patterns. Aust. J. Agric. Res. 2007, 58, 657–669. [Google Scholar] [CrossRef]
- Page, K.L.; Dalal, R.C.; Wehr, J.B.; Dang, Y.P.; Kopittke, P.M.; Kirchhof, G.; Fujinuma, R.; Menzies, N.W. Management of the major chemical soil constraints affecting yields in the grain growing region of Queensland and New South Wales, Australia - a review. Soil Res. 2018, 56, 765–779. [Google Scholar] [CrossRef]
- Potgieter, A.B.; Lobell, D.B.; Hammer, G.L.; Jordan, D.R.; Davis, P.; Brider, J. Yield trends under varying environmental conditions for sorghum and wheat across Australia. Agric. For. Meteorol. 2016, 228, 276–285. [Google Scholar] [CrossRef]
- Ananda, G.K.S.; Myrans, H.; Norton, S.L.; Gleadow, R.; Furtado, A.; Henry, R.J. Wild Sorghum as a Promising Resource for Crop Improvement. Front Plant Sci. 2020, 11, 1108. [Google Scholar] [CrossRef] [PubMed]
- Opoku, E.; Sahu, P.P.; Findurova, H.; Holub, P.; Urban, O.; Klem, K. Differential physiological and production responses of C3 and C4 crops to climate factor interactions. Front Plant Sci. 2024, 15, 1345462. [Google Scholar] [CrossRef] [PubMed]
- Karami, S.; Shiran, B.; Ravash, R. Molecular investigation of how drought stress affects chlorophyll metabolism and photosynthesis in leaves of C3 and C4 plant species: A transcriptome meta-analysis. Heliyon 2025, 11, e42368. [Google Scholar] [CrossRef] [PubMed]
- Rao, S.; Elangovan, M.; Umakanth, A.; Seetharama, N.; Reddy, B.; Ramesh, S.; Kumar, A.; Gowda, C. Characterizing phenology and growth stages of sorghum hybrids. Sorghum improvement in the new millenium; BELUM, R.E.D.D.Y., RAMESH, V.S.S., KUMAR, A.S.H.O.K., GOWDA, A.G.L.L., Eds.; 2008; pp. 16–22. [Google Scholar]
- Hammer, G.L.; Vanderlip, R.; Gibson, G.; Wade, L.; Henzell, R.; Younger, D.; Warren, J.; Dale, A. Genotype-by-environment interaction in grain sorghum. II. Effects of temperature and photoperiod on ontogeny. Crop Sci. 1989, 29, 376–384. [Google Scholar] [CrossRef]
- Clerget, B.; Dingkuhn, M.; Goze, E.; Rattunde, H.F.; Ney, B. Variability of phyllochron, plastochron and rate of increase in height in photoperiod-sensitive sorghum varieties. Ann. Bot. 2008, 101, 579–594. [Google Scholar] [CrossRef] [PubMed]
- Narayanan, S.; Aiken, R.M.; Prasad, P.V.V.; Xin, Z.G.; Paul, G.; Yu, J.M. A Simple Quantitative Model to Predict Leaf Area Index in Sorghum. Agron. J. 2014, 106, 219–226. [Google Scholar] [CrossRef]
- Raymundo, R.; Sexton-Bowser, S.; Ciampitti, I.A.; Morris, G.P. Crop modeling defines opportunities and challenges for drought escape, water capture, and yield increase using chilling-tolerant sorghum. Plant Direct 2021, 5, e349. [Google Scholar] [CrossRef] [PubMed]
- Wang, X.; Mace, E.; Tao, Y.; Cruickshank, A.; Hunt, C.; Hammer, G.; Jordan, D. Large-scale genome-wide association study reveals that drought-induced lodging in grain sorghum is associated with plant height and traits linked to carbon remobilisation. Theor. Appl. Genet 2020, 133, 3201–3215. [Google Scholar] [CrossRef] [PubMed]
- Liedtke, J.D.; Hunt, C.H.; George-Jaeggli, B.; Laws, K.; Watson, J.; Potgieter, A.B.; Cruickshank, A.; Jordan, D.R. High-Throughput Phenotyping of Dynamic Canopy Traits Associated with Stay-Green in Grain Sorghum. Plant Phenomics 2020, 2020, 4635153. [Google Scholar] [CrossRef] [PubMed]
- Sommer, R.J. Phenotypic Plasticity: From Theory and Genetics to Current and Future Challenges. Genetics 2020, 215, 1–13. [Google Scholar] [CrossRef] [PubMed]
- Wei, J.; Guo, T.; Mu, Q.; Alladassi, B.M.E.; Mural, R.V.; Boyles, R.E.; Hoffmann, L.; Hayes, C.M.; Sigmon, B.; Thompson, A.M.; et al. Genetic and Environmental Patterns Underlying Phenotypic Plasticity in Flowering Time and Plant Height in Sorghum. Plant Cell Env. 2025, 48, 2727–2738. [Google Scholar] [CrossRef] [PubMed]
- Clerget, B.; Sidibe, M.; Bueno, C.S.; Grenier, C.; Kawakata, T.; Domingo, A.J.; Layaoen, H.L.; Gutierrez-Palacios, N.D.; Bernal, J.H.; Trouche, G.; et al. Crop photoperiodism model 2.0 for the flowering time of sorghum and rice that includes daily changes in sunrise and sunset times and temperature acclimation. Ann. Bot. 2021, 128, 97–113. [Google Scholar] [CrossRef] [PubMed]
- Major, D.J.; Rood, S.B.; Miller, F.R. Temperature and Photoperiod Effects Mediated by the Sorghum Maturity Genes. Crop Sci. 1990, 30, 305–310. [Google Scholar] [CrossRef]
- Carcedo, A.J.P.; Cejas, E.; Gambin, B.L. Adapting sorghum sowing date and genotype maturity to seasonal rainfall variation in a temperate region. Silico Plants 2021, 3, diab007. [Google Scholar] [CrossRef]
- George-Jaeggli, B.; Mortlock, M.Y.; Borrell, A.K. Bigger is not always better: reducing leaf area helps stay-green sorghum use soil water more slowly. Environ. Exp. Bot. 2017, 138, 119–129. [Google Scholar] [CrossRef]
- Mace, E.S.; Singh, V.; Van Oosterom, E.J.; Hammer, G.L.; Hunt, C.H.; Jordan, D.R. QTL for nodal root angle in sorghum (Sorghum bicolor L. Moench) co-locate with QTL for traits associated with drought adaptation. Theor. Appl. Genet 2012, 124, 97–109. [Google Scholar] [CrossRef] [PubMed]
- Djanaguiraman, M.; Gowsiga, S.; Govindaraj, M.; Habyarimana, E.; Senthil, A.; Thavaprakaash, N.; Jeyakumar, P.; Kokilavani, J.; Chellammal, C. Impact of root architecture and transpiration rate on drought tolerance in stay-green sorghum. Crop Sci. 2023, 64, 2612–2629. [Google Scholar] [CrossRef]
- Raymundo, R.; McLean, G.; Sexton-Bowser, S.; Lipka, A.E.; Morris, G.P. Crop modeling suggests limited transpiration would increase yield of sorghum across drought-prone regions of the United States. Front Plant Sci. 2023, 14, 1283339. [Google Scholar] [CrossRef] [PubMed]
- Collins, B.; Chapman, S.; Hammer, G.; Chenu, K. Limiting transpiration rate in high evaporative demand conditions to improve Australian wheat productivity. Silico Plants 2021, 3, diab006. [Google Scholar] [CrossRef]
- Koehler, T.; Botezatu, A.; Murugesan, T.; Kaliamoorthy, S.; Kholov, J.; Sadok, W.; Ahmed, M.A.; Carminati, A. The transpiration rate sensitivity to increasing evaporative demand differs between soil textures, even in wet soil. Plant Stress 2024, 12, 100506. [Google Scholar] [CrossRef]
- Al-Salman, Y.; Cano, F.J.; Mace, E.; Jordan, D.; Groszmann, M.; Ghannoum, O. High water use efficiency due to maintenance of photosynthetic capacity in sorghum under water stress. J. Exp. Bot. 2024, 75, 6778–6795. [Google Scholar] [CrossRef] [PubMed]
- Ortiz, D.; Salas-Fernandez, M.G. Dissecting the genetic control of natural variation in sorghum photosynthetic response to drought stress. J. Exp. Bot. 2022, 73, 3251–3267. [Google Scholar] [CrossRef] [PubMed]
- Somegowda, V.K.; Reddy, S.E.D.; Gaddameedi, A.; Kiranmayee, K.N.S.U.; Naravula, J.; Kishor, P.B.K.; Penna, S. Genomics breeding approaches for developing lines with stress resilience and other agronomic traits. Curr. Plant Biol. 2024, 37, 100314. [Google Scholar] [CrossRef]
- Rouse, J., Jr.; Haas, R.; Schell, J.; Deering, D. Paper a 20. In Proceedings of the Third earth resources technology satellite-1 symposium: The proceedings of a symposium held by Goddard space flight center at Washington, DC on, 1973; p. 309. [Google Scholar]
- Tucker, C.J. Red and Photographic Infrared Linear Combinations for Monitoring Vegetation. Remote Sens. Environ. 1979, 8, 127–150. [Google Scholar] [CrossRef]
- HSU. History of remote sensing. Available online: https://gsp.humboldt.edu/olm/Courses/GSP_216/online/lesson1/history.html (accessed on 8 August).
- Mersmann, K. Launch of TIROS 1, World’s First Weather Satellite – This Week in Goddard History: March 31–April 6; NASA Goddard Space Flight Center, 2019. [Google Scholar]
- NASA. Agriculture. Available online: https://science.nasa.gov/earth/explore/agriculture/.
- Sugiura, R.; Noguchi, N.; Ishii, K. Remote-sensing technology for vegetation monitoring using an unmanned helicopter. Biosyst. Eng. 2005, 90, 369–379. [Google Scholar] [CrossRef]
- Berni, J.; Zarco-Tejada, P.; Suárez, L.; González-Dugo, V.; Fereres, E. Remote sensing of vegetation from UAV platforms using lightweight multispectral and thermal imaging sensors. Int. Arch. Photogramm. Remote Sens. Spat. Inform. Sci. 2009, 38, 6. [Google Scholar]
- Araus, J.L.; Kefauver, S.C.; Zaman-Allah, M.; Olsen, M.S.; Cairns, J.E. Translating High-Throughput Phenotyping into Genetic Gain. Trends Plant Sci. 2018, 23, 451–466. [Google Scholar] [CrossRef] [PubMed]
- Potgieter, A.B.; George-Jaeggli, B.; Chapman, S.C.; Laws, K.; Suarez Cadavid, L.A.; Wixted, J.; Watson, J.; Eldridge, M.; Jordan, D.R.; Hammer, G.L. Multi-Spectral Imaging from an Unmanned Aerial Vehicle Enables the Assessment of Seasonal Leaf Area Dynamics of Sorghum Breeding Lines. Front Plant Sci. 2017, 8, 1532. [Google Scholar] [CrossRef] [PubMed]
- Hu, P.C.; Chapman, S.C.; Wang, X.M.; Potgieter, A.; Duan, T.; Jordan, D.; Guo, Y.; Zheng, B.Y. Estimation of plant height using a high throughput phenotyping platform based on unmanned aerial vehicle and self-calibration: Example for sorghum breeding. Eur. J. Agron. 2018, 95, 24–32. [Google Scholar] [CrossRef]
- Gano, B.; Dembele, J.S.B.; Ndour, A.; Luquet, D.; Beurier, G.; Diouf, D.; Audebert, A. Using UAV Borne, Multi-Spectral Imaging for the Field Phenotyping of Shoot Biomass, Leaf Area Index and Height of West African Sorghum Varieties under Two Contrasted Water Conditions. Agronomy-Basel 2021, 11, 850. [Google Scholar] [CrossRef]
- Pugh, N.A.; Young, A.; Emendack, Y.; Sanchez, J.; Xin, Z.G.; Hayes, C. High-throughput phenotyping of stay-green in a sorghum breeding program using unmanned aerial vehicles and machine learning. Plant Phenome J. 2025, 8, e70014. [Google Scholar] [CrossRef]
- Ghosal, S.; Zheng, B.; Chapman, S.C.; Potgieter, A.B.; Jordan, D.R.; Wang, X.; Singh, A.K.; Singh, A.; Hirafuji, M.; Ninomiya, S.; et al. A Weakly Supervised Deep Learning Framework for Sorghum Head Detection and Counting. Plant Phenomics 2019, 2019, 1525874. [Google Scholar] [CrossRef] [PubMed]
- Mantilla-Perez, M.B.; Bao, Y.; Tang, L.; Schnable, P.S.; Salas-Fernandez, M.G. Toward “Smart Canopy” Sorghum: Discovery of the Genetic Control of Leaf Angle Across Layers. Plant Physiol. 2020, 184, 1927–1940. [Google Scholar] [CrossRef] [PubMed]
- Rodriguez, D.; Sadras, V.O.; Christensen, L.K.; Belford, R. Spatial assessment of the physiological status of wheat crops as affected by water and nitrogen supply using infrared thermal imagery. Aust. J. Agric. Res. 2005, 56, 983–993. [Google Scholar] [CrossRef]
- Parida, P.K.; Somasundaram, E.; Krishnan, R.; Radhamani, S.; Sivakumar, U.; Parameswari, E.; Raja, R.; Rangasami, S.R.S.; Sangeetha, S.P.; Selvi, R.G. Unmanned Aerial Vehicle-Measured Multispectral Vegetation Indices for Predicting LAI, SPAD Chlorophyll, and Yield of Maize. Agriculture-Basel 2024, 14. [Google Scholar] [CrossRef]
- Zhou, L.F.; Gu, X.H.; Cheng, S.; Yang, G.J.; Shu, M.Y.; Sun, Q. Analysis of Plant Height Changes of Lodged Maize Using UAV-LiDAR Data. Agriculture-Basel 2020, 10, 146. [Google Scholar] [CrossRef]
- Dai, Y.; Yu, S.; Ma, T.; Ding, J.; Chen, K.; Zeng, G.; Xie, A.; He, P.; Peng, S.; Zhang, M. Improving the estimation of rice above-ground biomass based on spatio-temporal UAV imagery and phenological stages. Front Plant Sci. 2024, 15, 1328834. [Google Scholar] [CrossRef] [PubMed]
- Segarra Torruella, J.; Araus Ortega, J.L.; Kefauver, S.C. Farming and Earth Observation: Sentinel-2 data to estimate within-field wheat grain yield. 2022. [Google Scholar] [CrossRef]
- Khodjaev, S.; Bobojonov, I.; Kuhn, L.; Glauben, T. An accuracy assessment of satellite-based cotton yield estimation using panel data regression: a case study of Uzbekistan. Environ. Dev. Sustain. 2026, 28, 6799–6830. [Google Scholar] [CrossRef]
- Vaz, C.M.P.; Ferreira, E.J.; Speranza, E.A.; Franchini, J.C.; Naime, J.D.; Inamasu, R.Y.; Lopes, I.D.N.; Das Chagas, S.; Schelp, M.X.; Vecchi, L.; et al. Cotton Yield Map Prediction Using Sentinel-2 Satellite Imagery in the Brazilian Cerrado Production System. Agriengineering 2025, 7, 390. [Google Scholar] [CrossRef]
- Amankulova, K.; Farmonov, N.; Akramova, P.; Tursunov, I.; Mucsi, L. Comparison of PlanetScope, Sentinel-2, and landsat 8 data in soybean yield estimation within-field variability with random forest regression. Heliyon 2023, 9, e17432. [Google Scholar] [CrossRef] [PubMed]
- Chen, X.K.; Li, F.L.; Chang, Q.R.; Miao, Y.X.; Yu, K. Improving winter wheat plant nitrogen concentration prediction by combining proximal hyperspectral sensing and weather information with machine learning. Comput. Electron. Agric. 2025, 232, 110072. [Google Scholar] [CrossRef]
- Vollmann, J.; Rischbeck, P.; Pachner, M.; Dordevic, V.; Manschadi, A.M. High-throughput screening of soybean di-nitrogen fixation and seed nitrogen content using spectral sensing. Comput. Electron. Agric. 2022, 199, 107169. [Google Scholar] [CrossRef]
- Potgieter, A.B.; Watson, J.; George-Jaeggli, B.; McLean, G.; Eldridge, M.; Chapman, S.C.; Laws, K.; Christopher, J.; Chenu, K.; Borrell, A. The use of hyperspectral proximal sensing for phenotyping of plant breeding trials. In Fundamentals, sensor systems, spectral libraries, and data Mining for Vegetation; CRC Press, 2018; pp. 127–147. [Google Scholar]
- Das, S.; Reynolds Massey-Reed, S.; Mahuika, J.; Watson, J.; Cordova, C.; Otto, L.; Zhao, Y.; Chapman, S.; George-Jaeggli, B.; Jordan, D.R.; et al. A high-throughput phenotyping pipeline for rapid evaluation of morphological and physiological crop traits across large fields. In Proceedings of the IEEE IGARSS, Kuala Lumpur, Malaysia, 2022. [Google Scholar]
- Roman, A.; Ursu, T. Multispectral satellite imagery and airborne laser scanning techniques for the detection of archaeological vegetation marks. Landscape archaeology on the northern frontier of the Roman Empire at Porolissum: an interdisciplinary research project 2016, 141–152. [Google Scholar]
- Liu, W.W.; Mottus, M.; Gastellu-Etchegorry, J.P.; Fang, H.L.; Atherton, J. Seasonal and vertical variation in canopy structure and leaf spectral properties determine the canopy reflectance of a rice field. Agric. For. Meteorol. 2024, 355, 110132. [Google Scholar] [CrossRef]
- Sullivan, F.B.; Hastings, J.H.; Ollinger, S.V.; Ouimette, A.; Richardson, A.D.; Palace, M. Parsing the Relative Contributions of Leaf and Canopy Traits in Airborne Spectrometer Measurements. Remote Sens. 2026, 18, 355. [Google Scholar] [CrossRef]
- Berry, J. 3.10 solar induced chlorophyll fluorescence: Origins, relation to photosynthesis and retrieval. Compr. Remote Sens. 2018, 3, 143–162. [Google Scholar]
- Joiner, J.; Yoshida, Y.; Köehler, P.; Campbell, P.; Frankenberg, C.; van der Tol, C.; Yang, P.; Parazoo, N.; Guanter, L.; Sun, Y. Systematic orbital geometry-dependent variations in satellite solar-induced fluorescence (SIF) retrievals. Remote Sens. 2020, 12, 2346. [Google Scholar]
- Guanter, L.; Zhang, Y.; Jung, M.; Joiner, J.; Voigt, M.; Berry, J.A.; Frankenberg, C.; Huete, A.R.; Zarco-Tejada, P.; Lee, J.-E. Global and time-resolved monitoring of crop photosynthesis with chlorophyll fluorescence. Proc. Natl. Acad. Sci. 2014, 111, E1327–E1333. [Google Scholar] [CrossRef] [PubMed]
- Zhang, Y.; Guanter, L.; Berry, J.A.; Joiner, J.; van der Tol, C.; Huete, A.; Gitelson, A.; Voigt, M.; Kohler, P. Estimation of vegetation photosynthetic capacity from space-based measurements of chlorophyll fluorescence for terrestrial biosphere models. Glob. Chang Biol. 2014, 20, 3727–3742. [Google Scholar] [CrossRef] [PubMed]
- Camino, C.; Gonzalez-Dugo, V.; Hernandez, P.; Zarco-Tejada, P.J. Radiative transfer Vcmax estimation from hyperspectral imagery and SIF retrievals to assess photosynthetic performance in rainfed and irrigated plant phenotyping trials. Remote Sens. Environ. 2019, 231, 111186. [Google Scholar] [CrossRef]
- Prakash, A. Thermal remote sensing: concepts, issues and applications. Int. Arch. Photogramm. Remote Sens. 2000, 33, 239–243. [Google Scholar]
- Li, Z.L.; Wu, H.; Duan, S.B.; Zhao, W.; Ren, H.Z.; Liu, X.Y.; Leng, P.; Tang, R.L.; Ye, X.; Zhu, J.S.; et al. Satellite Remote Sensing of Global Land Surface Temperature: Definition, Methods, Products, and Applications. Rev. Geophys. 2023, 61. [Google Scholar] [CrossRef]
- Li, Z.-L.; Liu, X.; Zhao, E.; Si, M.; Gao, C.; Wu, H.; Ren, H.; Duan, S.-B.; Tang, R.; Tang, B.-H. Reflections on developments and opportunities of thermal infrared remote sensing. Innov. Geosci. 2024, 2, 100104. [Google Scholar] [CrossRef]
- Abrams, M. The Advanced Spaceborne Thermal Emission and Reflection Radiometer (ASTER): data products for the high spatial resolution imager on NASA’s Terra platform. Int. J. Remote Sens. 2000, 21, 847–859. [Google Scholar] [CrossRef]
- Barsi, J.A.; Schott, J.R.; Hook, S.J.; Raqueno, N.G.; Markham, B.L.; Radocinski, R.G. Landsat-8 Thermal Infrared Sensor (TIRS) Vicarious Radiometric Calibration. Remote Sens. 2014, 6, 11607–11626. [Google Scholar] [CrossRef]
- USGS. Available online: https://www.usgs.gov/landsat-missions (accessed on 8 August).
- Jones, H.G. Application of thermal imaging and infrared sensing in plant physiology and ecophysiology. In Advances in botanical research; Elsevier, 2004; Volume 41, pp. 107–163. [Google Scholar]
- Leinonen, I.; Jones, H.G. Combining thermal and visible imagery for estimating canopy temperature and identifying plant stress. J. Exp. Bot. 2004, 55, 1423–1431. [Google Scholar] [CrossRef] [PubMed]
- Moran, M.S.; Clarke, T.R.; Inoue, Y.; Vidal, A. Estimating Crop Water-Deficit Using the Relation between Surface-Air Temperature and Spectral Vegetation Index. Remote Sens. Environ. 1994, 49, 246–263. [Google Scholar] [CrossRef]
- Sandholt, I.; Rasmussen, K.; Andersen, J. A simple interpretation of the surface temperature/vegetation index space for assessment of surface moisture status. Remote Sens. Environ. 2002, 79, 213–224. [Google Scholar] [CrossRef]
- Li, Z.L.; Tang, R.; Wan, Z.; Bi, Y.; Zhou, C.; Tang, B.; Yan, G.; Zhang, X. A review of current methodologies for regional evapotranspiration estimation from remotely sensed data. Sensors 2009, 9, 3801–3853. [Google Scholar] [CrossRef] [PubMed]
- Chapman, S.C. Use of crop models to understand genotype by environment interactions for drought in real-world and simulated plant breeding trials. Euphytica 2008, 161, 195–208. [Google Scholar] [CrossRef]
- Huete, A.; Didan, K.; Miura, T.; Rodriguez, E.P.; Gao, X.; Ferreira, L.G. Overview of the radiometric and biophysical performance of the MODIS vegetation indices. Remote Sens. Environ. 2002, 83, 195–213. [Google Scholar] [CrossRef]
- Li, B.; Tang, H.; Chen, D. Drought monitoring using the modified temperature/vegetation dryness index. In Proceedings of the 2009 2nd International Congress on Image and Signal Processing, 2009; pp. 1–5. [Google Scholar]
- Behera, S.; Elakkiyaa, T.L.; Sarkar, A.; Dutta, D. Solar-Induced Chlorophyll Fluorescence Yield Holds the Potential for Drought Early Warning. Geophys. Res. Lett. 2025, 52, e2024GL113419. [Google Scholar] [CrossRef]
- Gamon, J.A.; Penuelas, J.; Field, C.B. A Narrow-Waveband Spectral Index That Tracks Diurnal Changes in Photosynthetic Efficiency. Remote Sens. Environ. 1992, 41, 35–44. [Google Scholar] [CrossRef]
- Gao, B.C. NDWI - A normalized difference water index for remote sensing of vegetation liquid water from space. Remote Sens. Environ. 1996, 58, 257–266. [Google Scholar] [CrossRef]
- Hunt, E.R., Jr.; Rock, B.N. Detection of changes in leaf water content using near-and middle-infrared reflectances. Remote Sens. Environ. 1989, 30, 43–54. [Google Scholar]
- Qi, J.; Chehbouni, A.; Huete, A.R.; Kerr, Y.H.; Sorooshian, S. A Modified Soil Adjusted Vegetation Index. Remote Sens. Environ. 1994, 48, 119–126. [Google Scholar] [CrossRef]
- Rondeaux, G.; Steven, M.; Baret, F. Optimization of soil-adjusted vegetation indices. Remote Sens. Environ. 1996, 55, 95–107. [Google Scholar] [CrossRef]
- Gitelson, A.A.; Kaufman, Y.J.; Stark, R.; Rundquist, D. Novel algorithms for remote estimation of vegetation fraction. Remote Sens. Environ. 2002, 80, 76–87. [Google Scholar] [CrossRef]
- Smith, D.T.; Potgieter, A.B.; Chapman, S.C. Scaling up high-throughput phenotyping for abiotic stress selection in the field. Theor. Appl. Genet 2021, 134, 1845–1866. [Google Scholar] [CrossRef] [PubMed]
- Baker, N.R. Chlorophyll fluorescence: a probe of photosynthesis in vivo. Annu Rev. Plant Biol. 2008, 59, 89–113. [Google Scholar] [CrossRef] [PubMed]
- Porcar-Castell, A.; Tyystjarvi, E.; Atherton, J.; van der Tol, C.; Flexas, J.; Pfundel, E.E.; Moreno, J.; Frankenberg, C.; Berry, J.A. Linking chlorophyll a fluorescence to photosynthesis for remote sensing applications: mechanisms and challenges. J. Exp. Bot. 2014, 65, 4065–4095. [Google Scholar] [CrossRef] [PubMed]
- Uddling, J.; Gelang-Alfredsson, J.; Piikki, K.; Pleijel, H. Evaluating the relationship between leaf chlorophyll concentration and SPAD-502 chlorophyll meter readings. Photosynth Res. 2007, 91, 37–46. [Google Scholar] [CrossRef] [PubMed]
- Welles, J.M.; Norman, J.M. Instrument for Indirect Measurement of Canopy Architecture. Agron. J. 1991, 83, 818–825. [Google Scholar] [CrossRef]
- Campbell, G.S.; Norman, J.M. An introduction to environmental biophysics; Springer Science & Business Media, 2000. [Google Scholar]
- Aasen, H.; Honkavaara, E.; Lucieer, A.; Zarco-Tejada, P.J. Quantitative Remote Sensing at Ultra-High Resolution with UAV Spectroscopy: A Review of Sensor Technology, Measurement Procedures, and Data Correction Workflows. Remote Sens. 2018, 10, 1091. [Google Scholar] [CrossRef]
- Haghighattalab, A.; Gonzalez Perez, L.; Mondal, S.; Singh, D.; Schinstock, D.; Rutkoski, J.; Ortiz-Monasterio, I.; Singh, R.P.; Goodin, D.; Poland, J. Application of unmanned aerial systems for high throughput phenotyping of large wheat breeding nurseries. Plant Methods 2016, 12, 35. [Google Scholar] [CrossRef] [PubMed]
- Tattaris, M.; Reynolds, M.P.; Chapman, S.C. A Direct Comparison of Remote Sensing Approaches for High-Throughput Phenotyping in Plant Breeding. Front Plant Sci. 2016, 7, 1131. [Google Scholar] [CrossRef] [PubMed]
- Hu, P.; Guo, W.; Chapman, S.C.; Guo, Y.; Zheng, B. Pixel size of aerial imagery constrains the applications of unmanned aerial vehicle in crop breeding. ISPRS J. Photogramm. Remote Sens. 2019, 154, 1–9. [Google Scholar] [CrossRef]
- Wang, X.; Silva, P.; Bello, N.M.; Singh, D.; Evers, B.; Mondal, S.; Espinosa, F.P.; Singh, R.P.; Poland, J. Improved Accuracy of High-Throughput Phenotyping From Unmanned Aerial Systems by Extracting Traits Directly From Orthorectified Images. Front Plant Sci. 2020, 11, 587093. [Google Scholar] [CrossRef] [PubMed]
- Potgieter, A.B.; Zhao, Y.; Zarco-Tejada, P.J.; Chenu, K.; Zhang, Y.F.; Porker, K.; Biddulph, B.; Dang, Y.P.; Neale, T.; Roosta, F.; et al. Evolution and application of digital technologies to predict crop type and crop phenology in agriculture. Silico Plants 2021, 3. [Google Scholar] [CrossRef]
- McCabe, M.F.; Aragon, B.; Houborg, R.; Mascaro, J. CubeSats in Hydrology: Ultrahigh-Resolution Insights Into Vegetation Dynamics and Terrestrial Evaporation. Water Resour. Res. 2017, 53, 10017–10024. [Google Scholar] [CrossRef]
- Ma, Z.Y.; Rayhana, R.; Feng, K.; Liu, Z.; Xiao, G.Z.; Ruan, Y.F.; Sangha, J.S. A Review on Sensing Technologies for High-Throughput Plant Phenotyping. Ieee Open J. Instrum. Meas. 2022, 1, 1–21. [Google Scholar] [CrossRef]
- Zhi, X.; Massey-Reed, S.R.; Wu, A.; Potgieter, A.; Borrell, A.; Hunt, C.; Jordan, D.; Zhao, Y.; Chapman, S.; Hammer, G.; et al. Estimating Photosynthetic Attributes from High-Throughput Canopy Hyperspectral Sensing in Sorghum. Plant Phenomics 2022, 2022, 9768502. [Google Scholar] [CrossRef] [PubMed]
- Zarco-Tejada, P.J.; Jimenez-Berni, J.A. Remote Sensing. In Principles of Agronomy for Sustainable Agriculture; Springer, 2024; pp. 571–581. [Google Scholar]
- Potgieter, A.B.; Camino, C.; Poblete, T.; Zhi, X.; Reynolds-Massey-Reed, S.; Zhao, Y.; Belwalkar, A.; Ruizhu, J.; George-Jaeggli, B.; Chapman, S.; et al. Advances in the Study of Biochemical, Morphological and Physiological Traits of Wheat and Sorghum Crops in Australia Using Hyperspectral Data and Machine Learning. In Proceedings of the IGARSS 2023-2023 IEEE International Geoscience and Remote Sensing Symposium, 2023; pp. 1952–1955. [Google Scholar]
- Malinen, J.; Rissanen, A.; Saari, H.; Karioja, P.; Karppinen, M.; Aalto, T.; Tukkiniemi, K. Advances in miniature spectrometer and sensor development. In Proceedings of the Next-generation spectroscopic technologies VII, 2014; pp. 83–97. [Google Scholar]
- Huang, H.G.; Lian, J. A 3D approach to reconstruct continuous optical images using lidar and MODIS. For. Ecosyst. 2015, 2, 20. [Google Scholar] [CrossRef]
- Daniels, L.; Eeckhout, E.; Wieme, J.; Dejaegher, Y.; Audenaert, K.; Maes, W.H. Identifying the Optimal Radiometric Calibration Method for UAV-Based Multispectral Imaging. Remote Sens. 2023, 15, 2909. [Google Scholar] [CrossRef]
- Zhao, Y.; Zheng, B.; Chapman, S.C.; Laws, K.; George-Jaeggli, B.; Hammer, G.L.; Jordan, D.R.; Potgieter, A.B. Detecting Sorghum Plant and Head Features from Multispectral UAV Imagery. Plant Phenomics 2021, 2021, 9874650. [Google Scholar] [CrossRef] [PubMed]
- Barnhart, I.; Demarco, P.; Prasad, P.V.V.; Mayor, L.; Jugulam, M.; Ciampitti, I.A. High-resolution unmanned aircraft systems imagery for stay-green characterization in grain sorghum (.). J. Appl. Remote Sens. 2021, 15, 044501–044501. [Google Scholar] [CrossRef]
- James, C.; Smith, D.; He, W.; Chandra, S.S.; Chapman, S.C. GrainPointNet: A deep-learning framework for non-invasive sorghum panicle grain count phenotyping. Comput. Electron. Agric. 2024, 217, 108485. [Google Scholar]
- Watanabe, K.; Guo, W.; Arai, K.; Takanashi, H.; Kajiya-Kanegae, H.; Kobayashi, M.; Yano, K.; Tokunaga, T.; Fujiwara, T.; Tsutsumi, N.; et al. High-Throughput Phenotyping of Sorghum Plant Height Using an Unmanned Aerial Vehicle and Its Application to Genomic Prediction Modeling. Front Plant Sci. 2017, 8, 421. [Google Scholar] [CrossRef] [PubMed]
- Toda, Y.; Kaga, A.; Kajiya-Kanegae, H.; Hattori, T.; Yamaoka, S.; Okamoto, M.; Tsujimoto, H.; Iwata, H. Genomic prediction modeling of soybean biomass using UAV-based remote sensing and longitudinal model parameters. Plant Genome 2021, 14, e20157. [Google Scholar] [CrossRef] [PubMed]
- Wang, T.; Crawford, M.M.; Tuinstra, M.R. A novel transfer learning framework for sorghum biomass prediction using UAV-based remote sensing data and genetic markers. Front Plant Sci. 2023, 14, 1138479. [Google Scholar] [CrossRef] [PubMed]
- Atkinson, J.A.; Pound, M.P.; Bennett, M.J.; Wells, D.M. Uncovering the hidden half of plants using new advances in root phenotyping. Curr. Opin. Biotechnol. 2019, 55, 1–8. [Google Scholar] [CrossRef] [PubMed]
- Zhao, D.X.; de Voil, P.; Sadras, V.O.; Palta, J.A.; Rodriguez, D. The plasticity of root traits and their effects on crop yield and yield stability. Plant Soil 2025, 513, 367–382. [Google Scholar] [CrossRef]
- Chang, Y.; Ni, Z.; Panelo, J.S.; Kemp, J.; Salas-Fernandez, M.G.; Wang, L. A data-driven crop model for biomass sorghum growth process simulation. Front Plant Sci. 2025, 16, 1617775. [Google Scholar] [CrossRef] [PubMed]
- Berger, K.; Atzberger, C.; Danner, M.; D’Urso, G.; Mauser, W.; Vuolo, F.; Hank, T. Evaluation of the PROSAIL Model Capabilities for Future Hyperspectral Model Environments: A Review Study. Remote Sens. 2018, 10, 85. [Google Scholar] [CrossRef]
- Jacquemoud, S.; Baret, F. Prospect - a Model of Leaf Optical-Properties Spectra. Remote Sens. Environ. 1990, 34, 75–91. [Google Scholar] [CrossRef]
- Verhoef, W. Light scattering by Leaf layers with application to canopy reflectance modeling: The sail model. Remote Sens. Environ. 1984, 16, 125–141. [Google Scholar] [CrossRef]
- Verhoef, W. Earth Observation Modeling Based on Layer Scattering Matrices. Remote Sens. Environ. 1985, 17, 165–178. [Google Scholar] [CrossRef]
- Ishaq, R.A.F.; Zhou, G.; Tian, C.; Tan, Y.; Jing, G.; Jiang, H. A systematic review of radiative transfer models for crop yield prediction and crop traits retrieval. Remote Sens. 2023, 16, 121. [Google Scholar] [CrossRef]
- Chakhvashvili, E.; Siegmann, B.; Muller, O.; Verrelst, J.; Bendig, J.; Kraska, T.; Rascher, U. Retrieval of Crop Variables from Proximal Multispectral UAV Image Data Using PROSAIL in Maize Canopy. Remote Sens. 2022, 14, 1247. [Google Scholar] [CrossRef] [PubMed]
- Hu, J.C.; Liu, X.J.; Liu, L.Y.; Guan, L.L. Evaluating the Performance of the SCOPE Model in Simulating Canopy Solar-Induced Chlorophyll Fluorescence. Remote Sens. 2018, 10, 250. [Google Scholar] [CrossRef]
- Yang, P.Q.; Prikaziuk, E.; Verhoef, W.; Van der Tol, C. SCOPE 2.0: a model to simulate vegetated land surface fluxes and satellite signals. Geosci. Model Dev. 2021, 14, 4697–4712. [Google Scholar] [CrossRef]
- Collatz, G.J.; Ball, J.T.; Grivet, C.; Berry, J.A. Physiological and Environmental-Regulation of Stomatal Conductance, Photosynthesis and Transpiration - a Model That Includes a Laminar Boundary-Layer. Agric. For. Meteorol. 1991, 54, 107–136. [Google Scholar] [CrossRef]
- Collatz, G.J.; Ribas-Carbo, M.; Berry, J.A. Coupled Photosynthesis-Stomatal Conductance Model for Leaves of C4 Plants. Aust. J. Plant Physiol. 1992, 19, 519–538. [Google Scholar] [CrossRef]
- Chen, Q.; Zheng, B.; Chen, T.; Chapman, S.C. Integrating a crop growth model and radiative transfer model to improve estimation of crop traits based on deep learning. J. Exp. Bot. 2022, 73, 6558–6574. [Google Scholar] [CrossRef] [PubMed]
- Hu, P.C.; Zheng, B.Y.; Chen, Q.M.; Grunefeld, S.; Choudhury, M.R.; Fernandez, J.; Potgieter, A.; Chapman, S.C. Estimating aboveground biomass dynamics of wheat at small spatial scale by integrating crop growth and radiative transfer models with satellite remote sensing data. Remote Sens. Environ. 2024, 311, 114277. [Google Scholar] [CrossRef]
- Longmire, A.; Poblete, T.; Hornero, A.; Chen, D.; Zarco-Tejada, P.J. Grain Protein Content in Commercial Wheat Estimated Via Timeseries Plant Traits Retrieved From Sentinel-2 Images by Radiative Transfer Model Inversion. In Proceedings of the IGARSS 2024-2024 IEEE International Geoscience and Remote Sensing Symposium, 2024; pp. 8347–8350. [Google Scholar]
- Singh, V.; van Oosterom, E.J.; Jordan, D.R.; Messina, C.D.; Cooper, M.; Hammer, G.L. Morphological and architectural development of root systems in sorghum and maize. Plant Soil 2010, 333, 287–299. [Google Scholar] [CrossRef]
- Demissie, H.S.; Mindaye, T.T.; Teklu, D.N.; Kebede, F.G. Root system architecture analysis of sorghum genotypes and its effect on drought adaptation. Rhizosphere 2023, 27, 100772. [Google Scholar] [CrossRef]
- Zhao, D.; de Voil, P.; Sadras, V.; Palta, J.; Rodriguez, D. Root phenotypic plasticity: agronomic, breeding and modelling implications. 2024. [Google Scholar] [CrossRef] [PubMed]
- Whalley, W.R.; Binley, A.; Watts, C.W.; Shanahan, P.; Dodd, I.C.; Ober, E.S.; Ashton, R.W.; Webster, C.P.; White, R.P.; Hawkesford, M.J. Methods to estimate changes in soil water for phenotyping root activity in the field. Plant Soil 2017, 415, 407–422. [Google Scholar] [CrossRef] [PubMed]
- Lopes, M.S.; Reynolds, M.P. Partitioning of assimilates to deeper roots is associated with cooler canopies and increased yield under drought in wheat. Funct. Plant Biol. 2010, 37, 147–156. [Google Scholar] [CrossRef]
- Condorelli, G.E.; Maccaferri, M.; Newcomb, M.; Andrade-Sanchez, P.; White, J.W.; French, A.N.; Sciara, G.; Ward, R.; Tuberosa, R. Comparative aerial and ground based high throughput phenotyping for the genetic dissection of NDVI as a proxy for drought adaptive traits in durum wheat. Front. Plant Sci. 2018, 9, 893. [Google Scholar] [CrossRef] [PubMed]
- Devate, N.B.; Krishna, H.; Parmeshwarappa, S.K.V.; Manjunath, K.K.; Chauhan, D.; Singh, S.; Singh, J.B.; Kumar, M.; Patil, R.; Khan, H.; et al. Genome-wide association mapping for component traits of drought and heat tolerance in wheat. Front Plant Sci. 2022, 13, 943033. [Google Scholar] [CrossRef] [PubMed]
- Varela, S.; Pederson, T.; Bernacchi, C.J.; Leakey, A.D.B. Understanding Growth Dynamics and Yield Prediction of Sorghum Using High Temporal Resolution UAV Imagery Time Series and Machine Learning. Remote Sens. 2021, 13, 1763. [Google Scholar] [CrossRef]
- Merida-Garcia, R.; Galvez, S.; Solis, I.; Martinez-Moreno, F.; Camino, C.; Soriano, J.M.; Sansaloni, C.; Ammar, K.; Bentley, A.R.; Gonzalez-Dugo, V.; et al. High-throughput phenotyping using hyperspectral indicators supports the genetic dissection of yield in durum wheat grown under heat and drought stress. Front Plant Sci. 2024, 15, 1470520. [Google Scholar] [CrossRef] [PubMed]
- Shu, Z.; Yuan, X.; Li, S. Integration of High-Throughput Water-Sensitive Phenotyping for Crop Water Demand Diagnosis: Technical Pathways, Research Progress, and Challenges. 2025.
- Ullah, M.A.; Muqaddas, F.; Naeem, M.K.; ur Rehman, A.; Tabassum, J.; Rehman, S.U.; Sajjad, M.; Mahmood, Z.; Javed, M.A.; Khan, M.R. Assessment of the Genetic Architecture at Early-Stage Drought Tolerance in Wheat Using UAV-Based Multispectral Imaging 2011. 2023.689999. bioRxiv 2025, 2025.
- Grondin, A.; Bhosale, R.; Atkinson, J.; Faye, A.; Jones, D.; Benson, E.; Burridge, J.; Sine, B.; Vadez, V.; Pridmore, T. High-throughput root phenotyping: opportunities and challenges for the adaptation of arid and semi arid crops to future climates. Crop Adapt. Improv. Drought-Prone Environ. 2022, 258–282. [Google Scholar]
- Tracy, S.R.; Nagel, K.A.; Postma, J.A.; Fassbender, H.; Wasson, A.; Watt, M. Crop Improvement from Phenotyping Roots: Highlights Reveal Expanding Opportunities. Trends Plant Sci. 2020, 25, 105–118. [Google Scholar] [CrossRef] [PubMed]
- Graf, L.V.; Merz, Q.N.; Walter, A.; Aasen, H. Insights from field phenotyping improve satellite remote sensing based in-season estimation of winter wheat growth and phenology. Remote Sens. Environ. 2023, 299, 113860. [Google Scholar] [CrossRef]
- Wang, T.; Tong, R.; Xu, T.; Li, Y.; Chen, Y. Artificial Intelligence in Plant Science: A Unified Framework from Phenotyping to Yield Forecasting. Front. Plant Sci. 2025, 16, 1732979. [Google Scholar] [PubMed]
- Robinson, H. Advances in Predictive Breeding to Drive Genetic Gain in a Commercial Plant Breeding Program. In Proceedings of the Plant and Animal Genome Conference/PAG, January 12-17, 2024), 2024; 31. [Google Scholar]
- Van Haeften, S.; Smith, D.; Robinson, H.; Dudley, C.; Kang, Y.; Douglas, C.A.; Hickey, L.T.; Potgieter, A.; Chapman, S.; Smith, M.R. Unmanned aerial vehicle phenotyping of agronomic and physiological traits in mungbean. Plant Phenome J. 2025, 8, e70016. [Google Scholar] [CrossRef]
Figure 1.
Conceptual framework illustrating coordinated drought-adaptive trait networks in sorghum. The trait network links canopy architecture, photosynthetic regulation, transpiration control and root-mediated water capture. Created with Biorender.com.
Figure 1.
Conceptual framework illustrating coordinated drought-adaptive trait networks in sorghum. The trait network links canopy architecture, photosynthetic regulation, transpiration control and root-mediated water capture. Created with Biorender.com.
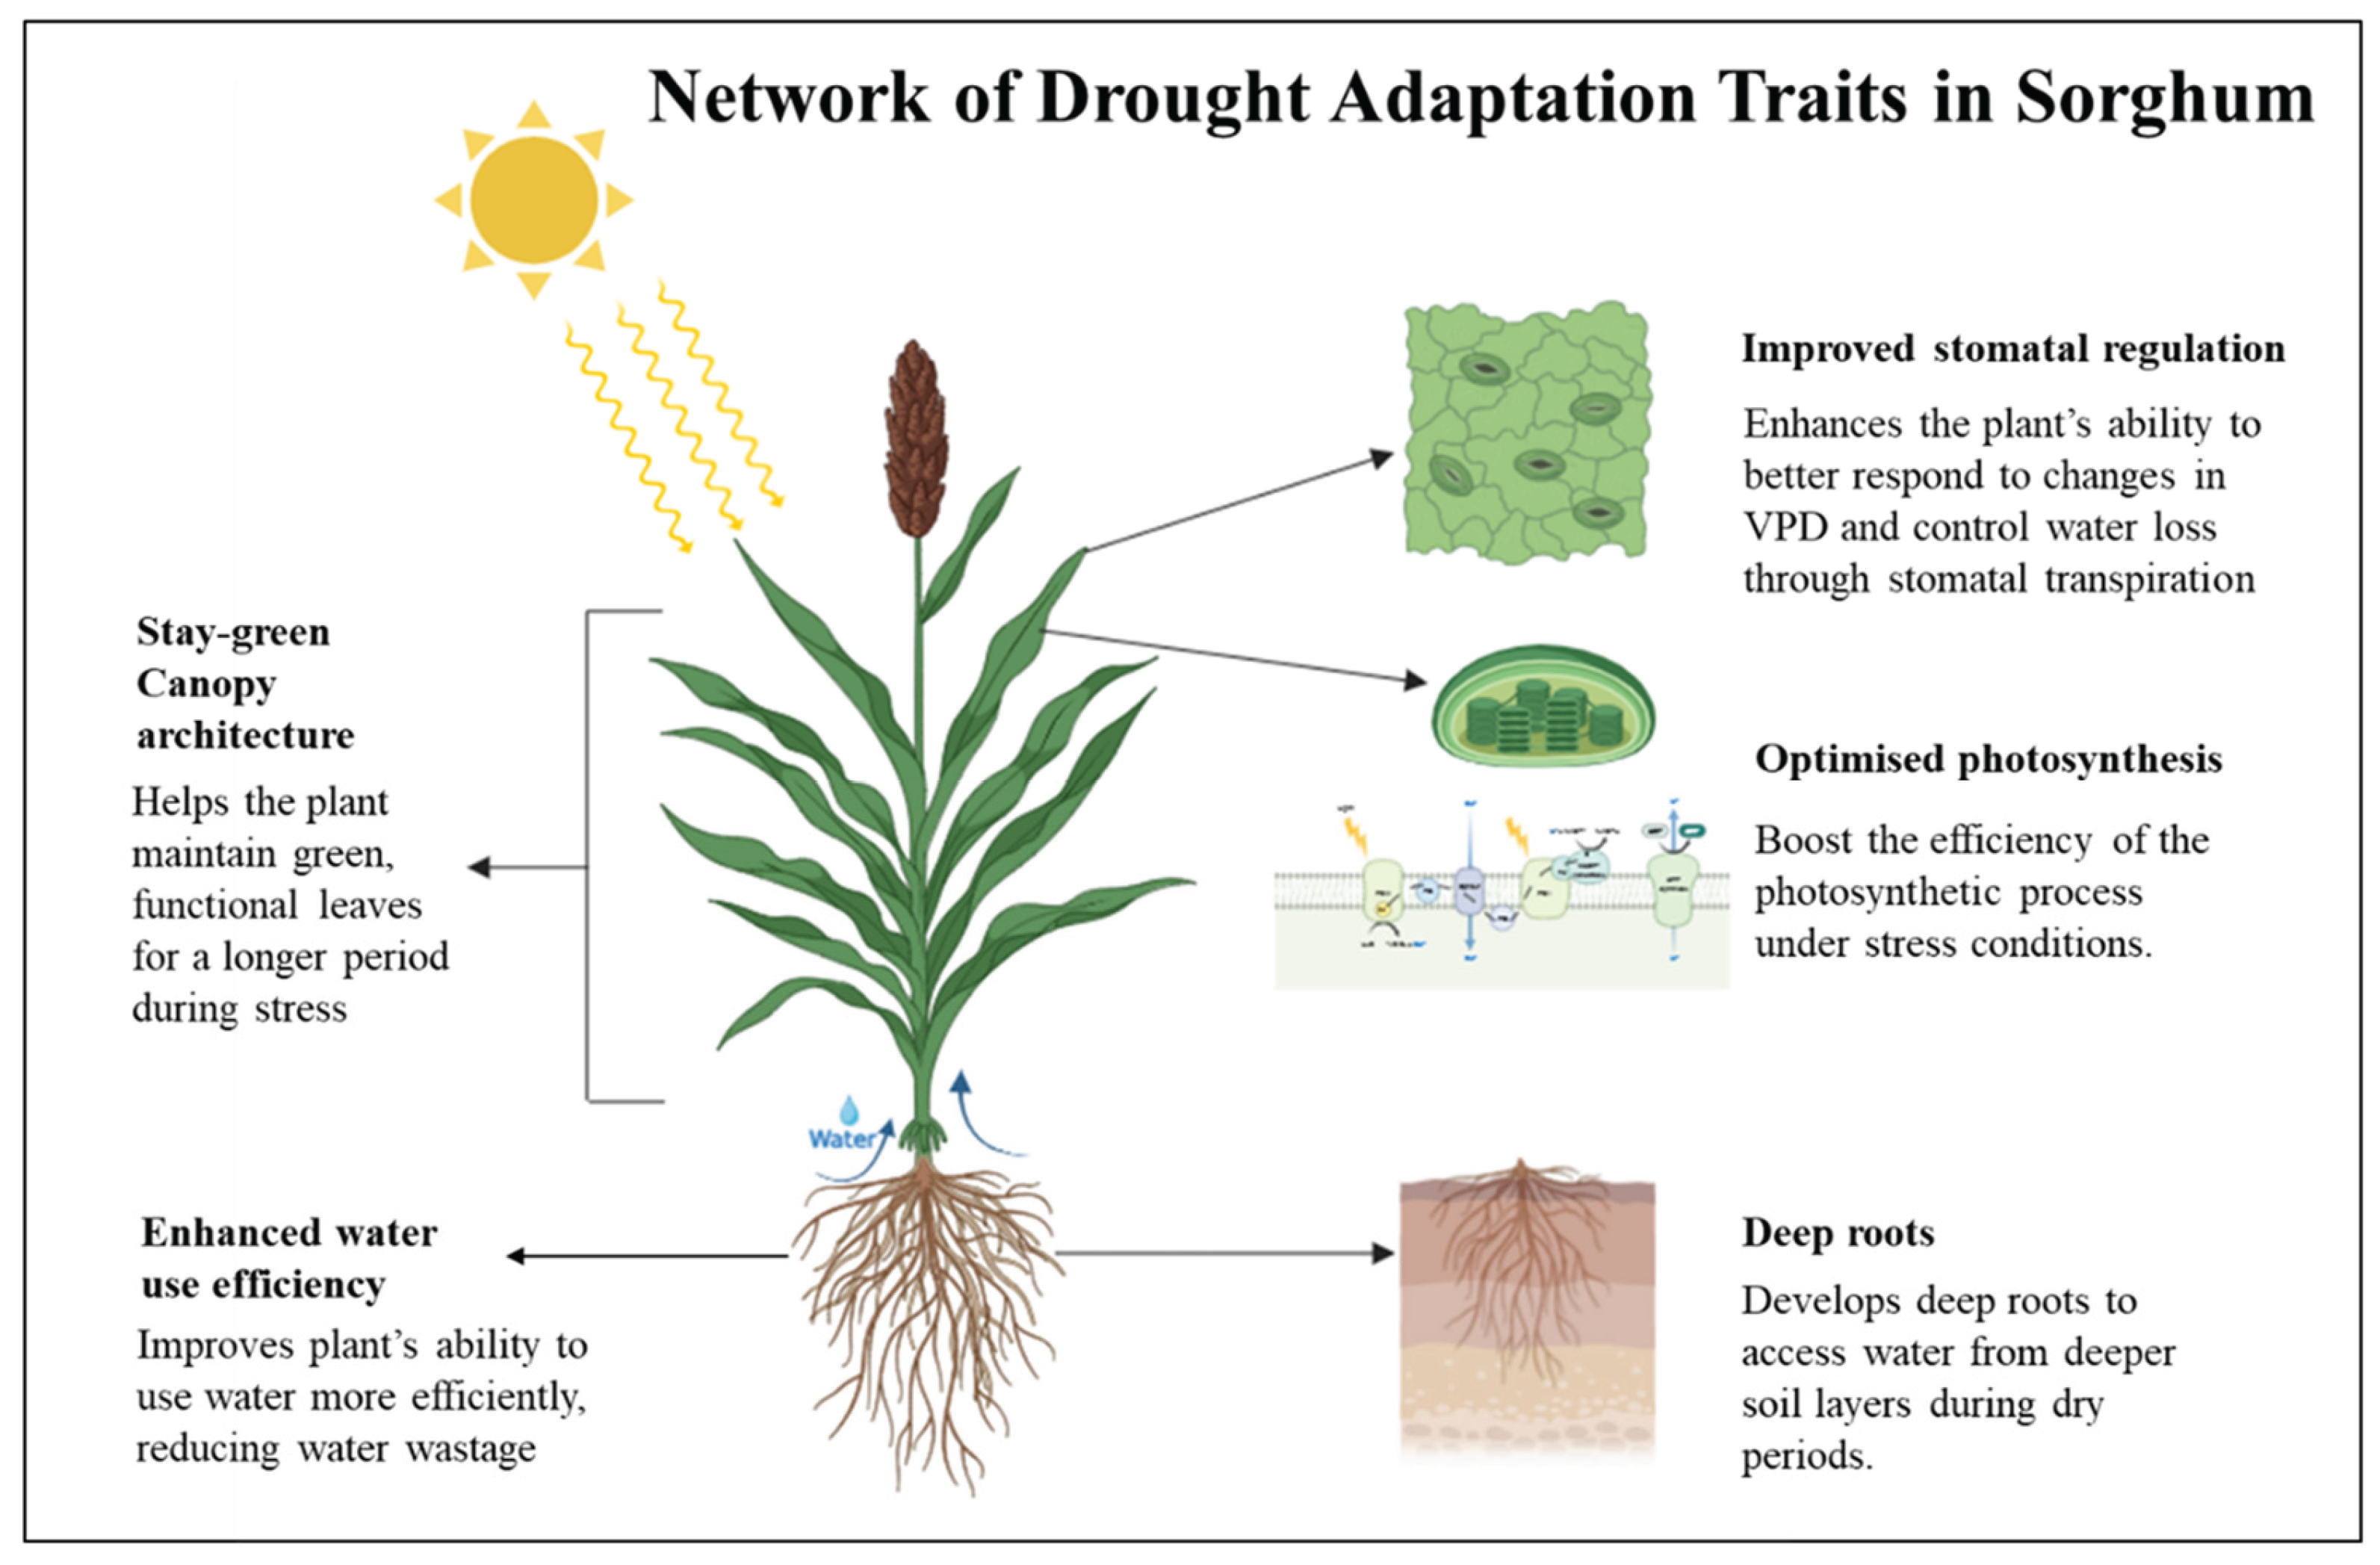
Figure 2.
Spatial distribution of mean sorghum production across Australia, averaged over the period 1982-2023. Production is shown at regional scale, with colour intensity representing mean annual production (tonnes). All data were extracted from Australian Bureau of Statistics (ABS).
Figure 2.
Spatial distribution of mean sorghum production across Australia, averaged over the period 1982-2023. Production is shown at regional scale, with colour intensity representing mean annual production (tonnes). All data were extracted from Australian Bureau of Statistics (ABS).
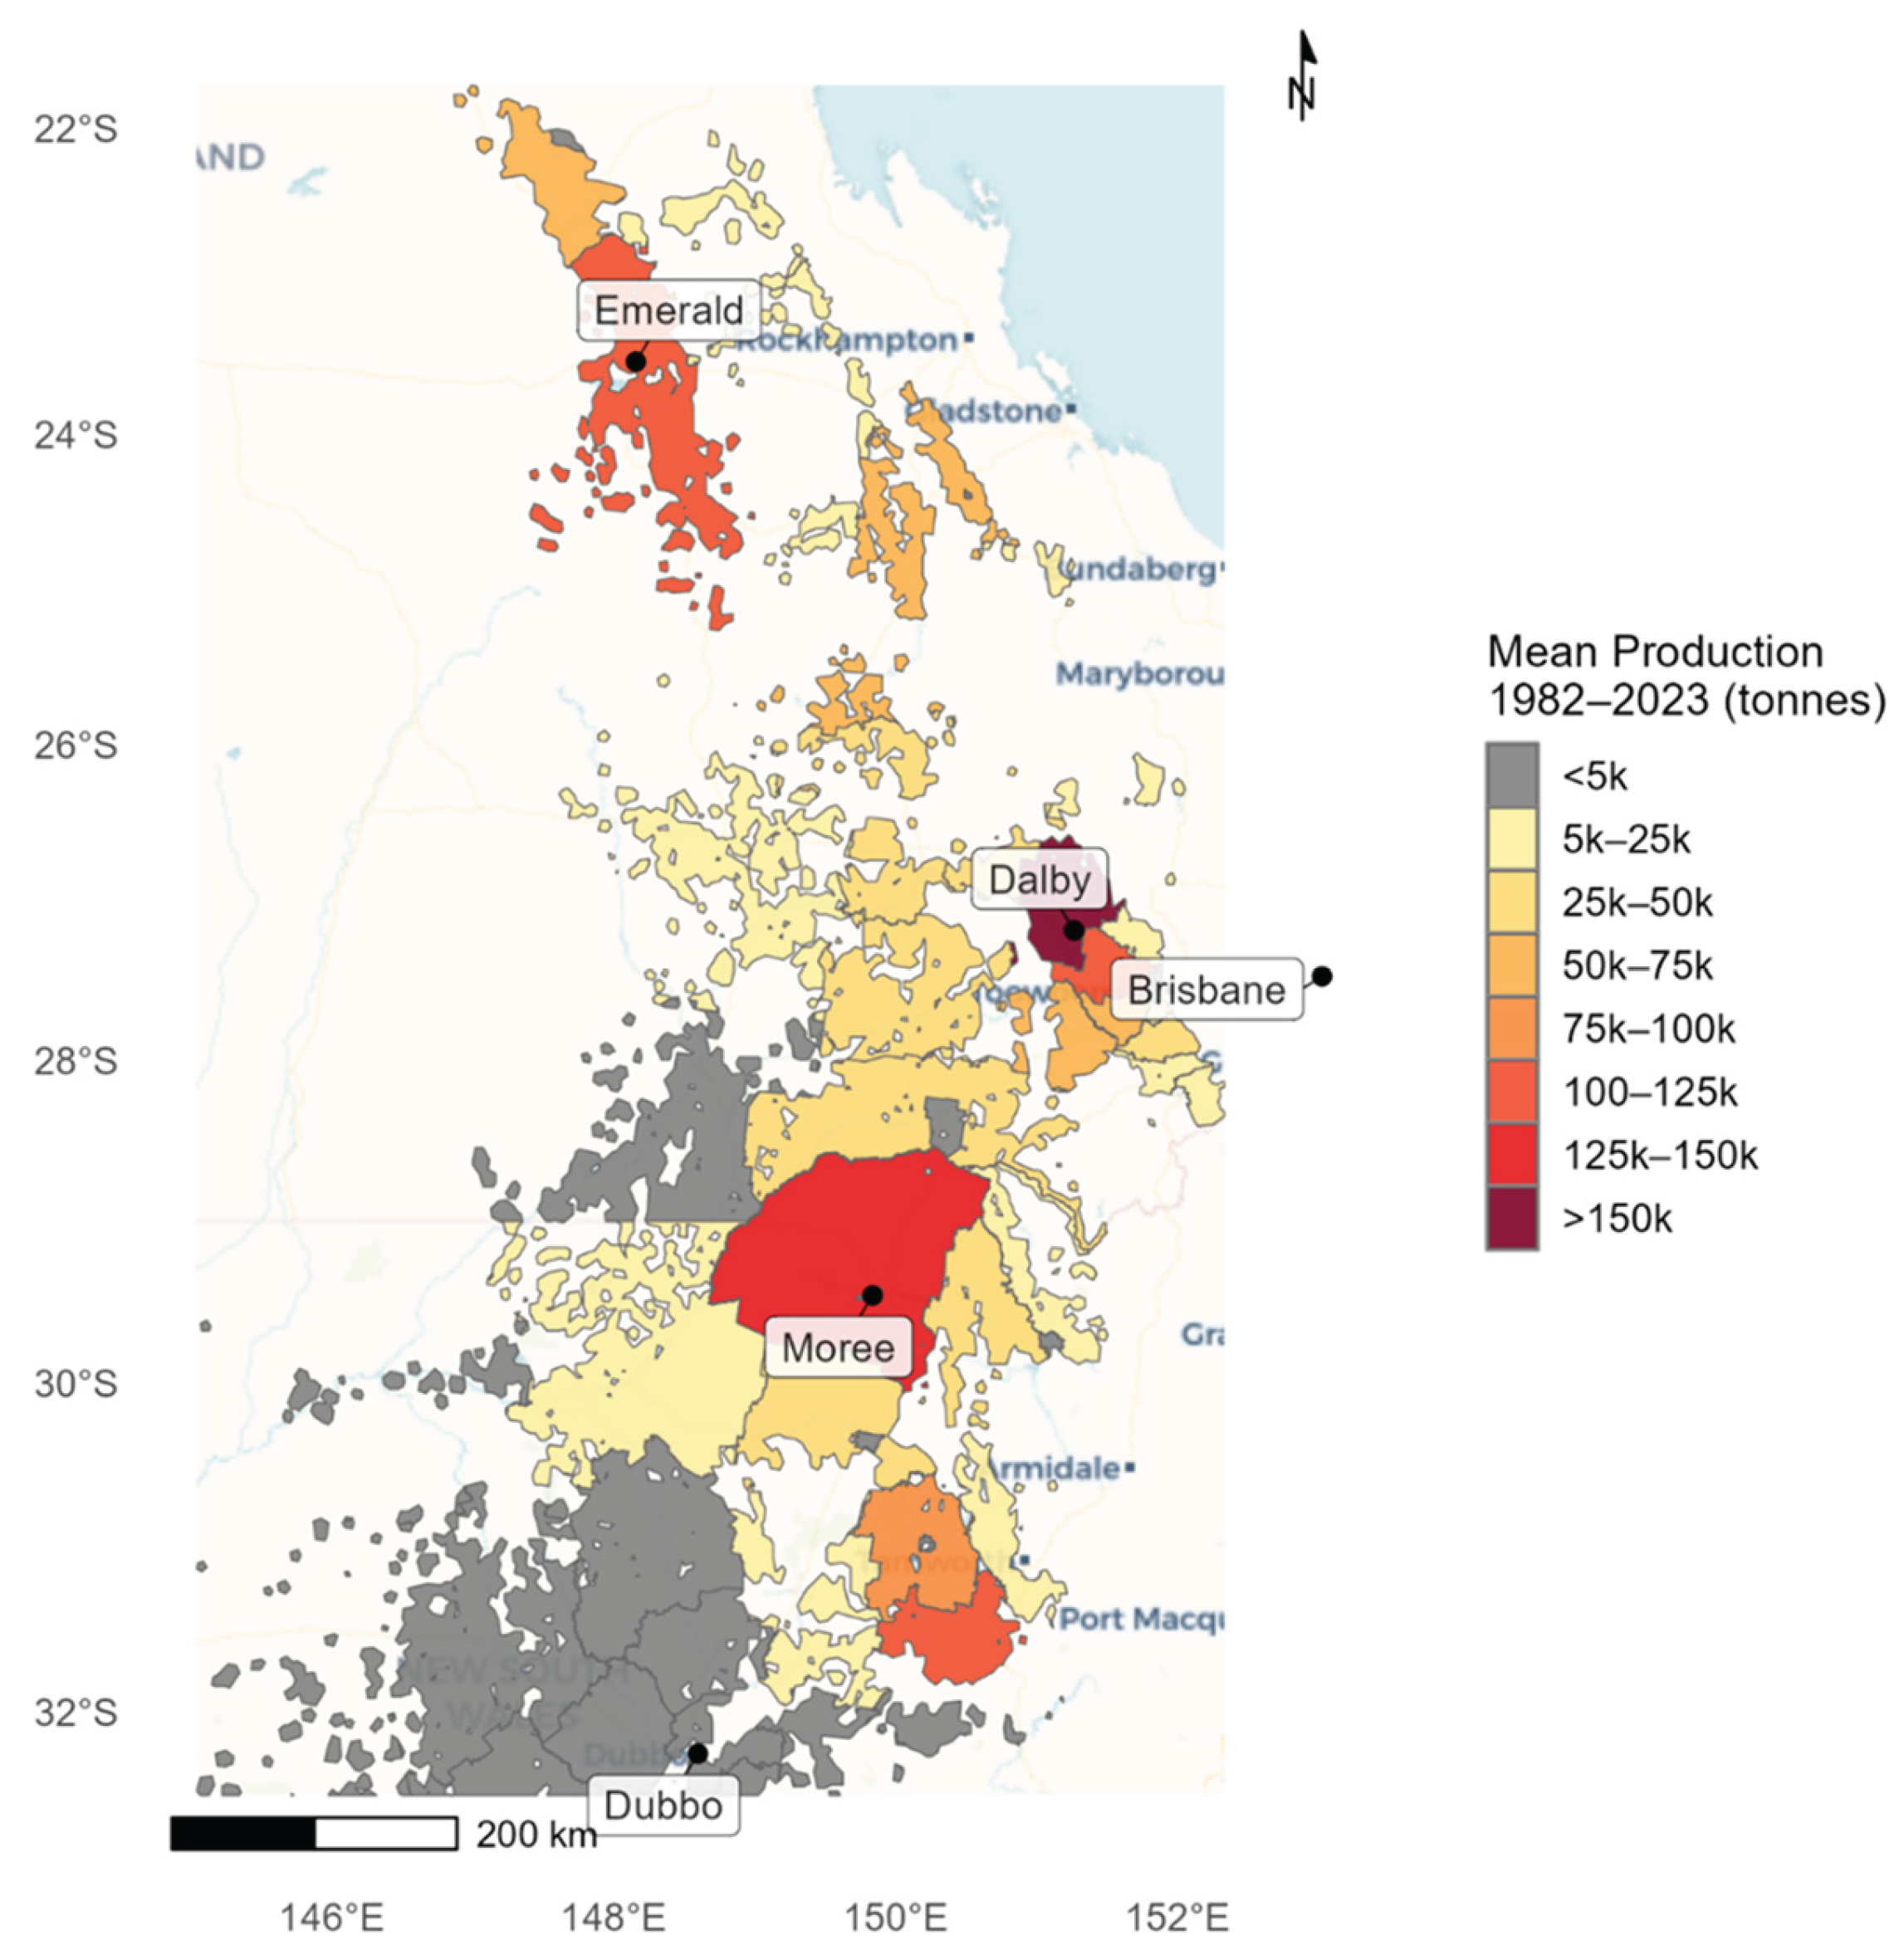
Figure 3.
Schematic representation of sorghum growth stages from emergence through vegetative development, flowering and grain filling to physiological maturity (Sorghum growth stages adapted from Gerik et al. (Texas A&M Extension) and figure created using BioRender.com).
Figure 3.
Schematic representation of sorghum growth stages from emergence through vegetative development, flowering and grain filling to physiological maturity (Sorghum growth stages adapted from Gerik et al. (Texas A&M Extension) and figure created using BioRender.com).
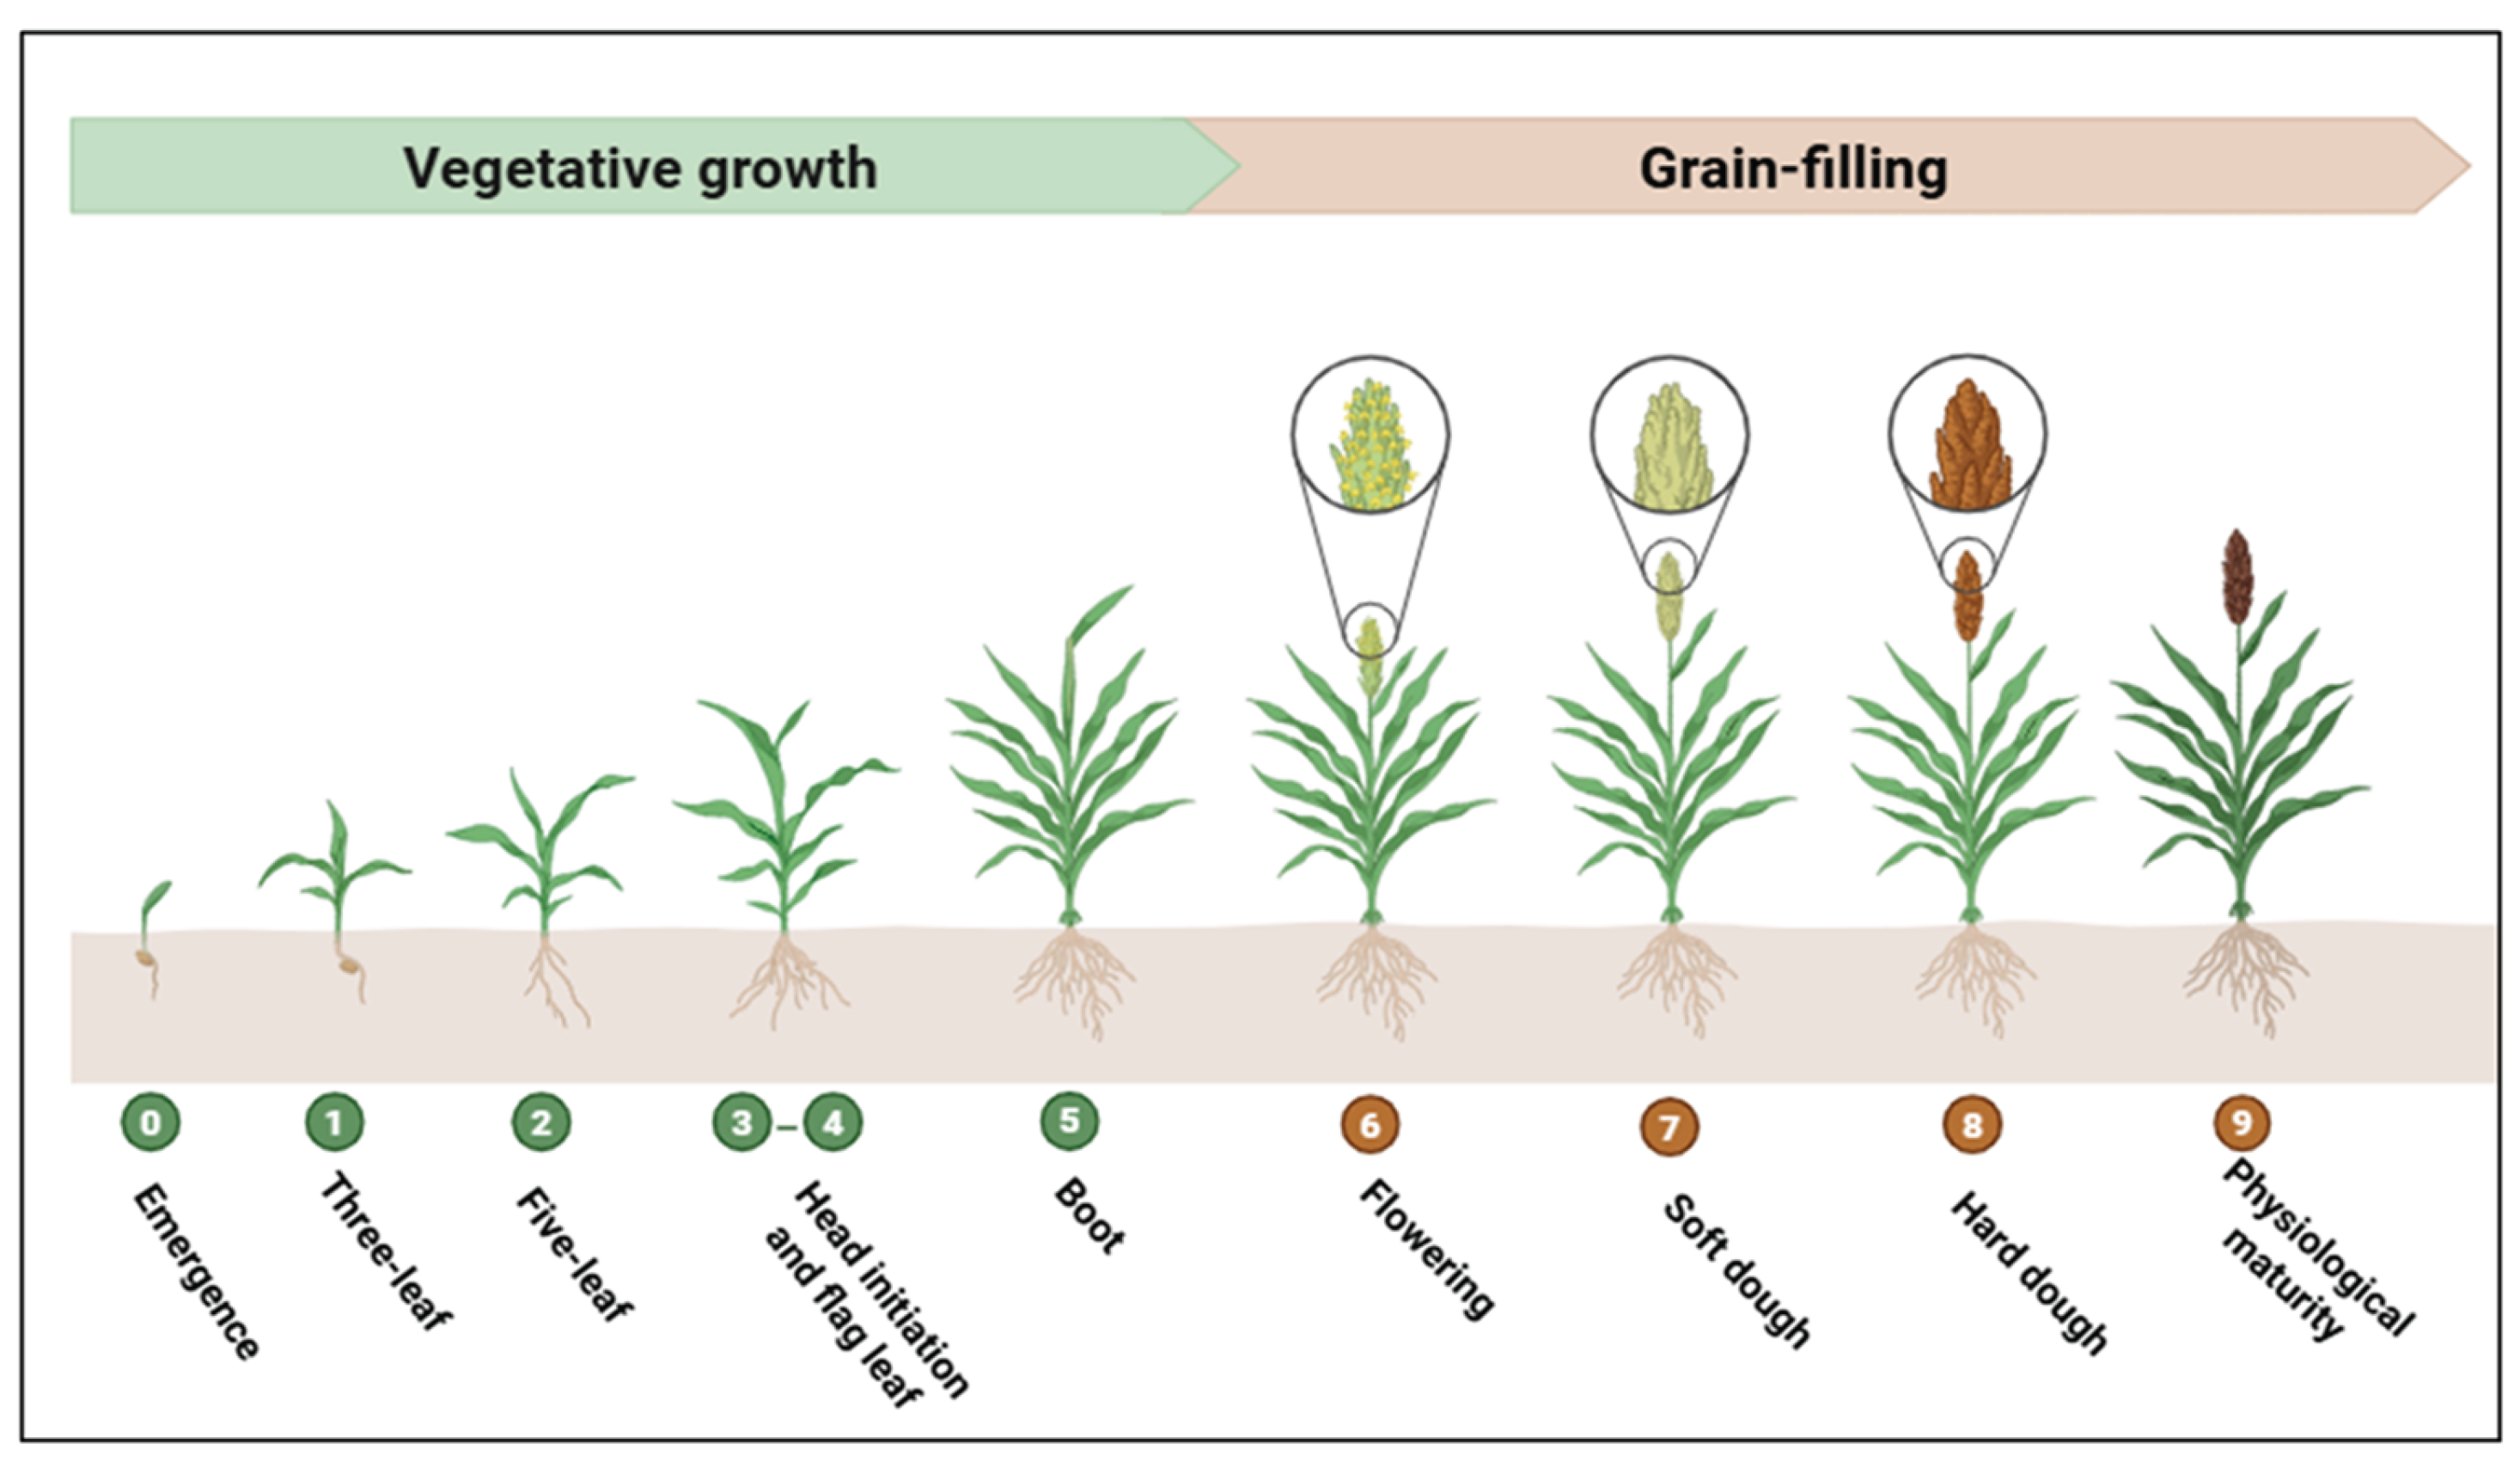
Figure 4.
Generalised framework illustrating coordinated drought-adaptive trait networks in sorghum and their operationalisation through hybrid physiological phenotyping. Created with Biorender.com.
Figure 4.
Generalised framework illustrating coordinated drought-adaptive trait networks in sorghum and their operationalisation through hybrid physiological phenotyping. Created with Biorender.com.
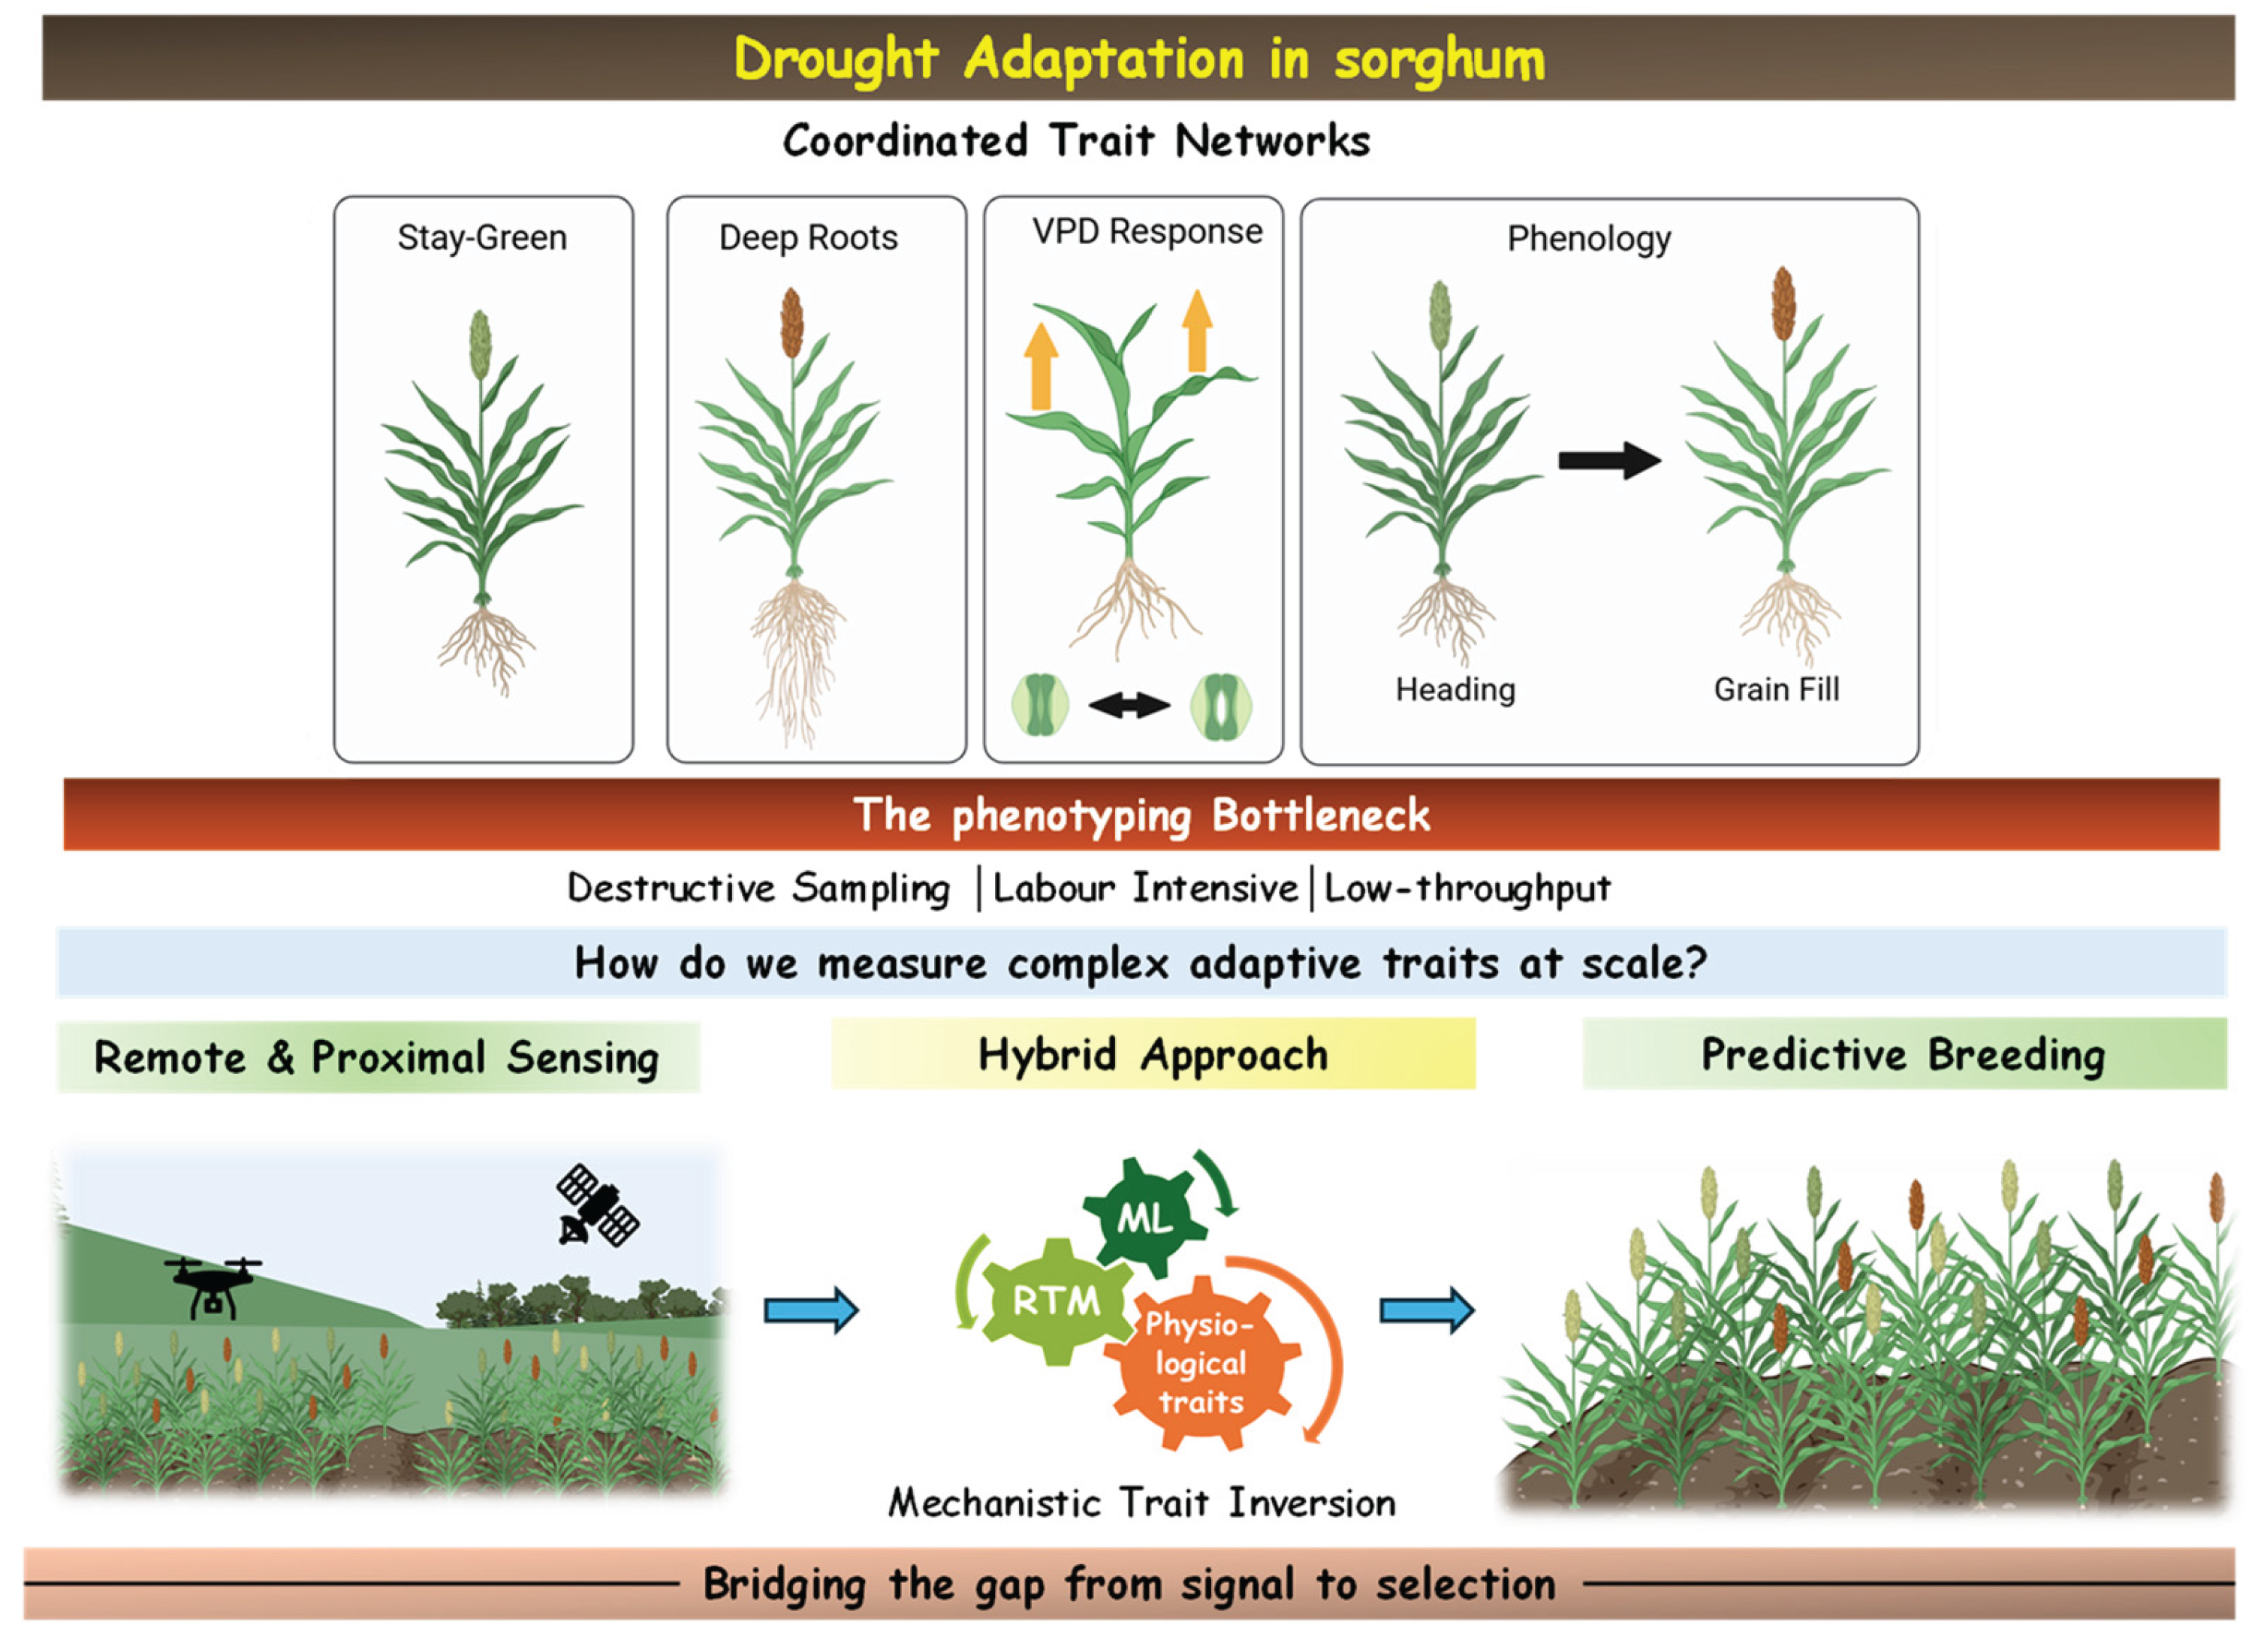
Figure 5.
Simplified workflow of radiative transfer modelling (RTM) for crop trait retrieval. Created with Biorender.com.
Figure 5.
Simplified workflow of radiative transfer modelling (RTM) for crop trait retrieval. Created with Biorender.com.
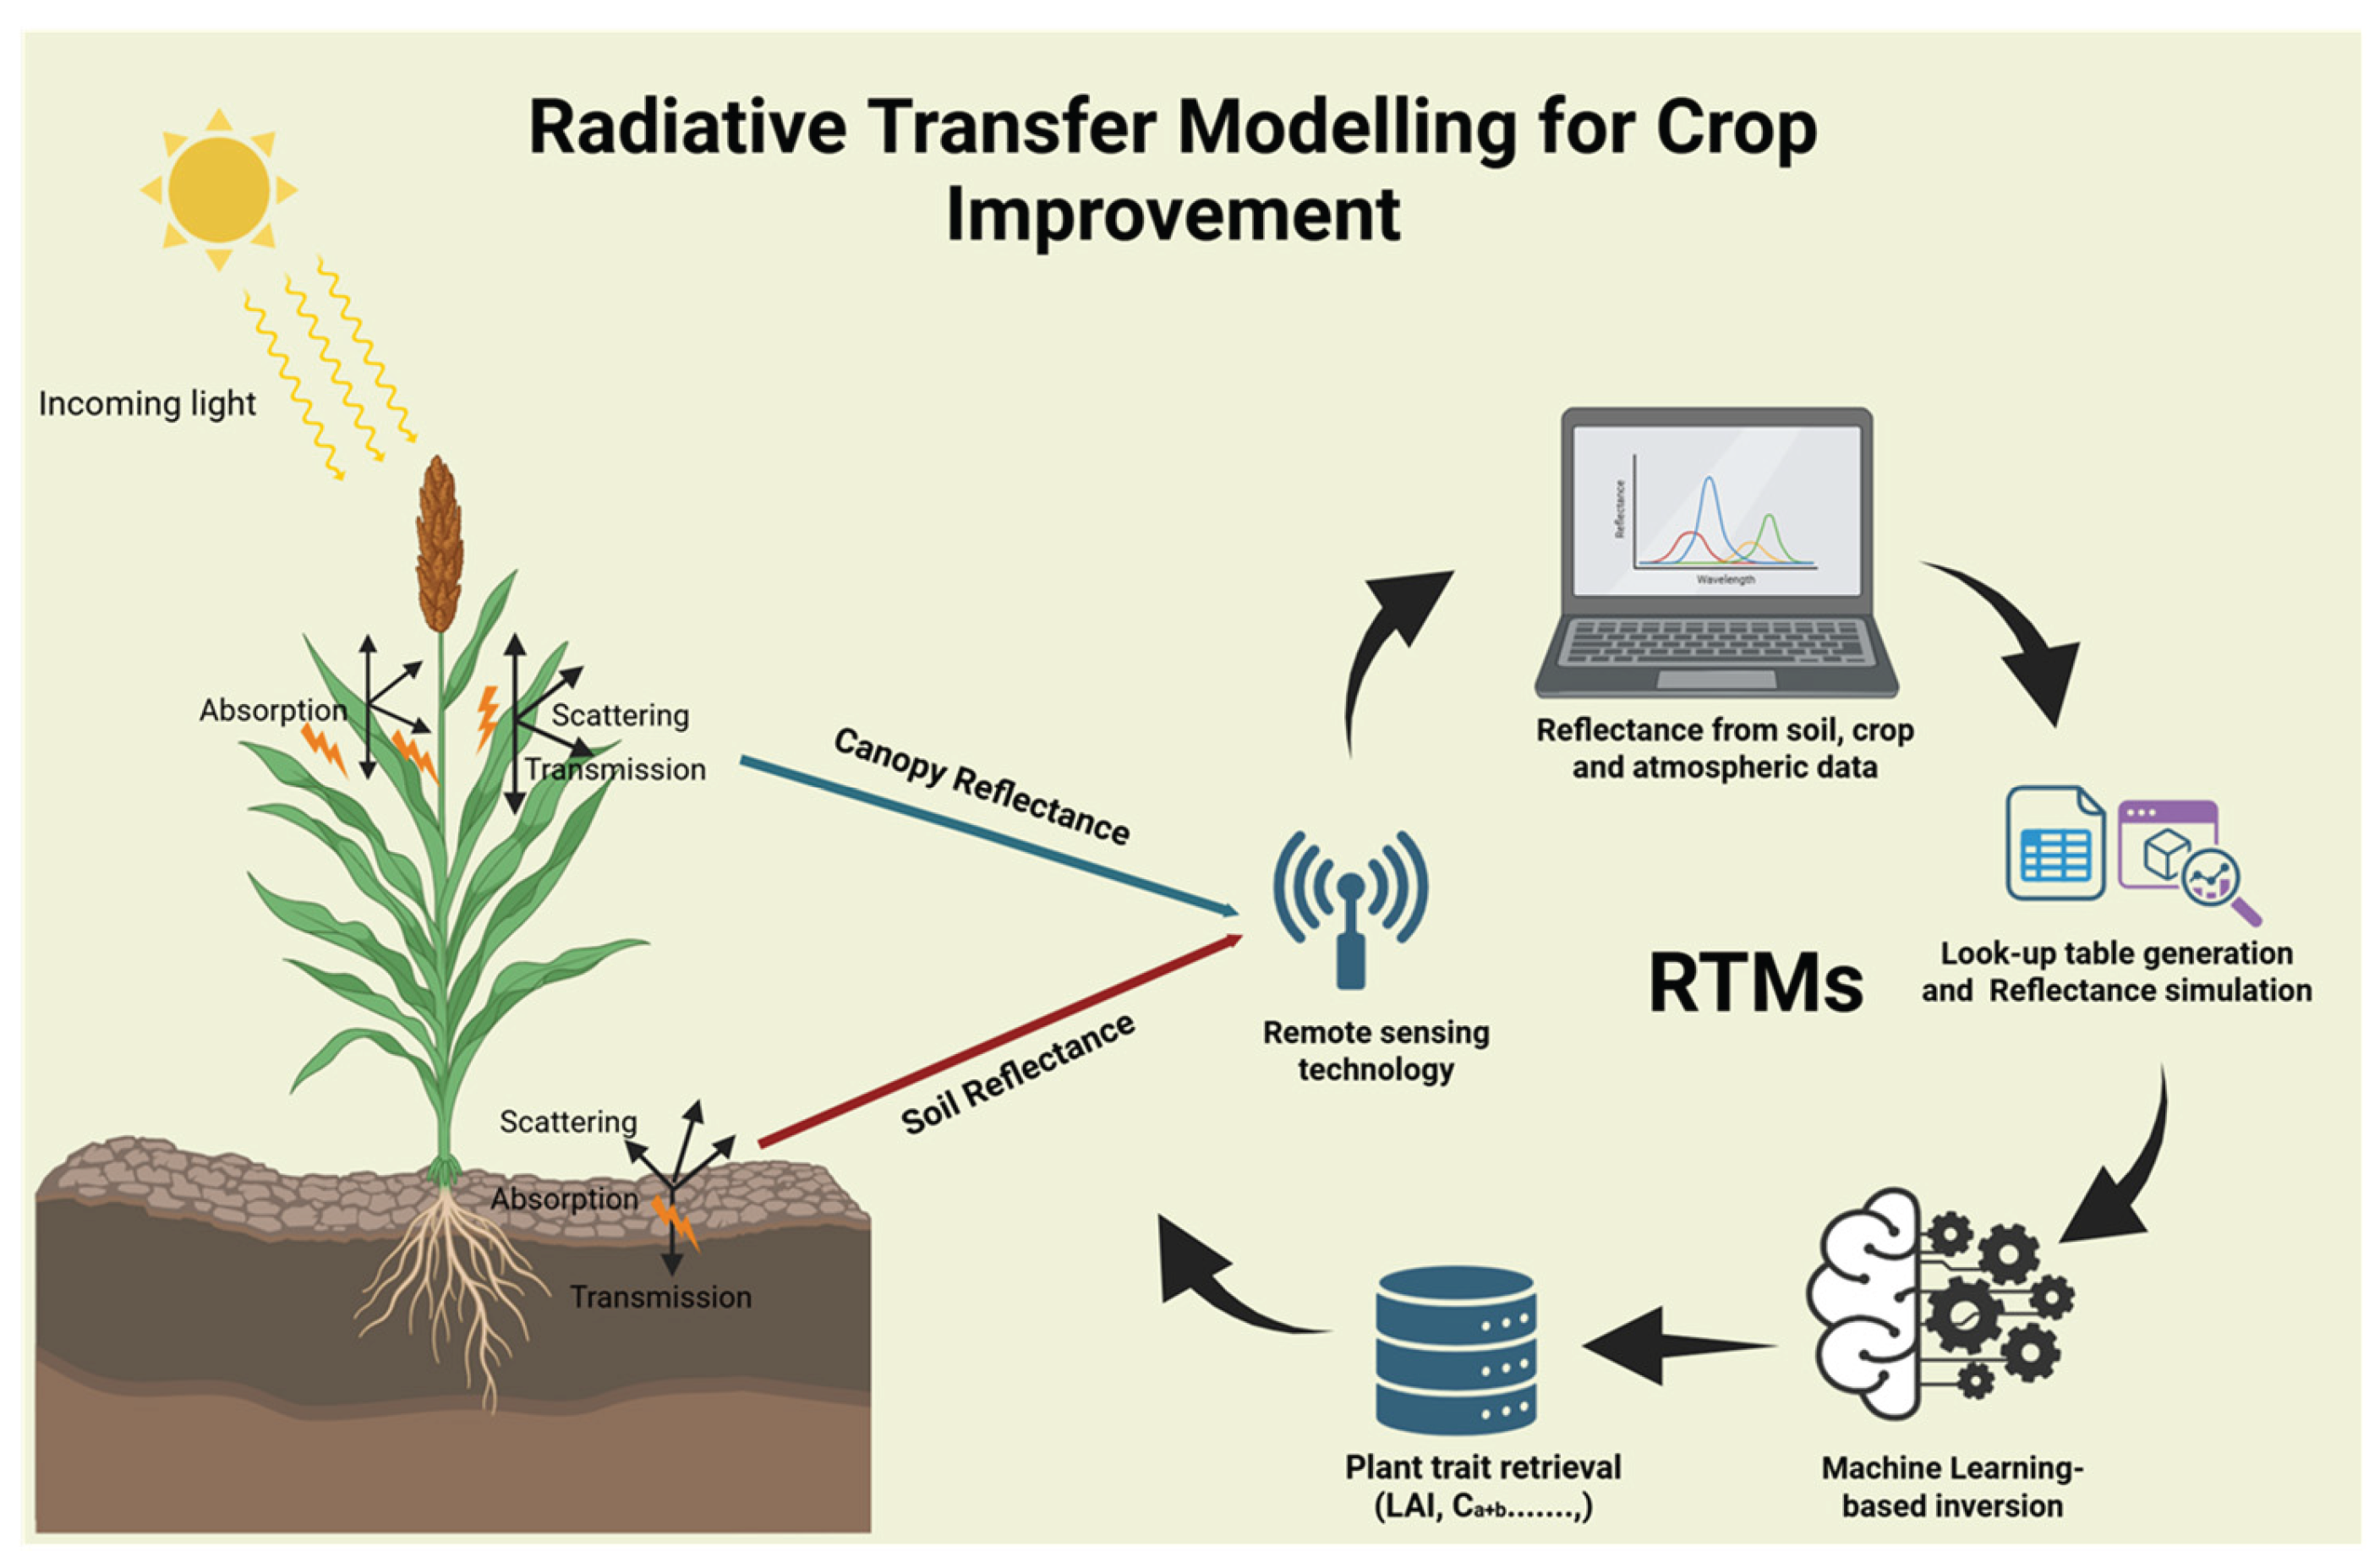
Figure 6.
Hybrid sensing and modelling framework for linking above- and below-ground traits (Created with BioRender.com; certain illustrative elements created using DALL·E, February 2026).
Figure 6.
Hybrid sensing and modelling framework for linking above- and below-ground traits (Created with BioRender.com; certain illustrative elements created using DALL·E, February 2026).
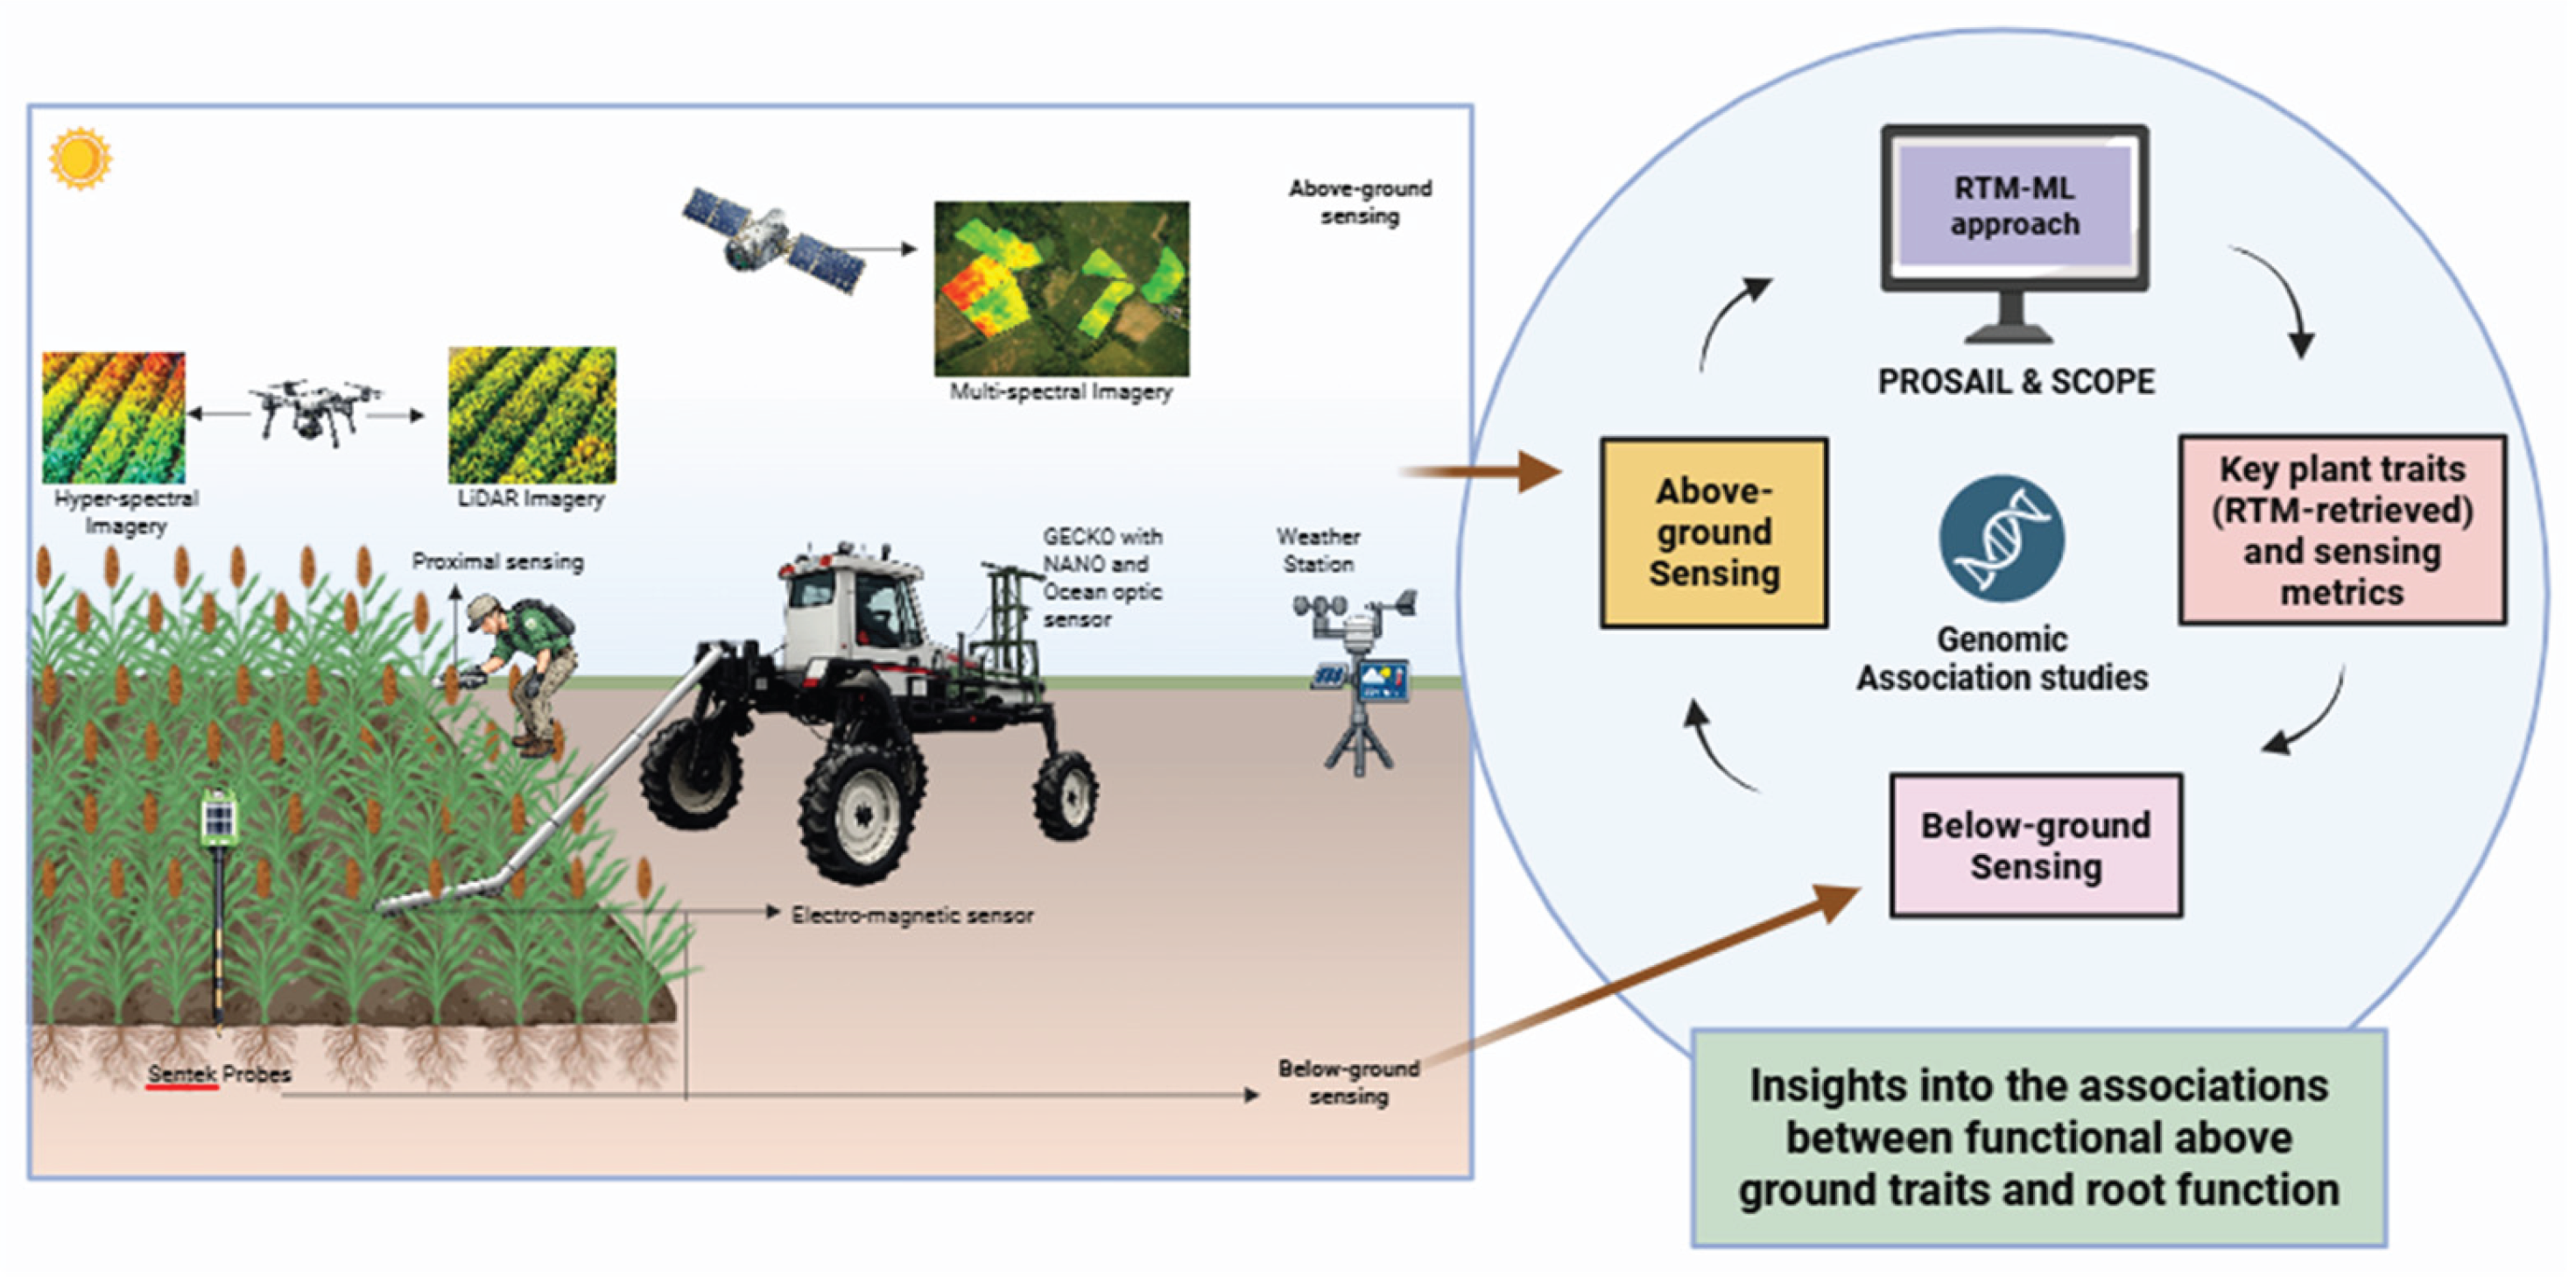

Table 1.
Summary of remote sensing technologies applied across major crops over the past two decades, highlighting sensor type, observation scale, spatial resolution, target traits, and reported model accuracies for physiological or yield-related phenotyping.
Table 1.
Summary of remote sensing technologies applied across major crops over the past two decades, highlighting sensor type, observation scale, spatial resolution, target traits, and reported model accuracies for physiological or yield-related phenotyping.
| Sensor type (platform) | Scale | Typical spatial resolution | Crop | Trait focused | Reported accuracy (as published) | Study |
|---|---|---|---|---|---|---|
| Thermal IR camera (ground proximal imaging) | Plot / field micro-scale | ~meter-scale footprint (camera scenes of ~1 m² canopy) | Wheat | Canopy stress and nitrogen (N) status via canopy temperature patterns | The canopy stress index (CSI) showed a strong relationship with yield (R2= 0.8). | [63] |
| Multispectral camera (UAV) | Plot / field | cm-level (typically 2-10 cm GSD) | Maize | Leaf Area Index (LAI) / chlorophyll (SPAD) / yield proxies | Best-performing index/model reported R2 = 0.86, RMSE = 0.14 from WDRVI index | [64] |
| LiDAR (UAV) | Plot / field | cm-dm (point cloud dependent) | Maize | Canopy/plant height (lodging-related structural trait) | Plant height estimation: R2 = 0.964, RMSE = 0.127, nRMSE = 7.449% | [65] |
| RGB + multispectral (UAV) + 3D point cloud features | Plot / field | cm-level | Rice | Above-ground biomass (AGB) using spectral + 3D/temporal features | Plant height: R2 = 0.89, RMSE= 5.08 cm Best accuracy for above-ground Biomass: R2 = 0.88, RMSE = 1111 kg/ha, nRMSE = 9.76%. |
[66] |
| Multispectral (Sentinel-2 satellite) | Field / region | 10-20 m | Wheat | Within-field grain yield using multi-date S2 + RTM/ML | Best performing model: Random Forest (RF) R2= 0.89, RMSE= 0.74t/ha when used LAI retrieved from RTM | [67] |
| Multispectral indices (satellite) + panel regression (simulated S2) | Farm / region | 10 m class (Sentinel-2 family) | Cotton | Yield estimation from red-edge indices | Best-fit date/index: R² up to 0.96, RMSE = 0.21 (t/ha) | [68] |
| Sentinel-2 VIs (satellite) | Commercial plots / region | 10-20 m | Cotton | Yield mapping (multi-season) | Yield estimation using EVI at pixel-level showed the best accuracy with R2=0.78 and RMSE=0.695 t/ha | [69] |
| Multi-satellite comparison (PlanetScope vs Sentinel-2 vs Landsat 8) | Field / region | ~3 m (PlanetScope), 10 m (S2), 30 m (L8) | Soybean | Yield estimation with meteorological/topographic covariates | Yield estimation, model: RF: MAE: PlanetScope= 0.091t/ha, Sentinel-2= 0.120t/ha Landsat8= 0.097t/ha |
[70] |
| Proximal hyperspectral spectroscopy (ground, field experiments) | Leaf / canopy / plot | Very high spectral resolution (nm-scale bands) | Wheat | Plant N concentration (PNC) | The best PNC prediction was by combining proximal hyperspectral sensing with weather data R2= 0.79-0.85, RMSE = 0.23-0.27% |
[71] |
| Hyperspectral reflectance (HTP screening concept, field-oriented) | Plot / breeding trials | Sensor-dependent | Soybean | Genetic variation in N accumulation / fixation-related traits | The best prediction of seed protein content was by PLSR model, R2= 0.805. | [72] |
Table 2.
Summary of remote sensing indices used to capture canopy structure, water status and photosynthetic responses relevant to drought adaptation and breeding in sorghum.
Table 2.
Summary of remote sensing indices used to capture canopy structure, water status and photosynthetic responses relevant to drought adaptation and breeding in sorghum.
| Metric | Full form | Physiological meaning | What it captures | Breeding relevance | Source |
|---|---|---|---|---|---|
| NDVI | Normalized Difference Vegetation Index | Fractional canopy cover and chlorophyll presence | Canopy size, senescence dynamics, stay-green expression | Moderate-high heritability, correlates with biomass and drought yield | [34,49] |
| NDRE | Normalized Difference Red Edge Index | Chlorophyll sensitivity under dense canopies | Delayed senescence, nitrogen status | Strong discriminator of stay-green genotypes | [34] |
| EVI | Enhanced Vegetation Index | Reduces soil/background influence | Canopy vigour at high biomass | Biomass estimation under dense stands | [95] |
| NDVI-TVDI | NDVI-Temperature Vegetation Dryness Index | Thermal-greenness drought framework | Evaporative cooling vs canopy size | Interpretable drought adaptation proxy | [96] |
| SIF (O₂-A/ O₂-B) | Solar induced fluorescence | Photosynthetic regulation | Early stress signalling | Detects stress before greenness decline | [97] |
| PRI | Photochemical Reflectance Index | Photochemical efficiency | Light-use efficiency | RUE proxy | [98] |
| WI | Water index | Leaf water content | Canopy dehydration | Rapid drought screening | [99] |
| MSI | Moisture stress index | Leaf /canopy water content | Tissue dehydration | Screening moisture stress tolerance | [100] |
| NDWI | Normalized Difference Water Index | Canopy water status | Relative water content & stress | Rapid drought screening | [99] |
| MSAVI | Modified Soil Adjusted Vegetation Index | Minimizes soil noise |
Early canopy development |
Seedling vigour screening |
[101] |
| OSAVI | Optimized Soil Adjusted Vegetation Index | Soil-adjusted greenness | Low-LAI canopy structure | Early drought vigour selection | [102] |
| CRIedge | Carotenoid Reflectance Index (Red-edge) | Carotenoid stress pigments | Oxidative stress / photoprotection | Stress-tolerant genotype detection | [103] |
Table 3.
Summary of key phenotyping bottlenecks limiting the assessment of drought-adaptive traits in sorghum. Alongside emerging methodological solutions and representative studies published.
Table 3.
Summary of key phenotyping bottlenecks limiting the assessment of drought-adaptive traits in sorghum. Alongside emerging methodological solutions and representative studies published.
| Bottleneck | Solutions Demonstrated | Representative Studies (2020-2025) |
|---|---|---|
| Scale & Throughput | UAV & tractor HTP platforms; automated plot extraction; time-series canopy metrics (growth curves, senescence, height). | [34,104,115] |
| Field vs Controlled Environments | Multi-sensor fusion (RGB + MS + HS + thermal); radiometric & BRDF corrections; repeated flights; proximal sensors for calibration. | [55,115,118,119] |
| Complex & Dynamic Traits | Time-series VIs and AUC; hyperspectral + SIF-based photosynthesis estimation; ML linking canopy dynamics to stay-green and root traits. | [6,12,34,82,118,120] |
| Sensor & Technology Limitations | Miniaturised hyperspectral sensors; radiometric calibration workflows; 3D canopy reconstruction (SfM, LiDAR); RGB-HS-FLUO fusion. | [121,122,123] |
| Data Annotation Bottleneck | Deep learning segmentation; weak/self-supervised learning; automated head/stay-green detection; synthetic datasets for training. | [124,125,126] |
| Integration with Genomics & Modelling | Genomic prediction using UAV traits; multi-modal ML (phenomics + weather + genomics); physiology traits feeding crop models. | [6,127,128,129] |
| Root Traits (“Hidden Half”) | Predicting root traits from UAV canopy trajectories (ML); integrating soil sensing (EM, ERT); modelling root plasticity & water capture. | [12,130,131] |
Disclaimer/Publisher’s Note: The statements, opinions and data contained in all publications are solely those of the individual author(s) and contributor(s) and not of MDPI and/or the editor(s). MDPI and/or the editor(s) disclaim responsibility for any injury to people or property resulting from any ideas, methods, instructions or products referred to in the content. |
© 2026 by the authors. Licensee MDPI, Basel, Switzerland. This article is an open access article distributed under the terms and conditions of the Creative Commons Attribution (CC BY) license (http://creativecommons.org/licenses/by/4.0/).
Copyright: This open access article is published under a Creative Commons CC BY 4.0 license, which permit the free download, distribution, and reuse, provided that the author and preprint are cited in any reuse.


