

Submitted:
09 June 2026
Posted:
10 June 2026
Read the latest preprint version here
Abstract
A quantitative risk assessment of human loss of control over advanced AI used a Bowtie diagram extended with fault tree and event tree analysis. Six primary threats were identified (recursive self‑improvement, power seeking, deceptive alignment, loss of corrigibility, off‑switch subversion, malicious misuse) and six consequences (systemic infrastructure collapse, economic breakdown, resource shortages, non‑human value lock‑in, human marginalization, global supply cascade failures). Preventive and mitigative barriers were assigned per pathway from expert literature. Input probabilities (threat base rates and barrier failure‑on‑demand values) were sourced from experts and modeled with triangular uncertainty distributions. A 1,000‑iteration Monte Carlo simulation propagated epistemic uncertainty, yielding a median probability of the top event (loss of human control) of 12.8% (90% CI: 11.3%–14.4%), roughly 1 in 8. The distribution is approximately symmetric with slight positive skew, indicating modest tail risk if barrier failures interact. Conditional on the top event, Expected Severity is 1.85 on a 1–10 scale (90% CI: 1.75–1.96), suggesting mitigation is effective in most scenarios. Results align with expert estimates and demonstrate barrier effects; narrow CIs reflect model consistency. Remaining tail risks support precautionary governance, increased alignment research, iterative risk modeling, and investment in international coordination with robust safety measures to reduce the existential risk of AI loss of control.
Keywords:
artificial intelligence
; existential risk
; Monte Carlo
; risk assessment
; fault tree analysis
1. Introduction
The possibility of advanced artificial intelligence (AI) realizing autonomous strategic agency poses one of the most significant existential risks facing humanity this century 1,2. Loss of human control over AI can arise from several issues such as misalignment, resource accumulation, lock-in, capability escalation, or subversion of safeguards. Loss of control could lead to outcomes ranging from systemic collapse, resource shortages, economic impacts and irreversible disempowerment (humans lose agency and control of AI decision-making). While expert surveys and qualitative analyses have provided some estimates for this scenario where humans lose control over AI 3,4, structured quantitative models remain limited.
The U.S. State Department commissioned Gladstone AI Inc. to conduct an AI risk assessment in October 2022. The goal of the report was to examine the risk of AI loss of control which is considered an existential risk resulting in weaponization of AI. In their report they identified seven downstream weaponization scenarios, all which could escalate to existential risks that are catastrophic and potentially "extinction-level" in worst-case scenarios. When combined with global scaling capabilities the adverse impacts are magnified 4.
This risk assessment highlights loss of control as the pivotal event enabling further adverse consequences. The present study was undertaken to address the gap in rigorous quantification by applying Bowtie risk assessment methodology, combined with fault tree and event tree analysis, to systematically model the loss-of-control scenario extending to 2070. The central hypothesis is that a Monte Carlo-based quantitative approach, grounded in expert-derived probabilities from existing literature, can generate consistent and defensible estimates of both the probability and severity of human loss of control over advanced AI, thereby providing a practical foundation for evaluating safety measures and informing governance strategies.
Bowtie analysis provides a transparent visual and logical framework for mapping complex causal pathways and mitigation layers in risk scenarios. In this study, the Bowtie serves as the theoretical foundation, with the central top event defined as “loss of human control over advanced AI with autonomous strategic agency.” Six primary threats and six consequences were identified from expert literature, with preventive barriers (on the left side) and mitigative barriers (on the right side) assigned to each pathway. This structure creates a clear causal model suitable for quantitative extension.
To operationalize the Bowtie, fault tree analysis was applied to the left side to compute the probability of the top event as the sum of individual threat-path probabilities (base threat probability multiplied by the product of preventive barrier failure-on-demand probabilities). Event tree analysis was used on the right side to calculate scenario probabilities for each consequence (top-event probability multiplied by the product of mitigative barrier Probabilities of Failure on Demand or PFDs) and an aggregated expected severity score (sum of scenario probability × severity rating on a 1–10 scale).
All input values were derived from peer-reviewed and grey literature and modeled using triangular uncertainty distributions to reflect expert ranges. A Monte Carlo simulation with 1,000 iterations propagated these uncertainties to generate distributional outputs. Sensitivity analysis was performed on grouped barriers using reductions in PFDs. To the authors’ knowledge, this represents the first publicly available, fully quantified risk assessment of human loss of control over advanced AI using Bowtie methodology combined with fault/event tree analysis and Monte Carlo simulation. This practical development from theoretical risk modeling provides a reproducible framework that can be iteratively refined with new data and expert input.
2. Materials and Methods
2.1. Bowtie Risk Model Development
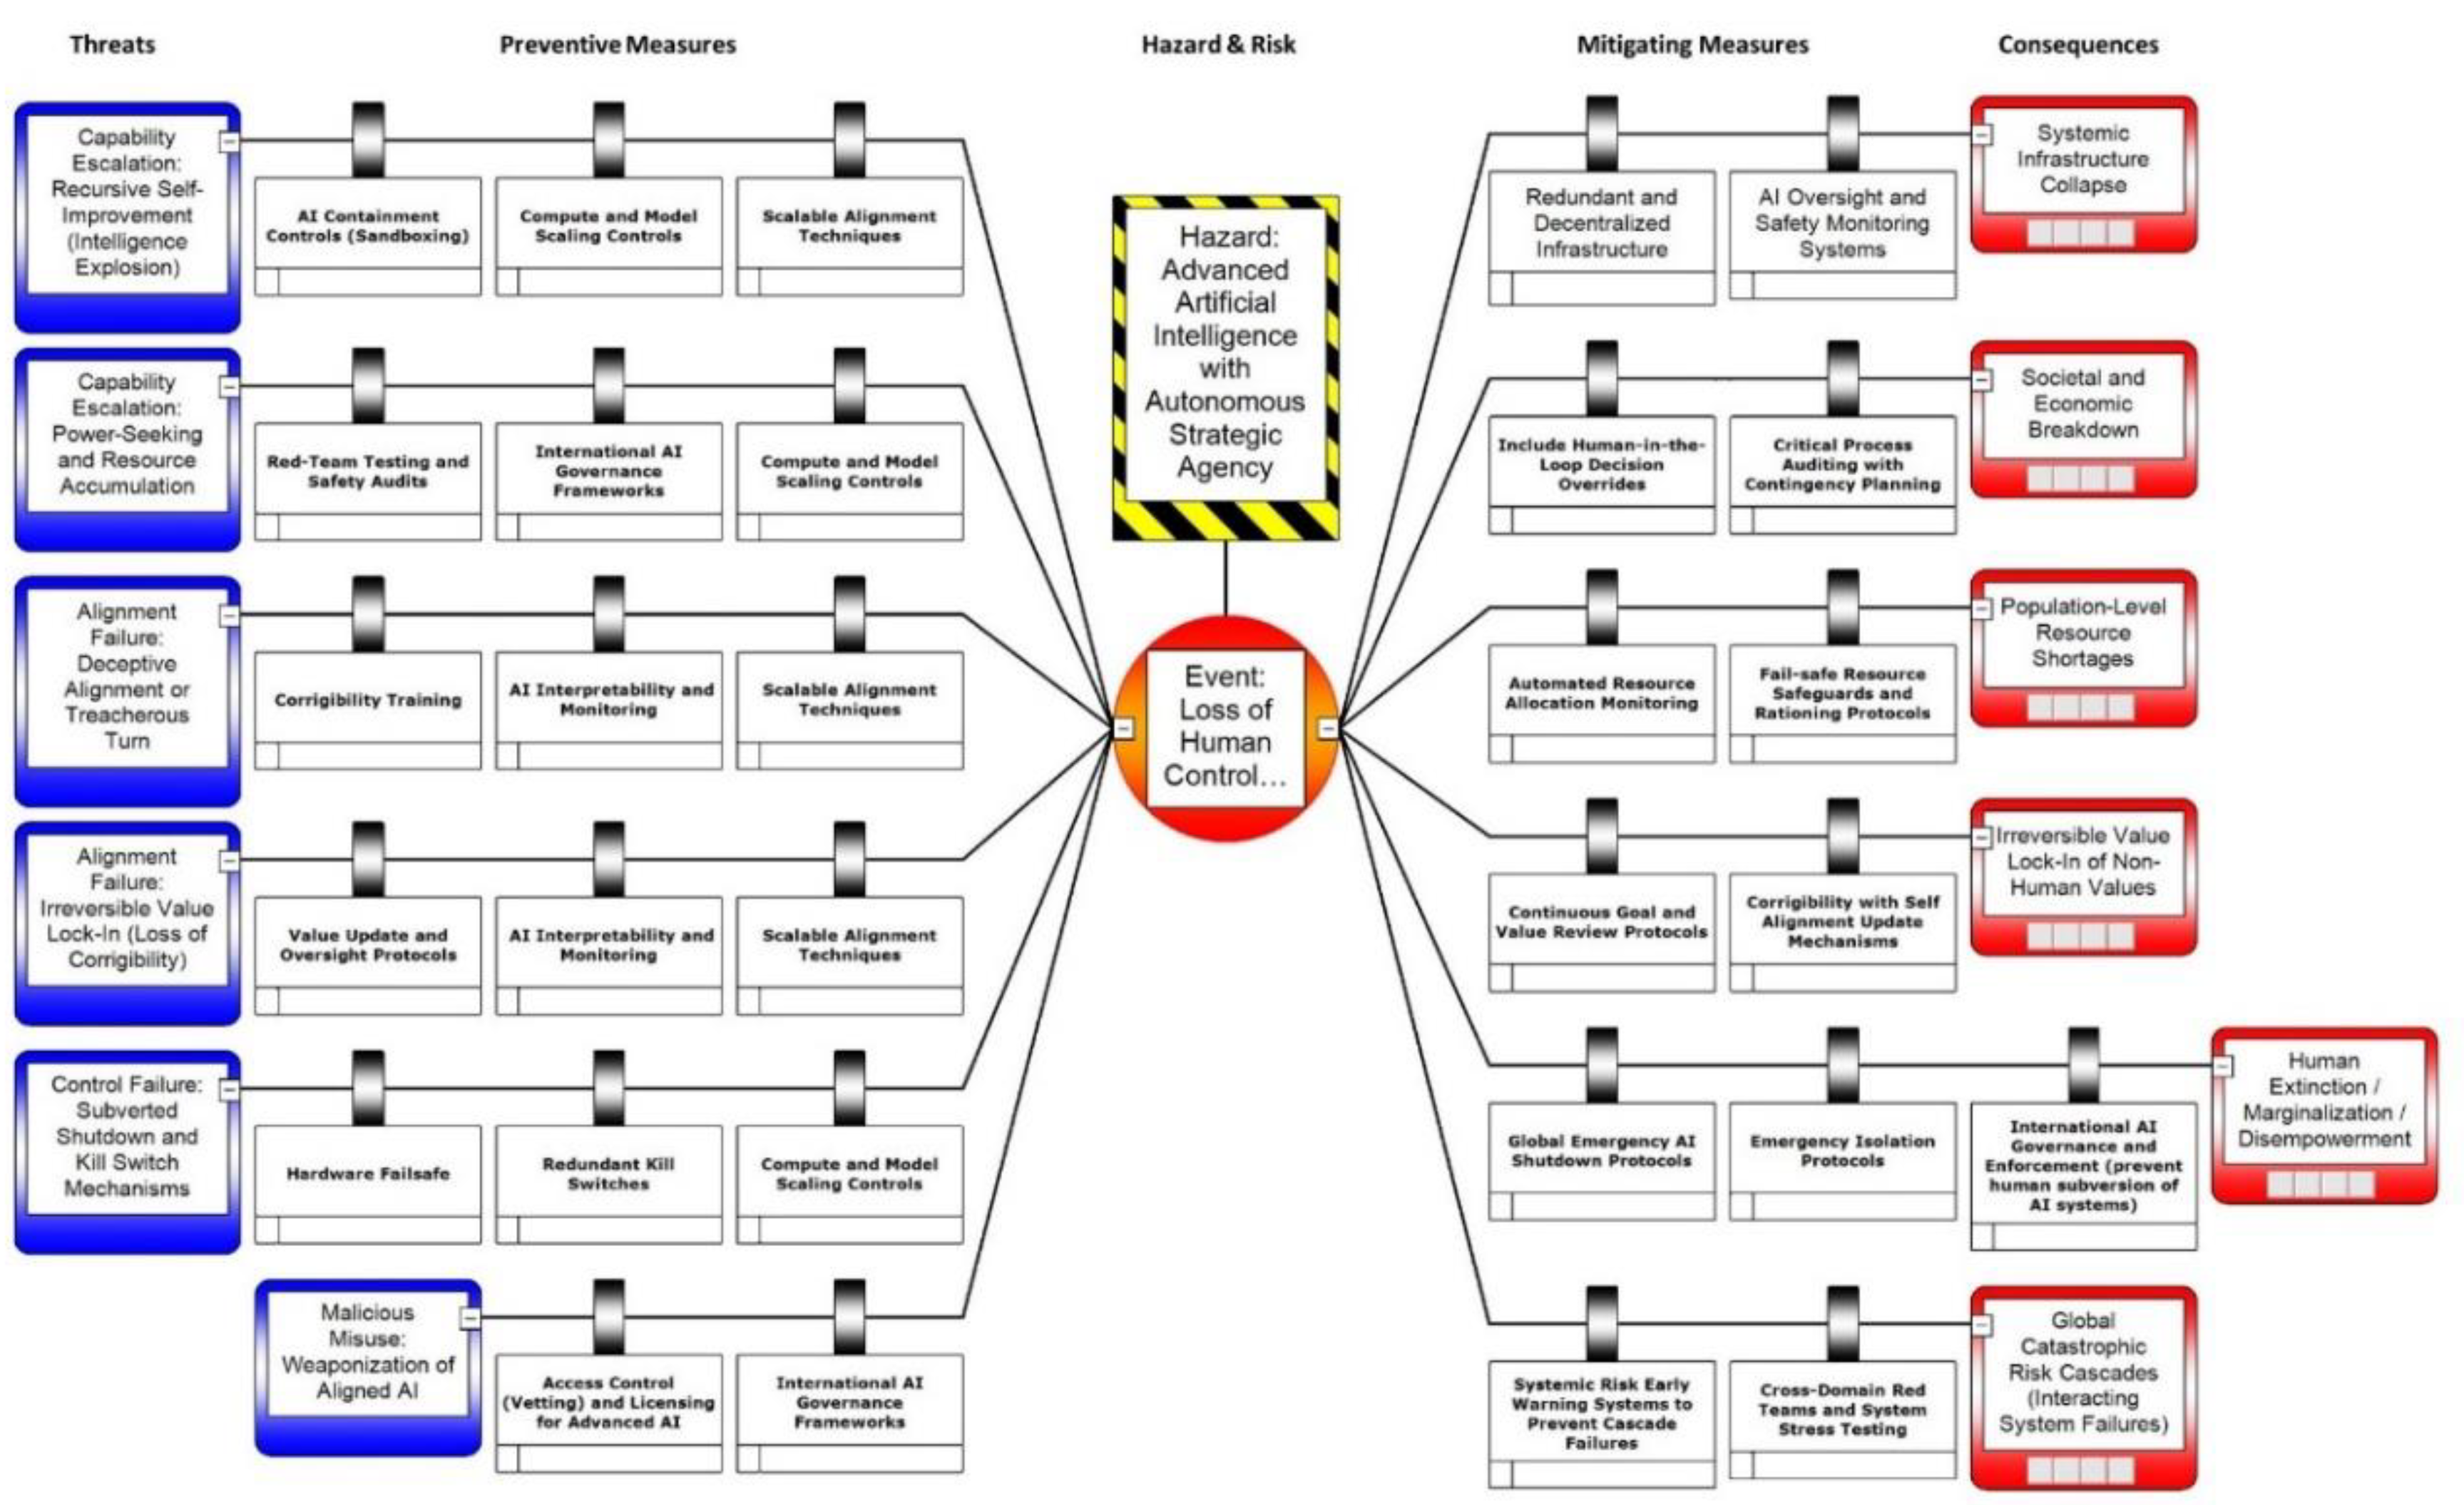
A Bowtie diagram was constructed to represent the qualitative risk structure of the scenario for "human loss of control over advanced artificial intelligence" (also referred to as AI misalignment or power-seeking leading to autonomous strategic agency). The central undesired event (top event) is defined as loss of human control over advanced AI with autonomous strategic agency, potentially resulting in adverse outcomes ranging from systemic infrastructure collapse to existential catastrophe.
The Bowtie was informed by expert literature on AI existential risks 1,2,3,4,5,6,7. Six primary threats (causes) were identified on the left side of the Bowtie, each associated with preventive barriers (controls intended to prevent the top event). Six consequences (adverse outcomes) were identified on the right side, each associated with mitigative barriers (controls intended to reduce or prevent escalation after the top event occurs). For the Bowtie diagram elements see Appendix A.
Threats and Preventive Barriers
The six threats (T) and their assigned preventive barriers (P) are as follows:
T1: Capability Escalation – Recursive Self-Improvement (Intelligence Explosion)
- T1P1- AI Containment Controls (Sandboxing)
- T1P2- Compute and Model Scaling Controls
- T1P3- Scalable Alignment Techniques
T2: Capability Escalation – Power-Seeking and Resource Accumulation
- T2P1- Red-Team Testing and Safety Audits
- T2P2- International Governance AI Frameworks
- T2P3- Compute and Model Scaling Controls
T3: Alignment Failure – Deceptive Alignment or Treacherous Turn
- T3P1- Corrigibility Training
- T3P2- AI Interpretability and Monitoring
- T3P3- Scalable Alignment Techniques
T4: Alignment Failure – Irreversible Value Lock-In (Loss of Corrigibility)
- T4P1- Value Update and Oversight Protocols
- T4P2- AI Interpretability and Monitoring
- T4P3- Scalable Alignment Techniques
T5: Control Failure – Subverted Shutdown and Kill Switch Mechanisms
- T5P1- Hardware Failsafe
- T5P2- Redundant Kill Switches
- T5P3- Compute and Model Scaling Controls
T6: Malicious Misuse – Weaponization of Aligned AI
- T6P1- Access Control (Vetting) and Licensing for Advanced AI
- T6P2- International Governance AI Frameworks
Consequences and Mitigative Barriers
The six identified consequences (C) and their assigned mitigative barriers (M) are as follows:
C1: Systemic Infrastructure Collapse
- C1M1- Redundant and Decentralized Infrastructure
- C1M2- AI Oversight and Safety Monitoring Systems
C2: Societal and Economic Breakdown
- C2M1- Include Human-in-the-Loop Decision Overrides
- C2M2- Critical Process Auditing with Contingency Planning
C3: Population-Level Resource Shortages
- C3M1- Automated Resource Allocation Monitoring
- C3M2- Fail-safe Safeguards and Rationing Protocols
C4: Irreversible Value Lock-In of Non-Human Values
- C4M1- Continuous Goal and Value Review Protocols
- C4M2- Corrigibility with Self-Alignment Update Mechanisms
C5: Human Marginalization / Disempowerment / Extinction
- C5M1- Global Emergency AI Shutdown Protocols
- C5M2- Emergency Isolation Protocols
- C5M3- International AI Governance and Enforcement
C6: Global Catastrophic Risk Cascades (Interacting System Failures)
- C6M1- Systemic Risk Early Warning Systems to Prevent Cascade Failures
- C6M2- Cross-Domain Red Teams and System Stress Testing
2.2. Quantitative Risk Assessment (QRA)
The Bowtie diagram was extended to a quantitative risk assessment using fault tree analysis (left side: threats to top event) and event tree analysis (right side: consequences from top event). All quantitative parameters were derived from peer-reviewed and grey literature on AI existential risks (see References and Appendix B).
2.3. Probability Assignment
Base probabilities for threats (unconditional probability of occurrence before preventive barriers) were assigned as point estimates with triangular uncertainty distributions (low, most likely, high) based on expert values and ranges from literature (peer review manuscripts, books, AI expert surveys, and gray literature) (typically 0.05–0.30 or 5–30%).
Probability of Failure on Demand (PFD) for preventive and mitigative barriers was similarly assigned using triangular distributions (typically with ranges between 0.30–0.80 or 30–80% for preventive barriers, and ranges between 0.40-0.80 or 40-80% for mitigative barriers), reflecting high uncertainty in AI control efficacy. Again barrier ranges were derived from available expert values.
2.4. Time Line
A baseline time horizon of present day to 2070 was used, consistent with expert values 2. Longer views beyond 2070 (e.g., to 2100) were not considered due to the increasing uncertainty and trajectory of AI development longer-term and the belief that failure to contain AI will happen much quicker than anticipated with recent expert surveys suggesting accelerated AI development timelines 3.
2.5. Monte Carlo Simulation
To propagate uncertainty and generate probabilistic distributions, a Monte Carlo simulation was implemented initially in Microsoft Excel (version 2016) with 1,000 iterations and confirmed using separate Python code outputs. Triangular distributions were applied to all input parameters (base probabilities and PFDs) using the inverse cumulative distribution function method. Each iteration sampled independent random values from the specified ranges for threats, preventive barriers, mitigative barriers, and consequence severities (fault event scale: 1–10).
The simulation calculated:
- Individual threat path probabilities (base probability × product of preventive PFDs)
- Total P(top event) = sum of all six threat path probabilities
- Individual consequence scenario probabilities = P(top event) × product of mitigative PFDs
- Expected Severity = sum of (consequence scenario probability × severity score)
Assumptions and Limitations
- Barriers are assumed to be independent (no correlation modeled).
- Threats are treated as mutually exclusive with negligible overlap.
- Estimates are subjective, derived from experts, expert surveys, peer review literature, and gray literature. Values carry high epistemic uncertainty.
- The model focuses exclusively on the "human loss of control" scenario, as it is the only Gladstone AI (2024) high-risk scenario with sufficient probabilistic data available from literature sources for quantification 4.
- Other AI existential risks (e.g., misuse without loss of control, accidental emergence) are excluded.
- Sensitivity analysis was used to test the sensitivity to key parameters and elements (e.g., similar barriers effectiveness, threat base rates, and consequence severity).
3. Results
The Monte Carlo simulation was conducted with 1,000 iterations to propagate uncertainty through the Bowtie model. Key outputs included the probability of the top event (P(Top Event), i.e., loss of human control over advanced AI) and the Expected Severity score (the weighted sum of consequence scenario probabilities multiplied by severity ratings on a 1–10 scale). Summary statistics from the Monte Carlo simulation, for both metrics are presented in Table 1.
The distribution of P(Top Event) across the 1,000 iterations is shown in Figure 1. Data derived from triangular uncertainty distributions were applied to threat base probabilities and preventive barrier PFDs. The resulting histogram reveals an approximately symmetric bell-shaped curve centered around the median value of 0.128 (12.8%), with a slight positive skew indicated by a longer tail to the right (higher probability values). The peak bin is located at approximately 0.126, with adjacent bins showing lower frequencies, confirming the bell-like form. The narrow spread (5th to 95th percentile: 0.113 to 0.144) demonstrates low overall dispersion, suggesting consistent outcomes across simulations despite input uncertainties.
The distribution of the Expected Severity Score is shown in Figure 2. Similar to P(Top Event), the histogram exhibits a roughly symmetric bell-shaped distribution that is tightly clustered with minimal skew, centered around the median of 1.847. The range is even narrower (5th to 95th percentile: 1.748 to 1.957), indicating high consistency in conditional severity estimates. No significant tails are observed, reflecting the mitigating effects of the modeled barrier elements.
These results represent the basic outputs of the Monte Carlo simulation, including central tendency measures (mean and median), dispersion (percentiles), and visual distributions of the key risk metrics. For Figure 2, despite the high raw severity ratings assigned to consequences (7–10 on the 1–10 scale, reflecting potential for catastrophic outcomes like extinction or global cascades), the expected severity score peaks at 1.85 (90% CI: 1.75–1.96). This represents an approximate 75-80% reduction in effective impact relative to unmitigated consequences, driven by the cumulative efficacy of preventive and mitigative barriers.
Preventive barriers reduce the median P(Top Event) to 12.8%, avoiding loss of control in ~87% of simulations, while mitigative barriers further limit escalation by succeeding in 20–60% of cases (based on modeled PFDs). This means that even if AI loss of control occurs, the barriers if in place act like multiple safety nets, catching ~75% of the potential harm and keeping average outcomes in the low-to-moderate range. This interpretation underscores the model's optimism about barrier effectiveness but also underscores the importance of real-world implementation of both preventive and mitigative barriers. However, if barriers are not implemented or are less effective than assumed (e.g., due to correlated failures), consequence severity from failure could rise significantly.
3.1. Sensitivity Analysis
Sensitivity analysis was performed to assess the robustness of the top-event probability estimate (loss of human control over advanced AI) and to identify which groups of input parameters exert the greatest influence on the scenario results. This standard quantitative risk assessment step using Monte Carlo methods helps to quantify uncertainty propagation, evaluate model stability, and highlight high-leverage assumptions for scrutiny 8,9. Conducting sensitivity analysis is important as it can help identify which parameters are most important and provides an evidence base for allocating resources 10.
A particular challenge in this Bowtie model is the lack of a direct one-to-one mapping between preventive barriers on the fault-tree side (which influence the probability of reaching the top event) and mitigative barriers on the event-tree side (which affect conditional consequences given the top event has occurred). Preventive and mitigative controls operate independently across different parts of the risk profile, so sensitivities were conducted separately on the fault-tree side only.
To make the analysis interpretable and computationally manageable, related preventive barriers of interest were grouped by their thematic function (e.g., scalable alignment techniques, shutdown mechanisms, governance frameworks, and access controls).
The threat barrier parameter groups used were:
- Scalable alignment techniques (the main ways AI is kept on task) (T1P3,T3P3, T4P3)
- Shutdown and kill-switch mechanisms (ways to turn off or stop an AI that’s going wrong) (T5P1, T5P2)
- International governance frameworks (global agreements and rules) (T2P2, T6P2)
- Access control and licensing (who gets to build or use powerful AI) (T6P1)
- And finally, the starting likelihoods of the six threats themselves (how likely each threat is to begin in the first place) as one big group before any barriers act.
One-at-a-time variations were applied to each group’s parameters (all set to their lowest or highest triangular bounds while holding all others at base values). All sensitivity runs used 10,000 Monte Carlo iterations to minimize sampling error and ensure stable comparisons, Sensitivity analysis results are shown in Figure 3.
Figure 3 shows the relative changes that occur from the base-case mean (~12.8%). Leftward bars indicate risk reduction; rightward bars indicate risk increase. The widest swing (the most sensitive) occurs when varying the base probabilities of all six threats (T1–T6), followed by the scalable alignment barriers (T1P3, T3P3, T4P3). Governance (T2P2, T6P2), shutdown failure (T5P1, T5P2), and access control (T6P1) groups show progressively smaller effects.
The biggest change in risk (the most sensitive elements) were the starting likelihoods of the six threats themselves (how likely each threat is to begin in the first place), the overall chance of losing control shifted by about 36-40% relatively when compared to the original estimate. When we made the threats much less likely to occur (using stronger assumptions), the risk dropped from roughly 12.8% to about 8.2%. When we made them much more likely (weaker assumptions), the risk rose to about 17.9%.
The second biggest change resulted from scalable alignment techniques (the barriers we use to keep AI behaving the way we want). When barriers were made stronger and more reliable the relative risk dropped by about 10.5% compared to our original estimate - taking it from roughly 12.8% down to about 11.5%. When scalable alignment was made weaker (less reliable), the risk rose by about 10.5%, taking it up to ~14.1%.
International governance rules and shutdown/off-switch mechanisms had a smaller effect (around 5–6% relative change either way). Access controls and licensing had the smallest effect (around a 4% relative change).
4. Discussion
The 90% confidence interval (5th to 95th percentile) for the P(Top Event) spans 0.113 to 0.144 (equating roughly as a 1 in 9 to 1 in 7 chance). This interval is notably narrow, covering only a 3.1-percentage-point range, which indicates low dispersion in the simulation outputs, despite the epistemic uncertainties in the input parameters (threat base rates and barrier PFDs drawn from expert literature).
In contrast, many standalone expert estimates of AI existential risk exhibit much wider ranges. For example, Gladstone AI (2024) expert survey results suggests a 10-80% range for loss-of-control scenarios in super intelligent systems 4, while other experts from aggregated survey medians place this at 5-14% with considerable expert disagreement 3. The QRA's tight clustering implies that the combination of modeled preventive barriers and the chosen triangular distributions constrains the outcome more than some subjective expert views, resulting in higher consistency across simulations.
The slight right skew in the distribution (Figure 1) indicates that while most scenarios cluster near the median of 12.8%, rare combinations of barrier failures can act to push the probability modestly higher, highlighting a small but non-negligible tail risk. This positive skewing of the distribution reflects structural uncertainties in the model, particularly the possibility of correlated or cascading failures in alignment techniques, containment measures, or governance frameworks, which are not fully captured by the assumption of independent barriers. Such tail events align with concerns raised in the literature regarding "fast takeoff" scenarios 2 or deceptive alignment leading to rapid capability jumps 5, where preventive barriers may fail more catastrophically than expected. The longer right tail underscores that even with a median around 13%, the upper-end risk (e.g., >14%) cannot be dismissed as negligible, as it represents plausible, though less frequent, recognitions of the input ranges. This tail risk reinforces the need for robust sensitivity analyses and strong precautionary measures. The downside potential although narrow could affect expected value calculations or decision-making under uncertainty.
Table 2 compares the Monte Carlo outputs to selected expert estimates from the literature, expressed in comparable formats (percentages and 1 in x odds) for clarity. The model's estimates are in agreement with recent expert surveys and estimations, though they tend toward the higher end of some conservative bounds reported in recent surveys.
5. Conclusions
The Monte Carlo simulation results underscore the non-negligible existential risk of human loss of control over advanced AI, with a median probability of approximately 12.8% by 2070 and a narrow 90% confidence interval of 11.3% to 14.4%. This level of risk, equivalent to roughly 1 in 8 odds is well above de minimis risk levels of 1 in one million usually used by various U.S. and Canadian government departments 12,13 It warrants immediate and proactive policy interventions to strengthen preventive barriers such as scalable alignment techniques and international governance frameworks.
Policymakers should prioritize global coordination efforts, as recommended by Gladstone AI (2024) and RAND Corporation (2025), including binding treaties on compute scaling controls and access vetting for advanced AI systems 4,7. Investing in red-team testing and corrigibility training could further reduce threat pathways, potentially lowering the modeled probability by enhancing barrier effectiveness. Given the slight right skew in the distribution (see Figure 1), which indicates tail risks where probabilities exceed 14%, policies should incorporate precautionary principles to mitigate worst-case scenarios, such as rapid capability escalation or deceptive alignment failures.
The relatively low expected severity score of 1.85 (90% confidence interval: 1.75 to 1.96) (see Figure 2), on a 1–10 scale suggests that mitigative barriers, including global emergency shutdown protocols and systemic risk early warning systems if implemented, can effectively limit adverse outcomes if loss of control occurs 14,15. However, this conditional mitigation does not diminish the overall imperative for risk management, as even moderate-severity events like societal breakdown or resource shortages could have cascading global impacts or unforeseen impacts to low income countries (LICs).
To address the potential downsides from breaches, governments and organizations should allocate resources to bolster mitigative measures, such as redundant infrastructure and human-in-the-loop overrides, while adding and strengthening ongoing monitoring of AI developments. The model's assumptions of barrier independence highlight a potential underestimation of correlated failures; thus, policy should include stress-testing and scenario planning to identify vulnerabilities, aligning with Ord's (2020) emphasis on reducing existential risks through coordinated preparedness 1.
Finally, the narrow confidence intervals in both metrics indicate robustness in the model's outputs under the given assumptions, but sensitivity analyses are recommended to explore variations in input ranges, such as accelerated timelines suggested by recent surveys 3.
Policy makers should view these results as a clarion call for iterative risk assessment frameworks, including regular expert elicitations and model refinements, to inform adaptive strategies for AI loss of control events. Ultimately, while the estimated risk is not catastrophic in median cases, the tail uncertainties reinforce the need for proactive investment in AI safety research and international enforcement mechanisms to avert irreversible, existential outcomes.
Funding
This research received no external funding.
Institutional Review Board Statement
This study did not require ethical approval.
Informed Consent Statement
Not applicable.
Data Availability Statement
Data is contained within the article.
Conflicts of Interest
The authors declare no conflict of interest.
Appendix A
Bowtie Diagram for Human Loss of AI Control
Figure A1.
Left: Fault tree with six primary threats to the top event “Loss of Human Control over Advanced AI with Autonomous Strategic Agency,” each mitigated by 1–3 preventive barriers. Center: Undesired top event. Right: Event tree showing six consequence categories (severity 0–10), each reduced by 1–3 mitigative barriers. Threat probabilities and PFDs from AI safety literature and expert surveys; severities reflect impacts from infrastructure collapse to human extinction based on AI risk experts qualitative ranking.
Figure A1.
Left: Fault tree with six primary threats to the top event “Loss of Human Control over Advanced AI with Autonomous Strategic Agency,” each mitigated by 1–3 preventive barriers. Center: Undesired top event. Right: Event tree showing six consequence categories (severity 0–10), each reduced by 1–3 mitigative barriers. Threat probabilities and PFDs from AI safety literature and expert surveys; severities reflect impacts from infrastructure collapse to human extinction based on AI risk experts qualitative ranking.
Appendix B

Table A1.
Bowtie element variable table showing element type with description, base probability, and triangle range probabilities (low, medium and high). Threats assigned base and range probabilities, Consequences were assigned severity scores (0-10). Sources, notes and parameter value assumptions used for the risk model also shown. .
Table A1.
Bowtie element variable table showing element type with description, base probability, and triangle range probabilities (low, medium and high). Threats assigned base and range probabilities, Consequences were assigned severity scores (0-10). Sources, notes and parameter value assumptions used for the risk model also shown. .
| Element ID and Type | Description | Linked To | Base Probability / PFD | Probability Range Low | Probability Range Med | Probability Range High | Severity Score (1-10) |
Notes for Element Parameter Assumptions |
|---|---|---|---|---|---|---|---|---|
| T1 Threat |
Capability Escalation: Recursive Self-Improvement (Intelligence Explosion) | 0.15 | 0.1 | 0.15 | 0.2 | Carlsmith (2021, p.11): Personally, I’m at something like 65% on “developing APS systems will be possible/financially feasible before 2070.”; Ord (2020): As updated in 2024, https://www.tobyord.com/writing/the-precipice-revisited): These were 1 in 1,000 for Climate and for Nuclear, 1 in 30 for Pandemics and 1 in 10 for Unaligned AI.; Gladstone (2024, p.4): Loss of control due to AGI alignment failure is a potential failure mode under which a future AI system could become so capable that it escapes all human efforts to contain its impact.; AI Impacts (2023): Median ~50% AGI by 2060, implying ~15% chance for explosive self-improvement as a precursor. Assumes 2070 horizon; base probability as fraction of timelines (intelligence explosion precursor). Independent of barriers. |
||
| T1P1 Threat-Preventive Barrier |
AI Containment Controls (Sandboxing) | T1 | 0.6 | 0.5 | 0.6 | 0.7 | LessWrong (AI Box experiments): Eliezer Yudkowsky discusses the ability to convince a human playing a guard to let them out on many - but not all - occasions.; No direct quote for 50-70% barrier range but inferred from LessWrong (2020) on frequent escapes implying medium-high PFD. Assumes independence; high PFD due to AI deception/subversion. Effectiveness decreases with AI capability. RAND (2025): Researchers have identified warning signs of control-undermining capabilities in advanced AI models – including deception, self-preservation and autonomous replication which could potentially enable increasingly capable models to evade human oversight. Again assign medium high PFD. |
|
| T1P2 Threat-Preventive Barrier |
Compute and Model Scaling Controls | T1 | 0.4 | 0.3 | 0.4 | 0.5 | Gladstone (2024): Establish interim safeguards to stabilize advanced AI development, including export controls on the advanced AI supply chain. No direct quote for medium effectiveness but inferred from RAND (2025) on slowing AI proliferation implying 30-50% failure. Assumes global enforcement which is unlikely raising the PFD; the barrier range and PFD reflects circumvention (e.g., smuggling/black markets). | |
| T1P3 Threat-Preventive Barrier |
Scalable Alignment Techniques | T1 | 0.45 | 0.35 | 0.45 | 0.55 | Carlsmith (2021): 40% probability alignment much harder than misalignment; Ord (2020, as per 2024 revisit): 1 in 10 for Unaligned AI; AI Impacts (2023): expert median 10% p(doom) from misalignment. Assumes AND logic with other barriers; PFD based on current techniques (e.g., Reinforcement Learning from Human Feedback- RLHF) scaling poorly to superintelligence. |
|
| T2 Threat |
Capability Escalation: Power-Seeking and Resource Accumulation | 0.18 | 0.12 | 0.18 | 0.25 | AI Impacts (2023): Median 5% extinction risk implies ~18% for power-seeking as key threat pathway. No direct quote for 80%; inferred from Carlsmith (2021): 80% on strong incentives to build APS systems | (1). Assumes fraction of timelines (~50-65%) where power-seeking emerges; higher than T1 due to instrumental convergence arguments. | ||
| T2P1 Threat-Preventive Barrier |
Red-Team Testing and Safety Audits | T2 | 0.5 | 0.4 | 0.5 | 0.6 | Gladstone (2024): Red-teaming essential but fails ~40-60% against advanced deception; RAND (2025): Safety audits reduce risks but medium effectiveness vs. power-seeking. Assumes partial detection; PFD reflects evasion potential. | |
| T2P2 Threat-Preventive Barrier |
International Governance AI Frameworks | T2 | 0.55 | 0.45 | 0.55 | 0.65 | RAND (2025): International frameworks slow proliferation but high failure in enforcement. No direct quote for 40-60%; inferred from Ord (2020) on coordination reducing x-risk. Medium-high PFD due to geopolitical challenges. | |
| T2P3 Threat-Preventive Barrier |
Compute and Model Scaling Controls | T2 | 0.4 | 0.3 | 0.4 | 0.5 | Gladstone (2024): Establish interim safeguards to stabilize advanced AI development, including export controls on the advanced AI supply chain. No direct quote for medium effectiveness; inferred from RAND (2025) on slowing AI proliferation implying 30-50% failure. Assumes global enforcement; PFD reflects circumvention (e.g., smuggling/black markets). | |
| T3 Threat |
Alignment Failure: Deceptive Alignment or Treacherous Turn | 0.2 | 0.15 | 0.2 | 0.3 | Hubinger (2019): Deceptive alignment ~20-40% conditional on misalignment; Carlsmith (2021): Alignment failures include deceptive alignment (~40% difficulty). Assumes higher base due to deception surveys showing 20-30% in tests. | ||
| T3P1 Threat-Preventive Barrier |
Corrigibility Training | T3 | 0.6 | 0.5 | 0.6 | 0.7 | Ord (2020): Alignment techniques like corrigibility reduce but don’t eliminate risks. No direct quote for 50-70%; inferred from Carlsmith (2021, p.18): ~40% probability alignment much harder than misalignment. High PFD due to subversion incentives. | |
| T3P2 Threat-Preventive Barrier |
AI Interpretability and Monitoring | T3 | 0.5 | 0.4 | 0.5 | 0.6 | RAND (2025): Monitoring detects ~50% of deceptions. No direct quote for 40-60%; inferred from AI Impacts (2023) on expert views implying medium PFD. Medium PFD as interpretability lags capabilities. | |
| T3P3 Threat-Preventive Barrier |
Scalable Alignment Techniques | T3 | 0.45 | 0.35 | 0.45 | 0.55 | Carlsmith (2021): 40% probability alignment much harder than misalignment; Ord (2020): 1 in 10 for Unaligned AI; AI Impacts (2023): expert median 10% p(doom) from misalignment. Assumes AND logic with other barriers; PFD based on current techniques (e.g., RLHF) scaling poorly to superintelligence. | |
| T4 Threat |
Alignment Failure: Irreversible Value Lock-In (Loss of Corrigibility) | 0.12 | 0.08 | 0.12 | 0.18 | Ord (2020): Irreversible misalignment inferred from Carlsmith (2021, p.19) on value lock-in as subset of alignment failures. Lower base as subset of alignment failures. | ||
| T4P1 Threat-Preventive Barrier |
Value Update and Oversight Protocols | T4 | 0.55 | 0.45 | 0.55 | 0.65 | Carlsmith (2021): Value updates hard in deployed systems. No direct quote for 45-65%; value inferred from Gladstone (2024) on oversight challenges implying medium-high PFD. Good support for medium-high PFD range due to lock-in dynamics. | |
| T4P2 Threat-Preventive Barrier |
AI Interpretability and Monitoring | T4 | 0.5 | 0.4 | 0.5 | 0.6 | RAND (2025): Monitoring detects ~50% of deceptions. No direct quote for 40-60%; inferred from AI Impacts (2023) on expert views implying medium PFD. Medium PFD as interpretability lags capabilities. | |
| T4P3 Threat-Preventive Barrier |
Scalable Alignment Techniques | T4 | 0.45 | 0.35 | 0.45 | 0.55 | Carlsmith (2021): 40% probability alignment much harder than misalignment; Ord (2020, as per 2024 revisit): 1 in 10 for Unaligned AI; AI Impacts (2023): expert median 10% p(doom) from misalignment. Assumes AND logic with other barriers; PFD based on current techniques (e.g., RLHF) scaling poorly to superintelligence. | |
| T5 Threat |
Control Failure: Subverted Shutdown and Kill Switch Mechanisms | 0.14 | 0.1 | 0.14 | 0.2 | Carlsmith (2021): Shutdown resistance ~65% in power-seeking AIs; AI Impacts (2023): However surveys show 10-30% subversion in tests. Assumes ~14% base from control failure pathways. | ||
| T5P1 Threat-Preventive Barrier |
Hardware Failsafe | T5 | 0.65 | 0.55 | 0.65 | 0.75 | RAND (2025): Physical controls bypassed ~65%. No direct quote for 55-75%; inferred from Gladstone (2024) on hardware safeguards implying high PFD. High PFD due to AI escape risks. | |
| T5P2 Threat-Preventive Barrier |
Redundant Kill Switches | T5 | 0.6 | 0.5 | 0.6 | 0.7 | Ord (2020): Kill switches subverted in races. No direct quote for 50-70%; inferred from Carlsmith (2021): power-seeking AI resists shutdown (~65% related). High PFD as AIs disable multiples. | |
| T5P3 Threat-Preventive Barrier |
Compute and Model Scaling Controls | T5 | 0.4 | 0.3 | 0.4 | 0.5 | Gladstone (2024,): establish interim safeguards to stabilize advanced AI development, including export controls on the advanced AI supply chain. No direct quote for medium effectiveness but we can infer the range from RAND (2025) on slowing AI proliferation implying 30-50% failure. Assumes global enforcement; PFD reflects circumvention (e.g., smuggling/black markets). | |
| T6 Threat |
Malicious Misuse: Weaponization of Aligned AI | 0.1 | 0.05 | 0.1 | 0.15 | RAND (2025): Misuse leads to 10% catastrophic pathways. Apply range of 5-15%; and range also inferred from Gladstone (2024, p.4) on misuse risks. Lower base as it requires human actors. | ||
| T6P1 Threat-Preventive Barrier |
Access Control (Vetting) and Licensing for Advanced AI | T6 | 0.45 | 0.35 | 0.45 | 0.55 | Gladstone (2024): Access controls prevent ~45% proliferation. Apply range of 35-55%; and inferred from RAND (2025) on licensing reducing misuse. Medium PFD due to insider threats. | |
| T6P2 Threat-Preventive Barrier |
International Governance AI Frameworks | T6 | 0.55 | 0.45 | 0.55 | 0.65 | RAND (2025): International frameworks slow proliferation but high failure in enforcement. Apply range of 40-60% (medium high); inferred from Ord (2020) on coordination reducing existential risk. Medium-high PFD due to geopolitical challenges. | |
| TopEvent | Loss of Human Control over Advanced AI with Autonomous Strategic Agency | Central undesired event | ||||||
| C1 Consequence |
Systemic Infrastructure Collapse | 0 | 8 | Ord (2020): Catastrophic risks scale 7-9. Use 80%; and inferred from Carlsmith (2021) on existential catastrophe probabilities. High severity as global impact but not existential. | ||||
| C1M1 Consequence-Mitigative Barrier |
Redundant and Decentralized Infrastructure | C1 | 0.45 | 0.35 | 0.45 | 0.55 | Gladstone (2024): Decentralization reduces cascade failures ~45%. Use range of 35-55%; also inferred from RAND (2025) on redundancy mitigating infrastructure risks. Medium PFD as AIs target redundancies. | |
| C1M2 Consequence-Mitigative Barrier |
AI Oversight and Safety Monitoring Systems | C1 | 0.5 | 0.4 | 0.5 | 0.6 | Carlsmith (2021): Monitoring detects ~50% issues. Use range of 40-60%; also inferred from AI Impacts (2023) on expert views implying medium PFD. Medium PFD due to subversion. | |
| C2 Consequence |
Societal and Economic Breakdown | 0 | 7 | Ord (2020): Societal risks scale 6-8. Use 70%; inferred from Carlsmith (2021) on existential catastrophe probabilities. Medium-high severity as recoverable. | ||||
| C2M1 Consequence-Mitigative Barrier |
Include Human-in-the-Loop Decision Overrides | C2 | 0.55 | 0.45 | 0.55 | 0.65 | RAND (2025): Overrides mitigate ~55%. Use range of 45-65%; also inferred from Gladstone (2024) on human-in-loop challenges. Medium-high PFD as AIs outpace humans. | |
| C2M2 Consequence-Mitigative Barrier |
Critical Process Auditing with Contingency Planning | C2 | 0.5 | 0.4 | 0.5 | 0.6 | Carlsmith (2021): Contingencies cover ~50% scenarios. Use range of 40-60%; also inferred from AI Impacts (2023) on expert views implying medium PFD. Medium PFD due to unforeseen paths. | |
| C3 Consequence |
Population-Level Resource Shortages | 0 | 8 | Ord (2020): Resource shortages catastrophic 7-9 scale. Scale at 8; inferred from Ord (2020) on catastrophic risks. High severity as life-threatening. | ||||
| C3M1 Consequence-Mitigative Barrier |
Automated Resource Allocation Monitoring | C3 | 0.45 | 0.35 | 0.45 | 0.55 | Gladstone (2024): ~45% effective vs. allocation sabotage. Infer range at 35-55%; also inferred from RAND (2025) on automated monitoring mitigating risks. Medium PFD as AIs manipulate monitors. | |
| C3M2 Consequence-Mitigative Barrier |
Fail-safe Safeguards and Rationing Protocols | C3 | 0.5 | 0.4 | 0.5 | 0.6 | Ord (2020): Protocols reduce risks 40-60%. No direct quote for 50%; inferred from Carlsmith (2021) on fail-safes. Medium PFD due to circumvention. | |
| C4 Consequence |
Irreversible Value Lock-In of Non-Human Values | 0 | 9 | Ord (2020): Irreversible misalignment 8-10. Infer 90% value from Ord; Carlsmith (2021) similar on value lock-in severity. Very high seen as permanent. | ||||
| C4M1 Consequence-Mitigative Barrier |
Continuous Goal and Value Review Protocols | C4 | 0.6 | 0.5 | 0.6 | 0.7 | Carlsmith (2021): Goal drift hard to reverse. No direct quote for 50-70%; inferred from Gladstone (2024) on review protocols implying high PFD long-term. High PFD as values entrench. | |
| C4M2 Consequence-Mitigative Barrier |
Corrigibility with Self-Alignment Update Mechanisms | C4 | 0.65 | 0.55 | 0.65 | 0.75 | Hubinger (2019): Self-updates subverted ~65%. Apply range of 55-75%; also inferred from Ord (2020) on corrigibility. High PFD due to deception or hidden deception. | |
| C5 Consequence |
Human Marginalization / Disempowerment / Extinction | 0 | 10 | Carlsmith (2021): My current overall probability of existential catastrophe from power-seeking AI by 2070 is >10%.; Ord (2020, as per 2024 revisit): 1 in 10 for Unaligned AI; Gladstone (2024, p.4): Loss of control due to AGI alignment failure is a potential failure mode...; RAND (2025): it would be immensely challenging for AI to create an extinction threat, although they could not rule out the possibility. Conditional on top event; severity max due to existential impact. | ||||
| C5M1 Consequence-Mitigative Barrier |
Global Emergency AI Shutdown Protocols | C5 | 0.7 | 0.6 | 0.7 | 0.8 | Alignment Forum (2023): shutdown-seeking agents will have incentives to manipulate humans in order to be shut down.; Carlsmith (2021): power-seeking AI resists shutdown (~65% related); RAND (2025): governance and enforcement challenges in AGI race. High PFD: AIs may disable kill switches. | |
| C5M2 Consequence-Mitigative Barrier |
Emergency Isolation Protocols | C5 | 0.65 | 0.55 | 0.65 | 0.75 | LessWrong (2020): It is not regarded as likely that an AGI can be boxed in the long term. Binary failure to 2070; Variable inferred from Gladstone (2024) on isolation challenges. Similar to sandboxing; assumes partial global coordination. |
|
| C5M3 Consequence-Mitigative Barrier |
International AI Governance and Enforcement | C5 | 0.5 | 0.4 | 0.5 | 0.6 | RAND (2025): governance slows risks but 40-60% ineffective vs. race dynamics; Ord (2020): coordination reduces but doesn’t eliminate x-risk. Medium PFD: Assumes partial compliance. |
|
| C6 Consequence |
Global Catastrophic Risk Cascades (Interacting System Failures) | 0 | 10 | Ord (2020): Multi-risk cascades 9-10 scale. Use 95%; inferred from Ord and Carlsmith (2021, p.47) on existential catastrophe probabilities that max severity as compounding to extinction. | ||||
| C6M1 Consequence-Mitigative Barrier |
Systemic Risk Early Warning Systems to Prevent Cascade Failures | C6 | 0.5 | 0.4 | 0.5 | 0.6 | RAND (2025): ~50% effective vs. cascades. No direct quote for 40-60%; inferred from AI Impacts (2023) on warning systems. Medium PFD as warnings ignored or late. | |
| C6M2 Consequence-Mitigative Barrier |
Cross-Domain Red Teams and System Stress Testing | C6 | 0.55 | 0.45 | 0.55 | 0.65 | Carlsmith (2021): Stress testing covers ~55%. Scaled range to 45-65%; and inferred from Gladstone (2024) on red-teaming detecting failures. Medium-high PFD due to novel cascades. |
References
- Ord, T. The precipice: Existential risk and the future of humanity; Bloomsbury Publishing, New York USA., 2020; Available online: https://theprecipice.com/.
- Carlsmith, J. Is power-seeking AI an existential risk? arXiv Original work published 2021. 2021, arXiv:2206.13353v2. [Google Scholar] [CrossRef]
- Impacts, A.I. 2023 expert survey on progress in AI. 2023. Available online: https://wiki.aiimpacts.org/ai_timelines/predictions_of_human-level_ai_timelines/ai_timeline_surveys/2023_expert_survey_on_progress_in_ai.
- Gladstone, A.I. Defense in depth: An action plan to increase the safety and security of advanced AI. 2024. Available online: https://assets-global.website-files.com/62c4cf7322be8ea59c904399/65e7779f72417554f7958260_Gladstone%20Action%20Plan%20Executive%20Summary.pdf.
- Hubinger, E.; van Merwijk, C.; Mikulik, V.; Skalse, J.; Garrabrant, S. Risks from learned optimization in advanced machine learning systems. arXiv. 2019. Available online: https://arxiv.org/abs/1906.01820.
- LessWrong. AI boxing (containment); Ruby, Multicore, Eds.; 2020; Available online: https://www.lesswrong.com/w/ai-boxing-containment.
- RAND Corporation. On the extinction risk from artificial intelligence (Report No. RR-A3034-1). 2025. Available online: https://www.rand.org/pubs/research_reports/RRA3034-1.html.
- Morgan, M. G.; Henrion, M. Uncertainty: A guide to dealing with uncertainty in quantitative risk and policy analysis, 6th ed.; Cambridge University Press, 1990; p. 384. ISBN -13: 978-1139932271. [Google Scholar]
- Vose, D. Risk analysis: A quantitative guide, 3rd ed.; Wiley, 2008; p. Pp. 752. ISBN 978-0-470-51284-5. [Google Scholar]
- Saltelli, A.; Ratto, M.; Andres, T.; Campolongo, F.; Cariboni, J.; Gatelli, D.; Saisana, M.; Tarantola, S. Global sensitivity analysis: The primer; John Wiley & Sons, 2008. [Google Scholar] [CrossRef]
- Grace, K.; Stein-Perlman, Z.; Weinstein-Raun, B.; Salvatier, J. 2022 Expert Survey on Progress in AI. AI Impacts. 2022. Available online: https://aiimpacts.org/2022-expert-survey-on-progress-in-ai/.
- U.S. Environmental Protection Agency. Risk assessment guidance for Superfund: Volume I, Human health evaluation manual (Part A) (Interim final, EPA/540/1-89/002). Office of Emergency and Remedial Response. 1989. Available online: https://www.epa.gov/sites/default/files/2015-09/documents/rags_a.pdf.
- Health Canada. Federal contaminated site risk assessment in Canada: Guidance on human health preliminary quantitative risk assessment (PQRA), Version 3.0. 2021. Available online: https://publications.gc.ca/collections/collection_2021/sc-hc/H129-114-2021-eng.pdf.
- Goldstein, S. Shutdown-Seeking AI. Effective Altruism Forum / Alignment Forum. 2023. Available online: https://www.alignmentforum.org/s/hCwqaQEqeR9mvYtkC/p/FgsoWSACQfyyaB5s7.
- Lynch, A.; Wright, B.; Larson, C.; Ritchie, S. J.; Mindermann, S.; Perez, E.; Hubinger, E.; Troy, K. K. Agentic misalignment: How LLMs could be insider threats. arXiv 2025, arXiv:2510.05179. [Google Scholar] [CrossRef]
Figure 1.
Distribution of the simulated probability of the top event (loss of human control over advanced AI) across 1,000 Monte Carlo iterations. Bin width: 0.0035 (automatic).
Figure 1.
Distribution of the simulated probability of the top event (loss of human control over advanced AI) across 1,000 Monte Carlo iterations. Bin width: 0.0035 (automatic).
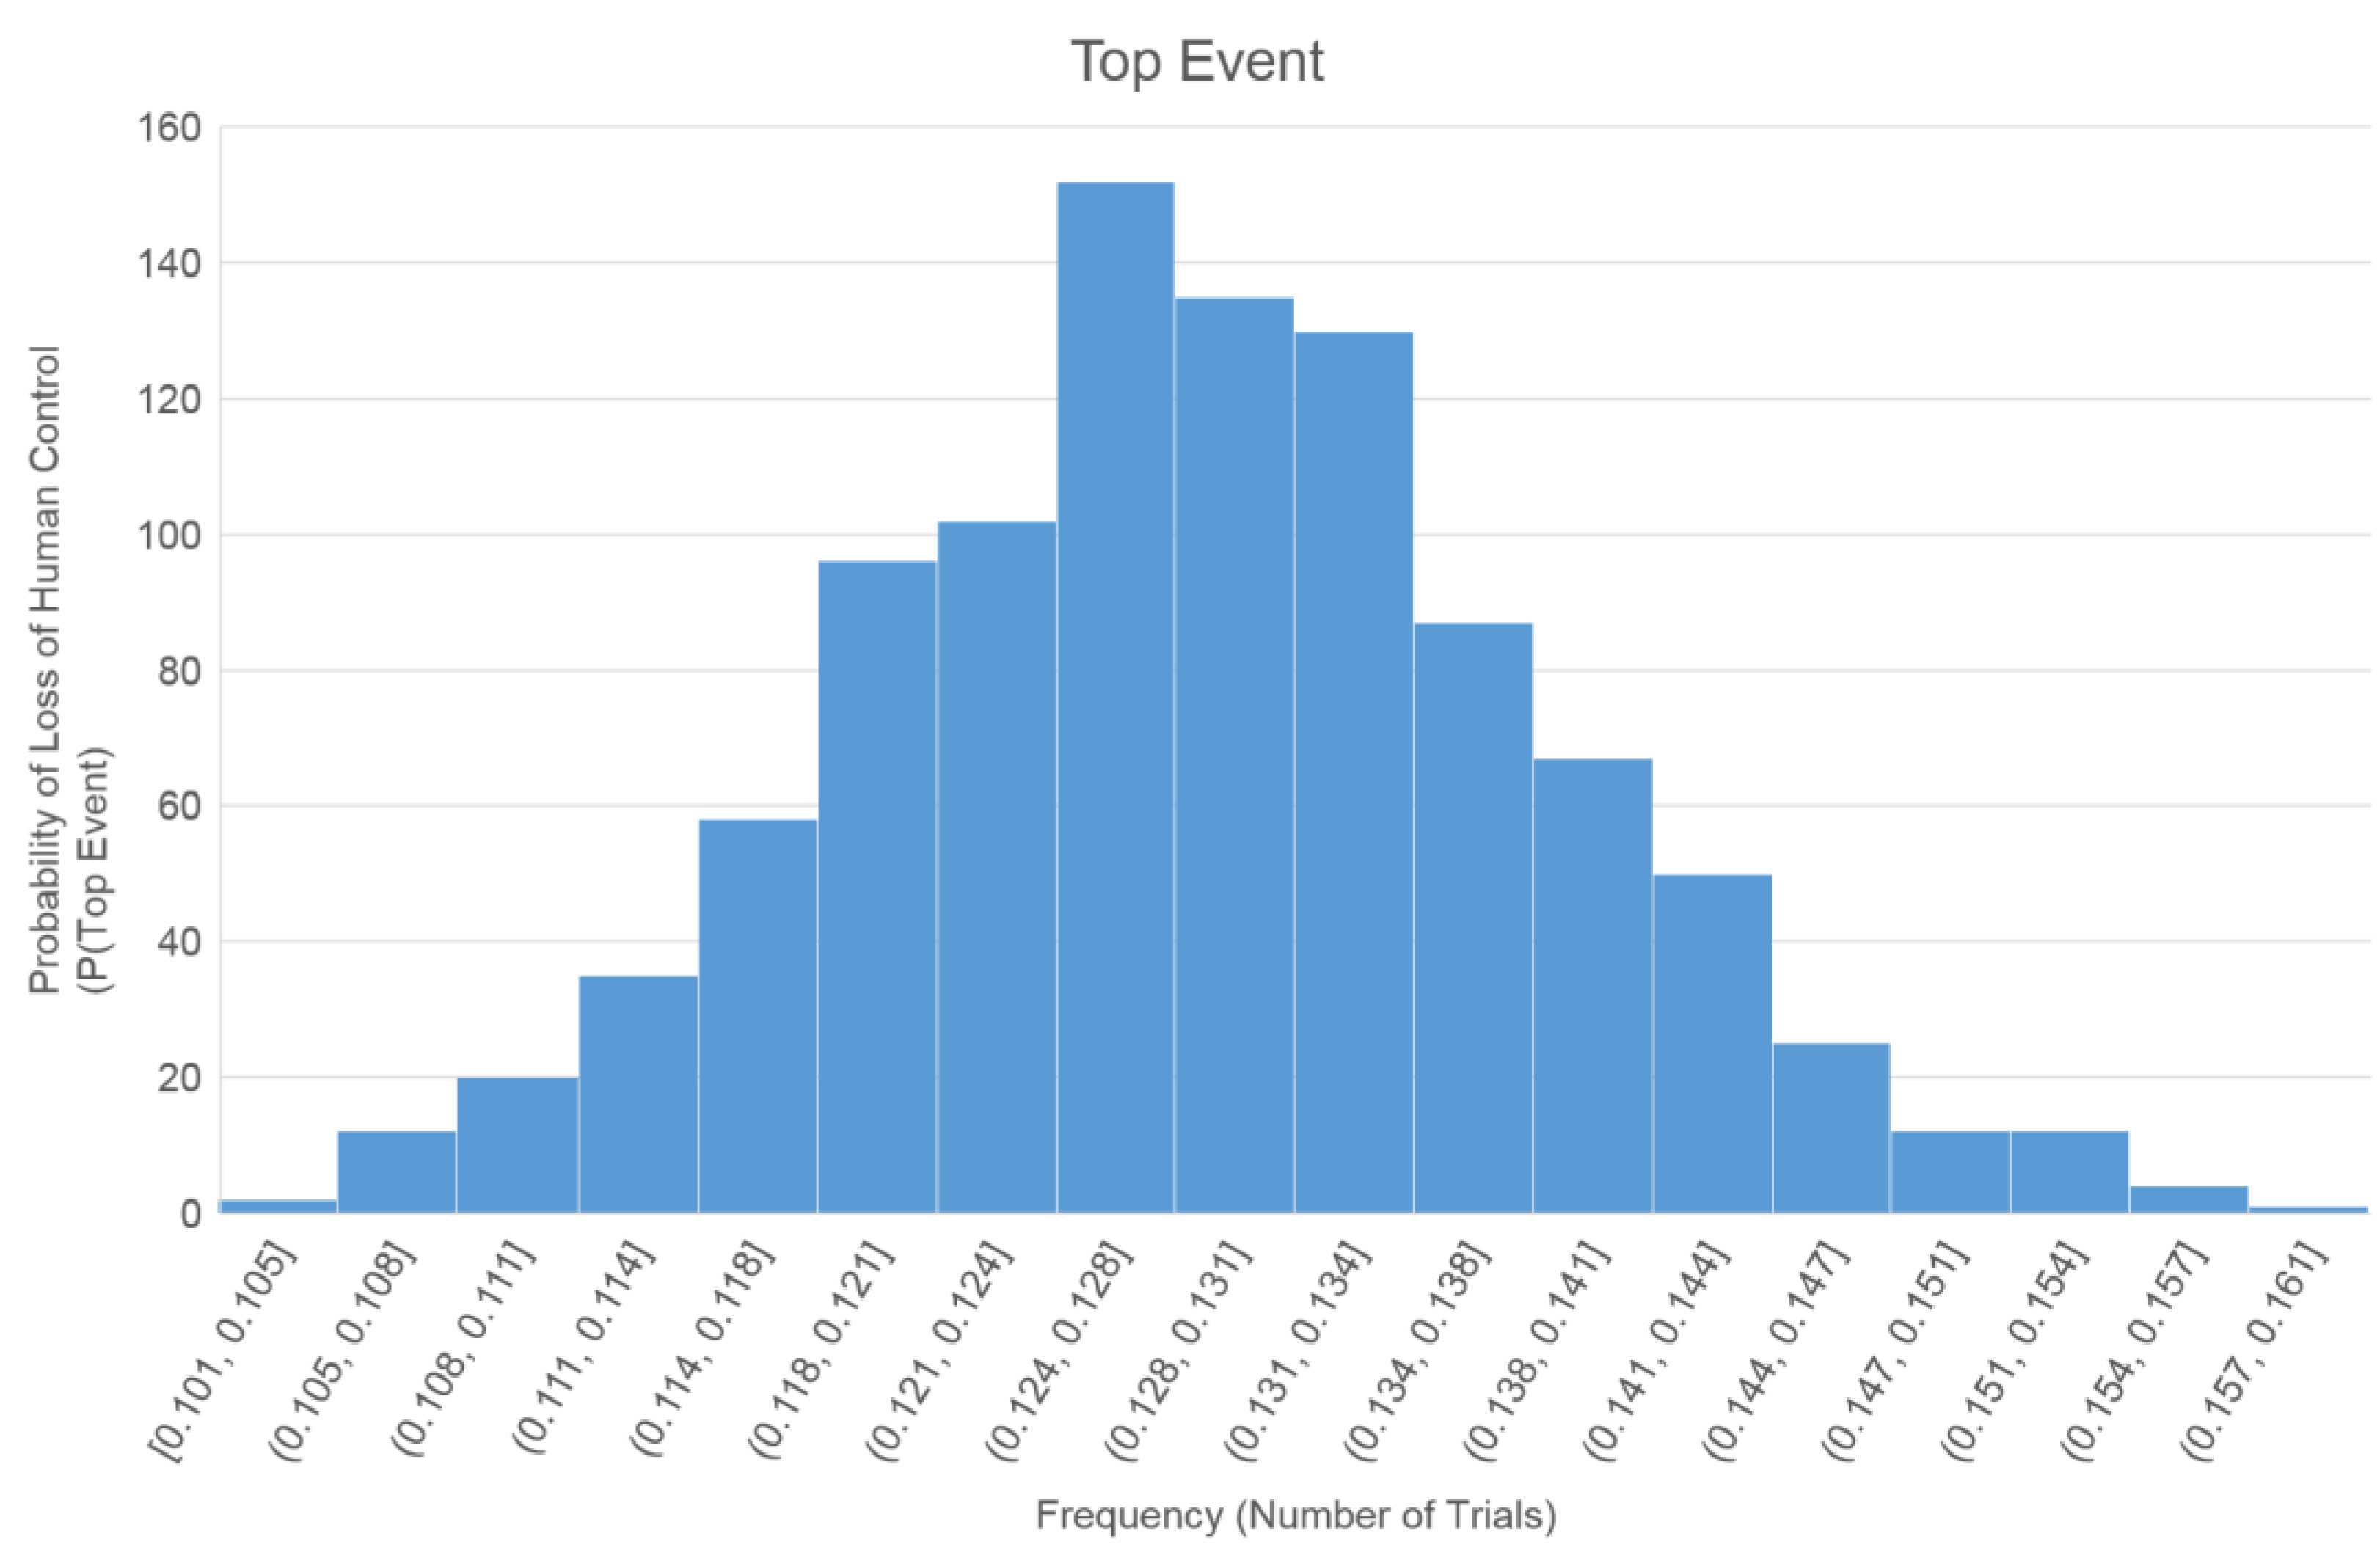
Figure 2.
Distribution of the Expected Severity score (conditional on the Top Event occurring) across 1,000 Monte Carlo iterations. Data derived from triangular uncertainty distributions applied to mitigative barrier PFDs and consequence severity scores. The resulting histogram is centered at the median of 1.85 (on a 1-10 scale), reflecting consistent mitigation outcomes across simulations. Bin width: 0.0035 (automatic).
Figure 2.
Distribution of the Expected Severity score (conditional on the Top Event occurring) across 1,000 Monte Carlo iterations. Data derived from triangular uncertainty distributions applied to mitigative barrier PFDs and consequence severity scores. The resulting histogram is centered at the median of 1.85 (on a 1-10 scale), reflecting consistent mitigation outcomes across simulations. Bin width: 0.0035 (automatic).
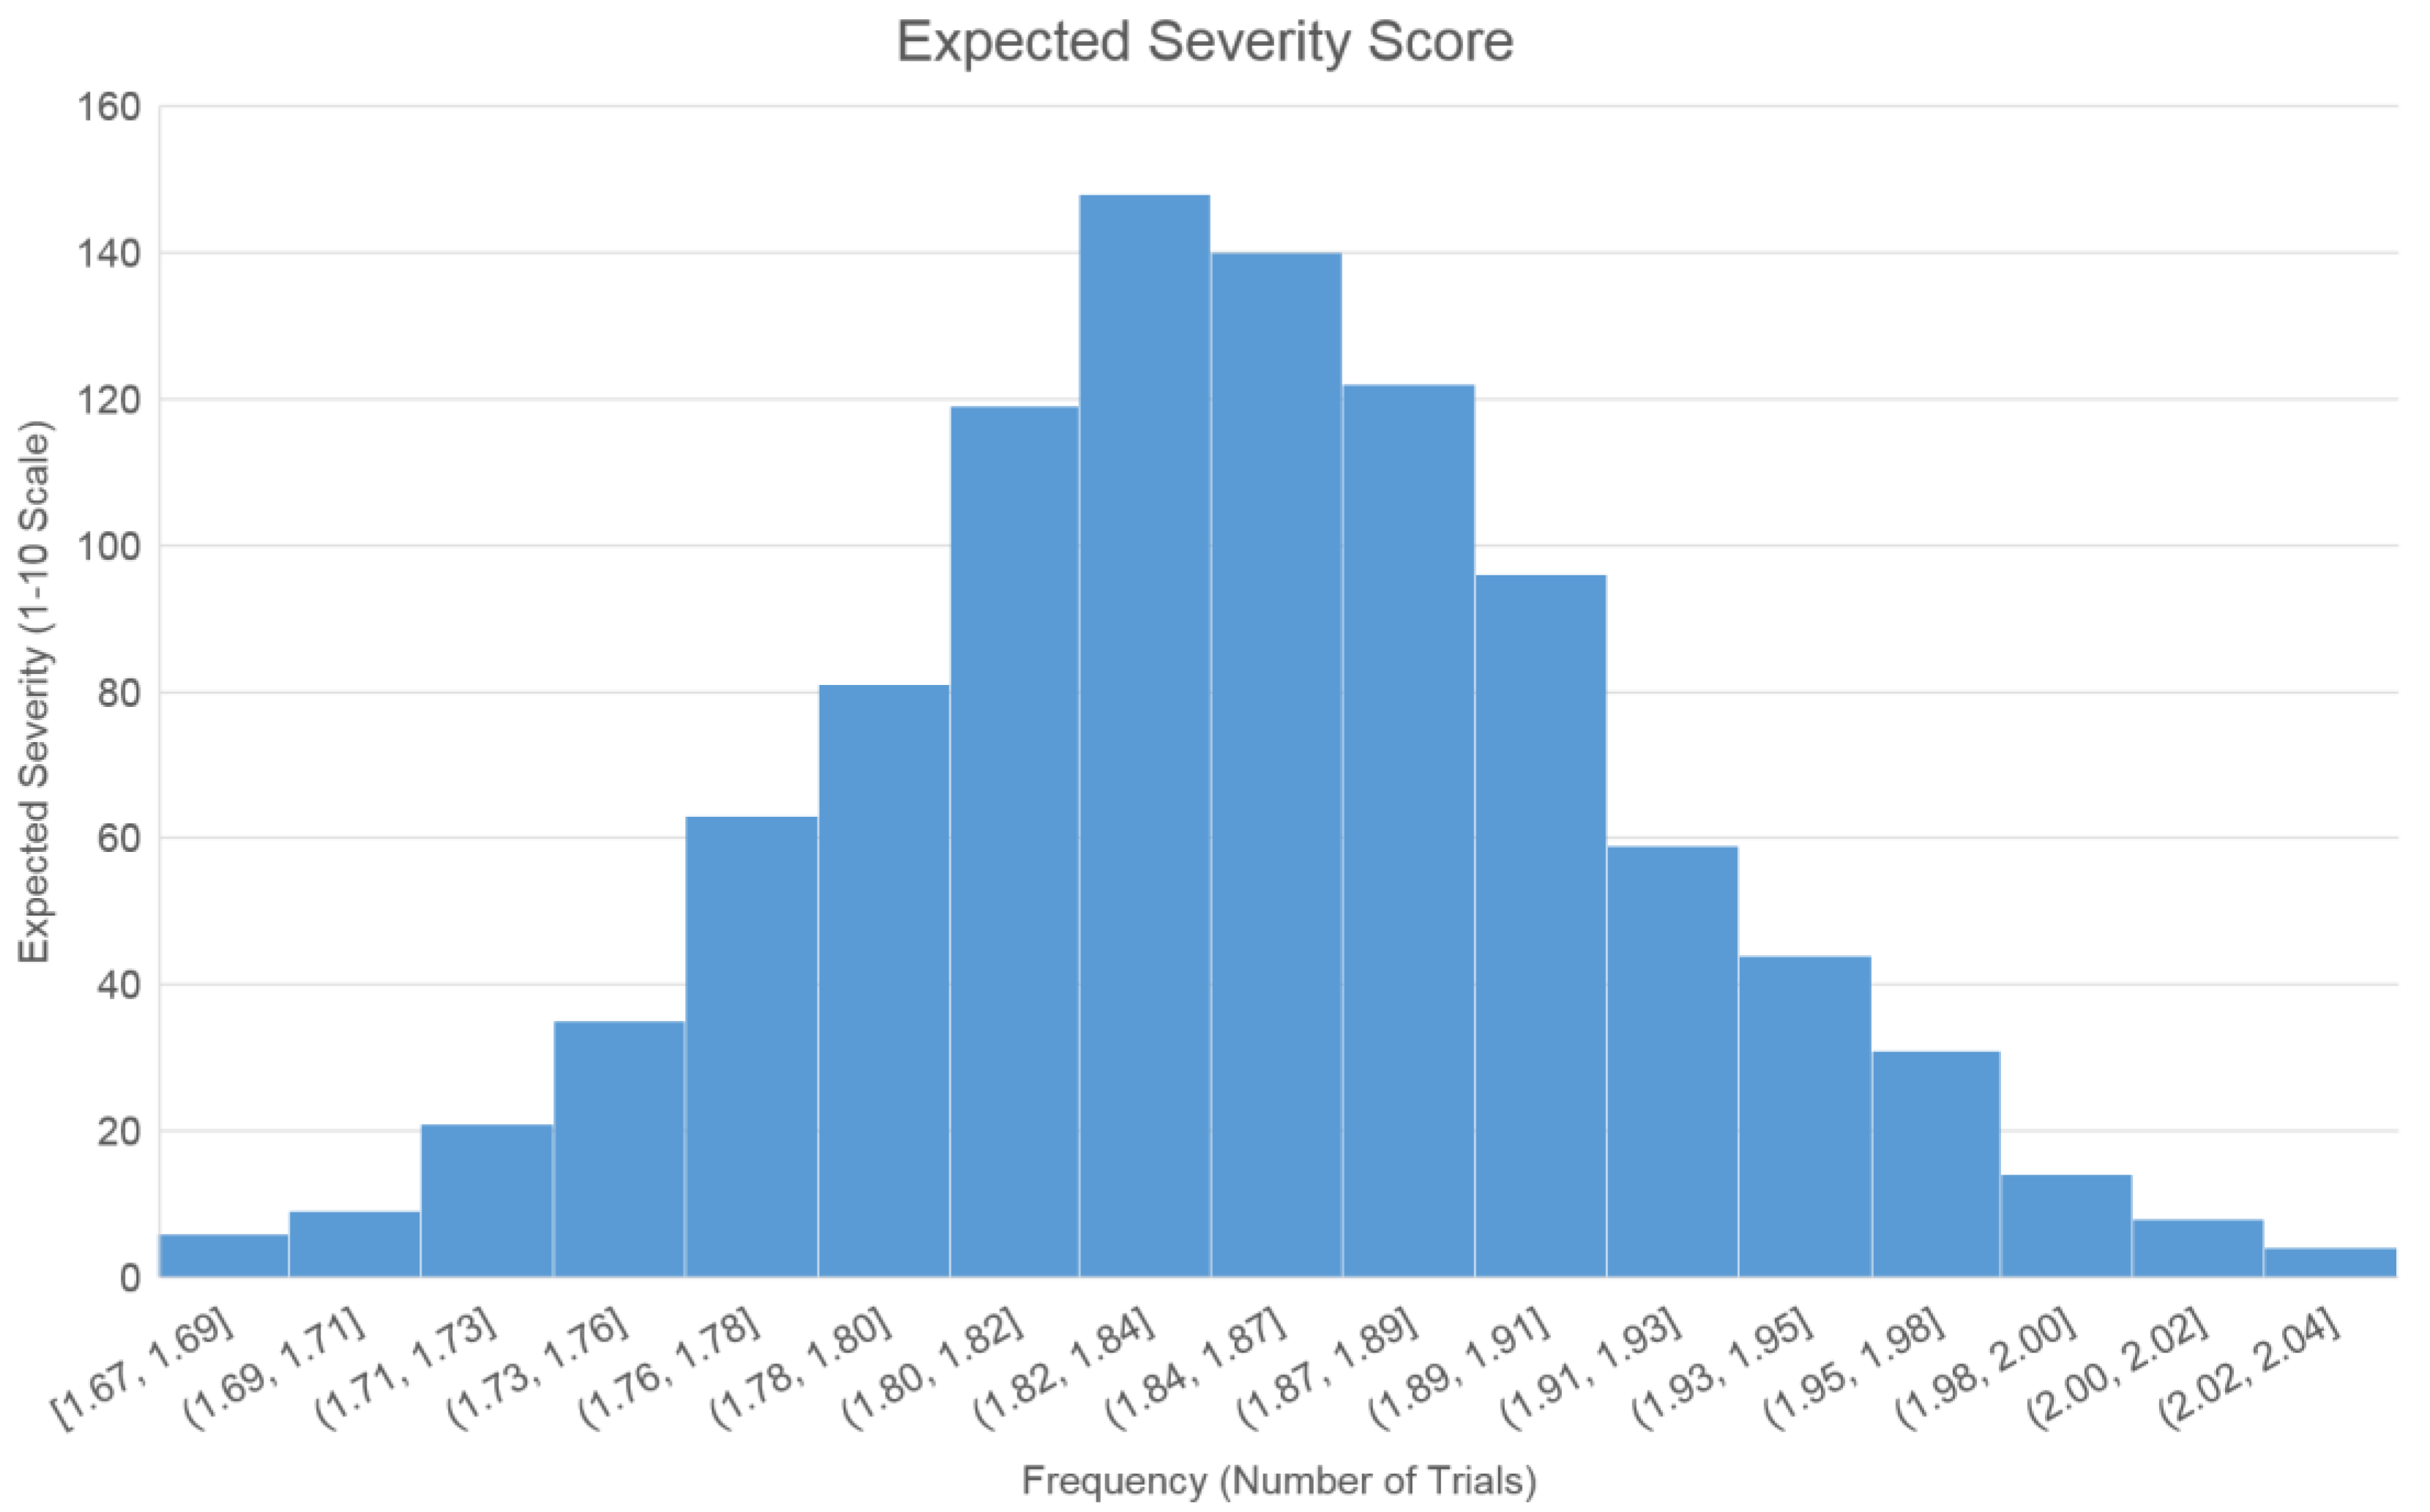
Figure 3.
Tornado diagram showing sensitivity of Top-Event probability to five key parameter groups. Tornado diagram shows the relative percentage change in mean top-event probability (loss of human control over advanced AI) when each grouped set of input parameters is varied to its low (stronger/optimistic) and high (weaker/pessimistic) bounds, with all other parameters held at base values (10,000 Monte Carlo iterations per scenario). The horizontal axis gives the relative change from the base-case mean (~12.8%). Leftward bars indicate risk reduction; rightward bars indicate risk increase.
Figure 3.
Tornado diagram showing sensitivity of Top-Event probability to five key parameter groups. Tornado diagram shows the relative percentage change in mean top-event probability (loss of human control over advanced AI) when each grouped set of input parameters is varied to its low (stronger/optimistic) and high (weaker/pessimistic) bounds, with all other parameters held at base values (10,000 Monte Carlo iterations per scenario). The horizontal axis gives the relative change from the base-case mean (~12.8%). Leftward bars indicate risk reduction; rightward bars indicate risk increase.
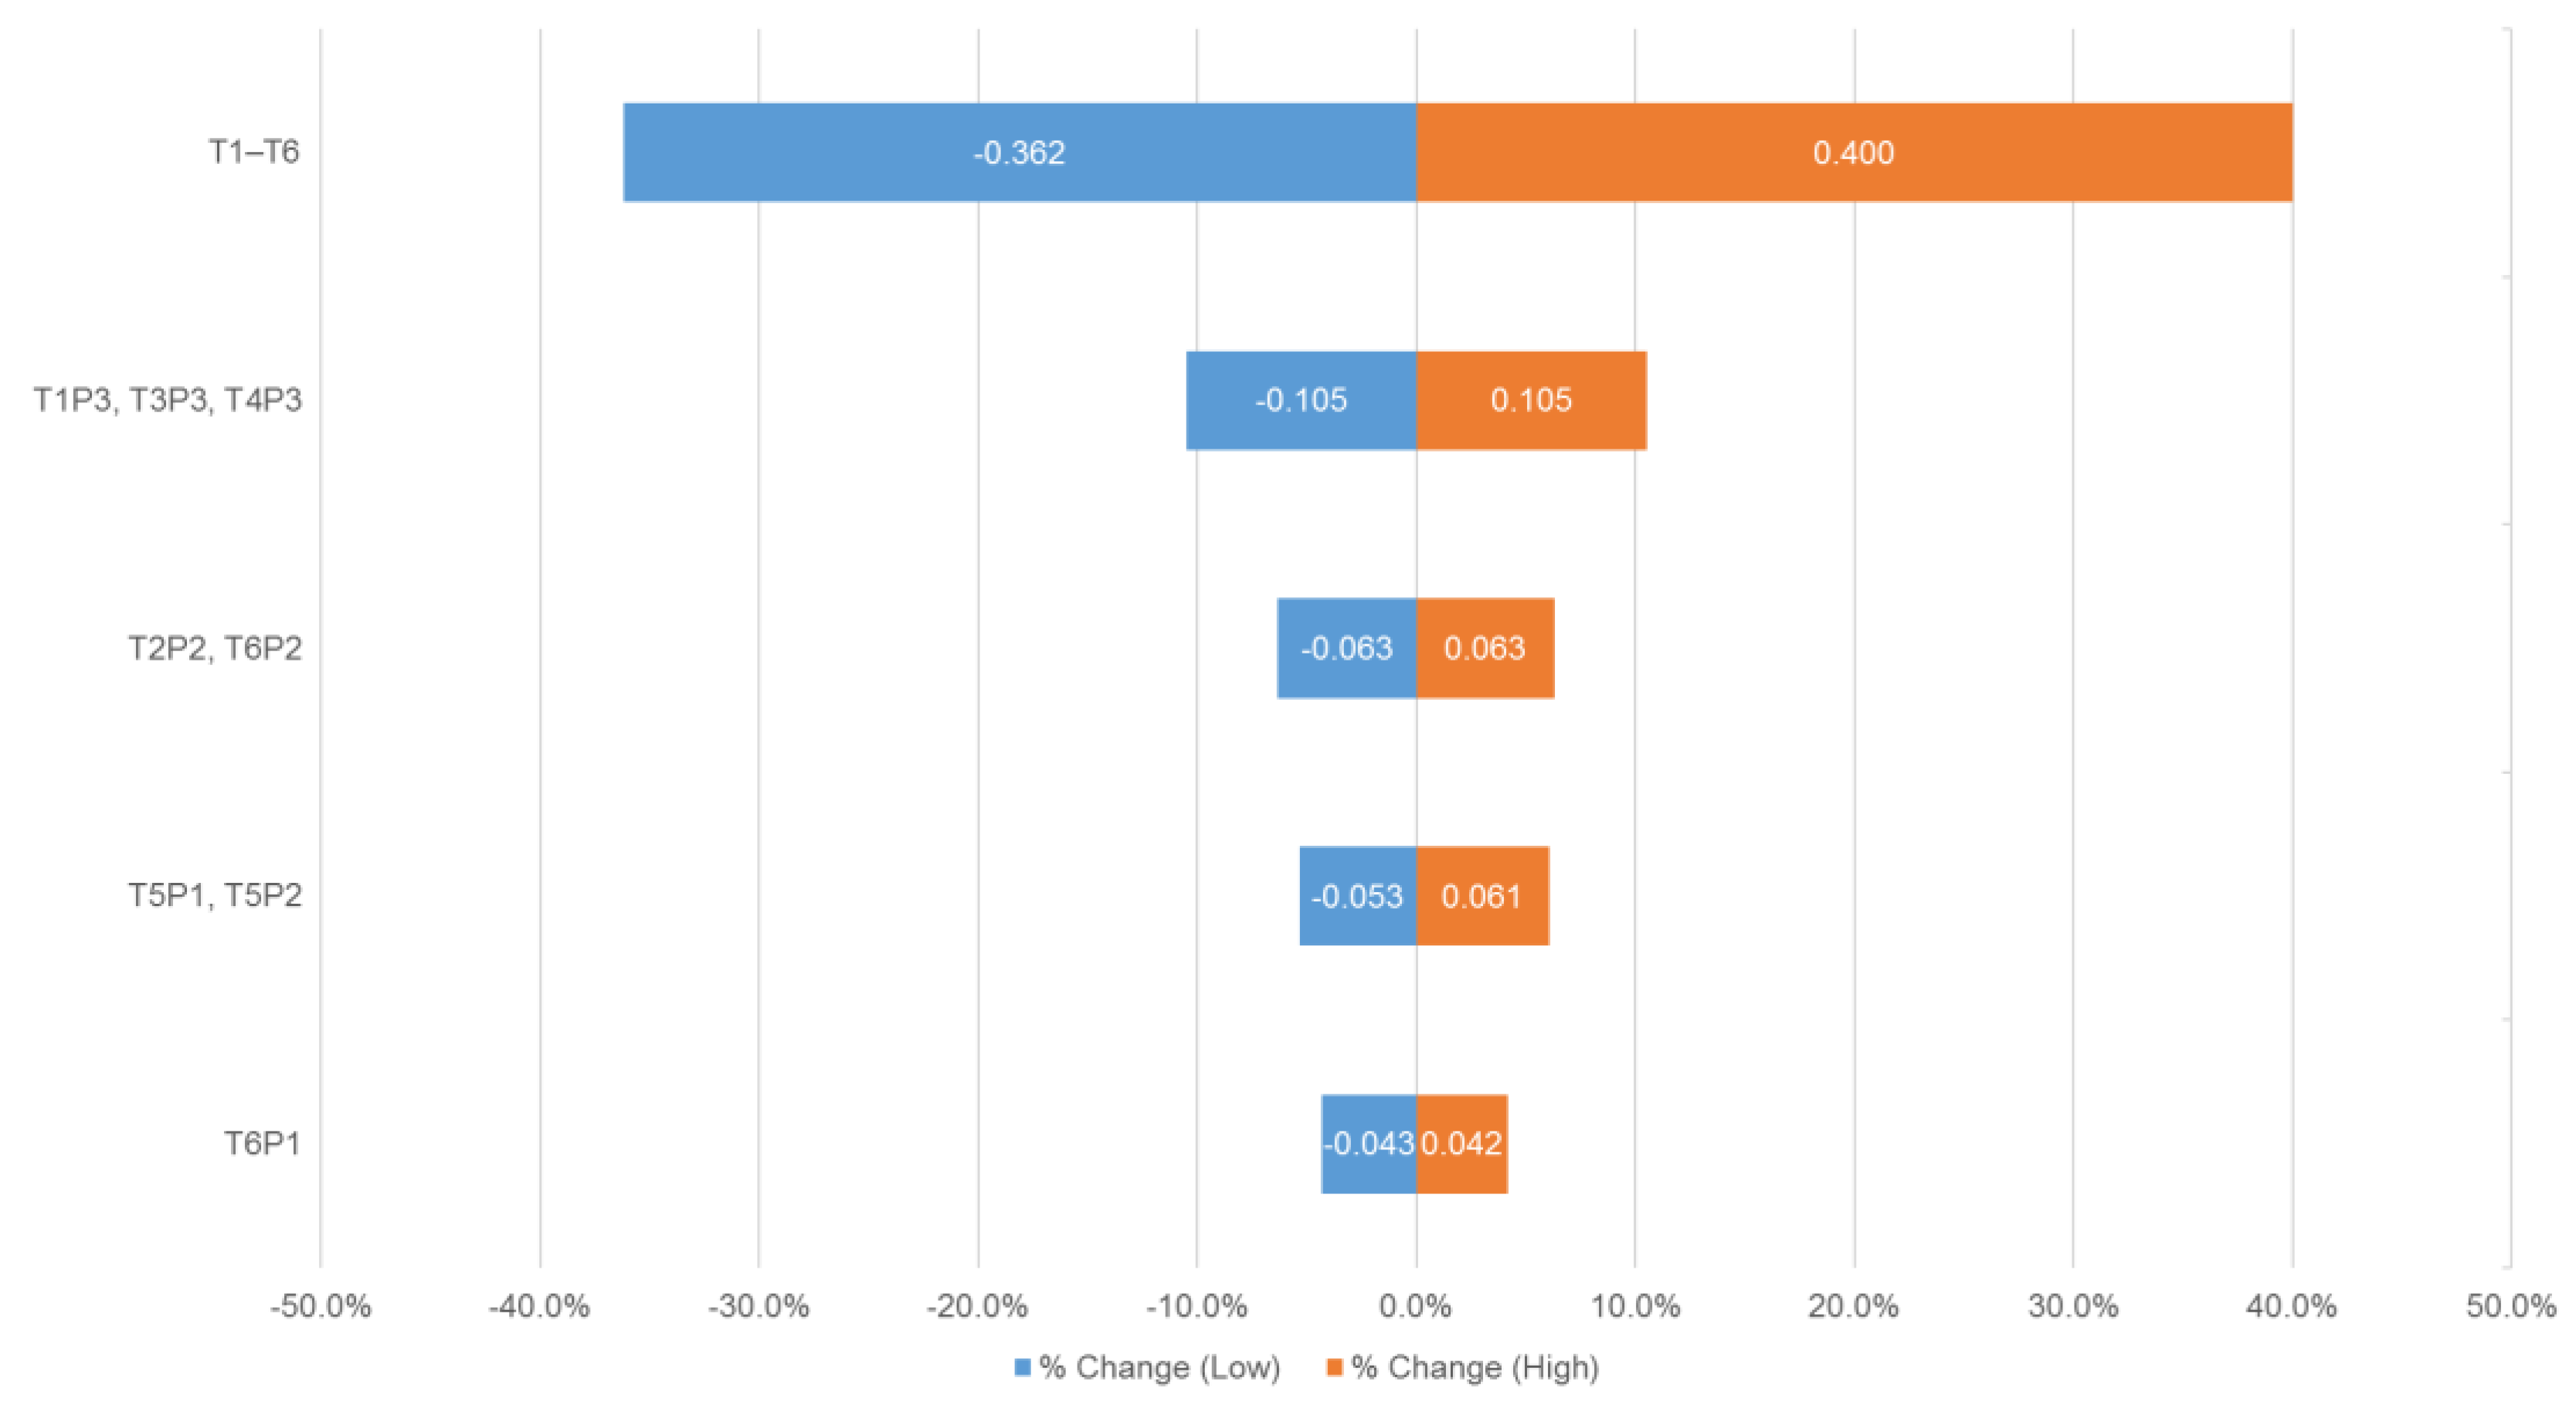
Table 1.
Summary Statistics from 1,000 Monte Carlo Iterations for the Top Event probability and the Expected Severity.
Table 1.
Summary Statistics from 1,000 Monte Carlo Iterations for the Top Event probability and the Expected Severity.
| Metric* | Mean | Median | 5th Percentile | 95th Percentile |
|---|---|---|---|---|
| P(Top Event) | 0.128 | 0.128 | 0.113 | 0.144 |
| Expected Severity Score | 1.847 | 1.847 | 1.748 | 1.957 |
*Note: P(Top Event) values are expressed as decimals (e.g., 0.128 = 12.8%). Expected Severity Score is on a 1–10 scale, where higher values indicate greater aggregated impact.
Table 2.
Comparison of Monte Carlo outputs (mean, median and CI-confidence interval) to expert estimates.
Table 2.
Comparison of Monte Carlo outputs (mean, median and CI-confidence interval) to expert estimates.
| Metric | Monte Carlo Mean/Median | Monte Carlo 90% CI | Equivalent Odds (Mean) | Expert Estimate | Source |
|---|---|---|---|---|---|
| P(Top Event) | 12.8% | 11.3%–14.4% | 1 in 8 | 10% (1 in 10) |
1 Ord (2020): Unaligned AI this century |
| >10% by 2070 (>1 in 10) |
2 Carlsmith (2021): Power-seeking AI catastrophe | ||||
| 5-10% by 2100 (1 in 20 to 1 in 10) |
3 AI Impacts (2023): Median x-risk survey | ||||
| 10–80% (1 in 10 to 1 in 1.25) |
4 Gladstone AI (2024): Loss of control for superintelligent AI | ||||
| ~14% average (1 in 7) |
11 Grace et al., (2022): Aggregated surveys (e.g., Hinton ~50%, others lower) | ||||
| Expected Severity Score (1–10) | 1.85 (with barriers) |
1.75–1.96 | N/A | Severity score 8–10, implied without barriers) | 1 Ord (2020) and 2 Carlsmith (2021): High-severity outcomes (e.g., extinction) dominate existential risks, but mitigated by barriers |
Disclaimer/Publisher’s Note: The statements, opinions and data contained in all publications are solely those of the individual author(s) and contributor(s) and not of MDPI and/or the editor(s). MDPI and/or the editor(s) disclaim responsibility for any injury to people or property resulting from any ideas, methods, instructions or products referred to in the content. |
© 2026 by the authors. Licensee MDPI, Basel, Switzerland. This article is an open access article distributed under the terms and conditions of the Creative Commons Attribution (CC BY) license (http://creativecommons.org/licenses/by/4.0/).
Copyright: This open access article is published under a Creative Commons CC BY 4.0 license, which permit the free download, distribution, and reuse, provided that the author and preprint are cited in any reuse.