

Submitted:
08 June 2026
Posted:
10 June 2026
You are already at the latest version
Abstract
Background/Objectives: Diffuse large B-cell lymphoma (DLBCL) is an aggressive lymphoma and one of the most common hematological neoplasia. Entropy is a statistical measure of randomness that can be used to characterize the texture of an input image and measure tissue complexity. Methods: Image processing and computer vision analysis were performed on a series of 114 diagnostic DLBCL cases and 44 reactive lymphoid tissues stained with hematoxylin & eosin (H&E). Histological entropy was measured to differentiate between reactive lymphoid tissue and DLBCL and predict clinical evolution. Gene expression analysis using the NanoString nCounter PanCancer Immune Profiling Panel was performed in 29 cases. Results: Comparison with reactive lymphoid tissue, DLBCL was characterized by lower entropy (7.3 ± 0.2 vs. 6.8 ± 0.6; P < 0.001, respectively). Within the DLBCL diagnostic category and at patient-level analysis, higher entropy was associated with poor overall survival and death events within the first 2 years (hazard-risk = 2.4, P = 0.004) and lower entropy with a moderate and more favorable outcome (hazard-risk = 0.4, P = 0.004). High entropy was also correlated with ECOG performance status ≥ 2, lower protein expression of apoptosis markers of cPARP and cCASP3, and upregulation and downregulation of specific immuno-oncology genes. Conclusion: The histological evaluation of entropy is useful for both the differential diagnosis of reactive lymphoid tissue and DLBCL and can be used as a predictor factor of DLBCL prognosis.
Keywords:
diffuse large B-cell lymphoma
; DLBCL
; reactive lymphoid tissue
; image processing
; computer vision
; overall survival
Introduction
Diffuse large B-cell lymphoma (DLBCL) is one of the most frequent lymphomas and accounts for around 25 percent of adult non-Hodgkin lymphomas. In the USA, the incidence of DLBCL is around 7 cases per 100,000 persons per year [1,2,3,4].
DLBCL usually presents as symptomatic nodal enlargement in the neck or trunk, but it can originate in extranodal involvement [5]. In one-third of the patients, “B symptoms” are present, including fevers, night sweats, or wight loss [1,2,3,4,6,7,8,9,10,11,12].
DLBCL is a heterogeneous entity with variable clinicopathological characteristics. DLBCL develops from mature B lymphocytes, which morphologically resemble centroblasts or immunoblasts. Based on the cell of origin theory [13], DLBCL can be derived from germinal center B lymphocytes or post-germinal center B cells (also known as activated B lymphocytes), which are characterized by the presence of somatic mutations in the variable region of the immunoglobulin genes (IGVH) [1,2,3,4,6,7,8,9,10,11,12].
The pathogenesis of DLBCL is complex [1,2,3,4,6,7,8,9,10,11,12], including aberrant expression of BCL6, TP53 downregulation, aberrant somatic hypermutation, BCL2 and MYC overexpression, immune evasion, abnormal lymphocyte trafficking, etc. [14]. This multistep process leads to the outgrowth of a malignant B-lymphocyte clone or germinal or post-germinal origin.
The heterogenicity of DLBCL is confirmed the different identified large B cell variants, including primary mediastinal large B-cell lymphoma, T-cell rich large B-cell lymphoma, intravascular B-cell lymphoma, lymphomatoid granulomatosis, Epstein-Barr virus (EBV)-positive DLBCL, DLBCL associated with chronic inflammation, fibrin-associated large B-cell lymphoma, primary large B-cell lymphoma of immune-privileged sites (central nervous system, vitreoretinal, and testis), fluid overload-associated, IRF4 rearrangement-associated, ALK-positive DLBCL, and double-hit MYC and BCL2 lymphoma (high-grade B-cell lymphoma), among others [6,8].
In two-thirds of the patients, DLBCL is cured with current therapy, particularly if complete response to first-line therapy is achieved. The prognosis of DLBCL can be predicted using several methods. The International Prognostic Index (IPI) is one of the most used methods and has been validated in patients treated with R-CHOP (rituximab, cyclophosphamide, doxorubicin, vincristine, and prednisone) and other R-CHOP-like combinations. IPI, and variants of R-IPI and NCCN-IPI, include the following variables: age > 60 years, high serum LDH, Eastern Cooperative Oncology Group (ECOG) performance status ≥2, clinical stage III or IV, and > extranodal site [15]. The cell of origin status is used to identify activated B-cell (ABC) type cases associated with a worse prognosis. This status can be assessed using gene expression analysis and Hans’ classifier immunohistochemical approach with the evaluation of only three markers, CD10, BCL6, and MUM1 (IRF4) [16]. Other prognostic methods include the assessment of MYC, BCL2, and BCL6 translocation status by FISH, deep sequencing, and cell-free plasma DNA analysis.
Achieving a lasting remission for at least 2 years is a good indicator of a favorable long-term prognosis [17,18,19,20,21]. Approximately 30%-40% of patients with DLBCL and first-line treatment experience relapsed or refractory disease. In these patients, treatment strategies depend on the timing of relapse (before or above 1 year) [22]. Patients with DLBCL with primary refractory or relapse before 1 year are treated with CAR-T (axi-cel or liso-cel) or Glofitamab-GemOx. Patients with relapse after 1 year are treated with immunochemotherapy followed by transplant (high-dose therapy/autologous stem cell transplant) or Glofitamab-GemOx [22].
We have recently described that the survival of DLBCL can be predicted using H&E histological images and deep learning using the 2-year (24 months) cut-off point [23]. This study used a final convolutional neural network based on DarkNet-19 to classify the cases into two prognostic groups and achieved a high performance (test set accuracy of 96.3%). Explainable artificial intelligence (XAI), including grad-CAM, Image-LIME, and occlusion sensitivity, was used to confirm that the CNN was focusing on the correct areas [23]. However, the “black box” nature of CNNs in medical image classification limits the understanding of their decision-making process [24].
In applied mathematics, the extraction of information from high-dimensional datasets, incomplete, and noisy is generally challenging. The concept of entropy (structural genomic, transcriptomic, network of signal transduction, etc.) has been repeatedly applied to the characteristics of cancer tissue or cells [25,26,27]. In the systems biology narrative, the entropy of signaling and noise is believed to play a major role in the initial oncogenic events [25]. This study focused on the analysis of the texture of the histological images to statistically measure the randomness; in other words, the image entropy. We used grayscale images of DLBCL to measure the entropy and correlated them with the clinicopathological characteristics of the patients. We found that compared to reactive lymphoid tissue, DLBCL was characterized by lower entropy. Within DLBCL cases, DLBCL with a more moderate clinical evolution also had lower entropy values, and aggressive DLBCL with higher entropy.
Material and Methods
Patients and Samples
The series included 114 patients with the histological diagnosis of DLBCL and 44 cases of reactive lymphoid tissue. The cases were selected from the tissue bank of the Department of Pathology of Tokai University Hospital. All cases were diagnostic biopsies and de novo DLBCL. The cases were selected based on the availability of sufficient tissue and size for proper histological diagnosis of DLBCL based on hematoxylin and eosin (H&E) staining, immunophenotype by conventional immunohistochemistry and in situ hybridization, and molecular techniques when required, as described in the current lymphoma classifications [1,6,8].
This study was conducted following the guidelines of the Helsinki Declaration for Human Experimentation of the World Medical Association. The study was approved by the Tokai University Institutional Review Board (IRB20/156).
Survival Groups
As previously described in our recent publication of 114 cases [23], two survival groups were created based on the overall survival curve plot and the 2-year inflection point. The aggressive clinical behavior group (n = 38; 33.3%) was characterized by death event before (within) the first 2 years after diagnosis, similar to the concept of progression of disease within 24 months (POD24). The moderate clinical behavior group included the other cases (n = 76, 66.7%). The clinicopathological characteristics of the patients were obtained from the Tokai University Hospital intranet carte system.
Histological Image Entropy Assessment
Within image processing and computer vision analysis, entropy is a statistical measure of randomness that can be used to characterize the texture of the input image. The analysis was performed using MATLAB R2026a Update 2 (26.1.0.3251617) May 5 2026.
The dataset included 114 DLBCL and 44 reactive lymphoid tissues. Whole-tissue sections of each case were stained with H&E and digitalized using a NanoZoomer S360 slide scanner (C13220-01, Hamamatsu Photonics K.K., Hamamatsu, Japan). The neoplastic areas were identified and digitally exported into one or several images at 20× magnification and 150 dpi. The images were split into image patches of 224 × 224 × 3 size. All image patches were manually revised to exclude images with less than 80 percent of viable and absence of diagnostic material. Image patches with artifacts such as broken tissue, folded areas, incorrectly stained tissue, and smashed or crushed tissue were discarded as previously described [23,28,29,30,31].
All image patches were pooled into three folders: DLBCL dead within the first 2 years (15,167 image patches), DLBCL others (27,298 image patches), and reactive lymphoid tissue (326,915 image patches).
The input data were images as grayscale, specified as a numerical array or logical array of any dimension. The entropy function expects images of data types double and single to have values in the range [0,1]. If an image “I” had values outside the range [0,1], then the values were rescaled to the expected range using the rescale function. The output was the entropy of image “I”, returned as a numeric scalar [32].
Entropy was defined as -sum(p.*log2(p)), where p contains the normalized histogram counts returned from “imhist”. Histogram of image data (imhist) calculates the histogram for grayscale image I.
By default, entropy uses 2 bins for logical arrays and 256 bins for uint8, uint16, or double arrays. The entropy function converts any data type other than logical to uint8 for the histogram count calculation so that the pixel values are discrete and directly correspond to a bin value.
The entropy code is shown in Table 1.
Immunohistochemical Procedures
Immunohistochemical stainings and MYC and BCL2 gene rearrangement (translocation) status by FISH were retrieved from our previous publications for some markers [23] and data were reanalyzed. Other markers were newly stained for this study using the Leica Bond Max 2 autostainer following the manufacturer’s instructions (Leica K.K., Tokio, Japan).
The primary antibodies were the following: Ki67 (RTU, MM1, Leica), LMO2 (299B, created by the Monoclonal Antibodies Unit, Centro Nacional de Investigaciones Oncologicas, CNIO, Madrid, Spain), MYC (Y6, Abcam), MDM2 (IF2, Invirogen), CDK6 (98D, CNIO), E2F1 (Agro368V, CNIO), BCL2 (bcl2/100/D5, Leica), CASP8 (11B6, NCL-CASP-8, Novocastra), MYOB (DANI51, CNIO), TP53 (D0-7, Leica), cPARP (Asp214, D64E10, CST), cCASP3 (Asp175, #9661, CST), ISY1, TNFAIP8 (#14559-MM01, Sino Biological), CSF1R (FER216D, CNIO), CD163 (10D6, Leica), PD-L1 (E1J2, CST), and IL-10 (LS-B7432, Lifespan Bioscience).
Gene Expression Analysis
Gene expression analysis using the NanoString nCounter PanCancer Immune Profiling Panel was available in 29 cases. Whole tissue sections of formalin-fixed paraffin-embedded tissue samples of DLBCL were outsourced to Celgene Corporation. After evaluating the histological features to confirm that at least 80% of the sample contained lymphoma cells, RNA extraction was performed using the nCounter platform (NanoString Technologies, Inc., Seattle, WA, USA). This panel included 730 immune-oncology genes and 40 housekeeping genes. The analysis was the standard, including the calculation of log2 fold change and -log10 P values to create a volcano plot and later the heatmap and hierarchical clustering. The hierarchical clustering used the one minus pearson correlation and average linkage method (software: Morpheus; website location: https://software.broadinstitute.org/morpheus/;, last accessed on 8th June 2026).
Statistical Analysis
The analysis included conventional descriptive statistics. Differences between groups included non parametric tests: independent-samples Kruskal-Wallis Test and pairwise comparisons. Asymptotic significances (2-sided tests) were used. The significance level was 0.050. In pairwise comparisons, the significance values were adjusted by the Bonferroni correction for multiple tests. Comparison between the two groups was performed using independent-samples Mann-Whitney U test. Crosstabulation used Chi-square and Fisher’s exact tests. Overall survival was calculated using the Kaplan-Meier and log-rank tests.
All analyses were performed using IBM SPSS Statistics (version 27.0.1.0, 64-bit edition).
Results
Clinicopathological Characteristics of the Series
The clinicopathological characteristics of the series are shown in Table 2. In the series of 114 patients, 38 (33.3%) had died within the first 2 years of follow-up (referred as to DLBCL Dead within the first 2 years). The Others group corresponded to 76 patients (66.7%). This DLBCL Others group experienced a death event after 2 years in 16 patients (29.6%). DLBCL Dead within the first 2 years had a mean survival time of 7.6 months vs. 140 months in the DLBCL Others group (Kaplan-Meier and Log Rank test (Mantel-Cox), P < 0.001).
DLBCL Dead within the first 2 years were characterized by several clinicopathological variables usually associated with poor prognosis of DLBCL, including high LDH, ECOP performance status ≥ 2, international prognostic index (IPI) high or high-intermediate, low clinical response to treatment (RCHOP or RCHOP-like), higher death events, non-germinal center B-cell like by the Hans algorithm, positivity by Epstein-Barr Virus (EBV), and an immune microenvironment characterized by high infiltration of CD163-positive tumor-associated macrophages (TAMs).
Assessment of Histological Entropy in Schematic Images
The function of entropy uses a grayscale image to return the entropy value, which is a statistical measure of randomness that can be used to characterize the texture of the input image. Entropy is a method to analyze the complexity of an image.
To validate this assumption and methodology, entropy was assessed in four different test images (Figure 1 and Figure 2). The experiment aimed to show if entropy increased with image complexity (randomness). For each image, the measurement was repeated 10 times, and we confirmed that the value was the same in each measurement. The results were the following: image 0, 0 entropy; image 2, 0.5214; image 3, 0.8757, and image 4, 1.1235. Therefore, we confirmed that entropy increased with image complexity (randomness).
Assessment of Histological Entropy in Reactive Lymphoid Tissue and DLBCL
Next, entropy was measured in all the image-patches of reactive lymphoid tissue and DLBCL. The number of image-patches were the following: DLBCL (n = 42465) and reactive lymphoid tissue (n = 326915) (total n = 369380). Within the DLBCL category, the frequencies were DLBCL dead within the first 2 years (n = 15167) and DLBCL others (n = 27298).
In comparison to reactive lymphoid tissue, DLBCL was characterized by lower entropy: 6.8 ± 0.6 vs. 7.3 ± 0.2 (Independent-sample Mann-Whitney U test, P < 0.001) (Figure 3(A1)).
ROC analysis was performed to find a cutoff point of entropy that could differentiate between the different groups. ROC analysis between reactive lymphoid tissue and DLBCL had an area under the curve (AUC) of 0.804, and the cutoff value was at 7.2 entropy. ROC analysis was performed to differentiate between DLBCL Dead within the first 2 years and DLBCL Others, but the analysis was not successful, and the AUC was 0.536 (Figure 3(A2)).
Assessment of Histological Entropy Within the DLBCL Diagnostic Category
The entropy levels were different between the two DLBCL groups. In comparison with DLBCL Dead within the first 2 years, DLBCL Others was characterized by lower entropy: 6.8 ± 0.6 vs. 6.7 ± 0.6 (P < 0.001).
Note that DLBCL Dead within the first 2 years group was closer to reactive lymphoid tissue (but still statistically significant different). All pairwise comparisons between the 3 groups were statistically significant (P < 0.001) (Figure 3(B1)).
Entropy assessment was repeated for DLBCL cases at patient-level analysis. Data did not change from the patched-based analysis. In comparison with DLBCL Others, DLBCL Dead within the first 2 years was characterized by higher entropy (6.7 ± 0.4 vs. 6.9 ± 0.4, respectively, P = 0.01) (Figure 3(C1)).
The patient-based entropy values were correlated with the overall survival, and an adequate cutoff value was searched. The optimal cutoff value was set at 7.2. The frequencies were as follows: < 7.2, n = 85, 78%; and > 7.2, n = 24, 22%. Entropy levels correlated with the DLBCL groups, and the data are shown in Table 3. Entropy > 7.2 correlated with DLBCL Dead within the first two years, and entropy < 7.2 to DLBCL Others (P = 0.002). Importantly, high entropy (> 7.2) cases were associated with poor overall survival (P = 0.003) (Figure 3(C2)); Hazard-Risk was 2.4 (P = 0.004, 95% CI 1.316 – 4.434).
Examples of entropy levels in specific image-patches of reactive tissue and DLBCL are shown in Figure 4, Figure 5 and Figure 6.
Further analysis included the correlation of entropy levels with several clinicopathological characteristics and several pathological markers. Cases with high entropy correlated with Dead within the first 2 years, ECOG performance status ≥ 2 and lower apoptotic markers of cPARP and cCASP3 evaluated by immunohistochemistry (Table 4 and Table 5).
Differential Gene Expression Between High and Low Entropy DLBCL Groups
Gene expression analysis using the immune profiling (pan-cancer immuno-oncology panel) was performed in 6 cases of high entropy and 23 cases of low entropy. Among the 730 genes of the panel, statistical differences were found in 43 genes: 34 were upregulated and 9 downregulated in the high extropy group. Among the upregulated genes, several relevant genes were found, such as STAT3 (chemokines, regulation), BTK (adaptive and immune response), CASP8 (apoptosis, innate immune response), CD47 (macrophage functions, regulation), VCAM1 (adhesion, regulation of immune response), MYD88 (innate immune response, toll-like receptor), ZAP70 (adaptive immune response), and CRP (acute-phase response, phagocytosis), have been previously identified in lymphoid neoplasia and other inflammatory conditions. The heatmap and functional network association analysis of the upregulated genes are shown in Figure 7.
Discussion
This study focused on the analysis of histological features of DLBCL and reactive lymphoid tissue using entropy, which is an image processing and computing vision analysis function. Entropy is a statistical measure of randomness that can be used to characterize the texture of an image. I can also be used to analyze the histological complexity of a tissue.
A major question when making a diagnosis of a lymph node biopsy is whether the process is benign or malignant [28,33]. Distinction between reactive and malignant lymphoid proliferation is based on several variables, including abnormal architecture (effacement of architecture), evidence of invasion (invasion of epithelium/gland, interstitial tissues, blood vessel walls, atypical lymphoid cells in interfollicular areas, destruction of mantle zones, or colonization of lymphoid follicles), and cytological atypia (large cells, irregular nuclei, granular chromatin, clear cells, and aberrant immunophenotype) [34].
This study included 44 cases of reactive lymphoid tissue, including both tonsils and lymph nodes. According to the architectural histologic pattern, there are four types of reactive lymphadenopaties: follicular/nodular, sinus, interfollicular or mixed, and diffuse. However, several compartments may be involved in a single case [28,33].
The classification of reactive lymphadenopathies includes 4 categories [28,33]. Follicular hyperplasia and autoimmune disorders characterized by a follicular and nodular pattern. Sinus histiocytosis, such as Whipple disease [35]. Interfollicular or mixed pattern, such as Kimura disease [36], Kikuchi disease [37], and Lupus. Diffuse pattern, including cytomegalovirus and infectious mononucleosis. Follicular hyperplasia is the most frequently made diagnosis and is characterized by multiple large irregular follicles with germinal centers. Other characteristics include the presence of polarization, a starry-sky pattern with multiple tangible body macrophages, evidence of mantle zones, presence of plasma cells within the follicles, lack of BCL2 expression evaluated by immunohistochemistry by the B lymphocytes of follicles, and absence of translocation (14;18)(q32;q21) by FISH [38], PCR, or next-generation sequencing techniques [39,40,41]. Overall, reactive lymphoid tissue is characterized by being heterogeneous.
Conversely, DLBCL has specific histological characteristics. DLBCL demonstrate partial or more commonly a total architectural effacement of the lymph node by diffuse proliferation of medium to large lymphoid cells [6,7,9,12,33]. The neoplastic B lymphocytes fit into three common morphological variants, namely centroblastic, immunoblastic, and anaplastic variants. Centroblastic morphology is the most common. Centroblasts are medium-sized to large lymphoid cells with round and vesicular nuclei with fine chromatin [1]. The immunoblastic variant has >90% immunoblasts characterized by single centrally located nucleolus and basophilic cytoplasm. Anaplastic variant includes large cells with bizarre pleomorphic nuclei that may resemble Hodgkin/Reed-Stenberg cells [42]. In some cases, the anaplastic variant may resemble undifferentiated carcinoma [43,44,45,46,47]. Oher rare morphological variants include myxoid stroma, fibrillary matrix, spindle-shaped [48,49,50], multilobated [51,52,53], and signet ring cells [54,55].
All these histological characteristics can potentially be analyzed using image processing and computer vision strategies. We recently successfully performed image classification of benign and neoplastic conditions using convolutional neural networks and deep learning [23,28,29,30,31]. However, without a complete understanding of how deep learning models make decisions and a lack of control over the internal-making processes, it is difficult to implement artificial intelligence (AI) methods in critical applications and environments [56]. As neural network models are described as a “black box”, several techniques have been developed to explain how they work. These techniques are known as eXplainable Artificial Intelligence (XAI). In our studies, we have successfully used grad-CAM, image LIME, and occlusion sensitivity [23,28,29,30,31], but a complete understanding of how deep learning models work and make decisions is elusive. In this study, we used a different approach and focused on computer vision analysis of entropy, which was previously applied in the study of acute lymphoblastic leukemia classification [57]. We found that it was feasible to differentiate between reactive lymphoid tissue and DLBCL. Entropy level (randomness) was lower in DLBCL, which could represent a measurement of monoclonality of the neoplastic B lymphocytes and diffuse effacement of the lymphoid tissue architecture.
DLBCL is an aggressive B-cell malignancy and one of the most common lymphomas. Under current treatments, two-thirds of patients are expected to have long-term survival. However, in one-third of patients, the disease behaves aggressively [1,6,7,8]. First-line treatment of DLBCL includes R-CHOP in the case of the GCB subtype, Pola-R-CHP in the ABC subtype, and DA-R-EPOCH in double-hit MYC and BCL2 [43]. Second-line treatment differs depending on the time of progression from diagnosis. Early progression (< 1 year from diagnosis) can be treated with CAR T-cell therapy (including bridging therapy). Late progression (> 1 year from diagnosis) includes salvage therapy and autologous stem cell transplant [43]. If unsuccessful, third-line therapy will be applied, including CAR T, bispecific antibodies, antibody-drug conjugate combinations, monoclonal antibody combinations, novel agents/clinical trials, and supportive/palliative care [58,59,60].
This study divided the DLBCL patients into two groups according to the overall survival: DLBCL patients who experience death events within the first 2 years after diagnosis and the others. This division is compatible with the early and late progression algorithms [43,58,59,60]. The correlation with clinicopathological characteristics showed that patients with DLBCL with the lowest entropy were associated with a moderate overall survival, but patients with DLBCL with higher entropy were associated with aggressive clinical evolution and death within the first 2 years. Therefore, the evaluation of histological entropy may be useful in patients assessment of risk in the future.
Finally, the gene expression analysis allowed us to identify which genes and immuno-oncology pathways were relevant in this model and to know which genes were upregulated and downregulated in the cases with high entropy. Relevant genes were STAT3, LYN, and MYD88, which are genes known to be relevant in DLBCL pathogenesis [61,62,63].
A limitation of this study is the relatively small series of cases and the lack of an external validation set. In the future, larger series of DLBCL cases could be analyzed.
Conclusion
In comparison to reactive lymphoid tissue, DLBCL is characterized by lower histological entropy (randomness). Within the DLBCL diagnostic category, higher entropy is associated with aggressive clinical evolution and death within the first 2 years, and lower entropy is associated with a moderate and more favorable outcome.
Funding
This research was funded to J.C. by the Ministry of Education, Culture, Sports, Science and Technology (MEXT) and the Japan Society for the Promotion of Science (JSPS), grant numbers KAKEN 15K19061, 18K15100, and 23K06454.
Institutional Review Board Statement
The study was conducted following the Declaration of Helsinki and approved by the Institutional Review Board of Tokai University, School of Medicine (protocol code IRB20-156).
Informed Consent Statement
Informed consent was obtained from all subjects involved in the study.
Data Availability Statement
All data are available upon request to Joaquim Carreras (joaquim.carreras@tokai.ac.jp) and are also shown in the Supplementary File.
Conflicts of Interest
The authors declare no conflicts of interest.
References
- Swerdlow, S.H.; Campo, E.; Harris, N.L.; et al. (Eds.) WHO Classification of Tumours of Haematopoietic and Lymphoid Tissues, revised 4th edition; International Agency for Research on Cancer (IARC): Lyon, 2017. [Google Scholar]
- Morton, L.M.; Wang, S.S.; Devesa, S.S.; Hartge, P.; Weisenburger, D.D.; Linet, M.S. Lymphoma incidence patterns by WHO subtype in the United States, 1992-2001. Blood 2006, 107, 265–276. [Google Scholar] [CrossRef]
- Smith, A.; Howell, D.; Patmore, R.; Jack, A.; Roman, E. Incidence of haematological malignancy by sub-type: a report from the Haematological Malignancy Research Network. Br. J. Cancer 2011, 105, 1684–1692. [Google Scholar] [CrossRef] [PubMed]
- van Leeuwen, M.T.; Turner, J.J.; Joske, D.J.; Falster, M.O.; Srasuebkul, P.; Meagher, N.S.; Grulich, A.E.; Giles, G.G.; Vajdic, C.M. Lymphoid neoplasm incidence by WHO subtype in Australia 1982-2006. Int. J. Cancer 2014, 135, 2146–2156. [Google Scholar] [CrossRef] [PubMed]
- Wang, S.S. Epidemiology and etiology of diffuse large B-cell lymphoma. Semin Hematol. 2023, 60, 255–266. [Google Scholar] [CrossRef]
- Alaggio, R.; Amador, C.; Anagnostopoulos, I.; Attygalle, A.D.; Araujo, I.B.O.; Berti, E.; Bhagat, G.; Borges, A.M.; Boyer, D.; Calaminici, M.; et al. The 5th edition of the World Health Organization Classification of Haematolymphoid Tumours: Lymphoid Neoplasms. Leukemia 2022, 36, 1720–1748. [Google Scholar] [CrossRef]
- Arber, D.A.; Orazi, A.; Hasserjian, R.P.; Borowitz, M.J.; Calvo, K.R.; Kvasnicka, H.M.; Wang, S.A.; Bagg, A.; Barbui, T.; Branford, S.; et al. International Consensus Classification of Myeloid Neoplasms and Acute Leukemias: integrating morphologic, clinical, and genomic data. Blood 2022, 140, 1200–1228. [Google Scholar] [CrossRef]
- Campo, E.; Jaffe, E.S.; Cook, J.R.; Quintanilla-Martinez, L.; Swerdlow, S.H.; Anderson, K.C.; Brousset, P.; Cerroni, L.; de Leval, L.; Dirnhofer, S.; et al. The International Consensus Classification of Mature Lymphoid Neoplasms: a report from the Clinical Advisory Committee. Blood 2022, 140, 1229–1253. [Google Scholar] [CrossRef] [PubMed]
- Cazzola, M.; Sehn, L.H. Developing a classification of hematologic neoplasms in the era of precision medicine. Blood 2022, 140, 1193–1199. [Google Scholar] [CrossRef]
- Collinge, B.; Hilton, L.K.; Wong, J.; Alduaij, W.; Ben-Neriah, S.; Slack, G.W.; Farinha, P.; Boyle, M.; Meissner, B.; Cook, J.R.; et al. High-grade B-cell lymphoma, not otherwise specified: an LLMPP study. Blood Adv. 2025, 9, 5409–5422. [Google Scholar] [CrossRef]
- Kurz, K.S.; Ondrejka, S.L.; Collinge, B.; Slack, G.W.; Farinha, P.; Rosenwald, A.; Campo, E.; Amador, C.; Greiner, T.C.; Raess, P.W.; et al. Challenges in Diagnosing High-grade B-cell Lymphoma, NOS: Poor Interobserver Agreement on Its Morphologic Definition-An LLMPP Study. Am. J. Surg. Pathol. 2026. [Google Scholar] [CrossRef]
- Naresh, K.N.; Karube, K.; Borges, A.; Cheuk, W.; Gujral, S.; Sayed, S.; Sohani, A.; Lazzi, S.; Ott, G.; Du, M.Q.; et al. Fifth edition WHO classification: mature B-cell neoplasms. J. Clin. Pathol. 2025, 78, 725–739. [Google Scholar] [CrossRef]
- Chapuy, B.; Stewart, C.; Dunford, A.J.; Kim, J.; Kamburov, A.; Redd, R.A.; Lawrence, M.S.; Roemer, M.G.M.; Li, A.J.; Ziepert, M.; et al. Molecular subtypes of diffuse large B cell lymphoma are associated with distinct pathogenic mechanisms and outcomes. Nat. Med. 2018, 24, 679–690. [Google Scholar] [CrossRef]
- Brown, Jennifer R; Aster, Jon C. Pathobiology of diffuse large B cell lymphoma and primary mediastinal large B cell lymphoma; Lister, Andrew, Rosmarin, Alan G, Eds.; UpToDate, 11 Feb 2025; Available online: www.uptodate.com (accessed on 31 May 2026).
- Ruppert, A.S.; Dixon, J.G.; Salles, G.; Wall, A.; Cunningham, D.; Poeschel, V.; Haioun, C.; Tilly, H.; Ghesquieres, H.; Ziepert, M.; et al. International prognostic indices in diffuse large B-cell lymphoma: a comparison of IPI, R-IPI, and NCCN-IPI. Blood 2020, 135, 2041–2048. [Google Scholar] [CrossRef]
- Hans, C.P.; Weisenburger, D.D.; Greiner, T.C.; Gascoyne, R.D.; Delabie, J.; Ott, G.; Muller-Hermelink, H.K.; Campo, E.; Braziel, R.M.; Jaffe, E.S.; et al. Confirmation of the molecular classification of diffuse large B-cell lymphoma by immunohistochemistry using a tissue microarray. Blood 2004, 103, 275–282. [Google Scholar] [CrossRef] [PubMed]
- Maurer, M.J.; Jais, J.P.; Ghesquieres, H.; Witzig, T.E.; Hong, F.; Haioun, C.; Thompson, C.A.; Thieblemont, C.; Micallef, I.N.; Porrata, L.F.; et al. Personalized risk prediction for event-free survival at 24 months in patients with diffuse large B-cell lymphoma. Am. J. Hematol. 2016, 91, 179–184. [Google Scholar] [CrossRef]
- Warnnissorn, N.; Kanitsap, N.; Niparuck, P.; Boonsakan, P.; Kulalert, P.; Limvorapitak, W.; Bhoopat, L.; Saengboon, S.; Chantrathammachart, P.; Puavilai, T.; et al. External validation and comparison of IPI, R-IPI, and NCCN-IPI in diffuse large B-cell lymphoma patients treated with R-CHOP to predict 2-year progression-free survival. Hematology 2022, 27, 1237–1245. [Google Scholar] [CrossRef] [PubMed]
- Crump, M.; Neelapu, S.S.; Farooq, U.; Van Den Neste, E.; Kuruvilla, J.; Westin, J.; Link, B.K.; Hay, A.; Cerhan, J.R.; Zhu, L.; et al. Outcomes in refractory diffuse large B-cell lymphoma: results from the international SCHOLAR-1 study. Blood 2017, 130, 1800–1808. [Google Scholar] [CrossRef]
- Ekberg, S.; Jerkeman, M.; Andersson, P.O.; Enblad, G.; Wahlin, B.E.; Hasselblom, S.; Andersson, T.M.; Eloranta, S.; Smedby, K.E. Long-term survival and loss in expectancy of life in a population-based cohort of 7114 patients with diffuse large B-cell lymphoma. Am. J. Hematol. 2018. [Google Scholar] [CrossRef]
- Abu Sabaa, A.; Morth, C.; Hasselblom, S.; Hedstrom, G.; Flogegard, M.; Stern, M.; Andersson, P.O.; Glimelius, I.; Enblad, G. Age is the most important predictor of survival in diffuse large B-cell lymphoma patients achieving event-free survival at 24 months: a Swedish population-based study. Br. J. Haematol. 2021, 193, 906–914. [Google Scholar] [CrossRef] [PubMed]
- Thieblemont, C.; Gomes Da Silva, M.; Leppa, S.; Lenz, G.; Cottereau, A.S.; Fox, C.; Lopez-Guillermo, A.; Illidge, T.; Jurczak, W.; Eich, H.; et al. Large B-cell lymphoma (LBCL): EHA Clinical Practice Guidelines for diagnosis, treatment, and follow-up. Hemasphere 2025, 9, e70207. [Google Scholar] [CrossRef]
- Carreras, J. Clinicopathological Characteristics and Prediction of Overall Survival and Death Within 2 Years in Diffuse Large B-Cell Lymphoma Based on Histological Images and Deep Learning. Biomedicines 2026, 14, 1134. [Google Scholar] [CrossRef]
- Cui, N.; Wu, Y.; Xin, G.; Wu, J.; Zhong, L.; Liang, H. Application of Quantitative Interpretability to Evaluate CNN-Based Models for Medical Image Classification. IEEE Access 2025, vol. 13, 89386–89398. [Google Scholar] [CrossRef]
- Tarabichi, M.; Antoniou, A.; Saiselet, M.; Pita, J.M.; Andry, G.; Dumont, J.E.; Detours, V.; Maenhaut, C. Systems biology of cancer: entropy, disorder, and selection-driven evolution to independence, invasion and “swarm intelligence”. Cancer Metastasis Rev. 2013, 32, 403–421. [Google Scholar] [CrossRef]
- Dumont, J.E.; Dremier, S.; Pirson, I.; Maenhaut, C. Cross signaling, cell specificity, and physiology. Am. J. Physiol. Cell Physiol. 2002, 283, C2–28. [Google Scholar] [CrossRef] [PubMed]
- Riggs, J.E. Carcinogenesis, genetic instability and genomic entropy: insight derived from malignant brain tumor age specific mortality rate dynamics. J. Theor. Biol. 1994, 170, 331–338. [Google Scholar] [CrossRef]
- Carreras, J.; Ikoma, H.; Kikuti, Y.Y.; Nagase, S.; Ito, A.; Orita, M.; Tomita, S.; Tanigaki, Y.; Nakamura, N.; Masugi, Y. Histological Image Classification Between Follicular Lymphoma and Reactive Lymphoid Tissue Using Deep Learning and Explainable Artificial Intelligence (XAI). Cancers 2025, 17, 2428. [Google Scholar] [CrossRef] [PubMed]
- Carreras, J.; Roncador, G.; Hamoudi, R. Dataset and AI Workflow for Deep Learning Image Classification of Ulcerative Colitis and Colorectal Cancer. Data 2025, 10, 99. [Google Scholar] [CrossRef]
- Carreras, J.; Roncador, G.; Hamoudi, R. Ulcerative Colitis, LAIR1 and TOX2 Expression, and Colorectal Cancer Deep Learning Image Classification Using Convolutional Neural Networks. Cancers 2024, 16, 4230. [Google Scholar] [CrossRef]
- Carreras, J. Celiac Disease Deep Learning Image Classification Using Convolutional Neural Networks. J. Imaging 2024, 10, 200. [Google Scholar] [CrossRef]
- Gonzalez, R. C.; Woods, R. E.; Eddins, S. L. Digital Image Processing Using MATLAB; Prentice Hall: New Jersey, 2003; Volume Chapter 11. [Google Scholar]
- Jaffe, Elaine Sarkin; Arber, Daniel A.; Campo, Elias; Quintanilla-Fend, Leticia; Orazi, Attilio; Rimsza, Lisa M.; Swerdlow, Steven H. Hematopathology. 3rd Edition - May 30, 2024; Latest edition; Elsevier: Imprint.
- Chan, John K.C. An approach to distinction between reactive and malignant lymphoid proliferation. Pathol. Vol. 42 2010, Supplement 1, S13. [Google Scholar] [CrossRef]
- Korybski, J.; Zelig, J.; Narayanan, S.; Blonski, W.; Kazimierski, K.M.; Dierkes, J.H.; Popiela, H.L.; Gabriel, A.P.; Neubauer, K. Deciphering whipple’s disease complexity. Clin. Exp. Med. 2026, 26, 141. [Google Scholar] [CrossRef] [PubMed]
- Lagerstrom, I.T.; Danielson, D.T.; Muir, J.M.; Foss, R.D.; Auerbach, A.; Aguilera, N.S. A Comprehensive Review of Kimura Disease. Head. Neck Pathol. 2025, 19, 75. [Google Scholar] [CrossRef]
- Nishimura, M.F.; Sakao, C.; Kurokawa, Y.; Nishimura, Y.; Nishikori, A.; Yamamoto, H.; Sato, Y. Kikuchi-Fujimoto disease: investigating comprehensive clinicopathological features and risk factors for recurrence. Histopathology 2025, 87, 68–80. [Google Scholar] [CrossRef]
- Bosch-Schips, J.; Parisi, X.; Climent, F.; Vega, F. Bridging clinicopathologic features and genetics in follicular lymphoma: Towards enhanced diagnostic accuracy and subtype differentiation. Hum. Pathol. 2025, 156, 105676. [Google Scholar] [CrossRef]
- Parry, E.M.; Okosun, J. An updated understanding of follicular lymphoma transformation. Blood 2025, 146, 1812–1823. [Google Scholar] [CrossRef]
- Merryman, R.; Rutherford, S.C.; Ansell, S.; Armand, P.; Leonard, J.P.; Nastoupil, L.; Smith, S.M.; Timmerman, J.; Zelenetz, A.D.; Gutierrez, M.; et al. Consensus recommendations from the 2024 International Follicular Lymphoma Scientific Workshop. Blood Adv. 2026, 10, 1591–1602. [Google Scholar] [CrossRef] [PubMed]
- El Daker, S.; Qualls, D.; Derkach, A.; Beqaj, S.; Boiocchi, L.; Seshan, V.; Baik, J.; Zhu, M.; Salles, G.; Dogan, A.; et al. Deep immunophenotypic dissection and clinical impact of T cells in the follicular lymphoma microenvironment. Haematologica 2025, 110, 1808–1821. [Google Scholar] [CrossRef]
- Li, M.; Liu, Y.; Wang, Y.; Chen, G.; Chen, Q.; Xiao, H.; Liu, F.; Qi, C.; Yu, Z.; Li, X.; et al. Anaplastic Variant of Diffuse Large B-cell Lymphoma Displays Intricate Genetic Alterations and Distinct Biological Features. Am. J. Surg. Pathol. 2017, 41, 1322–1332. [Google Scholar] [CrossRef]
- Ansell, S.M.; Nowakowski, G.S. Current treatment algorithm: diffuse large B cell lymphoma. Blood Cancer J. 2026, 16. [Google Scholar] [CrossRef] [PubMed]
- Goldman-Levy, G.; Barnhill, R.; Bastian, B.C.; Kempf, W.; Elder, D.; Gerami, P.; Grayson, W.; Kazakov, D.; Massi, D.; Messina, J.; et al. WHO classification of skin tumours: key updates in the fifth edition. Histopathology 2026, 88, 555–568. [Google Scholar] [CrossRef]
- Ott, G.; Balague-Ponz, O.; de Leval, L.; de Jong, D.; Hasserjian, R.P.; Elenitoba-Johnson, K.S. Commentary on the WHO classification of tumors of lymphoid tissues (2008): indolent B cell lymphomas. J. Hematop 2009, 2, 77–81. [Google Scholar] [CrossRef]
- Ott, G.; Klapper, W.; Feller, A.C.; Hansmann, M.L.; Moller, P.; Stein, H.; Rosenwald, A.; Fend, F. Revised version of the 4th edition of the WHO classification of malignant lymphomas: What is new? Pathologe 2019, 40, 157–168. [Google Scholar] [CrossRef] [PubMed]
- Ferry, J.A.; Hill, B.; Hsi, E.D. Mature B, T and NK-cell, plasma cell and histiocytic/dendritic cell neoplasms: classification according to the World Health Organization and International Consensus Classification. J. Hematol. Oncol. 2024, 17, 51. [Google Scholar] [CrossRef] [PubMed]
- Kimura, Y.; Arakawa, F.; Kiyasu, J.; Miyoshi, H.; Yoshida, M.; Ichikawa, A.; Nakashima, S.; Ishibashi, Y.; Niino, D.; Sugita, Y.; et al. A spindle cell variant of diffuse large B-cell lymphoma is characterized by T-cell/myofibrohistio-rich stromal alterations: analysis of 10 cases and a review of the literature. Eur. J. Haematol. 2012, 89, 302–310. [Google Scholar] [CrossRef] [PubMed]
- Ikemoto, A.; Uchiyama, T.; Takeda, M.; Nakamine, H.; Yoshizawa, A. Spindle-cell variant of diffuse large B-cell lymphoma in the uterine cervix: a case report and literature review. J. Clin. Exp. Hematop 2025, 65, 312–317. [Google Scholar] [CrossRef]
- Carreras, J.; Kikuti, Y.Y.; Miyaoka, M.; Hiraiwa, S.; Tomita, S.; Ikoma, H.; Kondo, Y.; Ito, A.; Nagase, S.; Miura, H.; et al. Mutational Profile and Pathological Features of a Case of Interleukin-10 and RGS1-Positive Spindle Cell Variant Diffuse Large B-Cell Lymphoma. Hematol. Rep. 2023, 15, 188–200. [Google Scholar] [CrossRef]
- Ito, A.; Miyaoka, M.; Tomita, S.; Ikoma, H.; Hiraiwa, S.; Carreras, J.; Kikuti, Y.Y.; Kawada, H.; Nakamura, N. The multilobated morphology is still a better prognosis factor of diffuse large B-cell lymphoma in the R-CHOP era. Pathol. Int. 2022, 72, 550–557. [Google Scholar] [CrossRef]
- Manabe, M.; Inano, N.; Hagiwara, Y.; Koh, K.R. Diffuse Large B-cell Lymphoma with a Multilobated Nuclear Morphology Harboring t(14;18)(q32;q21) and t(3;22)(q27;q11). Intern Med. 2025, 64, 2234–2239. [Google Scholar] [CrossRef]
- Diebold, J.; Anderson, J.R.; Armitage, J.O.; Connors, J.M.; Maclennan, K.A.; Muller-Hermelink, H.K.; Nathwani, B.N.; Ullrich, F.; Weisenburger, D.D. Diffuse large B-cell lymphoma: a clinicopathologic analysis of 444 cases classified according to the updated Kiel classification. Leuk. Lymphoma 2002, 43, 97–104. [Google Scholar] [CrossRef]
- Zhang, S.; Sun, J.; Fang, Y.; Nassiri, M.; Liu, L.; Zhou, J.; Stohler, R.; Choi, H.; Vance, G.H. Signet-ring cell lymphoma: clinicopathologic, immunohistochemical, and fluorescence in situ hybridization studies of 7 cases. Ann. Diagn. Pathol. 2017, 26, 38–42. [Google Scholar] [CrossRef]
- Zhang, L.; Min, Q.; Bi, J.; Yu, X.; Liang, Y.; Shao, M. Signet ring cell-like diffuse large B-cell lymphoma involving the breast: a case report. BMC Womens Health 2023, 23, 119. [Google Scholar] [CrossRef] [PubMed]
- Szandała, Tomasz. Unlocking the black box of CNNs: Visualising the decision-making process with PRISM. Inf. Sci. Vol. 2023, Volume 642, 119162. [Google Scholar] [CrossRef]
- Pałczyński, K.; Ledziński, D.; Andrysiak, T. Entropy Measurements for Leukocytes’ Surrounding Informativeness Evaluation for Acute Lymphoblastic Leukemia Classification. Entropy 2022, 24, 1560. [Google Scholar] [CrossRef]
- Chong, E.A.; Tomasulo, E.B.; Barta, S.K. 2026 Update on the Management of Diffuse Large B-Cell Lymphoma. Am. J. Hematol. 2026, 101, 832–863. [Google Scholar] [CrossRef]
- Abou, D.S.; Thalib, H.I.; Akil, F.; Sabbagh, S.Z.; Abou, H.S.; Pereira, M.; Hassan, F.E. Bispecific Antibodies Versus Chimeric Antigen Receptor T-Cell Therapy in Relapsed/Refractory Diffuse Large B-Cell Lymphoma: A Comparative Narrative Review of Efficacy, Safety, and Accessibility. Cancer Med. 2026, 15, e71562. [Google Scholar] [CrossRef] [PubMed]
- Penalver, F.J.; Magnano, L.; Alonso-Alvarez, S.; Jimenez-Ubieto, A.; Lopez-Guillermo, A.; Sancho, J.M. Guidelines for Diagnosis, Treatment, and Follow-Up of Patients with Follicular Lymphoma-Spanish Lymphoma Group (GELTAMO) 2025. Cancers 2026, 18. [Google Scholar] [CrossRef]
- Schmitz, R.; Wright, G.W.; Huang, D.W.; Johnson, C.A.; Phelan, J.D.; Wang, J.Q.; Roulland, S.; Kasbekar, M.; Young, R.M.; Shaffer, A.L.; et al. Genetics and Pathogenesis of Diffuse Large B-Cell Lymphoma. N Engl. J. Med. 2018, 378, 1396–1407. [Google Scholar] [CrossRef]
- Lacy, S.E.; Barrans, S.L.; Beer, P.A.; Painter, D.; Smith, A.G.; Roman, E.; Cooke, S.L.; Ruiz, C.; Glover, P.; Van Hoppe, S.J.L.; et al. Targeted sequencing in DLBCL, molecular subtypes, and outcomes: a Haematological Malignancy Research Network report. Blood 2020, 135, 1759–1771. [Google Scholar] [CrossRef]
- Ramis-Zaldivar, J.E.; Gonzalez-Farre, B.; Balague, O.; Celis, V.; Nadeu, F.; Salmeron-Villalobos, J.; Andres, M.; Martin-Guerrero, I.; Garrido-Pontnou, M.; Gaafar, A.; et al. Distinct molecular profile of IRF4-rearranged large B-cell lymphoma. Blood 2020, 135, 274–286. [Google Scholar] [CrossRef] [PubMed]
Figure 1.
Entropy measurement in the schematic set. In image processing and computer vision, entropy is a function that measures the randomness of a grayscale image. Entropy is a statistical measure of randomness that can be used to characterize the texture of in the input measure. This study used entropy to measure the complexity of the reactive lymphoid tissue and DLBCL, but first, the analysis was tested in five different images 0-4 with increased complexity (randomness).
Figure 1.
Entropy measurement in the schematic set. In image processing and computer vision, entropy is a function that measures the randomness of a grayscale image. Entropy is a statistical measure of randomness that can be used to characterize the texture of in the input measure. This study used entropy to measure the complexity of the reactive lymphoid tissue and DLBCL, but first, the analysis was tested in five different images 0-4 with increased complexity (randomness).
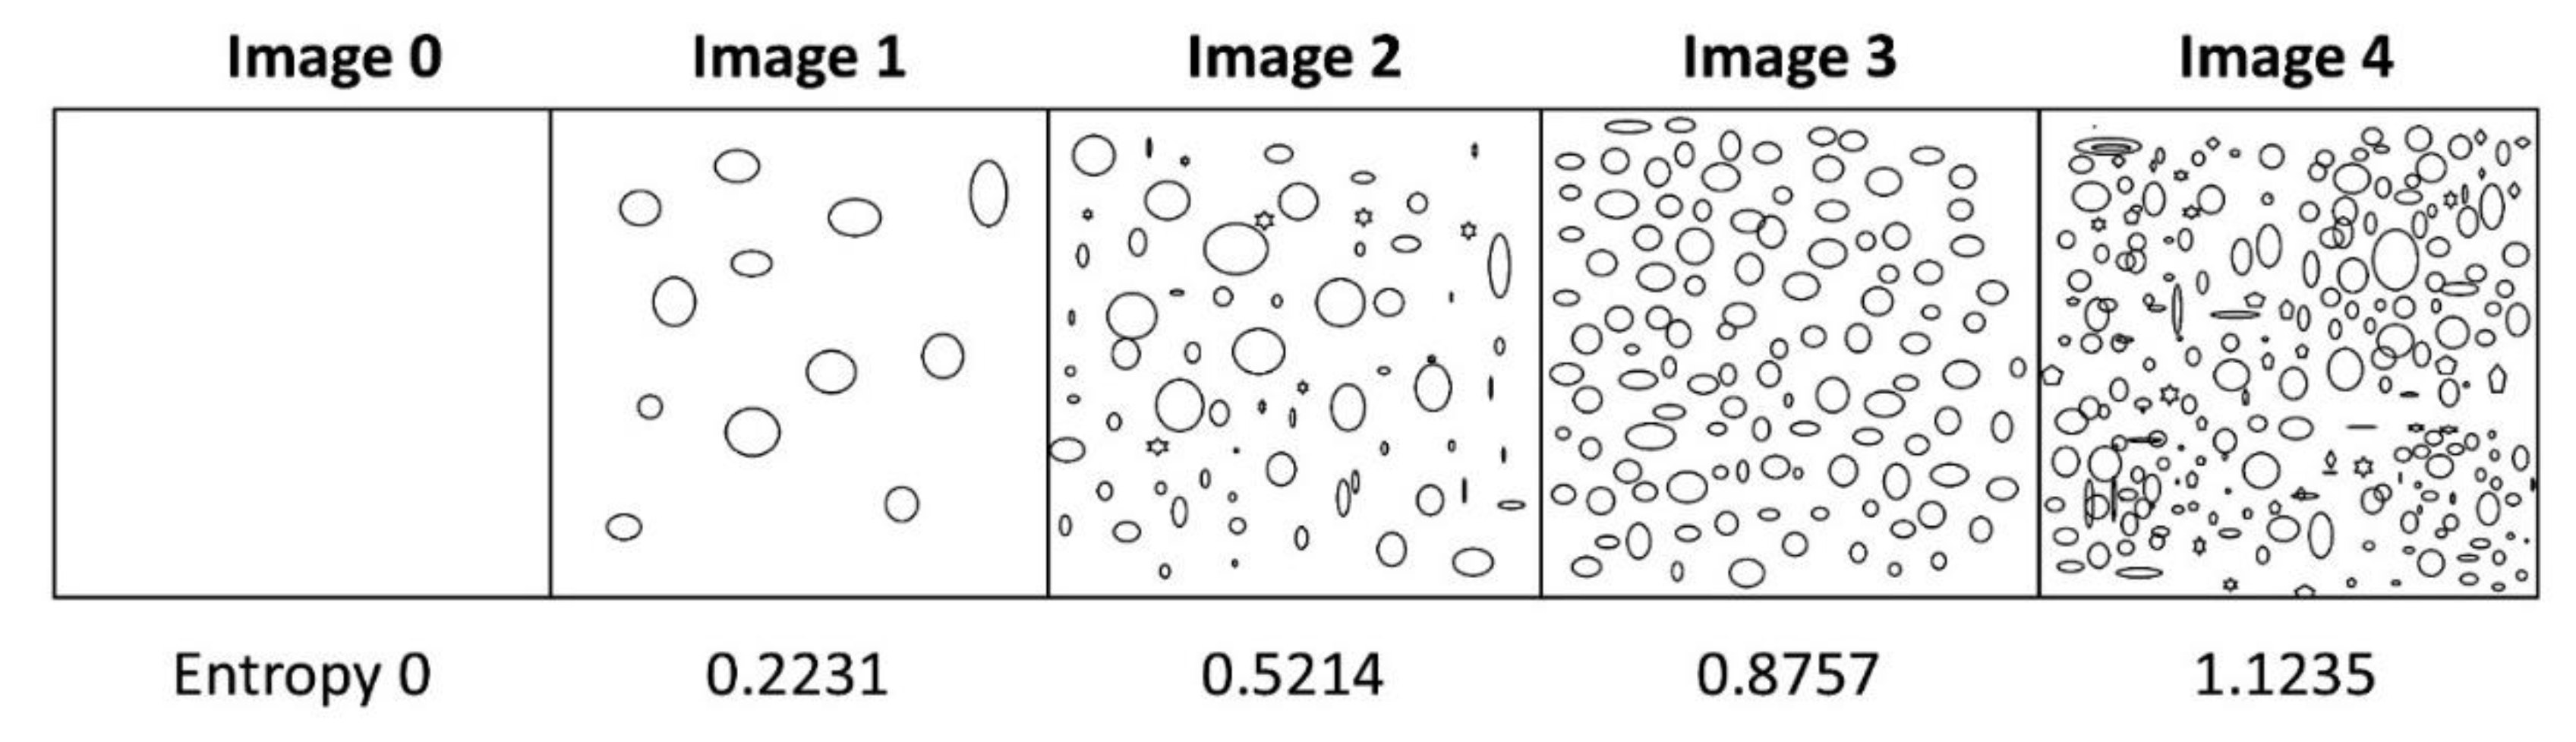
Figure 2.
Hematoxylin and eosin images. This figure shows examples of image-patches of reactive lymphoid tissue, DLBCL Dead within the first 2 years, and DLBCL Others. Although it is possible to diagnose and differentiate between reactive lymphoid tissue and DLBCL by an histopathologist, it is difficult to differentiate within the 2 DLBCL groups using a conventional optical microscope. Therefore, entropy analysis was performed to analyze the tissue structure and complexity (randomness).
Figure 2.
Hematoxylin and eosin images. This figure shows examples of image-patches of reactive lymphoid tissue, DLBCL Dead within the first 2 years, and DLBCL Others. Although it is possible to diagnose and differentiate between reactive lymphoid tissue and DLBCL by an histopathologist, it is difficult to differentiate within the 2 DLBCL groups using a conventional optical microscope. Therefore, entropy analysis was performed to analyze the tissue structure and complexity (randomness).
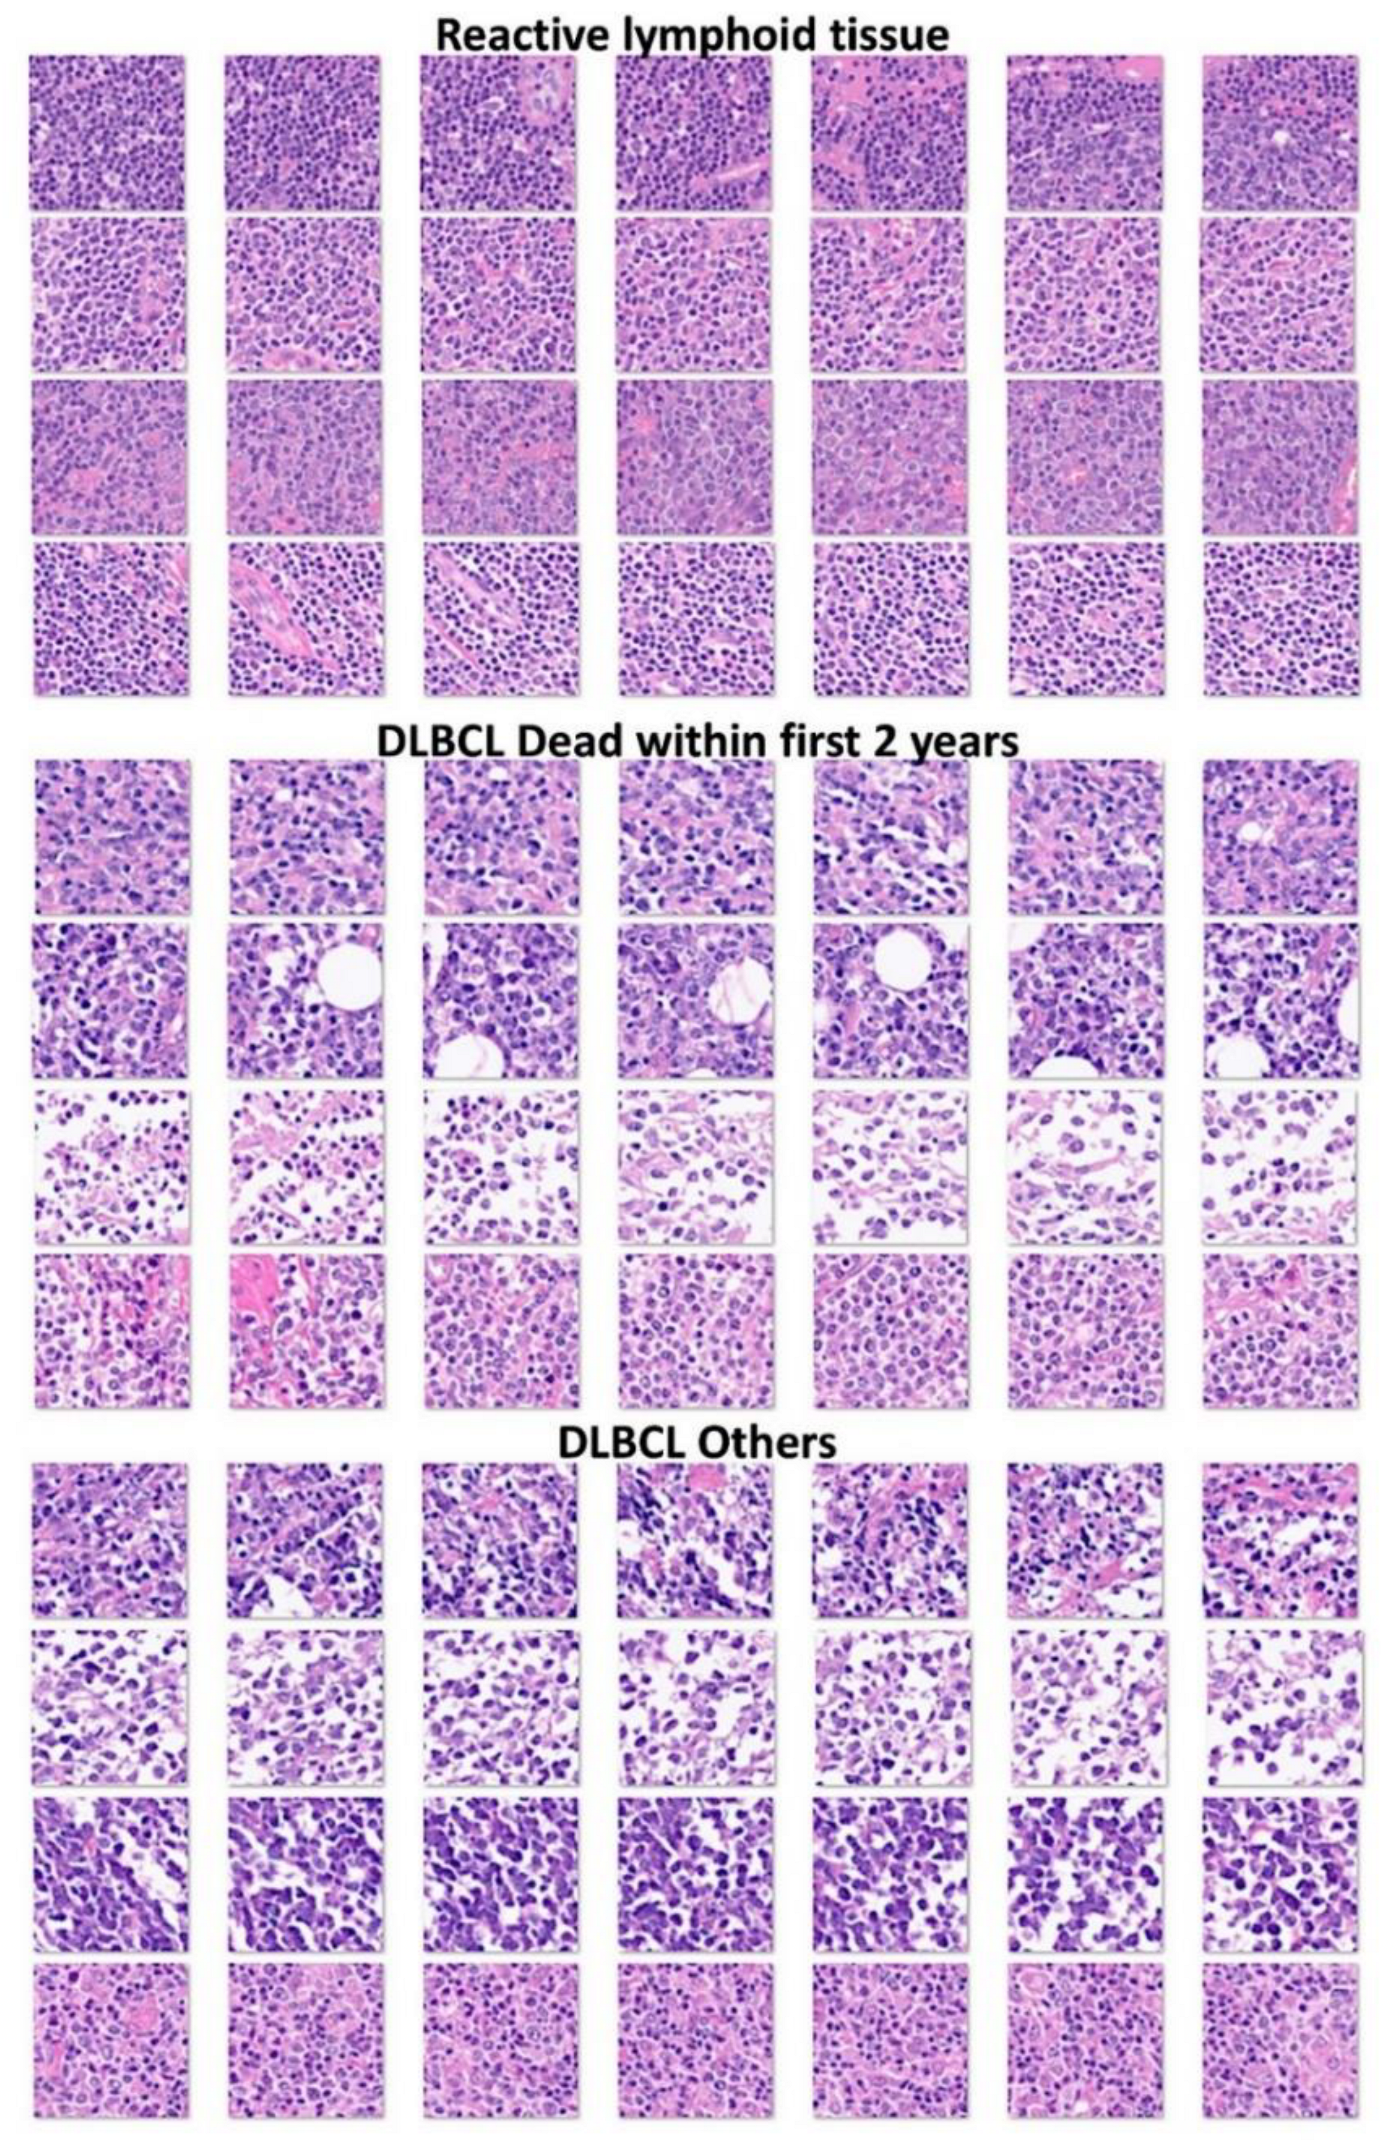
Figure 3.
Entropy measurement between groups. DLBCL is a neoplasm of medium or large B lymphocytes with diffuse growth pattern. Lymph nodes demonstrate partial or more commonly total architectural effacement by diffuse proliferation of lymphoid cells. (A1) In comparison to reactive lymphoid tissue, DLBCL was characterized by lower entropy (randomness) (Patch-based analysis). (A2) ROC analysis between reactive lymphoid tissue and DLBCL had an area under the curve (AUC) of 0.804, and the cutoff value was at 7.2 entropy (Patch-based analysis). (B1) In comparison to DLBCL Dead within the first 2 years, DLBCL Others had lower entropy measurement. Reactive lymphoid tissue (7.34 ± 0.2), DLBCL Dead within the first 2 years (6.8 ± 0.6), and DLBCL Others (6.7 ± 0.6) (all pairwise comparisons were statistically significant, P < 0.001) (Patch-based analysis). (B2) The overall survival curve of this series of DLBCL had a point of inflection at 2 years (24 months), showing that DLBCL Dead within the first 2 years had an aggressive clinical evolution and DLBCL Others a moderate evolution. (C1) In comparison with DLBCL Dead within the first 2 years, DLBCL Others group was characterized by lower entropy (P = 0.01) (patient-based analysis). (C2) DLBCL cases with high entropy were associated with poor overall survival (P = 0.003) (patient-based analysis). Of note, high entropy correlated with death within the first 2 years (P < 0.05) using crosstabulations.
Figure 3.
Entropy measurement between groups. DLBCL is a neoplasm of medium or large B lymphocytes with diffuse growth pattern. Lymph nodes demonstrate partial or more commonly total architectural effacement by diffuse proliferation of lymphoid cells. (A1) In comparison to reactive lymphoid tissue, DLBCL was characterized by lower entropy (randomness) (Patch-based analysis). (A2) ROC analysis between reactive lymphoid tissue and DLBCL had an area under the curve (AUC) of 0.804, and the cutoff value was at 7.2 entropy (Patch-based analysis). (B1) In comparison to DLBCL Dead within the first 2 years, DLBCL Others had lower entropy measurement. Reactive lymphoid tissue (7.34 ± 0.2), DLBCL Dead within the first 2 years (6.8 ± 0.6), and DLBCL Others (6.7 ± 0.6) (all pairwise comparisons were statistically significant, P < 0.001) (Patch-based analysis). (B2) The overall survival curve of this series of DLBCL had a point of inflection at 2 years (24 months), showing that DLBCL Dead within the first 2 years had an aggressive clinical evolution and DLBCL Others a moderate evolution. (C1) In comparison with DLBCL Dead within the first 2 years, DLBCL Others group was characterized by lower entropy (P = 0.01) (patient-based analysis). (C2) DLBCL cases with high entropy were associated with poor overall survival (P = 0.003) (patient-based analysis). Of note, high entropy correlated with death within the first 2 years (P < 0.05) using crosstabulations.
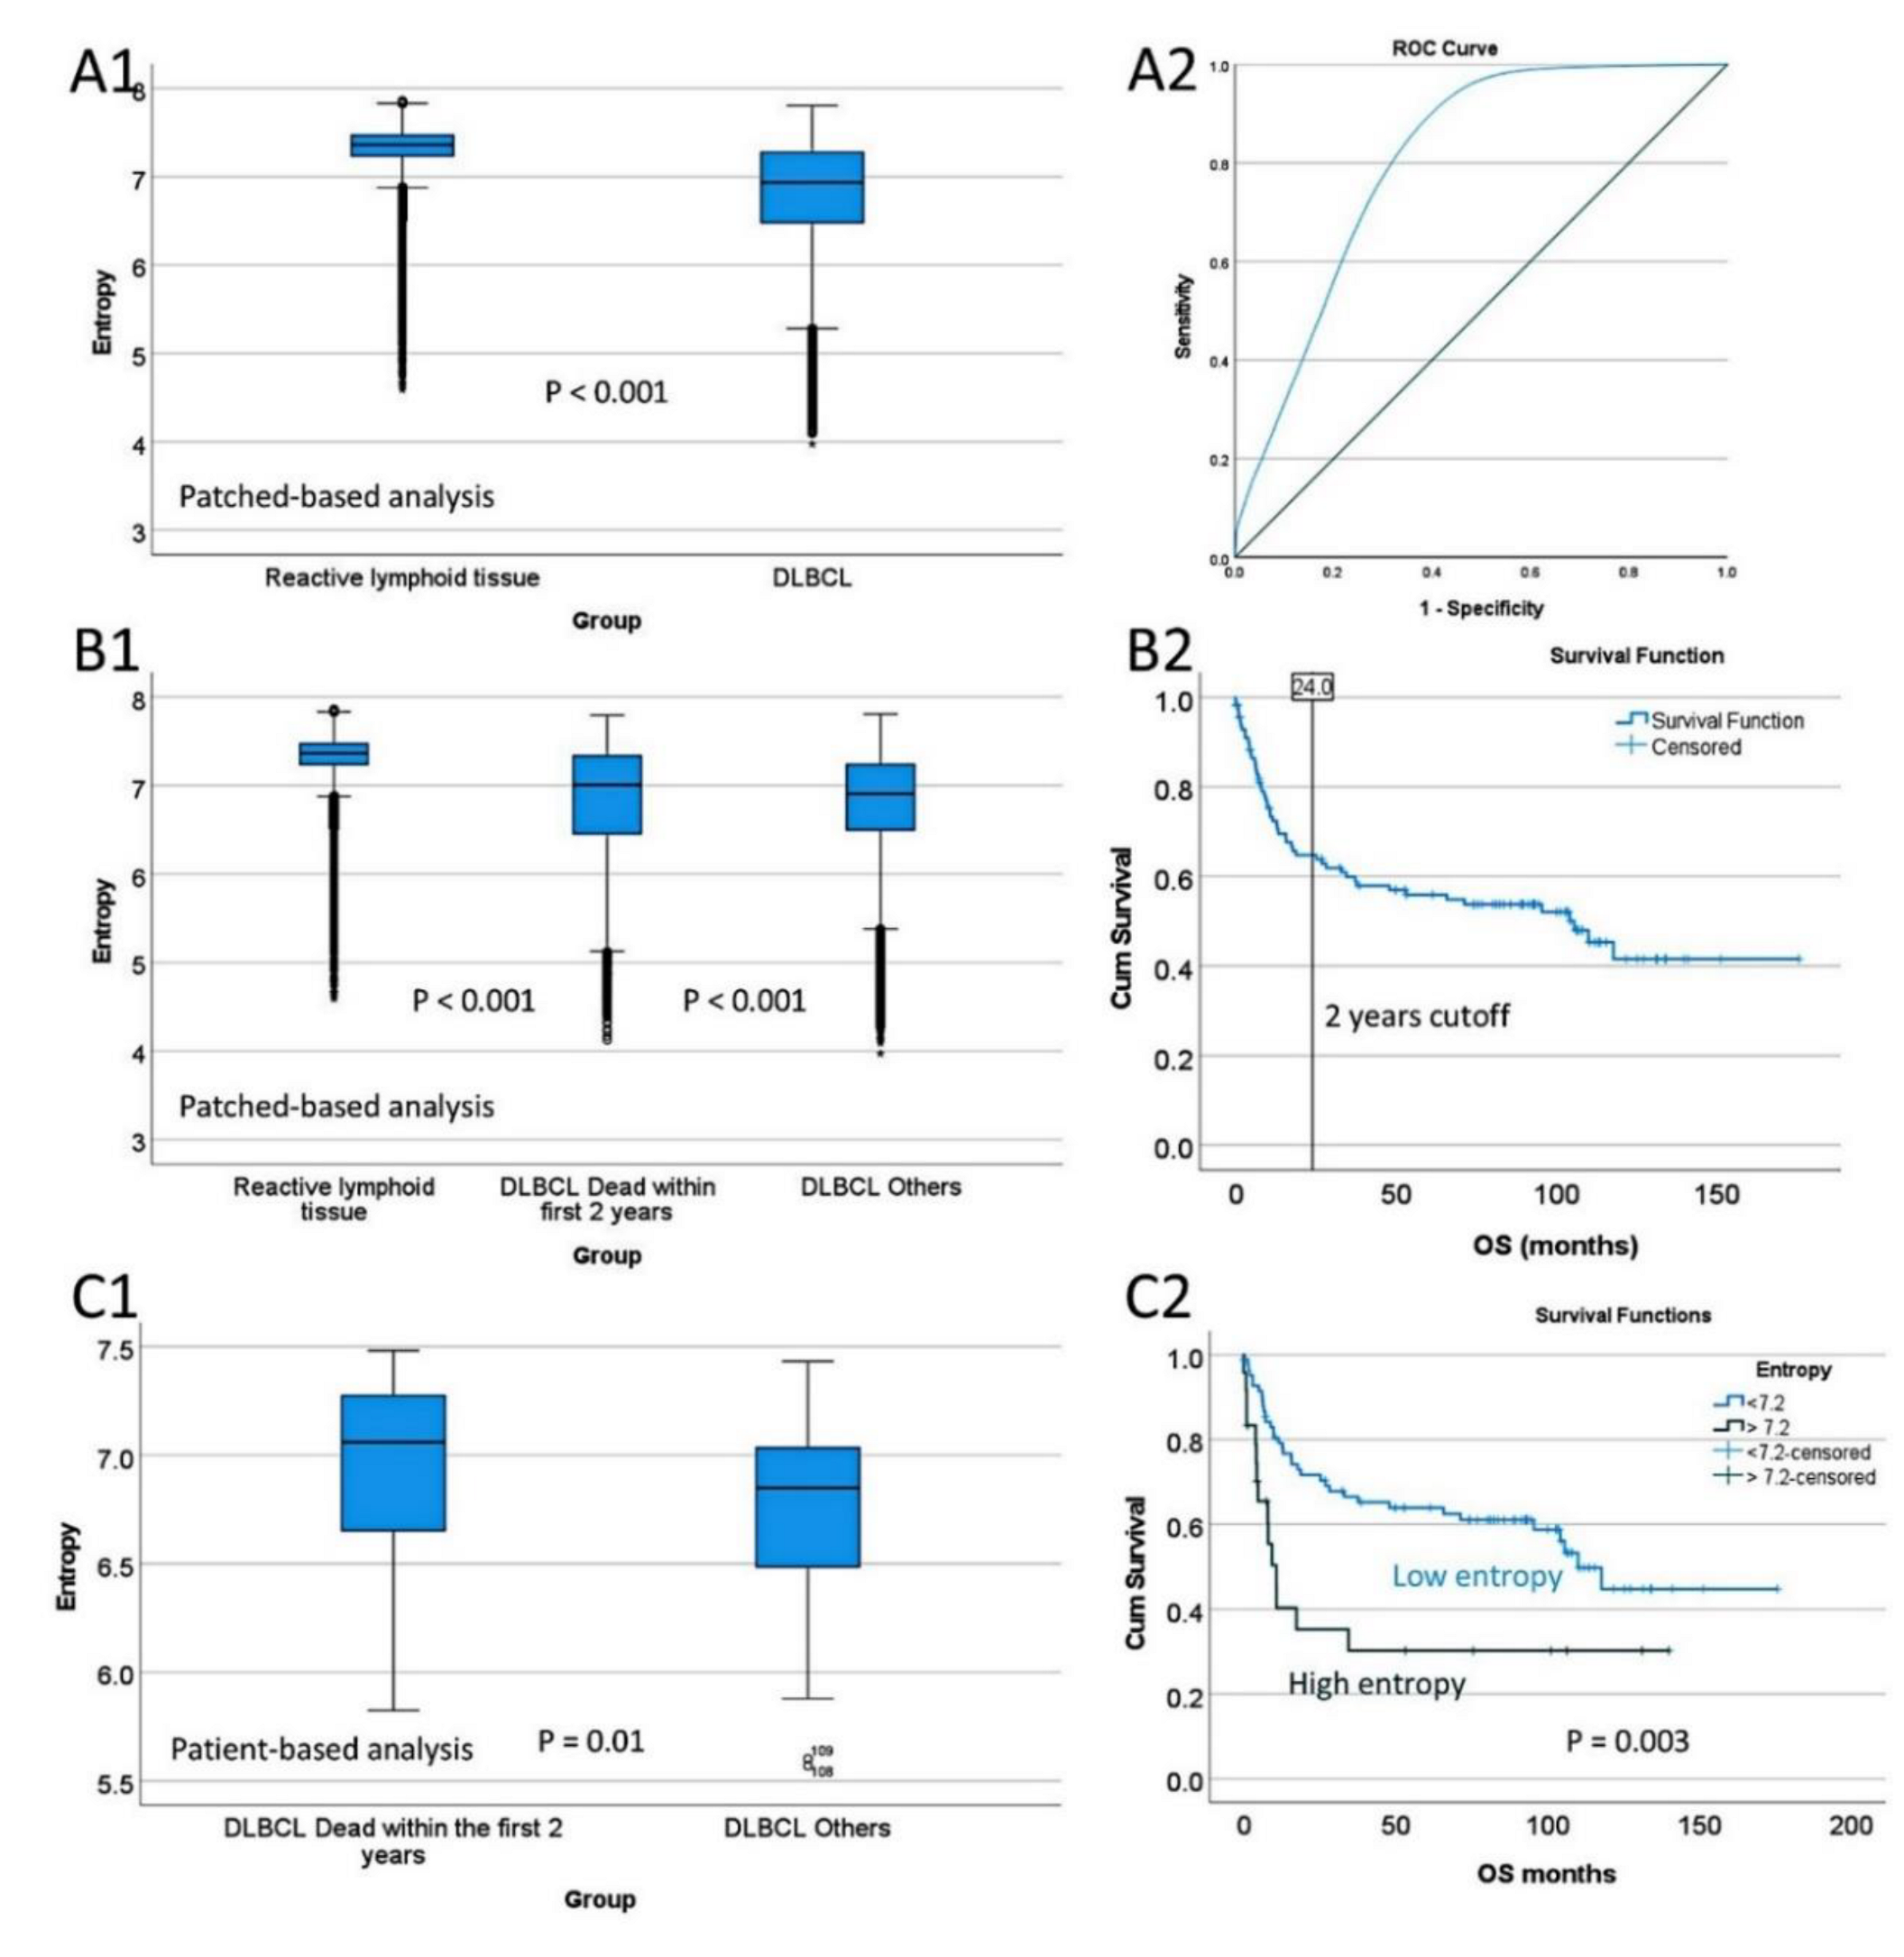
Figure 4.
Images and entropy measurement between groups. Overall, DLBCL Dead within the first 2 years was characterized by high entropy than the DLBCL Others group.
Figure 4.
Images and entropy measurement between groups. Overall, DLBCL Dead within the first 2 years was characterized by high entropy than the DLBCL Others group.
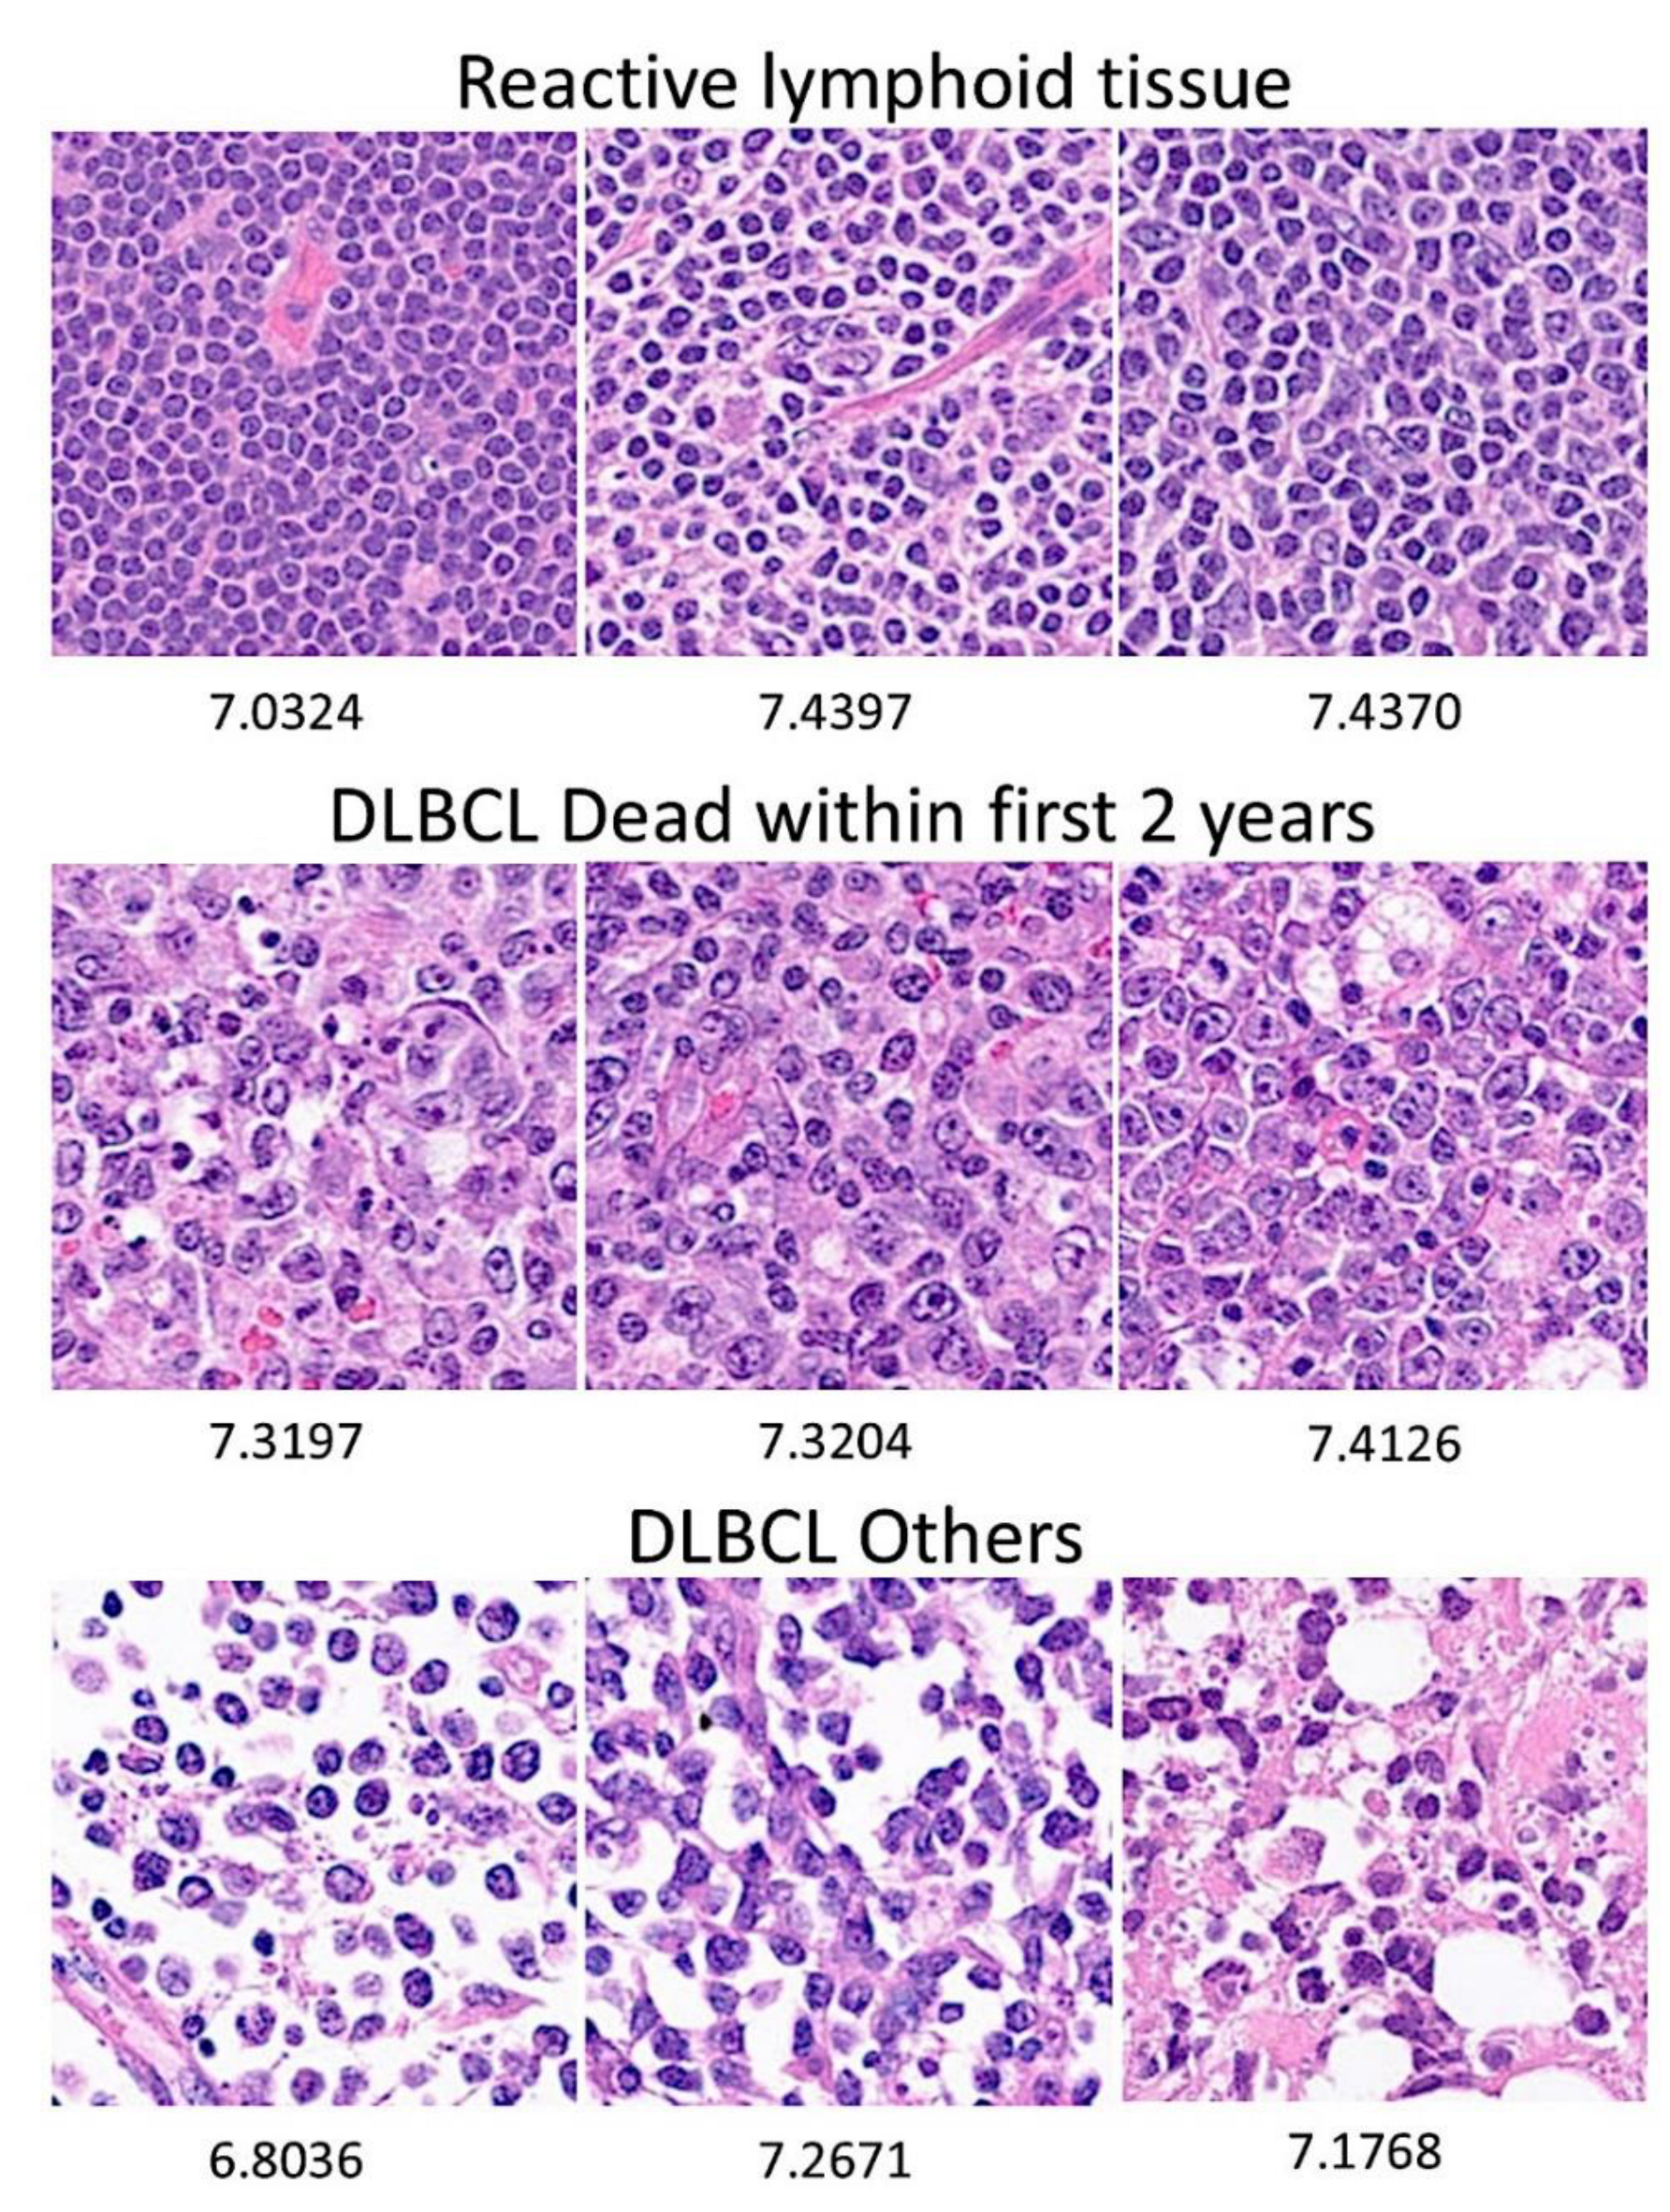
Figure 5.
Images and entropy measurement in the DLBCL Dead within the first 2 years group. In comparison with DLBCL Others, DLBCL Dead within the first 2 years group was characterized by higher entropy (P = 0.01) (patient-based analysis). DLBCL cases with high entropy were associated with poor overall survival (P = 0.003) (patient-based analysis). The entropy value is shown below each image.
Figure 5.
Images and entropy measurement in the DLBCL Dead within the first 2 years group. In comparison with DLBCL Others, DLBCL Dead within the first 2 years group was characterized by higher entropy (P = 0.01) (patient-based analysis). DLBCL cases with high entropy were associated with poor overall survival (P = 0.003) (patient-based analysis). The entropy value is shown below each image.
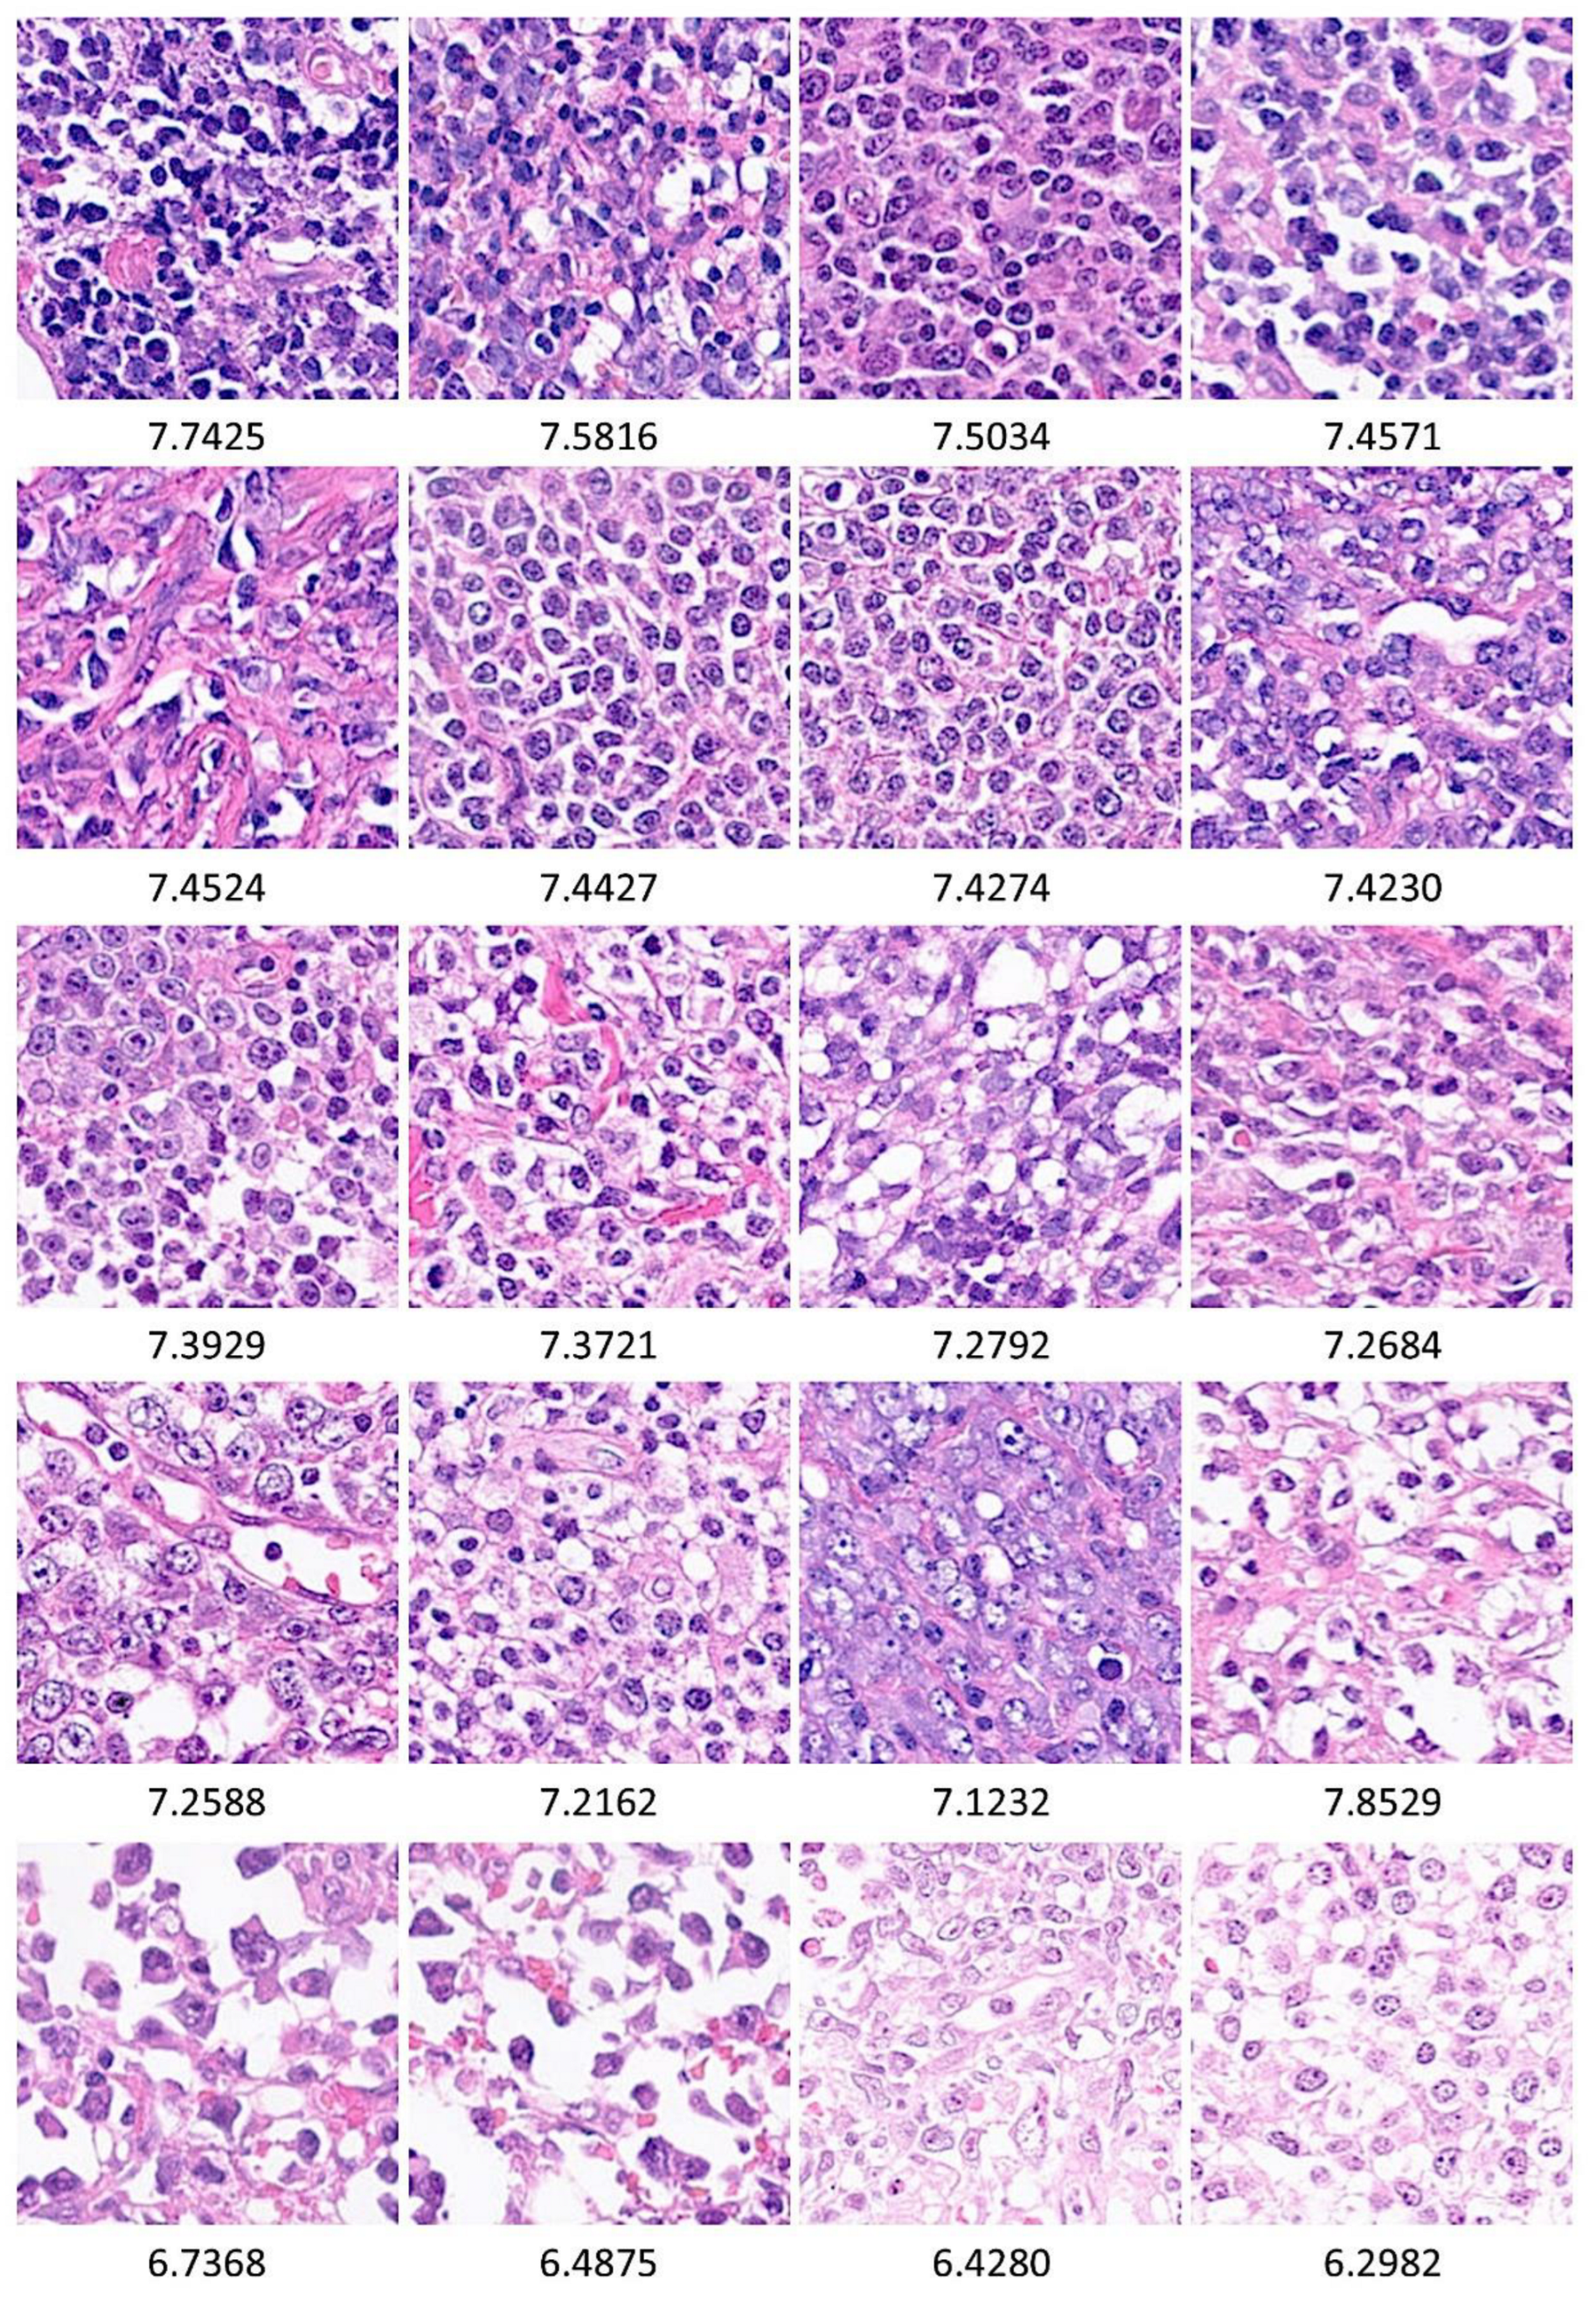
Figure 6.
Images and entropy measurement in the DLBCL Others group. In comparison with DLBCL Dead within the first 2 years, DLBCL Others was characterized by lower entropy (P = 0.01) (patient-based analysis). DLBCL cases with low entropy were associated with better (moderate) overall survival (P = 0.003) (patient-based analysis). The entropy value is shown below each image.
Figure 6.
Images and entropy measurement in the DLBCL Others group. In comparison with DLBCL Dead within the first 2 years, DLBCL Others was characterized by lower entropy (P = 0.01) (patient-based analysis). DLBCL cases with low entropy were associated with better (moderate) overall survival (P = 0.003) (patient-based analysis). The entropy value is shown below each image.
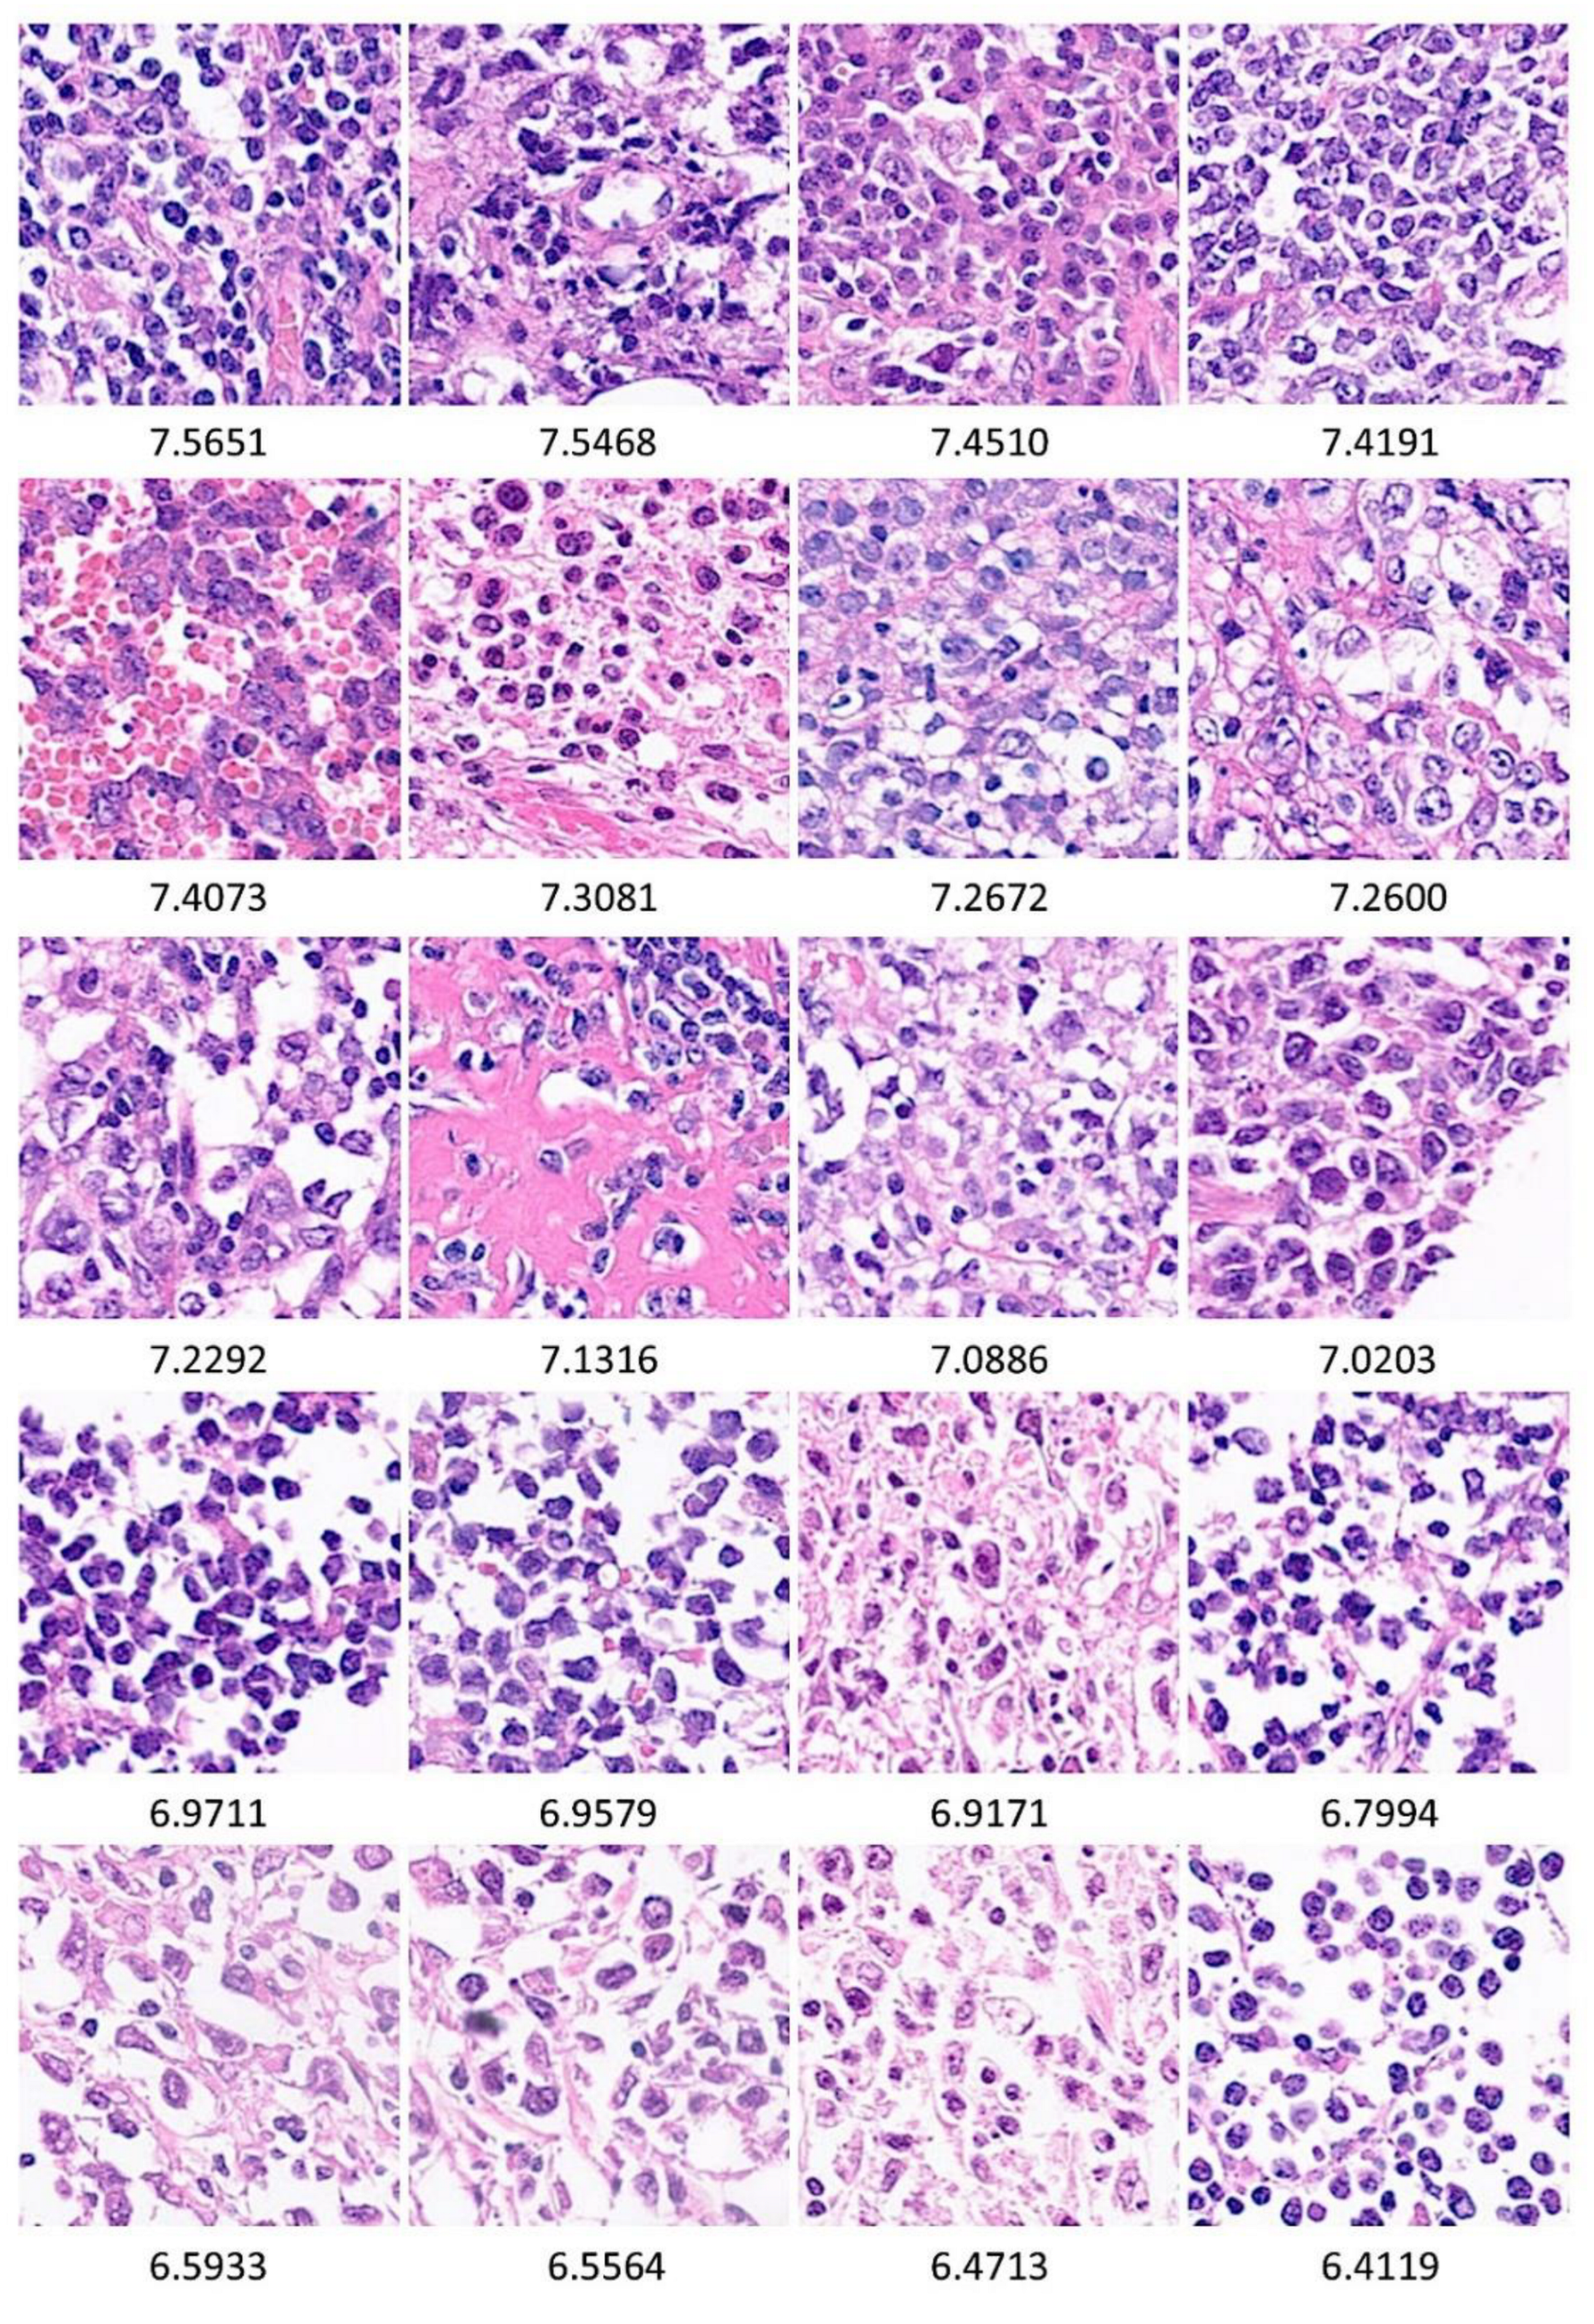
Figure 7.
Gene expression analysis. Gene expression analysis was available in 29 cases, including 6 cases with high entropy and 23 cases with low entropy. The gene expression analysis used an immune profiling (pan-cancer immuno-oncology) panel. Among the 730 genes of the panel, statistical differences were found in 43 genes: 34 were upregulated and 9 downregulated in the high extropy group. A functional network association analysis highlighted the “hub genes” that are potentially the most relevant among the upregulated genes.
Figure 7.
Gene expression analysis. Gene expression analysis was available in 29 cases, including 6 cases with high entropy and 23 cases with low entropy. The gene expression analysis used an immune profiling (pan-cancer immuno-oncology) panel. Among the 730 genes of the panel, statistical differences were found in 43 genes: 34 were upregulated and 9 downregulated in the high extropy group. A functional network association analysis highlighted the “hub genes” that are potentially the most relevant among the upregulated genes.
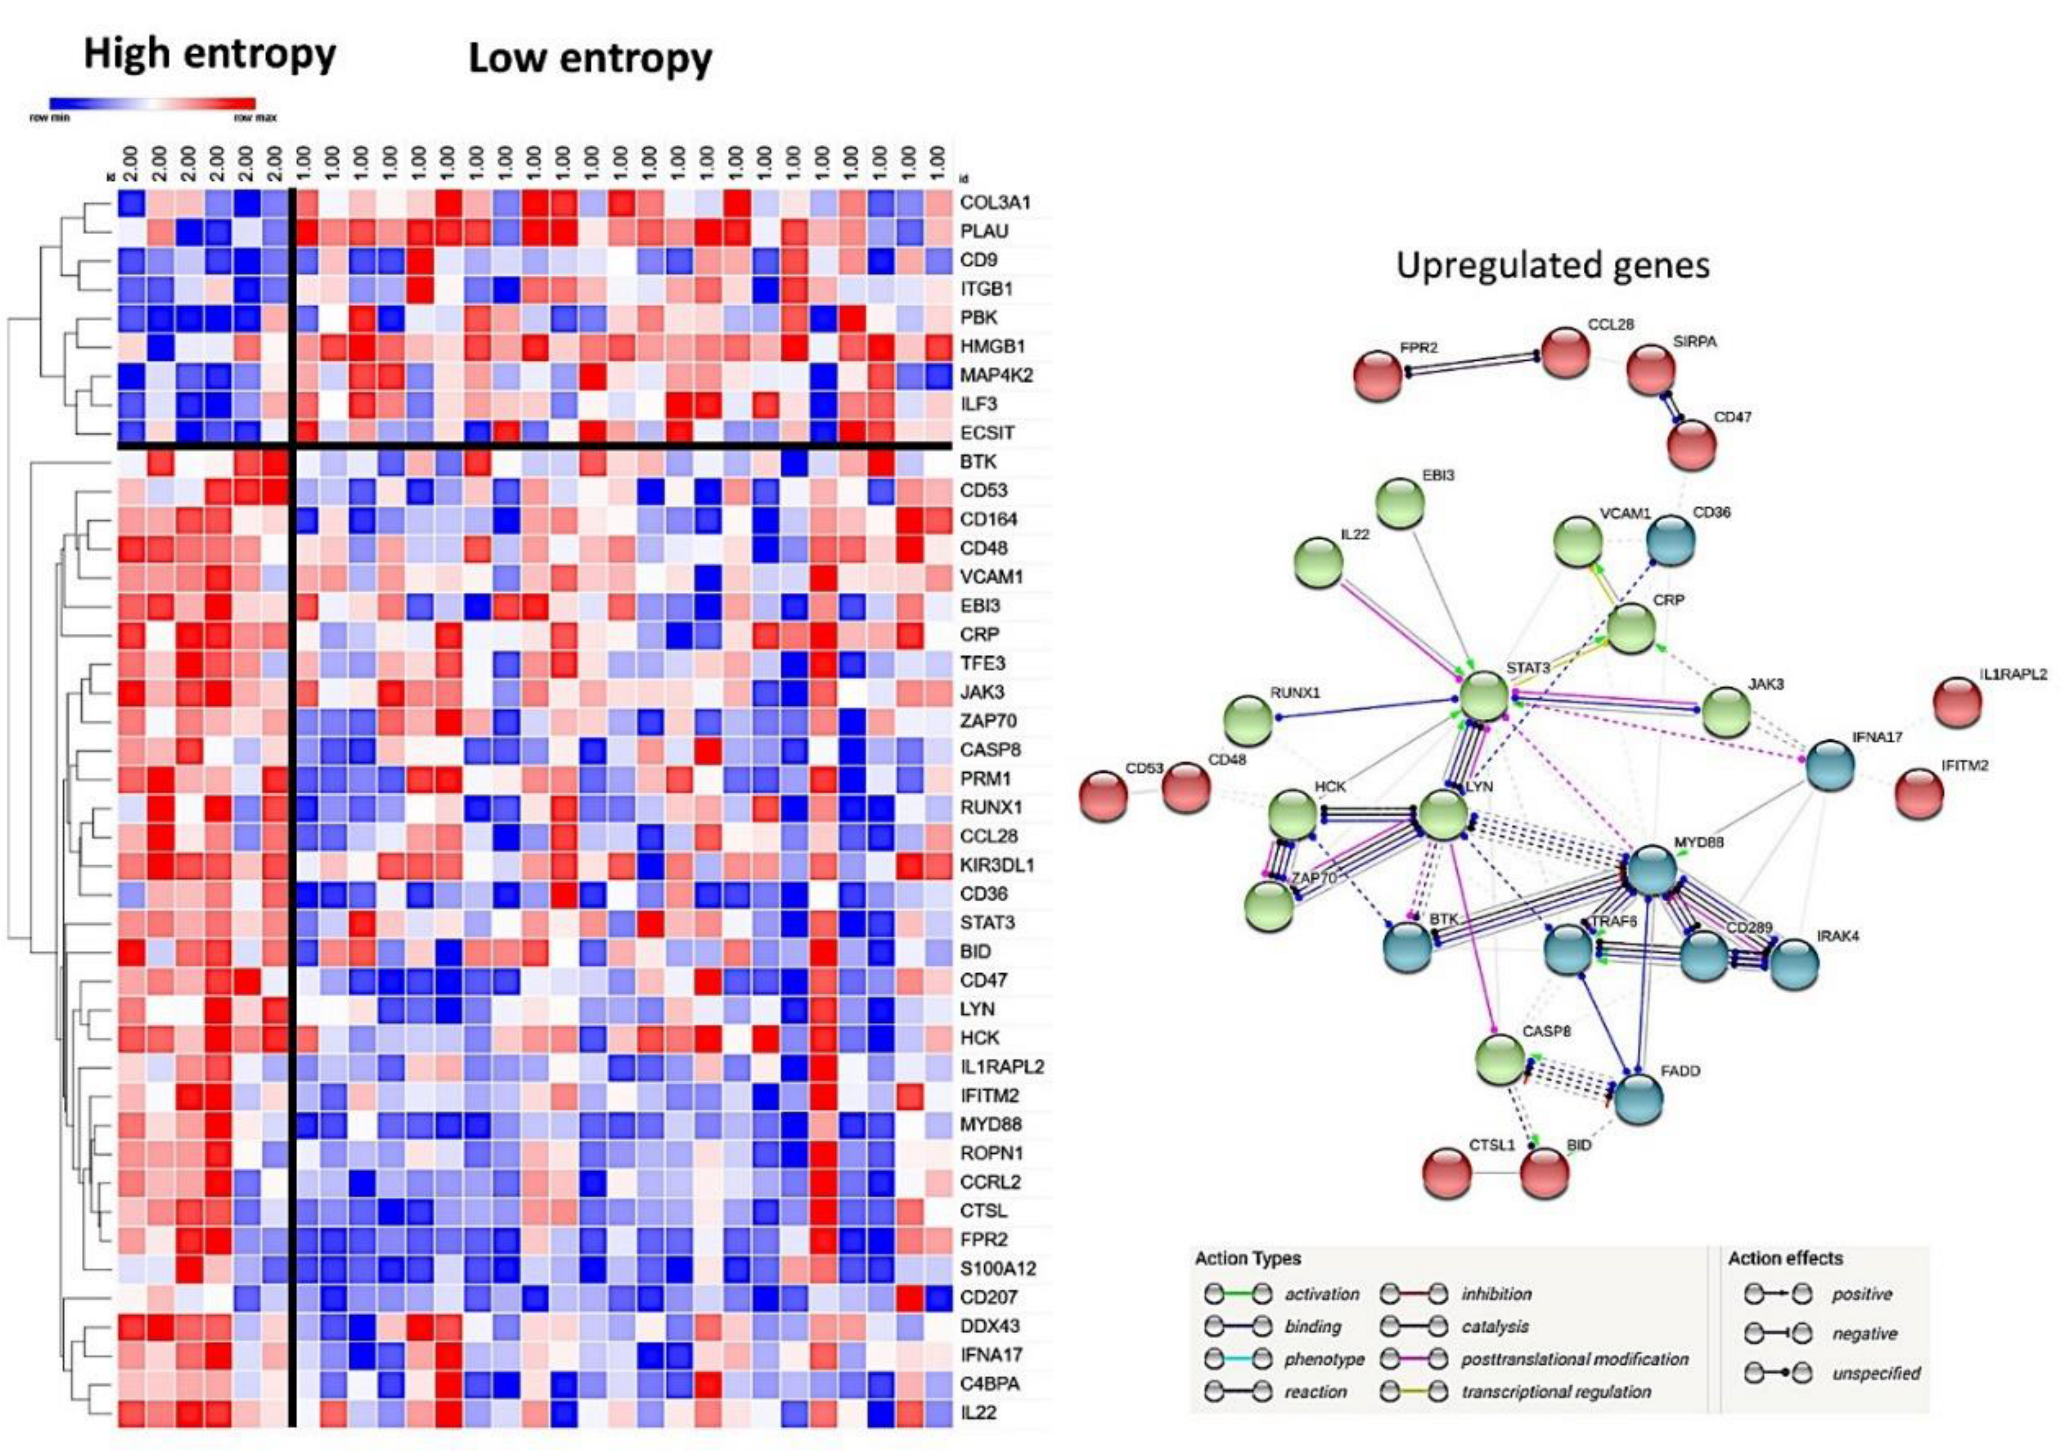

Table 1.
Entropy code.
| %Basic code I = imread(“***”) A = rgb2gray(I); J = entropy(A) |
%The code was the following imageLoc = “***”; ds = imageDatastore(imageLoc); for i = 1:length(ds.Files) I = readimage(ds, i); A = rgb2gray(I); J(i) = entropy(A); end % Display the entropy values for each image disp(J); |
% Plot the entropy values figure; bar(J); xlabel(‘Image Index’); ylabel(‘Entropy’); title(‘Entropy of Images in ***’); |
Table 2.
Clinicopathological characteristics.
| Total | Dead within the first 2 years | Others | P value | |
| Frequency | 114 (100%) | 38/114 (33.3%) | 76/114 (66.7%) | N/A |
| Entropy | 6.80 ± 0.61 | 6.83 ± 0.63 | 6.78 ± 0.59 | <0.001 |
| Clinical features | ||||
| Age > 60 years | 81/114 (71.1%) | 30/81 (37.0%) | 51/81 (63.0%) | 0.273 |
| Sex male | 60/114 (52.6%) | 19/60 (31.7%) | 41/60 (68.3%) | 0.697 |
| Location | ||||
| Nodal (+spleen) | 58/114 (50.9%) | 16/58 (27.6%) | 42/58 (72.4%) | 0.430 |
| Waldeyer’s ring | 11/114 (9.6%) | 3/11 (27.3%) | 8/11 (72.7%) | |
| Gastrointestinal | 13/114 (11.4%) | 5/13 (38.5%) | 8/13(61.5%) | |
| Other extranodal | 32/114 (28.1%) | 14/32 (43.8%) | 18/32 (56.3%) | |
| High sIL2R | 79/99 (79.8%) | 27/79 (34.2%) | 52/79 (65.8%) | 0.052 |
| High LDH | 66/104 (62.9%) | 28/66 (42.4%) | 38/66 (57.6%) | < 0.001 |
| ECOG PS ≥ 2 | 14/85 (16.5%) | 10/14 (71.4%) | 4/14 (28.6%) | < 0.001 |
| IPI H+HI | 31/91 (34.1%) | 14/31 (45.2%) | 17/31 (54.8%) | 0.029 |
| B symptoms | 22/87 (25.3%) | 10/22 (45.5%) | 12/22 (54.5%) | 0.058 |
| Treatment | ||||
| RCHOP | 71/98 (72.4%) | 18/71 (25.4%) | 53/71 (74.6%) | 0.513 |
| RCHOP-like | 22/98 (22.4%) | 8/22 (36.4%) | 14/22 (63.6%) | |
| Others | 5/98 (5.1%) | 2/5 (40%) | 3/5 (60%) | |
| Clinical response | 24/92 (26.1%) | 19/24 (79.2%) | 5/24 (20.8%) | < 0.001 |
| Death event | 54/114 (47.4%) | 38/54 (70.4%) | 16/54 (29.6%) | < 0.001 |
| Pathological features | ||||
| Non-GCB (Hans) | 77/112 (68.8%) | 35/77 (45.5%) | 42/77 (54.5%) | < 0.001 |
| EBER+ | 28/112 (25.0%) | 15/28 (53.6%) | 13/28 (46.4%) | 0.011 |
| MYC rearrangement+ | 9/98 (9.2%) | 2/9 (22.2%) | 7/9 (77.8%) | 1.000 |
| BCL2 rearrangement+ | 6/97 (6.2%) | 1/6 (16.7%) | 5/6 (83.3%) | 0.665 |
| Double-hit DLBCL+ | 3/95 (3.2%) | 1/3 (33.3%) | 2/3 (66.7%) | 1.000 |
| High CD163+TAMs | 79/113 (69.9%) | 33/79 (41.8%) | 46/79 (58.2%) | 0.005 |
| CD5+ | 13/113 (11.5%) | 4/13 (30.8%) | 9/13 (69.2%) | 1.000 |
LDH, lactate dehydrogenase; ECOG PS, Eastern Cooperative Oncology Group performance status (ECOG); IPI, International Prognostic Index for Diffuse Large B-cell Lymphoma (DLBCL); H, high; HI, high-intermediate; Non-GCB, non-germinal center B-cell like by the Hans algorithm; EBER, Epstein–Barr virus–encoded small RNAs (Epstein-Barr Virus (EBV)-positive DLBCL); TAM, tumor-associated macrophages.
Table 3.
Correlation between the entropy and survival groups.
| Overall survival group | Entropy < 7.2 | Entropy > 7.2 | Total |
| DLBCL Dead within the first 2 years | 23/37 (62.2%) | 14/37 (37.8%) | 37 (100%) |
| DLBCL Others | 57/64 (89.1%) | 7/64 (10.9%) | 64 (100%) |
| Total | 80/101 (79.2%) | 21/101 (20.8%) | 101 (100%) |
Fisher’s exact test P = 0.002.
Table 4.
Correlation between entropy and clinicopathological characteristics.
| Entropy < 7.2 | Entropy > 7.2 | P value | |
| Entropy | 6.67 ± 0.38 | 7.33 ± 0.08 | < 0.001 |
| Clinical features | |||
| Age > 60 years | 57/85 (67.1%) | 19/24 (79.2%) | 0.320 |
| Sex male | 44/85 (51.8%) | 13/24 (54.2%) | 1.000 |
| Location | |||
| Nodal (+spleen) | 38/85 (44.7%) | 18/24 (75.0%) | 0.071 |
| Waldeyer’s ring | 9/85 (10.6%) | 1/24 (4.2%) | |
| Gastrointestinal | 11/85 (12.9%) | 2/24 (8.3%) | |
| Other extranodal | 27/85 (31.8%) | 3/24 (12.5%) | |
| High sIL2R | 60/75 (80%) | 15/20 (75%) | 0.758 |
| High LDH | 47/78 (60.3%) | 15/21 (71.4%) | 0.449 |
| ECOG PS ≥ 2 | 6/65 (9.2%) | 5/15 (33.3%) | 0.028 |
| IPI H+HI | 21/69 (30.4%) | 7/17 (41.2%) | 0.402 |
| B symptoms | 17/65 (26.2%) | 5/17 (29.4%) | 0.767 |
| Treatment | |||
| RCHOP | 55/75 (73.3%) | 13/18 (72.2%) | 0.447 |
| RCHOP-like | 17/75 (22.7%) | 3/18 (16.7%) | |
| Others | 3/75 (4.0%) | 2/18 (11.1%) | |
| Clinical response | 17/72 (23.6%) | 7/15 (46.7%) | 0.109 |
| Death event | 36/85 (42.4%) | 15/24 (62.5%) | 0.106 |
| Pathological features | |||
| Non-GCB (Hans) | 56/83 (67.5%) | 18/24 (75.0%) | 0.618 |
| EBER+ | 19/83 (22.9%) | 9/24 (37.5%) | 0.189 |
| MYC rearrangement+ | 4/74 (5.4%) | 1/19 (5.3%) | 1.000 |
| BCL2 rearrangement+ | 3/73 (4.1%) | 0/19 (0%) | 1.000 |
| Double-hit DLBCL+ | 0/71 (0%) | 0/19 (0%) | N/A |
| CD163+TAMs | 36.3% ± 25.7 | 46.9% ± 25.7 | 0.082 |
| PD-L1+cells | 11.8% ± 15.4 | 14.6% ± 18.4 | 0.832 |
| IL-10 | 10.2% ± 12.7 | 7.4% ± 9.3 | 0.519 |
| CD5+ | 10/84 (11.9%) | 3/24 (12.5%) | 1.000 |
LDH, lactate dehydrogenase; ECOG PS, Eastern Cooperative Oncology Group (ECOG) performance status; IPI, International Prognostic Index for Diffuse Large B-cell Lymphoma (DLBCL); H, high; HI, high-intermediate; Non-GCB, non-germinal center B-cell like by the Hans algorithm; EBER, Epstein–Barr virus–encoded small RNAs (Epstein-Barr Virus (EBV)-positive DLBCL); TAM, tumor-associated macrophages.
Table 5.
Correlation between entropy and pathological markers.
| Entropy < 7.2 | Entropy > 7.2 | P value | |
| Ki67 | 15.1% ± 14.9 | 18.9% ± 13.5 | 0.264 |
| LMO2 | 2.7% ± 3.4 | 2.7% ± 4.4 | 0.331 |
| MYC | 4.9% ± 4.8 | 5.7% ± 6.9 | 0.889 |
| MDM2 | 10.9% ± 8.1 | 9.5% ± 6.7 | 0.389 |
| CDK6 | 4.8% ± 5.8 | 5.1% ± 9.4 | 0.133 |
| E2F1 | 1.9% ± 1.9 | 1.1% ± 0.8 | 0.050 |
| BCL2 | 7.0% ± 9.9 | 4.4% ± 6.6 | 0.645 |
| CASP8 | 7.7% ± 9.3 | 3.9% ± 3.9 | 0.156 |
| MYOB | 30.5% ± 167.3 | 2.3% ± 3.1 | 0.793 |
| TP53 | 5.8% ± 9.2 | 3.1% ± 2.0 | 0.831 |
| cPARP | 1.0% ± 1.3 | 0.6% ± 0.7 | 0.035 |
| cCASP3 | 1.4% ± 1.9 | 0.6% ± 0.5 | 0.017 |
| ISY1 | 1.6% ± 2.6 | 2.4% ± 2.5 | 0.133 |
| TNFAIP8 | 39.9% ± 25.1 | 46.7% ± 28.6 | 0.496 |
| CSF1R | 33.6% ± 27.2 | 34.0% ± 29.8 | 0.915 |
| CD163 | 36.3% ± 25.7 | 46.9% ± 25.7 | 0.082 |
| PD-L1 | 11.8% ± 15.4 | 14.6% ± 18.4 | 0.832 |
| IL-10 | 10.2% ± 12.7 | 7.4% ± 9.3 | 0.519 |
Disclaimer/Publisher’s Note: The statements, opinions and data contained in all publications are solely those of the individual author(s) and contributor(s) and not of MDPI and/or the editor(s). MDPI and/or the editor(s) disclaim responsibility for any injury to people or property resulting from any ideas, methods, instructions or products referred to in the content. |
© 2026 by the authors. Licensee MDPI, Basel, Switzerland. This article is an open access article distributed under the terms and conditions of the Creative Commons Attribution (CC BY) license (http://creativecommons.org/licenses/by/4.0/).
Copyright: This open access article is published under a Creative Commons CC BY 4.0 license, which permit the free download, distribution, and reuse, provided that the author and preprint are cited in any reuse.


