Submitted:
08 June 2026
Posted:
09 June 2026
You are already at the latest version
Abstract
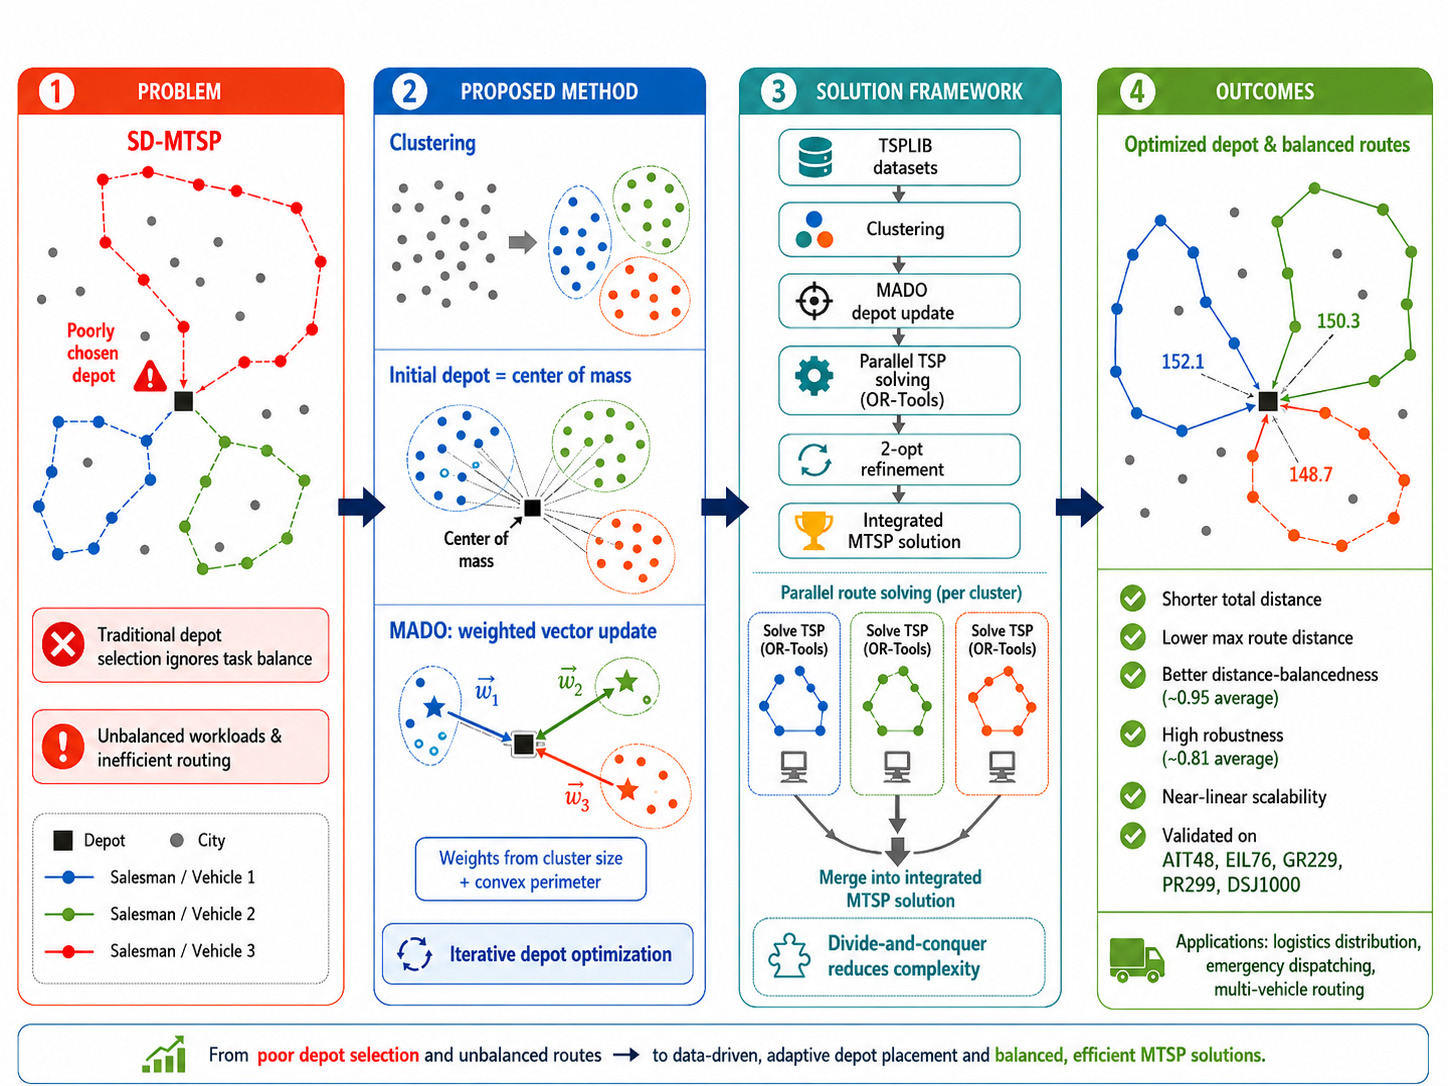
In the single-depot multi-traveling salesman problem, traditional depot location methods often overlook task balance among traveling salesmen, leading to excessive load on certain units and compromising overall operational efficiency. To address this issue, this paper proposes an optimized depot location method based on clustering and multi-task balancing. The core contribution lies in the design of a multi-weight adaptive depot optimization method. This approach clusters city nodes into multiple groups through cluster analysis and dynamically synthesizes direction vectors using information such as the number of samples within each cluster and the convex perimeter. It iteratively optimizes depot locations, minimizing the total path length while enhancing load balance across all traveling salesman routes. Additionally, a “divide-and-conquer” strategy decomposes the complex MTSP into multiple parallel TSP subproblems, which are then efficiently solved using Or-Tools. A comprehensive evaluation framework is introduced, incorporating Total-Sum distance, Min-Max distance, Distance-balancedness, Cluster separability, Robustness, and Running time. Experimental results on the TSPLIB standard dataset demonstrate that the proposed method exhibits significant advantages over various traditional clustering algorithms in both route optimization and route balancing, validating its effectiveness and practicality. The method's robust performance provides a reliable solution for real-world applications such as logistics distribution, further highlighting its practical value.
Keywords:
SD-MTSP
; clustering algorithm
; task balancing
; depot location optimization
MSC: 05B05; 90B50
1. Introduction
With the increasing integration of global supply chains, the scheduling efficiency of large-scale logistics and warehousing systems has become a critical factor influencing operational costs and service quality. The Single Depot Multiple Travelling Salesman Problem (SD-MTSP) model [1,2,3], as a typical combinatorial optimization model, performs distributed task allocation by coordinating multiple operating units from a shared depot node. This model shows significant advantages in reducing the total cost of logistics and distribution and improving the system response time, which provides important support for optimization decisions in related fields. Especially in the market environment of the explosive growth of the e-commerce industry, the model shows its core application value in real-time order processing, emergency logistics deployment, multi-robot inspection, and last-mile delivery scenarios [4].
However, with the continuous expansion of the task scale and the increasing complexity of the dynamic constraints, the traditional solution framework gradually exposes the problems of slow convergence speed and poor stability of the solution quality, which requires the construction of a more efficient collaborative optimization mechanism. This also indicates an important research direction for the innovative design of multi-traveler algorithms [5]. The problems of depot siting and task balancing need to be solved as a priority in SD-MTSP.
In terms of depot location, most existing studies adopt traditional depot-location strategies such as heuristic methods [6,7,8] and midpoint methods [9]. For example, heuristic rules are used to quickly generate candidate depot locations to simplify the computational burden, or to initially locate the depot based on the geometric center of the task area to reduce the path planning complexity. However, such approaches have three main limitations. First, the task balance among travelers is not fully considered. This can lead to significant differences in the number of cities and path lengths that different travelers are responsible for after the actual assignment, which in turn can easily lead to the problem that some operation units are idle while others are overloaded. Second, the optimization of the balancedness usually relies on the initial task division results. If the initial node allocation is unreasonable, the subsequent path optimization is difficult to be effectively adjusted and cannot fundamentally improve the task allocation imbalance. Third, there is a lack of equilibrium optimization mechanisms applicable to large-scale node sets. When the number of nodes reaches several hundred, in order to control the computational overhead, the existing methods tend to simplify or even ignore the equilibrium constraints. This results in a low balanced degree index, which is difficult to meet the operational demand of “relatively balanced workload of each operation unit” in real logistics scenarios.
In order to solve the above problems, this paper faces the following key challenges: firstly, in terms of depot selection, a dual-objective synergistic framework that can optimise path efficiency and task balance at the same time needs to be constructed. Existing methods primarily focus on minimizing the total travel distance, while workload balance among salesmen is often treated as a secondary objective, while the hidden cost of unbalanced loads in the actual logistics operation is often higher than the slight increase of the path length. Therefore, how to reasonably quantify the weights of the two objectives, establish an adaptive adjustment optimization model, and avoid sacrificing load balance by unilaterally pursuing the shortest path is the first challenge to solve the problem of neglected task balance. Second, for the limitation that the optimization of balance depends on the initial task division, the key challenge is to design a dynamic division mechanism with feedback and correction capabilities. Existing methods lack effective adjustment strategies after the initial division is determined, which makes it difficult to solve the load imbalance problem fundamentally in the subsequent optimization. How to construct the division quality evaluation standard and re-division triggering mechanism to ensure the convergence efficiency while achieving the dynamic balance of the task volume is the key challenge to improve the Robustness of the method. Third, for the lack of balanced optimization mechanisms under large-scale node sets, the key challenge is to introduce clustering partitioning strategies to balance efficiency and balance. When the node size is enlarged, traditional methods often simplify the equilibrium constraints to control the computational cost. How to decompose the original problem into sub-problems by clustering techniques and optimise the task allocation within and among the sub-problems collaboratively to achieve overall equilibrium in an acceptable time is a key challenge to drive the method towards large-scale applications.
In view of the complexity of SD-MTSP and the demands of practical application scenarios, existing research is insufficient in load balancing and depot selection, and this paper proposes a clustered multi-task balancing-based depot optimization method for solving MTSP.
The main contributions of this study are summarized as follows:
- This paper proposes a new depot determination method-Multi-weight Adaptive Depot optimization Method (MADO). The selection of the depot is the key to solve SD-MTSP, and this method can identify an improved depot location that enhances both routing efficiency and workload balance, thus significantly improving the quality of SD-MTSP solution.
- This paper not only considers the shortest path problem in the traditional multitraveler problem (MTSP), but also focuses on task balancing, so that the path lengths of each traveler are closer to each other, which makes it more reasonable in practical engineering applications.
- The method proposed in this paper remains efficient in solving large-scale problems by splitting the complex task of MTSP into multiple parallel simple tasks of TSP through a divide-and-conquer strategy. This strategy not only simplifies the problem, but also makes the proposed decomposition strategy substantially reduces the computational burden when handling large-scale instances, which results in excellent performance when dealing with large-scale datasets.
- This paper proposes a more complete evaluation index of the experimental results, and verifies the effectiveness of the method through a large number of comparative experiments, and the proposed method has a good guiding role in the application of engineering practice.
The paper is structured as follows: Section 2 provides a comprehensive review of related work on MTSP algorithms, load-balancing strategies, and depot selection methods. Section 3 provides a formal definition of key notations and a detailed mathematical description of the SD-MTSP problem, elucidating its structure and the constraints that must be satisfied for an optimal solution. Section 4 elaborates on the proposed MADO and outlines the complete clustering-based SD-MTSP solution framework. Section 5 reports experiments conducted on TSPLIB benchmark instances and presents a comprehensive performance evaluation to evaluate performance across multiple metrics and compare diverse clustering algorithms. Finally, Section 6 summarizes the core contributions and proposes potential future research directions.
2. Related Work
In recent years, the research on multi-traveler algorithms has focused on heuristic rules and intelligent optimization. Under the deep reinforcement learning framework, the hierarchical decision-making mechanism based on the Manager-Worker architecture [10,11] is able to provide end-to-end real-time responsiveness to the vehicle path planning problem, which significantly reduces the solution time of large-scale arithmetic cases. Quantum Inspired Genetic Algorithm (QIGA) [12,13,14] builds a different solution space representation and search basis from traditional algorithms by encoding the solution space using quantum superposition states. In combinatorial optimization problem solving scenarios, this algorithm significantly exhibits faster convergence and better global exploration capability compared to traditional genetic algorithms. The Memetic Algorithm [15,16,17,18,19] effectively balances the global exploration and local exploitation capabilities of the algorithm by fusing the population evolution mechanism of the genetic algorithm with the local search strategy. Under the optimization objective of minimising the total travel distance, the solution performance of the algorithm is improved by about 12% over the single heuristic algorithm.
In the study of multi-intelligent body collaborative system [20], the collaborative mechanism based on the Initializer-Critic-Scorer agent group significantly improves the quality of path generation under complex constraints by resolving the topological relationship of the task space through visual reasoning techniques. In addition, the Improved Ant Colony algorithm [21,22,23,24,25] demonstrates high solution Robustness in time-varying road network environments by introducing dynamic pheromone updating strategy and parallel search mechanism. From the existing methods, it can be seen that the current research on multi-traveler algorithms is centered around heuristic rules and intelligent optimization, and various types of algorithms achieve performance breakthroughs through differentiated technical paths. However, the existing research mostly focuses on a single optimization objective, and the synergistic optimization problem of task balance and depot siting has not been sufficiently considered. At the same time, some algorithms have the problem of significant increase in computational complexity when dealing with large-scale datasets, which makes it difficult to fully meet the efficient scheduling requirements of actual logistics scenarios.
Load balancing, as a core indicator of the feasibility and practicability of the solution scheme for the multi-traveler problem, the current mainstream research methods are mainly carried out from a multi-objective optimization perspective. The AHP-mTSP algorithm [26] draws on the hierarchical decision-making process of the Analysis of Hierarchies method, and transforms the task allocation problem into a hierarchical structure through the idea of graph partitioning heuristic. The algorithm achieves an optimization effect of 10% reduction in the maximum agent cost in a 5000-node scale arithmetic case, while effectively reducing the computational elapsed time. The Equity Transformer architecture employs a sequence generation model and combines with fairness context encoding techniques, and with the objective function of minimising the maximum cost, its Pareto frontier quality [27,28] improves compared to the local search algorithm by 15%.
For the load balancing problem in dynamic environments, the Deep Reinforcement Learning-based D4PG algorithm [29,30,31] distinguishes between long and short flow task types and weights the path costs. This technical tool improves the task completion rate in heterogeneous flow environments by 47%, effectively improving the load balancing effect in dynamic scenarios. It is worth noting that the effectiveness of the above load balancing strategy is highly dependent on the fineness of the initial node assignment, which further highlights the key role of the depot point selection technique in solving the multi-traveler problem [32,33]. From the existing methods, it can be seen that the load balancing strategy for the multi-traveler problem shows a trend of evolving from static division to dynamic adaptive, from single cost optimization to incorporating multi-objective synergies such as fairness.
The scientific selection of initial nodes directly affects the path convergence efficiency and load balancing of multi-traveler algorithms. The Rapidly-exploring Random Tree (RRT) method [34,35,36,37] is able to generate candidate node sets with high coverage under incomplete constraint scenarios through random sampling and control inputs, which is especially suitable for dynamic obstacle avoidance scenarios. The multi-attribute key point screening method combines the mission area characteristics with a weighted network model to quantify the node correlation, and then identifies the hub-type depots from the topology of the mission space [38]. The initial node selection method provides an important technical support for constructing a real-time scheduling system adapted to the complex warehouse layout [39]. From the existing methods, it can be seen that although the existing initial node selection techniques can effectively improve the path convergence and equilibrium performance, they still face challenges in terms of computational efficiency and global optimality in ultra-large-scale scenarios.
3. Preliminary Work
3.1. Symbols Definition
This paper involves a large number of formulas and symbols, and the definitions of common symbols are shown in Table 1. Among them, the definitions of core symbols, such as city, cluster, distance, etc., provide the basic support for the subsequent modeling of the SD-MTSP problem, the derivation of the depot optimization methodology, and the computation of the performance indexes.
3.2. Task Description
The Travelling Salesman Problem (TSP), one of the classical combinatorial optimization problems, has the objective of planning a shortest circumnavigation path for a travelling salesman. The path needs to satisfy the following: visit and only visit each city in a given set of cities in turn, and eventually return to the starting city while minimising the total travel distance or cost. MTSP extends the classical TSP by assigning a set of customer nodes to multiple traveling salesmen who jointly complete the routing tasks starting from the same depot (or from different depots), visiting a set of cities, and then returning to the depot, and the objective is to minimise the total travel distance or to equalise the loads of the individual travelling merchants. Common traveler classifications include SD-MTSP, MD-MTSP [40,41], Capacitated MTSP [42,43], MTSP with Time Windows [44] and MTSP with Priority Constraints [45]. Given that SD-MTSP has an extremely wide range of application scenarios and the existing research is not yet comprehensive, this paper proposes new algorithms to address this issue and defines more comprehensive evaluation metrics.
The task of this paper can be described as follows: take the TSPLIB standard dataset as input, given a predefined number of clusters, an algorithm termination threshold, and select multiple clustering algorithms for comparison experiments. Based on the above inputs, the integrated solution framework of “clustering-optimising depot locations-solving TSP paths” is adopted. This framework focuses on solving the two key problems of irrational depot location and unbalanced tasks in SD-MTSP. The output consists of three parts: the coordinates of the depots optimized by MADO method as the common starting and ending points of all travelers; the set of optimal paths corresponding to each traveler, which specifies the order of visiting the cities in each cluster and the closed loops; and the results of the algorithm’s performance evaluation, which include Total-Sum distance, Min-Max distance, Distance-balancedness, Cluster separability, Robustness, and Running time.
4. Methodology
4.1. Definition of Depot Points
Depot, as the common starting and ending point of all travelers in MTSP, represents the core facilities in logistics and distribution, such as distribution centers or logistics depots, and is the reference point for travelers to carry out path planning. The selection of depots is a core technical aspect in SD-MTSP, and its definition and optimization method have a direct impact on the feasibility and efficiency of path planning.
4.2. Multi-Weight Adaptive Depot Optimization Method (MADO)
Existing methods usually take the shortest total path as the main objective, and the existing depot siting methods do not fully consider the task balancing problem. For this reason, this paper proposes a clustering-based MADO. Through mathematical models, constraints and experimental analyzes, this study clarifies the key role of the depot in MTSP and provides theoretical support for the design of the subsequent logistics distribution system. The algorithm partitions the customer nodes into multiple clusters and iteratively optimizes a common depot location with the aid of clustering analysis, and then optimises the location of the depot by using vector synthesis, which ultimately solves the MTSP problem efficiently.
The depot update process is shown in Figure 1, which is divided into 4 steps as follows:
Step 1: Obtain the center of mass Depot1* in the dataset as the theoretical depot point, and find the closest sample point in the dataset to Depot1*, which will be used as the actual depot point Depot1.
Step 2: Obtain multiple clusters by clustering the dataset, and take Depot1 as the starting point. The convex perimeter of the TSP of each cluster and the set of cluster elements are obtained by the TSP solving algorithm.
Step 3: Determine the center point of each cluster, calculate the direction vector pointing to the center point of the cluster with Depot1 as the starting point, and obtain the direction vectors of three clusters, V1, V2 and V3, respectively, and carry out the weighted summation of the three direction vectors to obtain the state transfer quantity of the depot, refer to Equation 1:
In which, N is the total number of sample points, N(Ci) is the number of sample points in the ith cluster, L is the total convex perimeter of all clusters, and Li is the convex perimeter of the ith cluster.
Based on the last depot point location Last depot and the state transfer amount V , the updated depot point location Updated depot can be calculated, refer to Equation 2:
Step 4: Cluster the dataset again to get the theoretical Depot2* by Equation 2, and choose the closest sample point to the location as Depot2. using Depot2 as the starting point, solve the clusters to get the corresponding optimal path of TSP. If the following conditions are met:
then the algorithm ends; otherwise repeat Step 2 to Step 4.
4.3. SD-MTSP Solution Framework
In this paper, the clustering algorithm is used as the core tool of the partitioning strategy to decompose the large-scale MTSP problem into multiple parallel TSP subproblems. The clustering algorithm divides the city nodes into a number of clusters, each of which is headed by a travel agent, thus reducing the complexity of the original problem from O(n!) to O(k·m!),where k is the number of clusters and m is the number of nodes within a cluster. This “divide and conquer” strategy significantly improves the computational efficiency of the algorithm on large-scale datasets.
The algorithm flow for solving SD-MTSP in this paper is shown in Figure 2, which is divided into 7 steps as follows:
Step 1: Load the TSPLIB dataset, which contains instance data of TSP and related problems.
Step 2: Calculate the center of mass of all sample points in the dataset as the initial Depot.
Step 3: Use the clustering algorithm to cluster all sample points, divide them into a number of clusters, and assign the Depot to each cluster respectively.
Step 4: Using the TSP algorithm in the Or-Tools tool, solution routes are generated for each cluster using the OR-Tools routing solver, the optimal paths of each cluster are obtained, and the resulting solutions are further optimised using the 2-opt algorithm to obtain the final solution for each cluster.
Step 5: The MADO algorithm is used to update the Depot, and the updated Depot* is obtained.
Step 6: Take the Depot* obtained from Step 5, replace the original Depot in each cluster, and re-solve the optimal path for each cluster using the Or-Tools tool. If the experimental results do not reach the set threshold, go to Step 5 to continue the execution.
Step 7: Integrate the TSP results of each cluster to obtain the MTSP solution, and measure the experimental results based on the performance evaluation metrics in Section 5 (Experiments and Results), and finally output the results.
The pseudocode for the algorithm of the depot optimization SD-MTSP solution based on cluster-based multi-task balancing is shown in Algorithm 1:
| Algorithm1: SD-MTSP Main Solver |
|
Input: Dataset D = {x1,x2,...,xn}, Number of clusters k Output: Optimized routes R = {R1,R2 ...,Rk}, Total distance d 1 Load dataset D and initialize parameters 2 for each clustering algorithm in [K-means, BIRCH, FMC, ···] do 3 Apply clustering method to get clusters C = {C1,C2,...,Ck} 4 Calculate initial depot points P = {p1,p2,...,pk} 5 for each cluster Ci do 6 Solve TSP for cluster Ci with depot pi 7 Record initial route Ri and distance di 8 end for 9 Apply MADO to improve depot positions 10 for each optimized cluster Ci do 11 Resolve TSP with optimized depot p′i 12 Record optimized route Ri′ and distance d′i 13 end for 14 Calculate evaluation metrics and save results 15 end for 16 return Best solution with DMin _Sum and DMin_Max |
The specific meanings of thAlgorithm1 pseudo-code (SD-MTSP Main Solver) are as follows:
Step 1: Load the TSPLIB dataset, initialise the list of clustering algorithms, the number of clusters, the algorithm termination thresholds and other parameters, to provide basic data and parameter constraints for the subsequent clustering and path solving.
Step 2: Select the clustering algorithms in the list sequentially to ensure that the effects of different clustering algorithms on the SD-MTSP solving results can be compared in the future, so as to filter out the optimal clustering strategy.
Step 3-8: For each cluster output by the current clustering algorithm, take the initial depot as the starting point, call Or-Tools to solve the initial TSP path of each cluster, and record the path length and access order. This stage completes the initial cycle of “clustering-path solving”, and obtains the benchmark performance data before algorithm optimization.
Step 9-15: Firstly, update the location of the depot by MADO algorithm to get the coordinates of the new depot; then take the new depot as the starting point, re-solve the TSP optimised paths of each cluster, and record the updated path information; finally, calculate the evaluation indexes such as Total Distance, Distance-balancedness, etc. and save the results. In this stage, through the iterative process of “depot update - path recalculation”, the path optimization effect and task balance are gradually improved.
Step 16: Compare the performance indexes of all clustering algorithms, and output the optimal MTSP solution, including the optimal depot coordinates, paths of each traveler and key performance indexes, to provide decision-making basis for practical application.
5. Experiments and Results
5.1. Datasets
TSPLIB (Traveling Salesman Problem Library) is a classic TSP dataset library widely used for research and testing of optimization algorithms. In this experiment, five standard datasets in TSPLIB (att48, eil76, gr229, pr299, dsj1000) are selected to comprehensively analyze the performance of various clustering algorithms in multi-traveler problems. By statistically analysing Total-Sum distance, Min-Max distance, Distance-balancedness, Cluster separability, Robustness, and Running time metrics, we evaluate Agglomerative, Birch, Bisectingk-means, FuzzyCMeans, GaussianMixture, k-means, MiniBatchk-means, and Spectral of eight clustering algorithms. The experimental results show that different algorithms exhibit different patterns under different datasets and evaluation indexes, which provides an important reference for algorithm selection in practical applications.
5.2. Performance Evaluation Metrics
In MTSP, performance evaluation metrics are used to quantify the performance of different solution methods in terms of path planning, task allocation and optimization effect. With reasonable metrics, the strengths and weaknesses of algorithms can be comprehensively evaluated and provide a strong basis for algorithm improvement. In this paper, the following key performance evaluation metrics are defined:
5.2.1. TSP Distance
In SD-MTSP, all travelers start from the same depot and return after serving sample points within different sub-clusters (i.e., the set of cities visited by a particular traveler) respectively. The paths of each sub-cluster must satisfy the classical TSP constraint of starting from the depot, visiting all sample points once and returning to the starting point, forming a closed loop. The distance formula for the kth path is defined as follows:
5.2.2. MTSP Distance
Min-Max distance: minimises the length of the longest single path among all travelers, smaller values indicate better optimization, the formula is defined as follows:
Total-Sum distance: the sum of the path lengths of all travelers, the smaller the value means the better the optimization, the formula is defined as follows:
5.2.3. Distance-Balancedness
The path length of each TSP is as close as possible to represent the degree of equalization of each traveler’s task in practical applications, the larger the value the better the result, and the formula is defined as follows:
Where,
5.2.4. Cluster Separability
Each traveler’s path should be as independent as possible to avoid crossings, Cluster separability references the profile coefficients in the clustering to evaluate the independence of the traveler’s path, the larger the value the better the effect, the formula is defined as follows:
Where,
In the above formula, a(k) denotes the average distance between a sample and other samples in its cluster, and b(k) denotes the minimum distance between a sample and other samples in the cluster.
5.2.5. Robustness
For the same data set, in the same experimental environment using the same solution method, the experimental results may still be different; however, in practical applications, we expect that the results of each experiment have the same consistency, Robustness is used to measure the stability of the experimental results of the index, the larger the value indicates that the greater the stability of the formula is defined as follows:
Where,
5.2.6. Running Time
The total elapsed time of algorithm execution refers to the time required from the start of execution to the output of the complete path planning solution, covering the absolute time of the whole process of problem initialisation, optimization computation, and result generation, etc., and the formula is defined as follows:
5.3. Comparison of Individual Performance Indicators
In order to verify the effectiveness of the integrated method of “Clustering + MADO Depot optimization” proposed in this paper in solving SD-MTSP, this experiment is based on the six core metrics defined in Section 5.2, namely, Total-Sum distance, Min-Max distance, Distance- balancedness, Cluster separability, Robustness and Running time. The experiments are conducted to verify the path optimization effect, task-balancedness and comprehensive performance of the algorithm in the three core dimensions, respectively, to verify the efficiency of the path planning through Total-Sum distance and Min-Max distance, the fairness of the task allocation through Distance-balancedness, the reasonableness of the clustering strategy through Cluster separability, and the effectiveness of the algorithm in the repetitions through Robustness. Robustness verifies the stability of the algorithm in repeated experiments. Ultimately, the advantages of the integrated method are comprehensively dismantled from the level of a single index, which lays the foundation for the subsequent comprehensive performance evaluation.
Table 2 shows that BIRCH achieves the smallest total-sum distance on att48, Fuzzy C-Means performs best on gr229, and Bisecting K-Means obtains the best results on eil76, pr299, and dsj1000. These results indicate that the effectiveness of a clustering strategy depends on the characteristics of the underlying dataset. Nevertheless, Bisecting K-Means demonstrates competitive performance on several medium- and large-scale instances, whereas Bisecting K-Means is particularly competitive on larger datasets.
Second, when measuring load balancing, the Min-Max distance value implies a more balanced workload across travelers. The experimental results of Table 3 show that the Agglomerative clustering algorithm exhibits optimal load balancing on the datasets gr229 and pr299. This is due to its bottom-up clustering strategy, which allocates task clusters more evenly and thus effectively alleviates the load imbalance problem.
Thirdly, Distance-balancedness is used to evaluate the balanced degree of path allocation, the higher the value, the more reasonable the load allocation. According to the experimental results in Figure 3, it can be found that the average value of Distancebalancedness of all clustering algorithms on different datasets is as high as 0.95, which indicates that the method proposed in this paper achieves a better trade-off between the dual objectives of “short paths + good balancedness”.
Fourthly, Cluster separability is an important indicator for assessing the quality of clustering, and its value ranges from -1 to 1. The higher the value, the better the clustering effect. According to the experimental results in Figure 4, the Cluster separability of the same clustering algorithm on different datasets varies greatly, which is mainly due to the large difference in the distribution of different datasets themselves. Among them, the Cluster separability on the dsj1000 dataset is the largest, because its distribution pattern presents an obvious cluster distribution structure.
Fifthly, Robustness is used to measure the stability of the algorithm, the higher the value, the more adaptable the algorithm is to the data changes. According to the experimental results of Figure 5, it can be found that the average value of Robustness is as high as 0.81 on all datasets, which indicates that the algorithm proposed in this paper has high stability and is well tolerant to outliers and noise in the data.
Finally, running time reflects the computational efficiency, the smaller the value means the faster the algorithm runs. According to the experimental results in Figure 6, the larger the number of sample points in the data set, the longer the execution time of the algorithm; at the same time, the execution time is also affected by the size of the distance between the data sample points, the larger the value of the calculation time is longer, such as the data set att48; from the relationship between the number of sample points and the execution time of the algorithm, the overall show a linear relationship, indicating that the algorithm proposed in this paper has a low time complexity.
5.4. Comparison of Comprehensive Performance Indicators
A single performance indicator can only reflect the performance of an algorithm in a certain dimension, in order to comprehensively assess the applicability of this paper’s method, this experiment adopts two visualisation methods, radar chart and heat map, and integrates six indicators, namely Total-Sum distance, Min-Max distance, Distancebalancedness, Cluster separability, Robustness and Running time to analyze the comprehensive performance of different clustering algorithms on different datasets.The radar graph compares the performance of different algorithms through six dimensions, Total-Sum distance, Min-Max distance, Distance-balancedness, Cluster separability, Robustness and Running time, where different colours represent the performance of different algorithms. The larger the area of the polygon, the better the comprehensive performance of the algorithm; the more regular the shape of the polygon, the more balanced the algorithm’s performance in each dimension. From the experimental results in Figure 7, it can be found that the K-Means algorithm has the largest polygon area, which indicates that it has the best overall performance in terms of “clustering quality, balance, and stability”, and it is suitable for most of the static, medium and small-scale MTSP scenarios; the Agglomerative algorithm has the largest polygon area. The radargram of Agglomerative algorithm has outstanding distance-balancedness, but low cluster separability and long and narrow shape, which reflects its characteristic of “good balancedness but average clustering quality”, and it is suitable for the scenarios with very high requirements on load balancing and high demands on clustering. The GMM algorithm has a leading performance in Robustness, but is weaker in Distance-balancedness, and the polygon extends obviously in the direction of Robustness, which is suitable for the scenarios where data fluctuates frequently, but there is no need for extreme balancing; Spectral algorithm’s radar graph has lower values in each dimension, and its shape is irregular, which is a good overall performance. and irregular shape, the worst comprehensive performance, only applicable to small scale, low noise, high requirements for clustering structure of the special scenarios.
The heat map shows the average ranking of the algorithms on all evaluation metrics (1 is optimal), where a greener colour means a higher ranking. The continuous green area indicates that the algorithms have stable and excellent performance. From the experimental results in Figure 8, it can be found that on some small-scale datasets, the K-means clustering algorithm ranks high and performs optimally on the total distance metrics due to its simplicity, efficiency and wide applicability. When dealing with largescale datasets, the Bisecting K-means algorithm shows more significant advantages than the traditional K-means algorithm in optimising the Total-Sum distance metric, so it is the better choice for this metric. The Agglomerative algorithm, as a hierarchical clustering method, performs optimally on multiple datasets when the maximum distance is used as the distance between clusters metric. , performs optimally on multiple datasets and has good load balancing. In terms of Overall Rank, some of the density-based clustering algorithms show more green colours for the corresponding cells in the overall rankings, indicating better overall performance. However, no algorithms have absolute advantages in all datasets and metrics, and the performance of algorithms is closely related to the characteristics of datasets and evaluation metrics.
5.5. Case Study
Taking the pr299 dataset and the k-means clustering algorithm as an example, for the algorithms proposed in Chapters 3 and 4, see Figure 9 to 14 for a visual presentation of the solution process and results.
Figure 9 presents the visualization of the original data distribution of pr299, with the sample points distributed in the interval from [2000,1500] to [9000,4000]. Figure 10 demonstrates the process of determining the initial depot, where the sample points are averaged to obtain the theoretical depot location, which is then replaced by the sample point closest to the dataset. Figure 11 shows the clustering results of pr299 under the k-means algorithm, which is divided into three clusters, with the centroids of the clusters marked by fork numbers. Figure 12 illustrates the TSP route planning for pr299, where the route planning is performed for each cluster starting from the depot using the TSP method. Figure 13 shows the depot optimization process for pr299, where the depot is optimized using the MADO method, and the shift from the original depot to the new depot is indicated. Figure 14 presents the TSP route planning again for pr299, with the route planning carried out for each cluster starting from the newly optimized depot, resulting in the final outcomes shown in Table 4.
Table 4 indicates that the optimized depot reduces the total-sum distance from 55,145.51 to 54,533.97 and the min-max distance from 21,130.08 to 20,624.04. In addition, the distance-balance index increases from 0.98 to 0.99, and robustness increases from 0.88 to 0.90. Although cluster separability decreases slightly from 0.24 to 0.21 and running time increases from 7.71 s to 7.87 s, the optimized depot yields an overall improvement in route efficiency and workload balance for the pr299 instance.
6. Conclusions
This paper focuses on the difficulties in solving SD-MTSP, and from the actual engineering requirements, the optimization method of the depot based on clustering multi-task equilibrium is proposed in a targeted way. Firstly, for the problem that depot selection in traditional MTSP research does not fully consider task balancing, this paper proposes the MADO method. The method combines clustering analysis and vector synthesis techniques to dynamically optimise the depot locations, making the path lengths of each traveler more balanced, thus effectively achieving a balanced task allocation; second, based on the idea of divide-and-conquer, this paper decomposes the large-scale MTSP problem into multiple parallel TSP sub-tasks, which are solved by using the Or-Tools tool and introduces the 2-opt local optimization algorithm, which Experimental results on five TSPLIB benchmark instances indicate that the proposed method improves route efficiency and workload balance under the tested SD-MTSP settings; finally, the effectiveness of the method is verified by comparison experiments on TSPLIB standard datasets - in terms of total distance, maximum path length, Distance-balancedness, Cluster separability and other core metrics are excellent. In particular, the efficiency and stability of path planning are significantly improved after the optimization of the depot, while taking into account the Robustness of the algorithm and the feasibility of the actual implementation. The overall research not only solves the key technical problem of “how to select a good depot” in SD-MTSP, but also provides a practical solution for logistics and distribution, emergency dispatching and other practical scenarios through multi-objective cooperative optimization.
Although the approach in this paper has been validated on small-, medium- and some large-scale datasets, it still needs to be further optimised and improved when facing more complex dynamic environments, such as real-time traffic changes, dynamic increase and decrease of task points, or heterogeneous traveler scenarios. In the future, three aspects can be explored: first, combining reinforcement learning or online optimization algorithms to improve the model’s real-time responsiveness to dynamic tasks; second, exploring the extension of the model for multiple types of travelers (e.g., vehicles with capacity constraints) to enhance the algorithm’s suitability for actual business scenarios; and third, optimizing the synergistic mechanism of clustering and path planning to further improve the accuracy of depot selection and the reasonableness of task allocation. Third, optimise the cooperative mechanism between clustering and path planning to further improve the accuracy of warehouse selection and rationality of task allocation. It is expected that through continuous improvement, the MTSP solving method will move from “theoretically feasible” to “engineering reliable”, and then realise deeper application on the ground.
Declaration of generative AI and AI-assisted technologies in the writing process: During the preparation of this work the authors used chatgpt to assist with grammar improvement and language refinement. After using this tool/service, the authors reviewed and edited the content as needed and take full responsibility for the content of the publication.
References
- Cheikhrouhou, O.; Khoufi, I. A comprehensive survey on the Multiple Traveling Salesman Problem: Applications, approaches and taxonomy[J]. Comput. Sci. Rev. 2021, 40, 100369. [Google Scholar] [CrossRef]
- Nugraha, Y. D. W.; Armanto, H.; Kristian, Y. Single objective Mayfly Algorithm with balancing parameter for Multiple Traveling Salesman Problem[J]. J. Electron. Electromed. Eng. Med. Inform. 2023, 5(3), 193–204. [Google Scholar] [CrossRef]
- Ou, B.; Guan, Q.; Zhu, Z.; et al. A Hierarchical Divide-and-Conquer Neural Approach for Multiple Traveling Salesman Problems[J]. Networks 2026. [Google Scholar] [CrossRef]
- Dong, Y.; Li, P.; Guo, X.; et al. Towards Effective Forest Fire Response: A Cloud–Edge Collaborative UAV Deployment Strategy for Rapid Situational Awareness[J]. Fire 2026, 9(4), 160. [Google Scholar] [CrossRef]
- Zhang, K.; Gao, C. Improved formulations of the joint order batching and picker routing problem[J]. Int. J. Prod. Res. 2023, 61(21), 7386–7409. [Google Scholar] [CrossRef]
- Anita, V.; Igor, G. Determining optimal order picking route in warehouses[J]. In Mechanical Engineering–Scientific Journal; 2024, 42(1): 15-26; Anita, V., Igor, G., Eds.; 2024; Volume 42, 1, pp. 15–26. [Google Scholar]
- Hüsrevoğlu, M.; Janowski, A.; Karkınlı, A. E. Optimizing vehicle placement in the residual spaces of unmarked parking areas: a comparative study of heuristic methods[J]. Appl. Sci. 2025, 15(12). [Google Scholar] [CrossRef]
- Zhang, H.; Li, L.; Demeulemeester, E.; et al. Heuristic methods for dynamic multiproject scheduling problems with stochastic transfer times[J]. J. Constr. Eng. Manag. 2025, 151(2), 1–15. [Google Scholar] [CrossRef]
- Zhang, R.; Zhang, C.; Cao, Z.; et al. Learning to solve multiple-TSP with time window and rejections via deep reinforcement learning[J]. IEEE Trans. Intell. Transp. Syst. 2022, 24(1), 1325–1336. [Google Scholar] [CrossRef]
- Hakemi, S.; Houshmand, M.; Hosseini, S. A.; et al. A modified quantum-inspired genetic algorithm using lengthening chromosome size and an adaptive look-up table to avoid local optima[J]. Axioms 2023, 12(10), 978. [Google Scholar] [CrossRef]
- Hudson, S.; Larson, J.; Navarro, J.; et al. Portable, heterogeneous ensemble workflows at scale using libEnsemble[J]. Int. J. High Perform. Comput. Appl. 2025, 39(1), 177–192. [Google Scholar] [CrossRef]
- Ma, X.; Yin, J.; Zhu, A.; et al. Enhanced multifactorial evolutionary algorithm with meme helper-tasks[J]. IEEE Trans. Cybern. 2021, 52(8), 7837–7851. [Google Scholar] [CrossRef]
- Hussain, M.; Wei, L.; Rehman, A.; et al. Cost-aware quantum-inspired genetic algorithm for workflow scheduling in hybrid clouds[J]. J. Parallel Distrib. Comput. 2024, 191(Sep.), 104920.1–104920.15. [Google Scholar] [CrossRef]
- Wang, X.; Ni, B.; Wang, L. A Modified Quantum-Inspired Genetic Algorithm for Continuum Structural Topology Optimization[J]. Int. J. Comput. Methods 2023, 20(3). [Google Scholar] [CrossRef]
- Chen, X.; Jia, Y.; Liao, X.; et al. A fuzzy grouping-based memetic algorithm for multi-depot multi-UAV power pole inspection[J]. Appl. Soft Comput. 2025, 168. [Google Scholar] [CrossRef]
- Kong, X.; Zou, G.; Qi, H.; et al. Niche-based Memetic algorithm with adaptive parameters for optimizing order delivery strategies in O2O platforms. Appl. Intell. Int. J. Artif. Intell. [J] Neural Netw. Complex Probl.-Solving Technol. 2025, 55(2), 1–19. [Google Scholar] [CrossRef]
- Freud, D.; Elalouf, A. A Memetic Algorithm Approach for the Job-Shop Scheduling Problem with Variable Machine Efficiency and Maintenance Activities[J]. Appl. Sci. 2025, 15(3). [Google Scholar] [CrossRef]
- Wang, W.; Qian, L.; Zhou, Y. Optimization of Orthogonal Waveform Using Memetic Algorithm with Iterative Greedy Code Search[J]. Remote Sens. 2025, 17(5). [Google Scholar] [CrossRef]
- Tang, J.; Li, Y. A hybrid dynamic memetic algorithm for the influence maximization problem in social networks[J]. Int. J. Mod. Phys. 2025, 36(3). [Google Scholar] [CrossRef]
- Wang, Z.; Liu, S.; Xu, W.; et al. Symmetric Collaborative Fault-Tolerant Control of Multi-Intelligence under Long-Range Transmission in Air–Ground Integrated Wireless High-Mobility Self-Organizing Networks[J]. Symmetry 2024, 16(5). [Google Scholar] [CrossRef]
- Gao, X.; Zhang, Y. Advancing remote consultation through the integration of blockchain and ant colony algorithm[J]. Math. Biosci. Eng. 2023, 20(9), 16886–16912. [Google Scholar] [CrossRef]
- Jiao, Y.; Wang, Y.; Deng, X.; et al. Improved ant colony algorithm for the mixed-model parallel two-sided assembly lines balancing problem[J]. Eng. Optim. 2024, 56(11), 1784–1798. [Google Scholar] [CrossRef]
- Ma, X.; Liu, C. Improved Ant Colony Algorithm for the Split Delivery Vehicle Routing Problem[J]. Appl. Sci. 2024, 14(12). [Google Scholar] [CrossRef]
- Qi, Z. Application of Improved Ant Colony Algorithm in Optimizing the Charging Path of Electric Vehicles[J]. World Electr. Veh. J. 2024, 15(6). [Google Scholar] [CrossRef]
- Cui, M.; He, M.; Chen, H.; et al. Path planning for mobile robot based on improved ant colony Q-learning algorithm[J]. Int. J. Interact. Des. Manuf. 2025, 19(4), 3069–3087. [Google Scholar] [CrossRef]
- Trigui, S.; Cheikhrouhou, O.; Koubaa, A.; et al. An analytical hierarchy process-based approach to solve the multi-objective multiple traveling salesman problem[J]. Intell. Serv. Robot. 2018, 11(4), 355–369. [Google Scholar] [CrossRef]
- Panwar, K. Comparative analysis of enhanced metaheuristics for the colored traveling salesman problem[J]. Evol. Intell. 2026, 19(1), 30. [Google Scholar] [CrossRef]
- Gao, Z.; Liu, S.; Qian, S.; et al. A Resource Composition Optimization Algorithm Based on Improved Polar Bear Optimization Algorithm for Manufacturing Wallboard for Coating Machine[J]. Coatings 2025, 15(4). [Google Scholar] [CrossRef]
- Cao, J.; Chen, J.; Farghadani, S.; et al. Gamma and vega hedging using deep distributional reinforcement learning[J]. Front. Artif. Intell. 2023, 6, 1129370. [Google Scholar] [CrossRef]
- Mali, S.; Zeng, F.; Adhikari, D.; et al. Federated Reinforcement Learning-Based Dynamic Resource Allocation and Task Scheduling in Edge for IoT Applications[J]. Sensors 2025, 25(7). [Google Scholar] [CrossRef]
- Abdulqadder, I. H.; Aziz, I. T.; Zou, D. DT-Block: Adaptive vertical federated reinforcement learning scheme for secure and efficient communication in 6G[J]. Comput. Netw. 2024, 254, 110841. [Google Scholar] [CrossRef]
- Bektaş, T. Formulations and Benders decomposition algorithms for multidepot salesmen problems with load balancing[J]. Eur. J. Oper. Res. 2012, 216(1), 83–93. [Google Scholar] [CrossRef]
- Ghadiry, W.; Habibi, J.; Aghdam, A. G.; et al. Non-prespecified Starting Depot Formulations for Minimum-Distance Trajectory Optimization in Patrolling Problem[J]. J. Intell. Robot. Syst. Theory Appl. 2017, 87(3), 699–710. [Google Scholar] [CrossRef]
- Karaman, S.; Frazzoli, E. Sampling-based algorithms for optimal motion planning[J]. Int. J. Robot. Res. 2011, 30(7), 846–894. [Google Scholar] [CrossRef]
- Nasir, J.; Islam, F.; Malik, U.; et al. RRT*-SMART: A rapid convergence implementation of RRT[J]. Int. J. Adv. Robot. Syst. 2013, 10(7), 299. [Google Scholar] [CrossRef] [PubMed]
- Zhang, Z.; Liu, Y.; Bo, L.; et al. Optimized path planning for underground coal mine filling: a greedy adaptive directional bidirectional rapidly-exploring random tree[J]. Meas. Sci. Technol. 2025, 36(2), 1–16. [Google Scholar] [CrossRef]
- Tang, Y.; Xiao, W.; Tan, Z.; et al. An adaptive environment informed rapidly-exploring random tree for citrus picking manipulator path planning[J]. Int. J. Bio-Inspir. Comput. 2025, 25(2). [Google Scholar] [CrossRef]
- Burger, M.; Su, Z.; De Schutter, B. A node current-based 2-index formulation for the fixed-destination multi-depot travelling salesman problem[J]. Eur. J. Oper. Res. 2018, 265(2), 463–477. [Google Scholar] [CrossRef]
- Tong, S.; Qu, H.; Xue, J. K-DSA for the multiple traveling salesman problem[J]. J. Syst. Eng. Electron. 2023, 34(6), 1614–1625. [Google Scholar] [CrossRef]
- Zhao, C. S.; Wong, L. P.; Fung, C. Solving multi-depot closed-path multiple traveling salesman problem using k-means++ hierarchical clustering and neural combinatorial networks[J]. Scientific Reports, 2026. [Google Scholar]
- Xu, W.; Wang, Y.; Du, S.; et al. Energy-Balanced Task Allocation and Dynamic Rescheduling for Multi-Robot Systems in Complex Environments[J]. Appl. Sci. 2026, 16(9), 4311. [Google Scholar] [CrossRef]
- Wang, M.; Ma, T.; Li, G.; et al. Ant colony optimization with an improved pheromone model for solving MTSP with capacity and time window constraint[J]. IEEE Access 2020, 8, 106872–106879. [Google Scholar] [CrossRef]
- Bertazzi, L.; Golden, B.; Wang, X. Min-max vs. min-sum vehicle routing: A worst-case analysis[J]. Oper. Res. Manag. Sci. 2016, 56(3), 243–244. [Google Scholar] [CrossRef]
- Mahmoodjanloo, M.; Chen, G.; Asian, S.; et al. In-port multi-ship routing and scheduling problem with draft limits[J]. Marit. Policy Manag. 2021, 48(7), 966–987. [Google Scholar] [CrossRef]
- Tjandra, S.; Setiawan, F.; Salsabila, H. Application of Genetic Algorithms to Solve MTSP Problems with Priority (Case Study at the Jakarta Street Lighting Service)[J]. J. Optimasi Sist. Ind. 2022, 21(2), 75–86. [Google Scholar] [CrossRef]
Figure 1.
Depot update process.

Figure 2.
SD-MTSP solution process.

Figure 3.
Distance-balancedness comparison on different datasets.

Figure 4.
Cluster separability comparison.

Figure 5.
Robustness comparison.

Figure 6.
Running time comparison.

Figure 7.
Performance radar charts.

Figure 8.
Algorithm performance ranking heatmap.

Figure 9.
Distribution of pr299 data.

Figure 10.
Selection of the initial depot.

Figure 11.
Clustering of sample points.

Figure 12.
Solving for TSP route.

Figure 13.
MADO-based updates to the depot.

Figure 14.
Updates to the TSP route.


Table 1.
Definitions of the principal symbols used in the proposed model.
| Symbol | Description |
|---|---|
| ith city | |
| total number of cities | |
| number of cities in the kth cluster | |
| kth cluster | |
| Distance from city i to city j | |
| Total distance in the kth cluster | |
| Total distance in the kth cluster in the tth (total of T) experiment | |
| Minimising the longest traveler distance | |
| Minimising the longest traveler distance in the tth experiment | |
| Sum of all distances | |
| Minimising the sum of all distances in the tth experiment | |
| Timestamp when the algorithm starts | |
| Timestamp when the algorithm ends | |
| Absolute time for the algorithm to run |
Table 2.
Total-Sum distance comparison.
| Clustering algorithms | att48 | dsj1000 | eil76 | gr229 | pr299 |
| Agglomerative | 43,239.99 | 21,170,961.87 | 589.98 | 1,921.22 | 56,066.07 |
| Birch | 41,226.85 | 20,607,172.83 | 605.98 | 1,952.61 | 55,736.36 |
| Bisectingk-means | 43,335.72 | 20,512,000.79 | 578.87 | 2,287.60 | 50,757.05 |
| FuzzyCMeans | 43,698.28 | 20,552,252.42 | 591.32 | 1,848.42 | 54,578.75 |
| GaussianMixture | 47,139.19 | 20,717,376.57 | 603.48 | 1,935.22 | 56,866.92 |
| k-means | 43,506.73 | 20,560,675.90 | 597.37 | 1,947.86 | 53,848.32 |
| MiniBatchk-means | 43,373.67 | 20,546,934.88 | 595.36 | 1,919.66 | 54,208.73 |
| Spectral | 47,178.16 | 20,656,699.57 | 594.58 | 2,001.05 | 54,817.12 |
Table 3.
Min-Max distance comparison.
| Clustering algorithms | att48 | dsj1000 | eil76 | gr229 | pr299 |
| Agglomerative | 14,850.07 | 9,703,281.56 | 242.67 | 802.58 | 19,416.89 |
| Birch | 14,850.07 | 7,569,487.53 | 203.95 | 884.61 | 22,596.68 |
| Bisectingk-means | 15,990.42 | 7,549,732.68 | 266.04 | 1,257.55 | 23,302.69 |
| FuzzyCMeans | 14,850.07 | 7,589,984.31 | 215.98 | 925.08 | 19,907.94 |
| GaussianMixture | 13,251.51 | 7,736,031.68 | 227.55 | 939.61 | 21,261.94 |
| k-means | 14,850.07 | 7,598,407.79 | 221.17 | 889.46 | 20,624.05 |
| MiniBatchk-means | 14,553.58 | 7,584,668.78 | 213.36 | 861.26 | 22,038.24 |
| Spectral | 13,892.02 | 7,756,327.06 | 214.77 | 1,129.97 | 20,781.52 |
Table 4.
Comparison of results before and after depot optimization.
| Depot | Total-Sum distance | Min-Max Distance |
Distance balancedness |
Cluster separability |
Robustness | Running time |
| Initial Depot |
55,145.51 | 21,130.08 | 0.98 | 0.24 | 0.88 | 7.71 |
| Optimized Depot | 54,533.97 | 20,624.04 | 0.99 | 0.21 | 0.90 | 7.87 |
Disclaimer/Publisher’s Note: The statements, opinions and data contained in all publications are solely those of the individual author(s) and contributor(s) and not of MDPI and/or the editor(s). MDPI and/or the editor(s) disclaim responsibility for any injury to people or property resulting from any ideas, methods, instructions or products referred to in the content. |
© 2026 by the authors. Licensee MDPI, Basel, Switzerland. This article is an open access article distributed under the terms and conditions of the Creative Commons Attribution (CC BY) license (http://creativecommons.org/licenses/by/4.0/).
Copyright: This open access article is published under a Creative Commons CC BY 4.0 license, which permit the free download, distribution, and reuse, provided that the author and preprint are cited in any reuse.


