

Submitted:
06 June 2026
Posted:
09 June 2026
You are already at the latest version
Abstract
Semaglutide and tirzepatide are typically evaluated through dose escalation, yet many patients in routine care do not reach a recommended maintenance dose due to tolerability, access, cost, supply or individualized goals. Here we used sustained 0.25 mg-only semaglutide and sustained 2.5 mg-only tirzepatide exposures as real-world proxies for “microdosing” and analyzed de-identified electronic health records from a federated system of 29 million patients. Among 490,072 semaglutide-treated patients, 814 met stringent sustained low-dose criteria including at least 3 distinct 0.25 mg prescriptions with at least 6 months between the first and last qualifying prescriptions. In a matched head-to-head comparison aided by AI-enabled curation of clinical notes, sustained low-dose tirzepatide showed a worse 24-month adverse event profile (p<0.05) than sustained low-dose semaglutide, including constipation (32.6% vs 22.4%), acute kidney injury (2.7% vs 0.4%), muscle cramps (8.3% vs 4%), lumbar disc disease (3.3% vs 0.3%), dyspnea on exertion (9.6% vs 6.8%), lentigo (4.7% vs 0.8%) and actinic keratosis (3.3% vs 0.6%). Only a minority of profiled adverse events had higher incidence rates with sustained low-dose semaglutide, including otitis (2.1% vs 5.6%), diaphoresis (3.2% vs 5.5%) and ankle swelling (3.7% vs 6.9%). Sustained low-dose tirzepatide was also associated with greater weight loss, while both low-dose agents produced comparable effectiveness across incident disease outcomes. Analyses of medications associated with incident diseases provided further evidence supporting the findings from clinical notes. Renal-supportive and hyperkalemia therapies increased after low-dose tirzepatide (5.6% to 9.5% at 12 months, p=0.016) but not after low-dose semaglutide (8.2% to 6.6%, p=0.382), and wakefulness/stimulant therapies use increased after low-dose tirzepatide through 24 months. Examining 1:1 propensity-matched comparisons of sustained low-dose semaglutide against anti-diabetic drugs (metformin, DPP-4 and SGLT-2 inhibitors) for each pre-existing cardiovascular, neuropsychiatric, hepatic, pulmonary, renal, or viral disease burden cohort shows markedly better broad-spectrum clinical effectiveness for sustained low-dose semaglutide despite minimal weight change. The strongest lowering of 24-month event probabilities for sustained low-dose semaglutide over anti-diabetic drugs (p<0.05) occurred for patients with baseline cardiovascular conditions, for instance, relative to DPP-4 inhibitors for all-cause mortality (0.3% vs 7.1%), composite cardiovascular events (6.6% vs 14.5%), heart failure (1.8% vs 9.9%), arrhythmia (3.5% vs 10.9%), ischemic heart disease (4.3% vs 8.5%), and venous thromboembolism (0.9% vs 4.4%). Matched comparison of patients with low-dose (0.25 mg) vs high-dose (>1.7 mg) semaglutide shows mean percent weight loss at 12 months after initiation was 1.8% vs 12% (p<0.001), respectively, emphasizing that cardiometabolic benefits of low-dose semaglutide are likely independent of weight loss. Taken together, sustained maintenance of initiation-dose semaglutide appears linked to broad cardiometabolic benefits with minimal weight change, and better tolerability profile relative to sustained low-dose tirzepatide, motivating prospective studies of sustained semaglutide microdosing.
Keywords:
semaglutide
; microdosing
; low-dose GLP-1 receptor agonists
Introduction
Excess adiposity is tightly linked to atherosclerotic disease, vascular dysfunction, subclinical myocardial injury, and heart failure, making obesity a major cardiometabolic disease state rather than a phenotype defined only by body size.[1,2,3] Semaglutide emerged in this landscape first as a potent GLP-1 receptor agonist for type 2 diabetes and then as a weight-management therapy capable of inducing large and durable weight loss in adults with obesity or overweight.[4,5] Randomized cardiovascular outcome trials subsequently showed that semaglutide can reduce major adverse cardiovascular events both in high-risk type 2 diabetes and in overweight or obesity without diabetes, broadening its relevance far beyond the scale.[4,6]
That broader therapeutic identity now matters in a rapidly changing real-world treatment environment. GLP-1 prescribing has accelerated sharply in the United States, with semaglutide accounting for an increasing share of use among people with overweight or obesity, including those without diabetes.[7,8,9] At the same time, off-label use patterns have widened, and periods of intense demand have been accompanied by aggressive marketing of compounded GLP-1 products and growing concern about the safety and quality of non-FDA-approved formulations.[10,11,12] In that setting, sustained low-dose or so-called microdosing use becomes increasingly plausible in routine care, yet formal clinical evidence for what durable non-escalation means remains sparse.
This evidentiary gap is increasingly important because semaglutide’s clinical portfolio now extends well beyond weight loss alone. In addition to reducing major cardiovascular events in SELECT, semaglutide improved symptoms and physical limitations in obesity-related HFpEF, improved kidney outcomes in type 2 diabetes with chronic kidney disease in FLOW, reduced cardiovascular events with oral semaglutide in SOUL, improved walking capacity in symptomatic peripheral artery disease in STRIDE, and established a higher-dose efficacy benchmark in STEP UP.[6,13,14,15,16,17] Taken together, these trials suggest that semaglutide should be understood not simply as an anti-obesity drug, but as a systems-level cardiometabolic therapy with organ-level consequences that may not scale linearly with a single visible endpoint.[18]
Yet most semaglutide evidence remains organized around escalation toward standard target doses, whereas routine clinical practice increasingly includes patients who remain at the initiation dose for reasons that may include tolerability, access, cost, supply, or individualized treatment goals. This raises a practical and mechanistic question: does persistent non-escalation simply reflect incomplete treatment, or can sustained lowest-dose exposure carry a recognizable clinical signature of its own? Here, we addressed that gap by treating sustained lowest-dose semaglutide exposure as a pragmatic real-world proxy for semaglutide microdosing. We perform a matched head-to-head analysis of patients with low-dose semaglutide or tirzepatide prescriptions to compare clinical outcomes and tolerability profiles, and we compare outcomes in matched cohorts of patients with pre-existing comorbidities who were prescribed low-dose semaglutide versus other anti-diabetic medications. This design does not directly test intentional self-described microdosing but rather investigates whether durable semaglutide non-escalation itself, which may serve as a proxy for microdosing, is associated with meaningful differences in a variety of clinical outcomes.
Results
Cohort Definition and Prescription Patterns
Because sustained lowest-dose exposure was used here as a real-world proxy for semaglutide microdosing, we first quantified how selectively and how durably this exposure pattern could be isolated. From 490,072 patients with at least one semaglutide prescription, 814 met the sustained lowest-dose cohort definition, requiring semaglutide exposure limited to 0.25 mg only, at least 3 distinct 0.25 mg prescription dates, a gap of at least 183 days between the first and last qualifying prescriptions, and no prescriptions for non-semaglutide study drugs during the 365-day pre-index washout or after treatment initiation (Figure 1).
Sustained Low-Dose Semaglutide Shows Similar Outcomes but Improved Tolerability Compared to Sustained Low-Dose Tirzepatide
We compared patients with prescriptions for lowest-dose semaglutide to those with prescriptions for lowest-dose tirzepatide. Out of 322,442 patients with at least one tirzepatide prescription, 1,016 met the sustained lowest-dose cohort definition (see Methods). After exact matching on index year and 1:1 propensity matching on age, sex, baseline BMI, and baseline type 2 diabetes, the matched head-to-head lowest-dose semaglutide and tirzepatide cohorts consisted of 534 patients each (Table 1). We then compared the post-treatment initiation event probabilities of incident ICD-defined outcomes across six patient subcohorts with specified pre-treatment disease burdens (cardiovascular, neuropsychiatric, hepatic, pulmonary, renal, viral infection), defined as the presence of a first ICD code among patients without the given diagnosis prior to treatment initiation (see Methods). Across 104 total outcomes analyzed across these six groups, no comparison reached statistical significance (Figure 2).
Despite this lack of separation in post-treatment incident diagnoses, the matched weight trajectories separated consistently, supporting active treatment exposure in both arms and greater weight loss with tirzepatide. Mean percent weight change at 3, 6, 9, 12, and 15 months was 0.17%, -0.94%, -1.63%, -2.18%, and -1.67% in semaglutide versus -3.64%, -5.34%, -5.48%, -5.53%, and -5.38% in tirzepatide (p<0.05 at all time points; Figure 3). Further, the note-derived adverse-event analysis across 461 evaluated conditions identified 22 significant signals, 16 of which had higher rates in the tirzepatide cohort (Figure 4; Table S1). For example, tirzepatide showed higher 24-month event probabilities for lentigo (4.68% vs 0.79%, p=0.005), acute kidney injury (2.68% vs 0.43%, p=0.007), lumbar disc disease (3.30% vs 0.29%, p=0.009), constipation (32.58% vs 22.41%, p=0.009), actinic keratosis (3.29% vs 0.58%, p=0.01), muscle cramps (8.34% vs 4.00%, p=0.012), and dyspnea on exertion (9.64% vs 6.80%, p=0.033), whereas semaglutide showed higher event probabilities for otitis (5.60% vs 2.05%, p=0.003), diaphoresis (5.54% vs 3.24%, p=0.006), ankle swelling (6.92% vs 3.74%, p=0.02), and migraine (16.41% vs 8.99%, p=0.048).
Changes in Prescribing Trends Following Semaglutide or Tirzepatide Initiation Corroborate Multiple Adverse Event Signals
We next analyzed changes in prescription prevalence for 14 medication groups to assess for concordance (or lack thereof) with the note-derived adverse-event signals. Specifically, we aimed to assess whether there were increased prescriptions for medications that are used to treat the adverse events identified previously (Figure 5; Tables S2-S3).
There were several therapies that showed directional changes in prevalence that were concordant with the previously described adverse event signals. For example, renal supportive and hyperkalemia therapies increased in tirzepatide by 12 months from 5.63% to 9.51% (Δ 3.88 percentage points; p=0.016), while semaglutide moved from 8.20% to 6.64% (p=0.382). Wakefulness and stimulant therapies increased in tirzepatide from 5.79% to 7.44% by 6 months (Δ 1.65 percentage points; p=0.039) and remained elevated through 24 months at 8.14% (p=0.008), which may be related to the higher probability of lethargy/tiredness documented in clinical notes following tirzepatide initiation. Hyperhydrosis therapies rose in semaglutide by 3 months from 1.84% to 4.38% (Δ 2.53 percentage points; p=0.027), aligned with the increased post-treatment prevalence of diaphoresis in the semaglutide cohort. Migraine therapies rose in semaglutide by 12 months from 6.64% to 8.98% (Δ 2.34 percentage points; p=0.031), whereas tirzepatide changed only from 7.18% to 7.57% (p=0.83).
Low-Dose Semaglutide Is Associated with Reduced Mortality and Newly Documented Cardiovascular Morbidities Compared to Other Anti-Diabetic Medications
We next compared sustained lowest-dose semaglutide against three primary anti-diabetic comparator cohorts, metformin, DPP-4 inhibitors, and SGLT-2 inhibitors (Table S4), within the same six pre-existing disease-burden groups that were used in the head-to-head comparison of semaglutide versus tirzepatide (cardiovascular, neuropsychiatric, hepatic, pulmonary, renal, and viral infectious disease) (Table S5). Among the 814 patients in the sustained lowest-dose semaglutide cohort, 376 had cardiovascular burden, 473 neuropsychiatric burden, 34 hepatic burden, 226 pulmonary burden, 84 renal burden, and 55 viral infectious-disease burden; these groups were not mutually exclusive. In the overall sustained lowest-dose semaglutide cohort, patients had a median [IQR] of 3 [3, 4] 0.25 mg prescription dates and a median exposure span of 371 [266 to 540] days. Across these matched anti-diabetic comparator analyses, the median number of semaglutide prescriptions was 3 [3, 4] prescriptions and 375 [280, 545] days, compared with 4 [2 to 10] prescriptions and 680 [233, 1642] days for metformin, 4 [2, 8] prescriptions and 356.5 [56 to 804] days for DPP-4 inhibitors, and 5 [3, 9] prescriptions and 339 [90, 706] days for SGLT-2 inhibitors (Table 2; Figure S1).
Across the six pre-existing comorbidity groups and three anti-diabetic comparator classes, we performed separate 1:1 propensity-matched comparisons between sustained lowest-dose semaglutide and each comparator within each burden group, matching on age, sex, baseline BMI, and baseline type 2 diabetes status. Matched cohort sizes ranged from 29 to 447 patients per arm (Table S6). Across all matched analyses, the incidence of 312 ICD-defined outcomes was evaluated. Of these, 32 met statistical significance by log-rank testing (Figure 6; Table S7; Figures S2-S5).
The strongest difference arose in the cardiovascular group (i.e. cardiovascular outcomes evaluated in patients with baseline cardiovascular comorbidities). Compared with DPP-4 inhibitors, sustained lowest-dose semaglutide was associated with lower 24-month Kaplan-Meier event probabilities for all-cause mortality (0.28% vs 7.10%, p<0.001), composite cardiovascular events (6.55% vs 14.46%, p<0.001), incident heart failure (1.79% vs 9.91%, p<0.001), arrhythmia or conduction disorders (3.47% vs 10.89%, p=0.012), ischemic heart disease (4.33% vs 8.49%, p=0.02), and venous thromboembolism (0.88% vs 4.36%, p=0.027). Compared with SGLT-2 inhibitors, lowest-dose semaglutide also showed lower probabilities of incident heart failure (1.79% vs 29.34%, p<0.001), cardiomyopathy (0.58% vs 13.48%, p<0.001), arrhythmia or conduction disorders (3.47% vs 16.69%, p<0.001), valvular or rheumatic heart disease (2.12% vs 10.06%, p<0.001), ischemic heart disease (4.33% vs 10.90%, p<0.001), composite cardiovascular events (6.55% vs 14.62%, p<0.001), and all-cause mortality (0.28% vs 3.51%, p=0.004). Importantly, given that SGLT-2 inhibitors are part of guideline-directed medical therapy for heart failure and can be utilized in diabetes and chronic kidney disease patients at high risk of heart failure,[19,20] these large magnitude differences likely reflect confounding related to selection bias, reverse causation, and possibly incomplete documentation in the pre-treatment period. Namely, the SGLT-2 inhibitor cohort likely includes a higher percentage of patients who have undocumented heart failure at the time of initiation or a higher baseline risk of heart failure, possibly related to several of the other conditions highlighted above (e.g., ischemic heart disease).
Outside the cardiovascular group, there were several additional outcomes with significantly different incident event probabilities following lowest-dose semaglutide initiation compared to the comparator medications. In the neuropsychiatric group, compared with DPP-4 inhibitors, semaglutide was associated with lower all-cause mortality (0.22% vs 5.35%, p<0.001), lower polyneuropathies or PNS disorders (1.64% vs 5.28%, p=0.006), and lower CNS disorders (including autonomic dysfunction, hydrocephalus, and encephalopathy; 3.83% vs 6.00%, p=0.007), whereas cranial neuropathies or radicular disorders were higher in the semaglutide cohort (4.51% vs 2.84%, p=0.022). In the pulmonary group, compared with DPP-4 inhibitors, semaglutide was associated with lower all-cause mortality (0.47% vs 6.67%, p=0.002) and lower respiratory failure or hypoxemia (6.99% vs 15.70%, p=0.045). In the renal group, semaglutide showed lower diabetic kidney disease compared with DPP-4 inhibitors (2.94% vs 21.56%, p=0.008), lower acute kidney injury compared with SGLT-2 inhibitors (1.47% vs 8.62%, p=0.029), and lower chronic kidney disease compared with SGLT-2 inhibitors (9.38% vs 21.43%, p=0.04). In the hepatic and viral infectious-disease groups, there were no outcomes with significantly different incident event probabilities between the semaglutide and comparator cohorts.
Comparison of Low-Dose Semaglutide Versus Indication-Aligned Comparator Medications Identifies Candidate Indications for Adjunctive Therapy Approaches
To test whether the initial anti-diabetic comparator findings generalized to other medication classes and to identify areas in which low-dose semaglutide could serve as an adjunctive therapy, we expanded the matched burden-family framework to 29 indication-aligned therapeutic comparator classes spanning the same six prior-burden families (Table S8). For example, in the cardiovascular group, we compared the incident event probabilities of various cardiovascular outcomes among the lowest-dose semaglutide cohort and additional cohorts of patients who initiated medications such as renin angiotensin aldosterone system (RAAS) modulators. Across these class-level analyses, 504 outcome comparisons were evaluated, of which 34 met statistical significance by log-rank testing and nine remained significant after within-family false-discovery correction (Figure 7, Figure S6). The strongest signals were again found in the cardiovascular and neuropsychiatric analyses, while sparse signals were seen in the pulmonary, renal, and viral analyses (Figure 7; Figure S6).
In patients with prior cardiovascular burden, sustained lowest-dose semaglutide was associated with lower 24-month all-cause mortality than the matched anticoagulation group (1.07% versus 12.48%, p<0.001) and the matched non-RAAS blood-pressure/volume/antianginal group (1.07% versus 10.32%, p<0.001). On the other hand, lowest-dose semaglutide was associated with a higher event probability of valvular/rheumatic heart disease compared to the RAAS/heart-failure neurohormonal group (3.29% versus 1.06%, p=0.010).
Neuropsychiatric class-level comparisons were variable. Semaglutide showed lower incident Parkinson’s or movement disorders than the neurodegenerative cognitive/movement-disorder therapies (3.24% versus 17.63%, p<0.001), but higher incident mood disorders than the anxiolytic/sedative-hypnotic therapies (15.50% versus 1.23%, p<0.001); higher incident anxiety- and stress-related disorders disorders than the antiseizure/mood-stabilizing neuroexcitability therapies (19.38% versus 5.90%, p=0.002) and the antipsychotic/dopamine-serotonin therapies (19.38% versus 3.45%, p=0.009), and higher abnormal neurologic and neuromuscular findings than the antidepressant/monoaminergic mood therapies (4.15% versus 0.54%, p=0.011).
A follow-up analysis resolving the therapeutic class-level comparisons to the level of individual drugs (considering the three most prevalent drugs within each comparator class) yielded similar findings with a higher level of granularity (Figures S7-S8).
Assessment of Other Medications and Procedures as Potential Confounding Factors for Outcome Shifts in Low-Dose Semaglutide Patients
We next assessed for confounding by other medications or procedures that coincided with semaglutide initiation (see Methods)., Of the 1,037 non-semaglutide medications that were assessed, none showed statistically significant heterogeneity across the prespecified windows after false discovery correction (Table 3). Medications with the highest degrees of heterogeneity across these windows included ondansetron, which changed from 11.43% at baseline to 16.71% in months 0-6 and 17.41% in months 18-24 (p=0.003, q=0.94); erythromycin, which rose from 0.49% to 2.39% (p=0.008, q=0.94); phentermine, which increased from 5.28% to 9.58% and remained 8.87% at months 18-24 (p=0.011, q=0.94); and estradiol, which rose from 2.09% to 5.46% (p=0.015, q=0.94).
Of 3,881 assessed procedures, several showed significant heterogeneity across these time windows (Table 4). Bilateral screening mammography with 3D tomosynthesis increased from 4.67% at baseline to 16.38% by months 18-24 (p<0.001, q<0.001), while the alternate procedure code for 3D mammography fell from 7.86% to 2.39% (p<0.001, q=0.001). Other procedures with potentially meaningful variability over these periods included quadrivalent influenza vaccination (0.98% at baseline, 2.95% in months 0-6, and 0.34% in months 18-24; p<0.001, q=0.006), lipid chemistry profiling (3.93% to 1.02%; p=0.001, q=0.546), and comprehensive echocardiography with contrast/strain if indicated (0.12% to 1.37%; p=0.001, q=0.559), although the last two did not remain statistically significant after false discovery correction.
Sustained Low-Dose Semaglutide Is Associated with Less Weight Loss and Fewer Adverse Events than Conventional Maintenance Doses
To place the sustained-lowest-dose phenotype in the context of conventional semaglutide escalation, we compared matched sustained-lowest-dose and high-dose semaglutide cohorts (see Methods). After exact matching on index year and 1:1 propensity matching on age, sex, baseline BMI, and baseline type 2 diabetes, 753 patients remained in each arm. Weight trajectories separated early and remained widely separated through 15 months, with mean percent weight change of -1.19%, -1.92%, -2.06%, -1.76%, and -1.36% in sustained lowest dose versus -5.08%, -8.85%, -11.45%, -12.03%, and -12.44% in high dose at 3, 6, 9, 12, and 15 months, respectively (Figure S9).
We also used natural language processing to curate treatment-related adverse events from clinical notes, which revealed multiple dose-related shifts with higher rates in the high-dose semaglutide group (Figure S10). The adverse events with the strongest separation in the 24-month event probability analysis were constipation (36.32% vs 23.28%, p<0.001), nausea (50.14% vs 39.73%, p<0.001), hunger (8.10% vs 2.79%, p<0.001), and low blood pressure (5.38% vs 1.68%, p=0.004). The only adverse event with a significantly higher probability in the lowest-dose group was acute cough (11.17% vs 4.52%, p=0.003).
Overall, this within-semaglutide dose-gradient comparison of treatment effect (i.e. weight loss) and side effects provided an internal calibration that the sustained-lowest-dose cohort was pharmacologically distinct from patients who escalated to high-dose semaglutide.
Patients with Documented Semaglutide Microdosing in Clinical Notes Have Mixed Effectiveness and Tolerability Signals
To complement the structured proxy-cohort design, we deployed a large language model on clinical notes with mentions of both semaglutide and “microdosing” explicitly (see Methods). This exploratory analysis was performed to characterize how semaglutide microdosing is described by clinicians rather than to replace the sustained-lowest-dose cohort definition used for the main analyses. Among 451 semaglutide patients with a microdosing mention in notes, 41 (9.1%) had chart evidence of confirmed semaglutide microdosing. Among these 41 patients, weight loss or weight control was the most commonly documented benefit (22/41, 53.7%), while 16/41 (39.0%) had no clear documented clinical benefit and 10/41 (24.4%) had descriptions of adverse effects or poor tolerability (Table S9).
Discussion
Over the past decade, semaglutide and tirzepatide have revolutionized the care of patients with type 2 diabetes and obesity. Randomized clinical trials have demonstrated profound weight reduction in patients with obesity and improvement in glycemic control which have been recapitulated in various real-world analyses.[4,5,17,21,22] More recently, there is an increasing recognition of benefits beyond diabetes and obesity, with multiple studies demonstrating evidence of broader cardiovascular benefit, improvements in metabolism-associated liver disease, and after initiation of these therapies.[6,13,14,15,16,17] However, all of these previous studies have investigated patients receiving recommended maintenance doses of semaglutide or tirzepatide, so the potential benefits of lower doses have not been adequately evaluated. Despite this lack of clinical trial or real-world evidence for lower doses, there has been a growing interest in “microdosing” of GLP-1 receptor agonist therapies. Here, we begin to bridge this evidence gap by performing the first real-world analysis of patients with putative sustained exposure to low-dose semaglutide (0.25 mg) based on prescription records.
In this study, we compared patients with sustained lowest-dose semaglutide prescriptions to propensity-matched comparator populations of patients with pre-existing medical conditions taking other anti-diabetic medications or other classes of medications related to their baseline conditions. Rather than providing definitive evidence of the effects of low-dose semaglutide, this study generated multiple hypotheses for potentially high impact areas that warrant future prospective evaluation. Overall, the strongest signals were observed in patients with baseline cardiovascular comorbidities, in whom lowest-dose semaglutide was associated with reduced post-initiation incident event probabilities for all-cause mortality and multiple cardiovascular outcomes including heart failure, arrhythmias, and ischemic heart disease. Several statistically significant associations were also observed in patients with baseline neuropsychiatric conditions, including lower rates of movement disorders but higher rates of mood and anxiety related diagnoses. Overall, these data suggest that there may be a clinically meaningful separation between patients with durable non-escalation (used here as a real-world proxy for microdosing) and matched non-GLP-1 comparators, challenging the assumption that benefits of semaglutide emerge only after conventional escalation to higher maintenance doses. Instead, it is possible that persistent low-intensity exposure could capture at least a portion of semaglutide’s broader cardiometabolic biology.
The possibility that microdosing of semaglutide or tirzepatide could confer clinical benefits has been summarized in recently published editorials which both highlight situations in which this approach may be beneficial and call for additional evidence to help develop recommendations for prescribing clinicians.[23,24] Examples of such situations include the transition between different GLP-1 receptor agonist therapies, personalized dose titrations, prevention therapeutic disruption in patients with severe gastrointestinal side effects, and extension of drug supply in patients with access issues (e.g., lack of insurance coverage, local supply chain shortages).[24] In our study, we did not assess the reasons for sustained lowest-dose prescriptions, but future studies investigating the most commonly cited reasons for microdosing in the real-world setting would be informative. As data accumulates on clinical outcomes associated with sustained low-dose semaglutide or tirzepatide exposure, it is possible that the list of scenarios in which microdosing should be considered will be refined or expanded.
The comparison of matched patient cohorts with lowest-dose prescriptions for semaglutide and tirzepatide is an important component of this study. Previous comparative effectiveness studies have demonstrated significantly greater weight loss in patients taking tirzepatide compared to semaglutide.[25,26,27] However, these comparisons have not evaluated low-dose regimens or other important outcomes beyond weight loss. In our study, there were no outcomes with significantly different post-initiation event probabilities between these cohorts, but there were more adverse events that were disproportionately observed in patients with prescriptions for tirzepatide compared to semaglutide, including acute kidney injury and constipation. This observation motivates prospective evaluation of the tolerability profiles of low-dose regimens of these agents, as this is expected to contribute meaningfully to treatment adherence and real-world effectiveness.
To explore whether therapeutic class-level patterns localized to specific medications, we conducted an exploratory analysis of the most prevalent drugs within each comparator class. The strongest signals of decreased outcome probability in the low-dose semaglutide cohort again localized to cardiovascular and neuropsychiatric burden families, with the heatmap shown in Figure S9 and representative Kaplan-Meier separations shown in Figure S10. Importantly, these analyses should be interpreted primarily as therapeutic-context maps to generate hypotheses for possibly combination therapies, rather than as evidence that sustained lowest-dose semaglutide is superior to any specific standard-of-care drug. Each comparator carries its own indications, severity, prescribing-intent, access, monitoring, and survivorship structure; for example, anticoagulants mark thromboembolic risk, furosemide marks volume-overload or cardiorenal disease, ropinirole marks movement-disorder treatment context, and olanzapine or quetiapine mark neuropsychiatric populations with substantial metabolic and mortality burden. These confounders are evident in the results and prohibit head-to-head comparisons of effectiveness but they identify candidate clinical states in which semaglutide microdosing could be tested as an adjunctive therapy strategy.. Conversely, to some extent, outcomes that were observed more frequently in the semaglutide cohorts compared to comparator drugs (e.g., higher incident mood-disorder coding compared to zolpidem) likely reflect confounding factors including surveillance bias and documentation bias in the baseline period. This interpretation framework highlights the value of the drug-level analysis as a method to facilitate rational design of combination therapies, while avoiding overinterpretation of observational comparisons that were not adequately matched to support drug-versus-drug causal analysis.
There are limitations of this study. First, it is a retrospective study of real-world electronic health record data and therefore is subject to multiple sources of bias and confounding including but not limited to treatment-selection bias, differential measurement density, and outcome misclassification. While this is addressed to some extent by our propensity-matching approach for each analysis, several of the differences in incident documentation of diagnoses between the semaglutide and comparator cohorts are suggestive of residual confounding. For example, we observed a significantly higher post-initiation event probability of heart failure and other cardiovascular conditions in patients taking SGLT-2 inhibitors compared to lowest-dose semaglutide. Given that SGLT-2 inhibitors (SGLT2i) are a cornerstone of guideline directed medical therapy (GDMT) for heart failure,[28] there are likely multiple sources of confounding that contribute to this result. For example, there may be incomplete documentation (including ICD coding) prior to therapy initiation, so it is possible that some of the patients with newly documented diagnosis of heart failure after SGLT2i initiation actually had a pre-existing diagnosis. Further, in some cases, SGLT2i are prescribed to type 2 diabetes or chronic kidney disease patients who are at particularly high risk of subsequently developing heart failure.[19] The higher rates of heart failure and other cardiovascular conditions that predispose to heart failure (e.g., valvular disease and ischemic heart disease) could reflect that this population of SGLT2i-treated patients has a significantly higher baseline risk of developing new heart failure after treatment initiation, which is not adequately controlled in our propensity matching process which only included age, sex, type 2 diabetes status, and BMI.
An additional major limitation of the study is uncertainty around the accuracy of the exposure definition, which is currently an inherent challenge of assessing microdosing in the real-world setting. Specifically, we considered sustained lowest-dose (0.25 mg) semaglutide prescriptions as a proxy for microdosing. However, whether these prescriptions were consistently filled and whether the patient administered the medication as prescribed is not captured in our dataset. Indeed, barriers to treatment initiation (e.g., lack of insurance coverage) and poor post-initiation adherence (e.g., due to drug tolerability profiles) have been described previously.[29,30] This study motivates the development of systems that better capture and reflect treatment adherence in electronic health records, both to aid the prescribing clinicians and to improve the robustness of real-world treatment monitoring. Our secondary analyses of weight change and adverse effects associated with lowest-dose semaglutide and tirzepatide did suggest some therapeutic effect at the cohort-level (e.g., statistically significant weight loss compared to baseline and multiple treatment-related adverse effects in line with prior reports of higher-dose regimens), but we are not able to resolve the heterogeneity that likely exists at the individual patient level. It is also noteworthy that microdosing as commonly described does not simply correspond to taking a prescribed low dose of semaglutide. Instead, it can involve taking fractional injections of larger semaglutide doses, with per-injection doses as low as 0.06 mg.[24] Thus, in the definition of our study cohort, it is possible that not only are some of the included patients not intentionally microdosing but also that some excluded patients (on the basis of having higher dose prescriptions) are in fact following a microdosing regimen. We did perform an exploratory LLM-based analysis to capture patients with mentions and confirmations of microdosing in unstructured clinical notes, but the quantity of these patients was quite limited.
There are additional minor technical limitations to the study design. First, the analysis of baseline and incident disease burden relied on documented ICD codes, which are known to have limitations in both sensitivity and specificity.[31,32] Second, we exclusively analyzed patients with known baseline comorbidities across specific organ systems. Consideration of broader patient populations, including those without such pre-existing diagnoses, will be important in future studies. Third, the sizes of the cohorts were relatively small, so the analyses may be underpowered to detect lower magnitude differences. Finally, while the study was performed on a federated data platform that incorporates data from multiple academic and community health systems, the study population is likely not fully representative of the U.S. or global population of patients taking GLP-1 receptor agonists, so replication in other settings and more diverse patient populations is warranted.
With these caveats in mind, this study remains important as the first attempted characterization of low-dose semaglutide in the real-world clinical setting. Our findings suggest that the broad cardiometabolic benefits of semaglutide could emerge earlier on the dose-escalation curve than has been appreciated to date. This realization, if true, is particularly important in light of the recent STEP UP trial demonstrating superior weight loss with high-dose (7.2 mg weekly) semaglutide compared to the previous maximum dose of 2.4 mg, which underscores how strongly the field remains focused on dose optimization.[17] In a treatment landscape increasingly shaped by demand, personalization, off-label use, and compounded GLP-1 receptor agonist markets,[7,10,11,12] sustained lowest-dose exposure deserves direct further prospective study to determine whether microdosing ultimately proves to be biologically subtherapeutic, strategically useful in selected patients, or simply a marker of a distinct clinical phenotype.
Methods
Study Cohorts and Proxy Design
This was a retrospective cohort study using sustained lowest-dose semaglutide exposure as a real-world proxy for semaglutide microdosing. The primary semaglutide cohort was defined as patients whose semaglutide exposure was exclusively 0.25 mg, who had at least 3 distinct 0.25 mg prescription dates, at least a 6-month span between first and last qualifying prescriptions, and no non-semaglutide study-drug exposure (other GLP-1 receptor agonists, DPP-4 inhibitors, SGLT-2 inhibitors, metformin and other weight-loss medications i.e. orlistat, phentermine/topiramate, and bupropion/naltrexone) during the 365-day pre-index washout or at any time on or after index. The index date was the first qualifying semaglutide prescription date.
An analogous sustained lowest-dose tirzepatide cohort was defined as 2.5 mg +/- 0.5 mg-only tirzepatide exposure with at least 3 distinct target-dose prescription dates, at least a 6-month target-dose span, and the same 365-day pre-index washout and post-index study-drug exclusivity logic. Comparator cohorts for the whole-body burden-family analyses were metformin, DPP-4 inhibitors, and SGLT-2 inhibitors. The DPP-4 and SGLT-2 component drugs are listed in Table S4.
Baseline Covariates and Prior-Burden Definitions
Baseline matching covariates were age at index, sex, baseline BMI, and baseline type 2 diabetes. Baseline BMI and diabetes status were derived from structured EHR data available around the treatment index date. The whole-body comparator analyses were conducted within 6 prior-burden families: cardiovascular, neuropsychiatric, hepatic, pulmonary, renal, and viral infectious disease. Family membership used prespecified ICD-based groupings and required at least 3 qualifying diagnosis dates. The same ICD-based pre-existing disease-burden definitions were reused in the structured semaglutide-versus-tirzepatide and semaglutide low-versus-high head-to-head analyses.
Whole-Body Comparator Analyses Across Baseline Disease-Burden Groups
For each burden family, the sustained lowest-dose semaglutide cohort was restricted to patients with prior burden in that family and then compared pairwise against metformin, DPP-4 inhibitors, and SGLT-2 inhibitors. Each comparison used 1:1 propensity matching without replacement, a caliper of 0.2, and the covariates age at index, sex, baseline BMI, and baseline type 2 diabetes. Matching was performed separately for each pairwise comparison, and final matched cohort characteristics are summarized in Table S6.
Follow-up began on the treatment index date. All-cause mortality analyses used the matched family cohort directly. For each incident diagnosis outcome, patients with evidence of that same condition before follow-up were excluded from that specific outcome analysis without outcome-specific rematching. Kaplan-Meier event probabilities were summarized at 6, 12, 18, and 24 months; the main whole-body figure uses the 6-month heatmap as Figure 6, and the 12-, 18-, and 24-month heatmaps are provided as supplementary figures.
Expanded Indication-Aligned Therapeutic Comparator Analyses
To extend the primary anti-diabetic comparator framework beyond metformin, DPP-4 inhibitors, and SGLT-2 inhibitors, we curated 29 indication-aligned therapeutic comparator classes across the same 6 pre-existing disease-burden groups; the comparator classes and constituent drugs are listed in Table S8. For each class, cohort entry was defined as the first prescription for any drug in that class. Patients were excluded if they had semaglutide, tirzepatide, another GLP-1 receptor agonist, or another study weight-loss drug during the 365-day pre-index washout or at any time on or after index. Using the same structured BMI and diagnosis data assembled for the primary analyses, we then applied the same pre-existing disease-burden definitions, 1:1 propensity-matching strategy, covariates, incident-outcome exclusions, and 6-, 12-, 18-, and 24-month Kaplan-Meier summaries as in the main whole-body anti-diabetic comparator workflow.
To resolve class-level signals to the level of constituent drugs, we counted unique exposed patients for each drug within each therapeutic comparator class and retained the 3 most prevalent clinically interpretable drugs per class after excluding overly broad or non-specific captures, yielding 84 individual-drug comparators. Individual-drug cohorts were then derived from the corresponding class-level comparator cohorts by requiring that the class-defining index prescription was the selected drug, thereby preserving the same exposure exclusions and allowing reuse of the same BMI and diagnosis source data. Each selected drug was analyzed only within its parent pre-existing disease-burden group using the same matching and incident-outcome framework described above.
Prescription-Pattern and Within-Cohort Screening Analyses
Prescription-pattern summaries were generated in 2 ways. First, the unique sustained lowest-dose semaglutide cohort was summarized for 0.25 mg prescription count and exposure span. Second, treatment-pattern summaries were generated across the matched comparator analyses and are reported descriptively in Table 2 and Figure S1.
To assess for confounding by other medications or procedures that coincided with semaglutide initiation, a within-cohort screen of the low-dose semaglutide cohort was performed across five windows relative to the date of the first semaglutide prescription: -6 to 0 months, 0 to 6 months, 6 to 12 months, 12 to 18 months, and 18 to 24 months. The prevalence of 1,037 non-semaglutide medications and 3,881 procedures was assessed across these five intervals. Post-index windows were censored at the patient's last observed medication date. For each medication or procedure, prevalence across windows was compared with a heterogeneity chi-square test, and false-discovery control used the Benjamini-Hochberg procedure.
Head-to-Head Matched Comparisons
Two head-to-head matched designs were evaluated: sustained lowest-dose semaglutide versus sustained lowest-dose tirzepatide, and sustained lowest-dose semaglutide versus semaglutide high dose. For the overall cross-drug comparison, patients were exact-matched on index year and then 1:1 propensity-matched on age, sex, baseline BMI, and baseline type 2 diabetes using an absolute propensity-score caliper of 0.2. The within-semaglutide low-versus-high comparison used the same exact-year and 1:1 propensity-matching strategy and covariates.
Out of 322,442 patients with at least one tirzepatide prescription, 95,506 only had prescriptions for doses of 2.5 mg +/- 0.5 mg, with 9,190 patients having such prescriptions on at least 3 distinct dates. From this group, 3,055 also satisfied study-drug exclusivity, defined as no exposure to any non-tirzepatide prespecified study drug during the 365-day pre-index washout or after index. These prespecified study drugs included other GLP-1 receptor agonists, DPP-4 inhibitors, SGLT-2 inhibitors, metformin and other weight-loss medications (orlistat, phentermine/topiramate, and bupropion/naltrexone). After applying the minimum 6-month exposure-span criterion, 1,016 formed the final sustained lowest-dose tirzepatide cohort.
For the comparison of lowest-dose versus high-dose semaglutide, high-dose semaglutide was defined as at least three semaglutide prescription dates and at least one dose at or above 2.0 mg within 6 months of treatment initiation
Structured ICD-Based Head-to-Head Outcome Analysis
For both head-to-head designs, the same 6 ICD-based pre-existing disease-burden groups were reused for structured incident-outcome analyses. Within each burden group, cohorts were first restricted to patients with that baseline burden and then re-matched within group using exact index-year matching and 1:1 propensity matching on age, sex, baseline BMI, and baseline type 2 diabetes with a caliper of 0.2. All-cause mortality used the matched family cohort directly. For each incident diagnosis outcome, patients with evidence of that same condition before follow-up were excluded from that specific outcome analysis without outcome-specific rematching. Kaplan-Meier cumulative event probabilities were summarized at 6, 12, 18, and 24 months.
Note-Derived Augmented-Curation Adverse-Event Analysis
Note-derived adverse-event analyses used disease outputs generated by a BERT-based clinical natural language processing (NLP) pipeline with sentiment extraction. Patients contributed to a note-derived outcome only if they had note-based follow-up at or after index. In the semaglutide low-versus-high dose analysis, the same augmented-curation disease filters and windows were used. In both head-to-head analyses, a 1-year pre-index window (-365 to -1 days) defined prevalent-positive exclusion, a 2-year post-index window (0 to 730 days) defined incident follow-up.
Medication Use and Prescription-Trend Validation
Medication-based validation in the semaglutide-versus-tirzepatide comparison used the same matched head-to-head cohort and mapped broad medication groups to the note-derived condition signals. Incident-use analyses applied a 1-year pre-index negative-control window (-365 to -1 days) and 2-year post-index follow-up window (0 to 730 days); patients with pre-index use of a given medication group were excluded from that group-specific incident-use analysis. Medication-group risk tables were flattened into one-row-per-group summaries with log-rank statistics and Benjamini-Hochberg-adjusted q values.
Mirrored pre/post medication-use analyses used cumulative windows every 3 months through 24 months. For each medication group and window, a patient was classified as positive if they had at least one medication record matching that proxy group within the corresponding pre-index or post-index window. Reported percentages represent the proportion of eligible matched patients with at least one qualifying medication record in that window. Eligibility required at least one clinical note in both mirrored pre and post windows. Within-arm pre/post prevalence changes were tested with McNemar statistics and then compared descriptively across arms.
Weight Trajectory Analysis
For both head-to-head designs, weight trajectories were evaluated in the overall matched cohort.. For each patient, the follow-up weight value at each target timepoint was the median measurement within a fixed window centered at 3, 6, 9, 12, and 15 months after index (±30 days at 3, 6, and 9 months; ±45 days at 12 and 15 months). Baseline weight was defined as the nearest value from 90 days before through 14 days after index. Weight trajectories were expressed as both percent change from baseline and absolute kilogram change from baseline. Pair completeness was enforced within each matched pair or match set at each metric-timepoint before summarizing cohort-level means and standard deviations.
Exploratory GPT-OSS-20B Retrieval-Augmented Detection of Microdosing Mentions
In a separate exploratory analysis, notes with mentions of “semaglutide” and “microdosing” (or related terms) were processed with an automated GPT-OSS-20B retrieval-augmented workflow that looked for explicit or model-reasoned evidence linking semaglutide to microdosing and associated outcomes. The results of this analysis are reported descriptively without formal inferential testing (Table S9).
Statistical Analysis
Continuous variables were summarized as means with standard deviations or medians with interquartile ranges, and categorical variables were summarized as counts and percentages. The whole-body anti-diabetic comparator analyses and the structured head-to-head ICD analyses used Kaplan-Meier estimates of cumulative event probability and log-rank p-values. The note-derived augmented-curation analyses and medication-use incident analyses likewise used Kaplan-Meier summaries with log-rank testing, with Benjamini-Hochberg correction applied to flattened outcome and medication-group tables. Fixed-window weight and HbA1c trajectory analyses summarized patient-level medians within each window and then cohort-level means and standard deviations after enforcing pair completeness at each metric-timepoint; plotted error bars represent standard errors. Within-cohort medication and procedure screens used heterogeneity chi-square tests across windows with Benjamini-Hochberg correction, and mirrored medication analyses used McNemar tests within arms. All analyses were performed in Python.
Real-World EHR Data Source and Privacy Framework
This study analyzed de-identified EHR data from academic medical centers in the United States via the nference nSights Analytics Platform. Prior to analysis, all data underwent expert determination de-identification satisfying HIPAA Privacy Rule requirements (45 CFR §164.514(b)(1)), employing a multi-layered transformation approach for both structured data (cryptographic hashing of identifiers, date-shifting, geographic truncation) and unstructured clinical text (ensemble deep learning and rule-based methods with >99% recall for personally identifiable information detection)[33,34]. nference established secure data environments within each participating center, housing these de-identified patient data governed by expert determination. These de-identified data environments were specifically designed to enable data access and analysis without requiring Institutional Review Board oversight, approval, or exemption confirmation. Accordingly, informed consent and IRB review were not required for this study.
Data Availability
This study involves the analysis of de-identified Electronic Health Record (EHR) data via the nference nSights Federated Clinical Analytics Platform (nSights). Data shown and reported in this manuscript were extracted from this environment using an established protocol for data extraction, aimed at preserving patient privacy. The data has been de-identified pursuant to an expert determination in accordance with the HIPAA Privacy Rule. Any data beyond what is reported in the manuscript, including but not limited to the raw EHR data, cannot be shared or released due to the parameters of the expert determination to maintain the data de-identification. The corresponding author should be contacted for additional details regarding nSights.
De-Identification and HIPAA Compliance Certification
Prior to analysis, all EHR data were de-identified under an expert determination consistent with the Health Insurance Portability and Accountability Act (HIPAA) Privacy Rule (45 CFR §164.514(b)(1)). The de-identification methodology employed a multi-layered transformation approach to both structured and unstructured data fields. In structured data, direct identifiers including patient names and precise geographic locations were excluded entirely, while indirect identifiers underwent specific transformations: patient identifiers, medical record numbers, and accession numbers were replaced with one-way cryptographic hashes using confidential salts to preserve linkage across patient encounters; all dates were shifted backward by patient-specific random offsets (1–31 days) to preserve temporal relationships while obscuring exact event timing; the ZIP codes were truncated to two-digit state-level resolution; and continuous variables including age, height, weight, and body mass index were thresholded to prevent identification of extreme values (for example, ages ≥89 years transformed to ‘89+’ and BMI >40 transformed to ‘40+’). In unstructured clinical text, an ensemble de-identification system that combines attention-based deep learning models with rule-based methods achieved an estimated >99% recall for personally identifiable information (PII) detection, with detected identifiers replaced by plausible fictional surrogates.
Data Harmonization
To address heterogeneity in EHR data, we harmonized clinical variables including medications, anthropometric measurements, and diagnoses to standardized concepts. For medications, we first constructed a standardized drug concept database combining the nSights knowledge graph with RXNorm (https://www.nlm.nih.gov/research/umls/rxnorm/index.html) hierarchies to capture ingredient, brand, and dose-specific information. EHR medication records were matched using a hierarchical approach prioritizing RXNorm codes when available, followed by ingredient-level matching, and finally natural language processing and pattern matching on free-text medication orders when structured codes were absent. For anthropometric measurements (height, weight, BMI), we created a unified vocabulary from SNOMED (https://www.snomed.org/, https://athena.ohdsi.org) and LOINC (https://loinc.org/) terminologies and matched EHR measurement descriptions using standardized text matching algorithms with abbreviation expansion and synonym resolution; ambiguous mappings were resolved using OpenAI GPT-4o (https://platform.openai.com/docs/models/gpt-4o) with summary statistics as context, followed by manual verification. For diagnoses, we developed a hierarchical disease concept database from the nSights knowledge graph and matched EHR diagnosis descriptions and codes by identifying the most specific common child concept in the hierarchy. This approach enabled consistent identification of clinical entities while preserving granularity where available.
Conflicts of Interest Statement
The authors are employees of nference, inc., which conducts research collaborations with various biopharmaceutical companies whose therapeutic products are included in this study. None of these companies, nor any other nference collaborator, funded, supported, or had any role in the independent study design, data acquisition, analysis, interpretation, manuscript preparation, or the decision to submit this work for publication. All analyses were conducted by the authors using de-identified electronic health record data. The authors declare no additional competing interests.
Funding
This research received no external funding.
Acknowledgments
We thank the nference engineering team for the development of the nSights federated AI platform, and Patrick Lenehan for critical review and manuscript feedback.
References
- Neeland, I. J., Poirier, P. & Després, J.-P. Cardiovascular and Metabolic Heterogeneity of Obesity: Clinical Challenges and Implications for Management. Circulation 137, 1391–1406 (2018). [CrossRef]
- Parto, P. & Lavie, C. J. Obesity and CardiovascularDiseases. Curr Probl Cardiol 42, 376–394 (2017).
- Ndumele, C. E. et al. Obesity, subclinical myocardial injury, and incident heart failure. JACC Heart Fail 2, 600–607 (2014). [CrossRef]
- Marso, S. P. et al. Semaglutide and Cardiovascular Outcomes in Patients with Type 2 Diabetes. N Engl J Med 375, 1834–1844 (2016). [CrossRef]
- Wilding, J. P. H. et al. Once-Weekly Semaglutide in Adults with Overweight or Obesity. N Engl J Med 384, 989–1002 (2021). [CrossRef]
- Lincoff, A. M. et al. Semaglutide and Cardiovascular Outcomes in Obesity without Diabetes. N Engl J Med 389, 2221–2232 (2023). [CrossRef]
- Ukhanova, M., Wozny, J. S., Truong, C. N., Ghosh, L. & Krause, T. M. Trends in glucagon-like peptide 1 receptor agonist prescribing patterns. Am J Manag Care 31, e228–e234 (2025). [CrossRef]
- Dawwas, G. K., Samuels, J. M. & Stein, C. M. Shifting obesity treatment paradigms: Trends of glucagon-like peptide-1 receptor agonists and bariatric surgery in the United States. Diabetes Obes Metab 27, 6023–6026 (2025). [CrossRef]
- Chao, A. M., Gilden, A. & Wadden, T. A. Glucagon-like peptide-1 receptor agonists for obesity: Growing popularity met with growing questions over safety. PLoS Med 23, e1004871 (2026). [CrossRef]
- Siudak, Z. et al. The extent and predictors of off-label use of GLP-1 receptor agonists for weight loss management. Diabetes Obes Metab 27, 3509–3511 (2025). [CrossRef]
- Mattingly, T. J., 2nd & Conti, R. M. Marketing and Safety Concerns for Compounded GLP-1 Receptor Agonists. JAMA Health Forum 6, e245015 (2025).
- McCall, K. L. et al. Safety analysis of compounded GLP-1 receptor agonists: a pharmacovigilance study using the FDA adverse event reporting system. Expert Opin Drug Saf 25, 581–588 (2026). [CrossRef]
- Kosiborod, M. N. et al. Semaglutide in Patients with Heart Failure with Preserved Ejection Fraction and Obesity. N Engl J Med 389, 1069–1084 (2023). [CrossRef]
- Perkovic, V. et al. Effects of semaglutide on chronic kidney disease in patients with type 2 diabetes. N. Engl. J. Med. 391, 109–121 (2024). [CrossRef]
- McGuire, D. K. et al. Oral semaglutide and cardiovascular outcomes in high-risk type 2 diabetes. N. Engl. J. Med. 392, 2001–2012 (2025). [CrossRef]
- Bonaca, M. P. et al. Semaglutide and walking capacity in people with symptomatic peripheral artery disease and type 2 diabetes (STRIDE): a phase 3b, double-blind, randomised, placebo-controlled trial. Lancet 405, 1580–1593 (2025). [CrossRef]
- Wharton, S. et al. Once-weekly semaglutide 7·2 mg in adults with obesity (STEP UP): a randomised, controlled, phase 3b trial. Lancet Diabetes Endocrinol. 13, 949–963 (2025). [CrossRef]
- Xie, Y., Choi, T. & Al-Aly, Z. Mapping the effectiveness and risks of GLP-1 receptor agonists. Nat Med 31, 951–962 (2025). [CrossRef]
- American Diabetes Association. 9. Pharmacologic Approaches to Glycemic Treatment: Diabetes Care 43, S98–S110 (2020).
- Greene, S. J., Butler, J. & Fonarow, G. C. Rapid and Intensive Guideline-Directed Medical Therapy for Heart Failure: 5 Core Principles. Circulation 150, 422–424 (2024). [CrossRef]
- Jastreboff, A. M. et al. Tirzepatide Once Weekly for the Treatment of Obesity. N Engl J Med 387, 205–216 (2022). [CrossRef]
- Frías, J. P. et al. Tirzepatide versus Semaglutide Once Weekly in Patients with Type 2 Diabetes. N Engl J Med 385, 503–515 (2021). [CrossRef]
- Tejera-Pérez, C. Comment on Komé et al. One Size Does Not Fit All: Understanding Microdosing Semaglutide for Diabetes in Multidose Pens. Diabetes Care 48, e93 (2025).
- Komé, A. M., Chandran, M. M., Tungate Lopez, S. S., Buse, J. B. & Klein, K. R. One size does not fit all: Understanding microdosing semaglutide for diabetes in multidose pens. Diabetes Care 48, e25–e27 (2025). [CrossRef]
- Aronne, L. J. et al. Tirzepatide as Compared with Semaglutide for the Treatment of Obesity. N Engl J Med 393, 26–36 (2025). [CrossRef]
- Rodriguez, P. J. et al. Semaglutide vs Tirzepatide for Weight Loss in Adults With Overweight or Obesity. JAMA Intern Med 184, 1056–1064 (2024). [CrossRef]
- Venkatakrishnan, A. J., Murugadoss, K. & Soundararajan, V. Decoding the hallmarks of GLP-1RA weight-loss super-responders. Biol. Methods Protoc. (2026) doi:10.1093/biomethods/bpag021. [CrossRef]
- Yangzong, Z. et al. Delayed Giant Splenic Artery Aneurysm Following Splenic Infarction in a Patient with Infective Endocarditis. Int Med Case Rep J 18, 1093–1097 (2025). [CrossRef]
- Podolsky, M. I. et al. Factors Associated With Semaglutide Initiation Among Adults With Obesity. JAMA Netw Open 8, e2455222 (2025). [CrossRef]
- Rodriguez, P. J. et al. Discontinuation and reinitiation of dual-labeled GLP-1 receptor agonists among US adults with overweight or obesity. JAMA Netw. Open 8, e2457349 (2025). [CrossRef]
- Nelson, S. J. et al. Are ICD codes reliable for observational studies? Assessing coding consistency for data quality. Digit Health 10, 20552076241297056 (2024). [CrossRef]
- Paleczny, S., Osagie, N., Sethi, J. & Cusimano, M. Validity and reliability International Classification of Diseases-10 codes for all forms of injury: A systematic review. PLoS One 19, e0298411 (2024). [CrossRef]
- Murugadoss, K. et al. Building a best-in-class automated de-identification tool for electronic health records through ensemble learning. Patterns 2(6):100255 (2021). [CrossRef]
- Murugadoss, K et al. Scaling text de-identification using locally augmented ensembles. medRxiv 24308896 (2024).
Figure 1.
Cohort funnel for sustained lowest-dose semaglutide as a real-world proxy for microdosing. The diagram summarizes sequential semaglutide cohort restriction, the branch into whole-body matched comparator analyses, and the branch into the sustained lowest-dose tirzepatide head-to-head matched cohort.
Figure 1.
Cohort funnel for sustained lowest-dose semaglutide as a real-world proxy for microdosing. The diagram summarizes sequential semaglutide cohort restriction, the branch into whole-body matched comparator analyses, and the branch into the sustained lowest-dose tirzepatide head-to-head matched cohort.
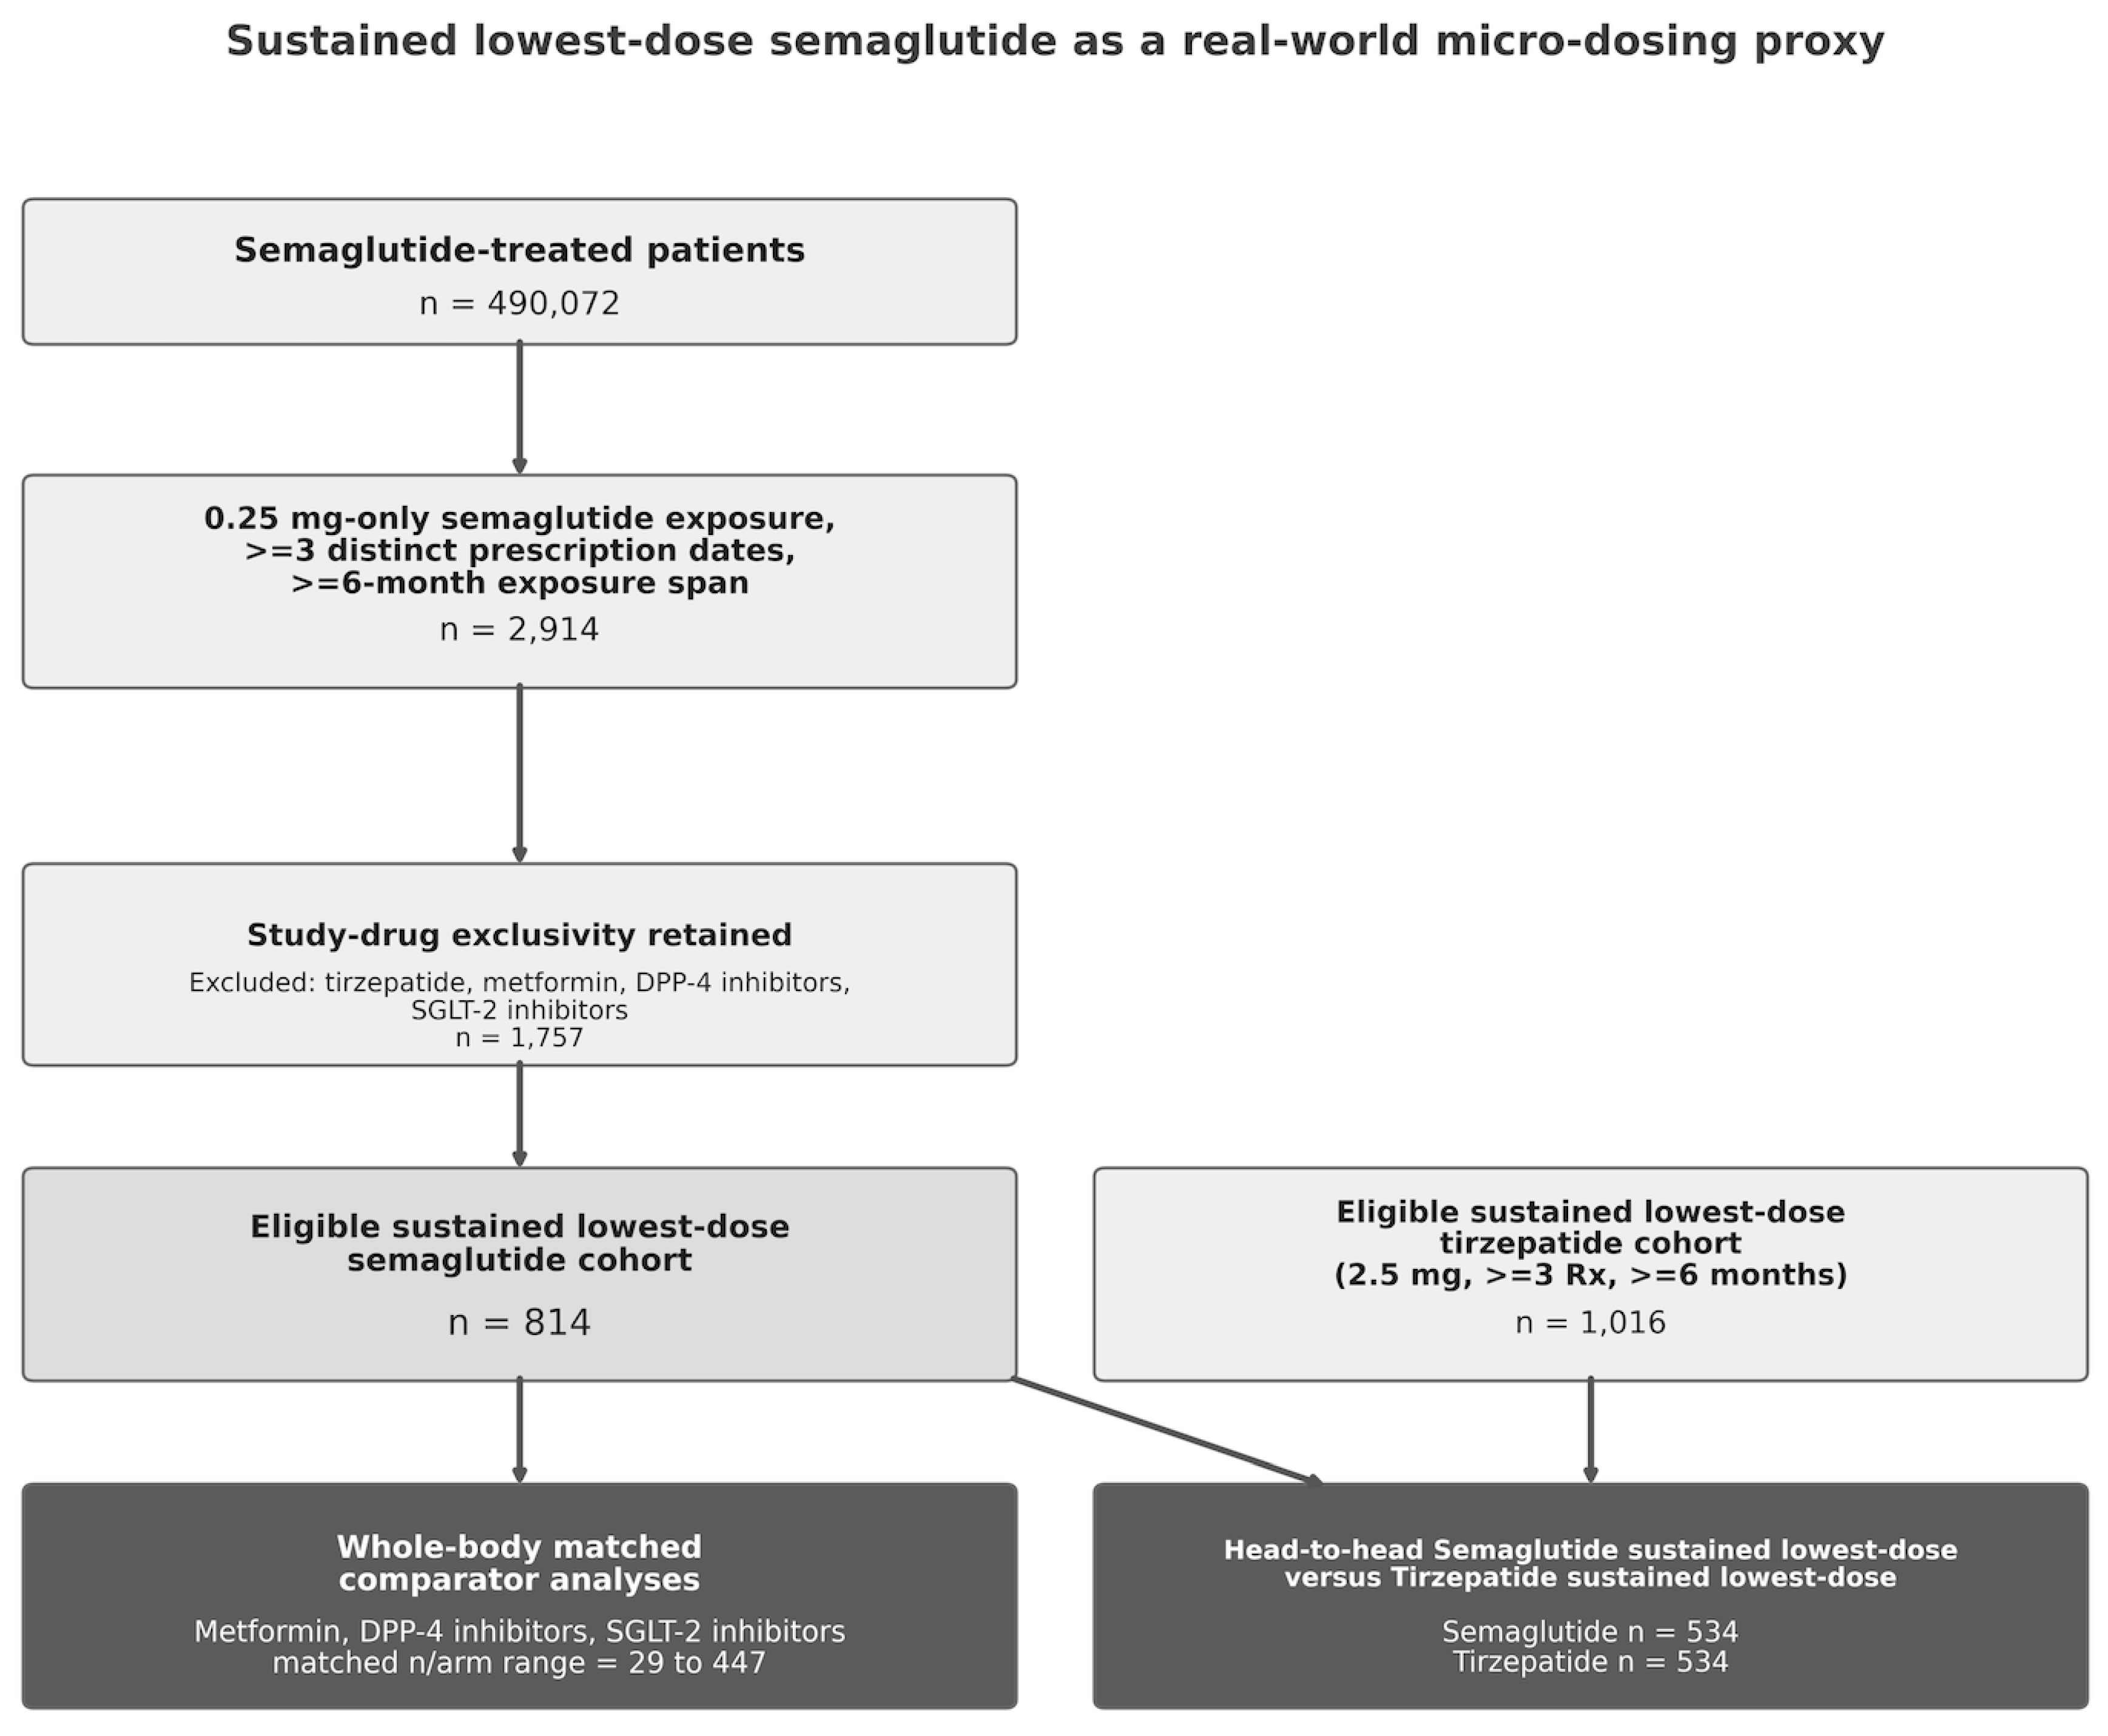
Figure 2.
Matched semaglutide-versus-tirzepatide structured-outcome Kaplan-Meier panels. Head-to-head structured outcomes from the sustained-lowest-dose comparison, with semaglutide and tirzepatide cumulative event curves displayed over 24 months; panels were selected based on event burden and log-rank significance and balanced across burden families.
Figure 2.
Matched semaglutide-versus-tirzepatide structured-outcome Kaplan-Meier panels. Head-to-head structured outcomes from the sustained-lowest-dose comparison, with semaglutide and tirzepatide cumulative event curves displayed over 24 months; panels were selected based on event burden and log-rank significance and balanced across burden families.
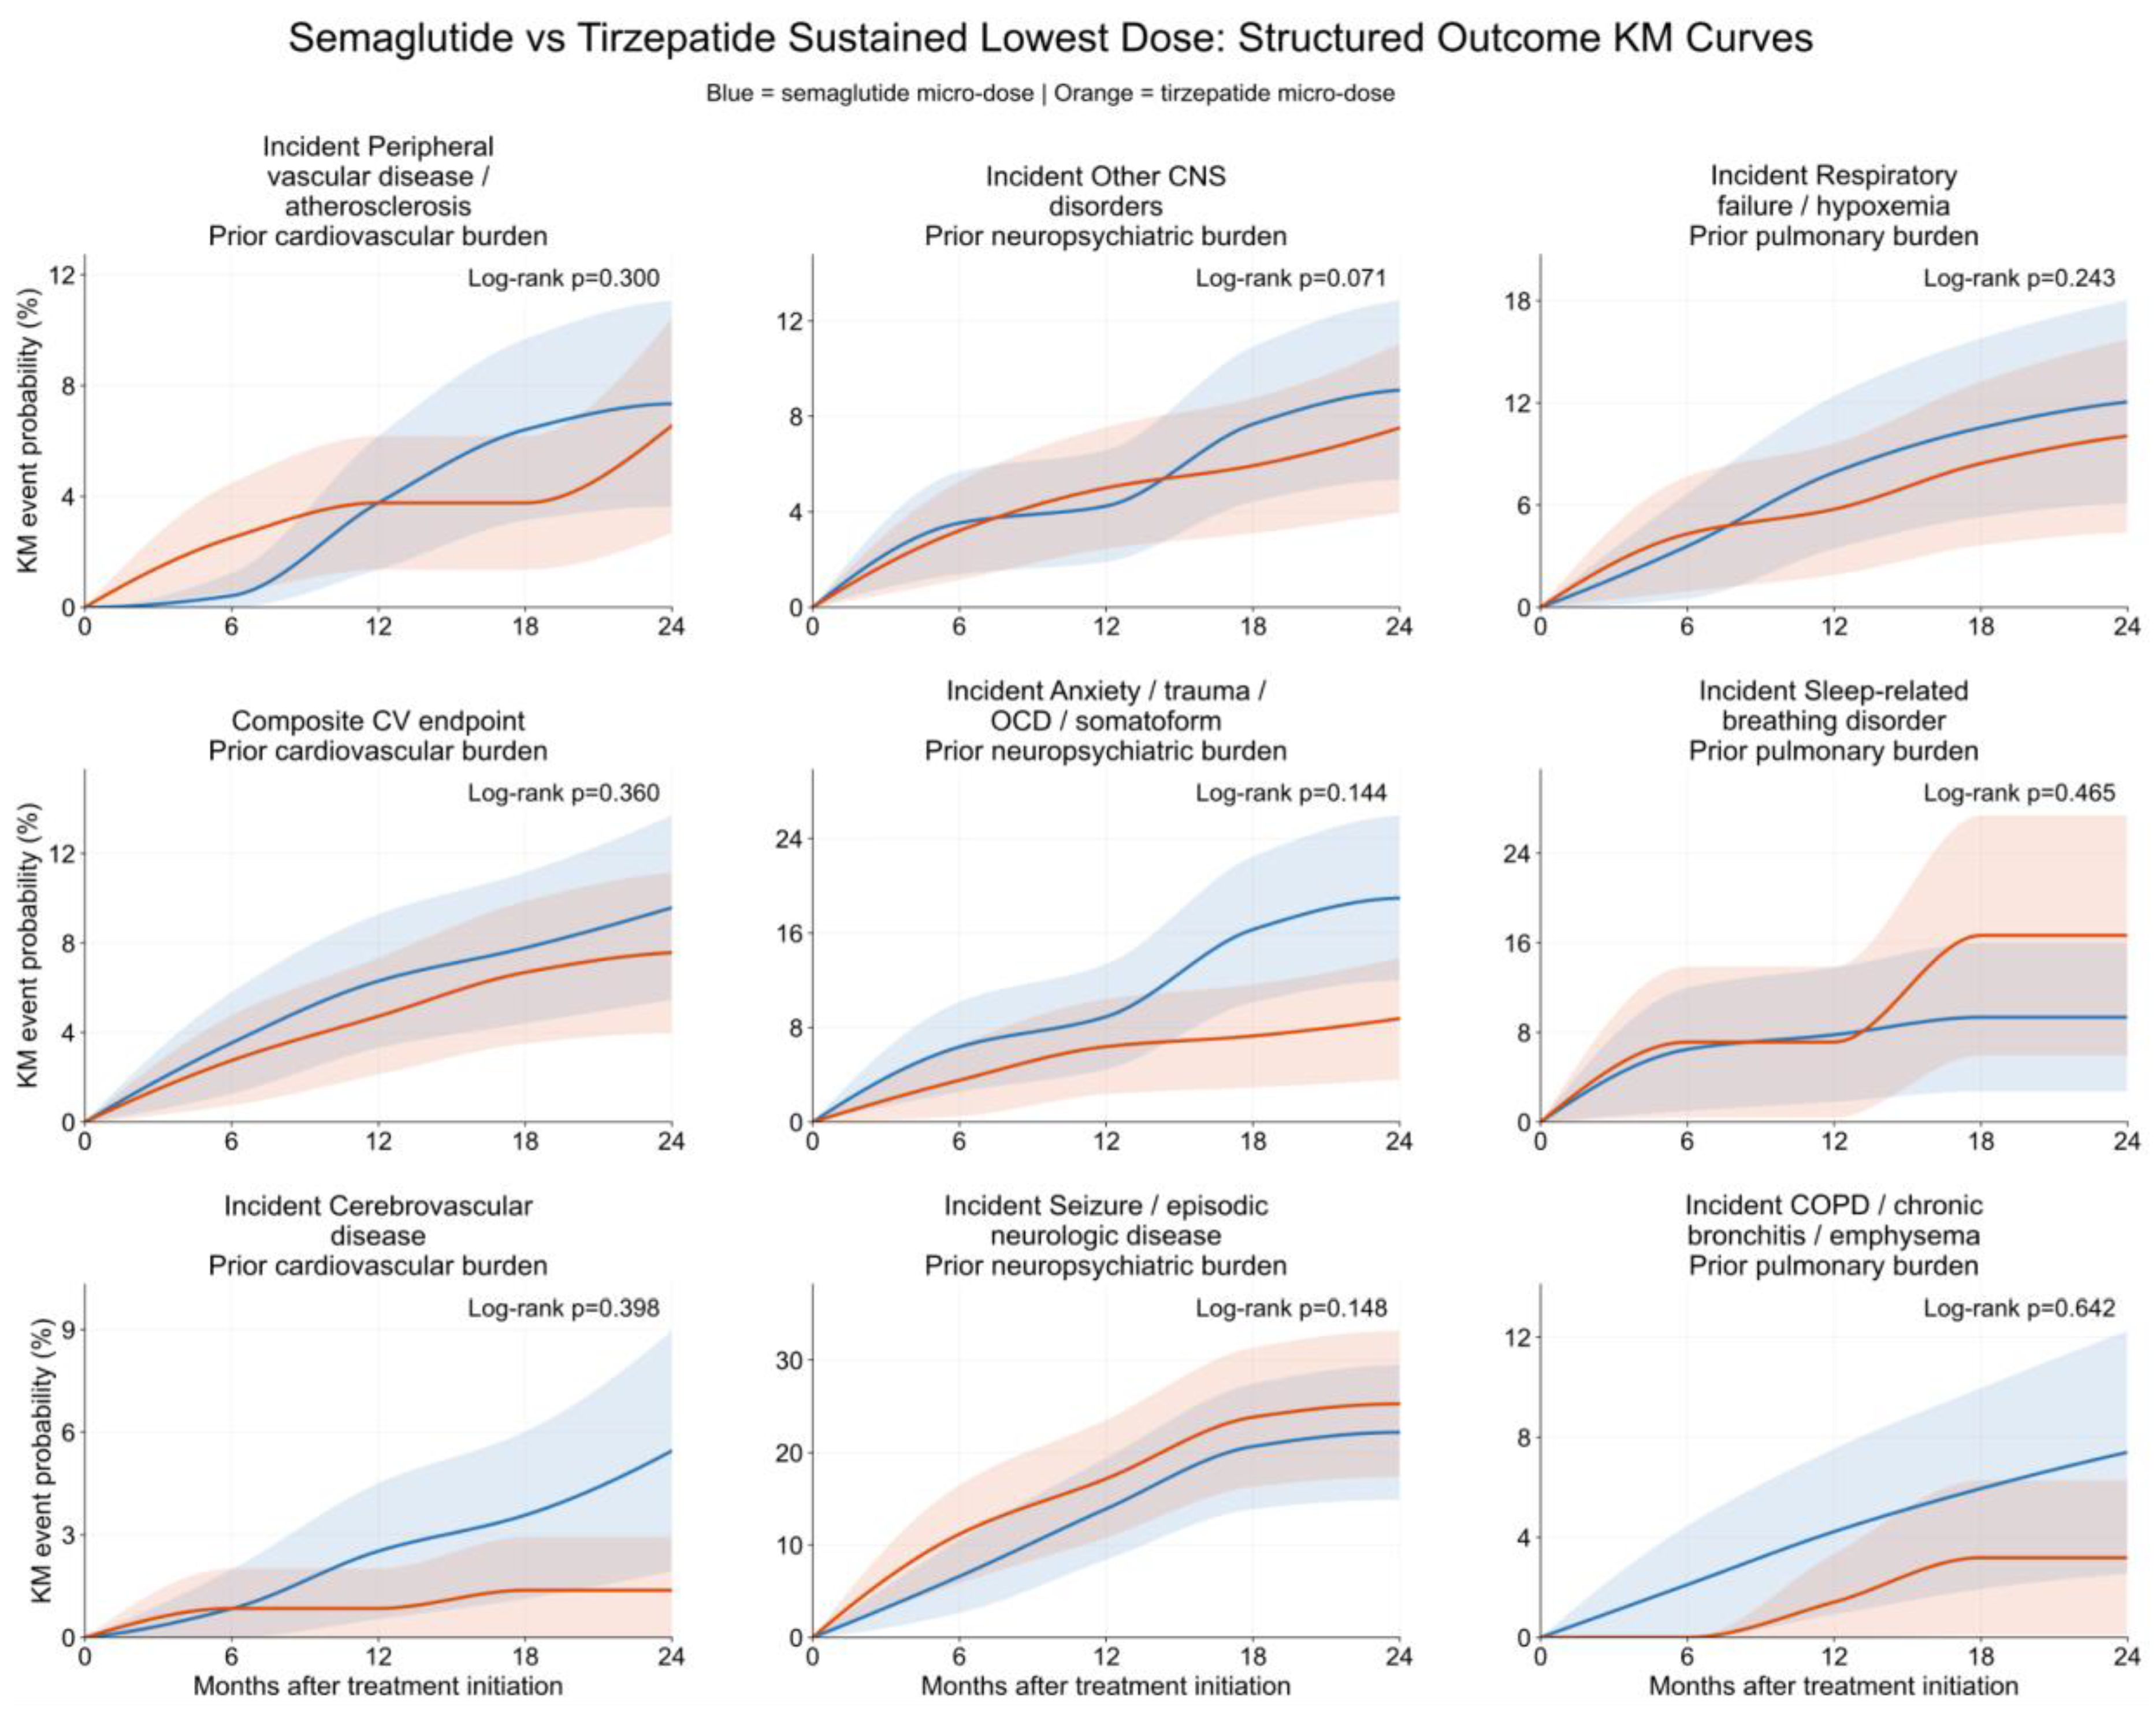
Figure 3.
Matched semaglutide-versus-tirzepatide weight-change trajectories in sustained-lowest-dose cohorts. Post-index weight-change trajectories for the matched semaglutide and tirzepatide sustained-lowest-dose cohorts over 15 months, displayed as percent change from baseline (left) and absolute change in kilograms (right); points represent mean values with standard-error bars at each fixed follow-up window.
Figure 3.
Matched semaglutide-versus-tirzepatide weight-change trajectories in sustained-lowest-dose cohorts. Post-index weight-change trajectories for the matched semaglutide and tirzepatide sustained-lowest-dose cohorts over 15 months, displayed as percent change from baseline (left) and absolute change in kilograms (right); points represent mean values with standard-error bars at each fixed follow-up window.
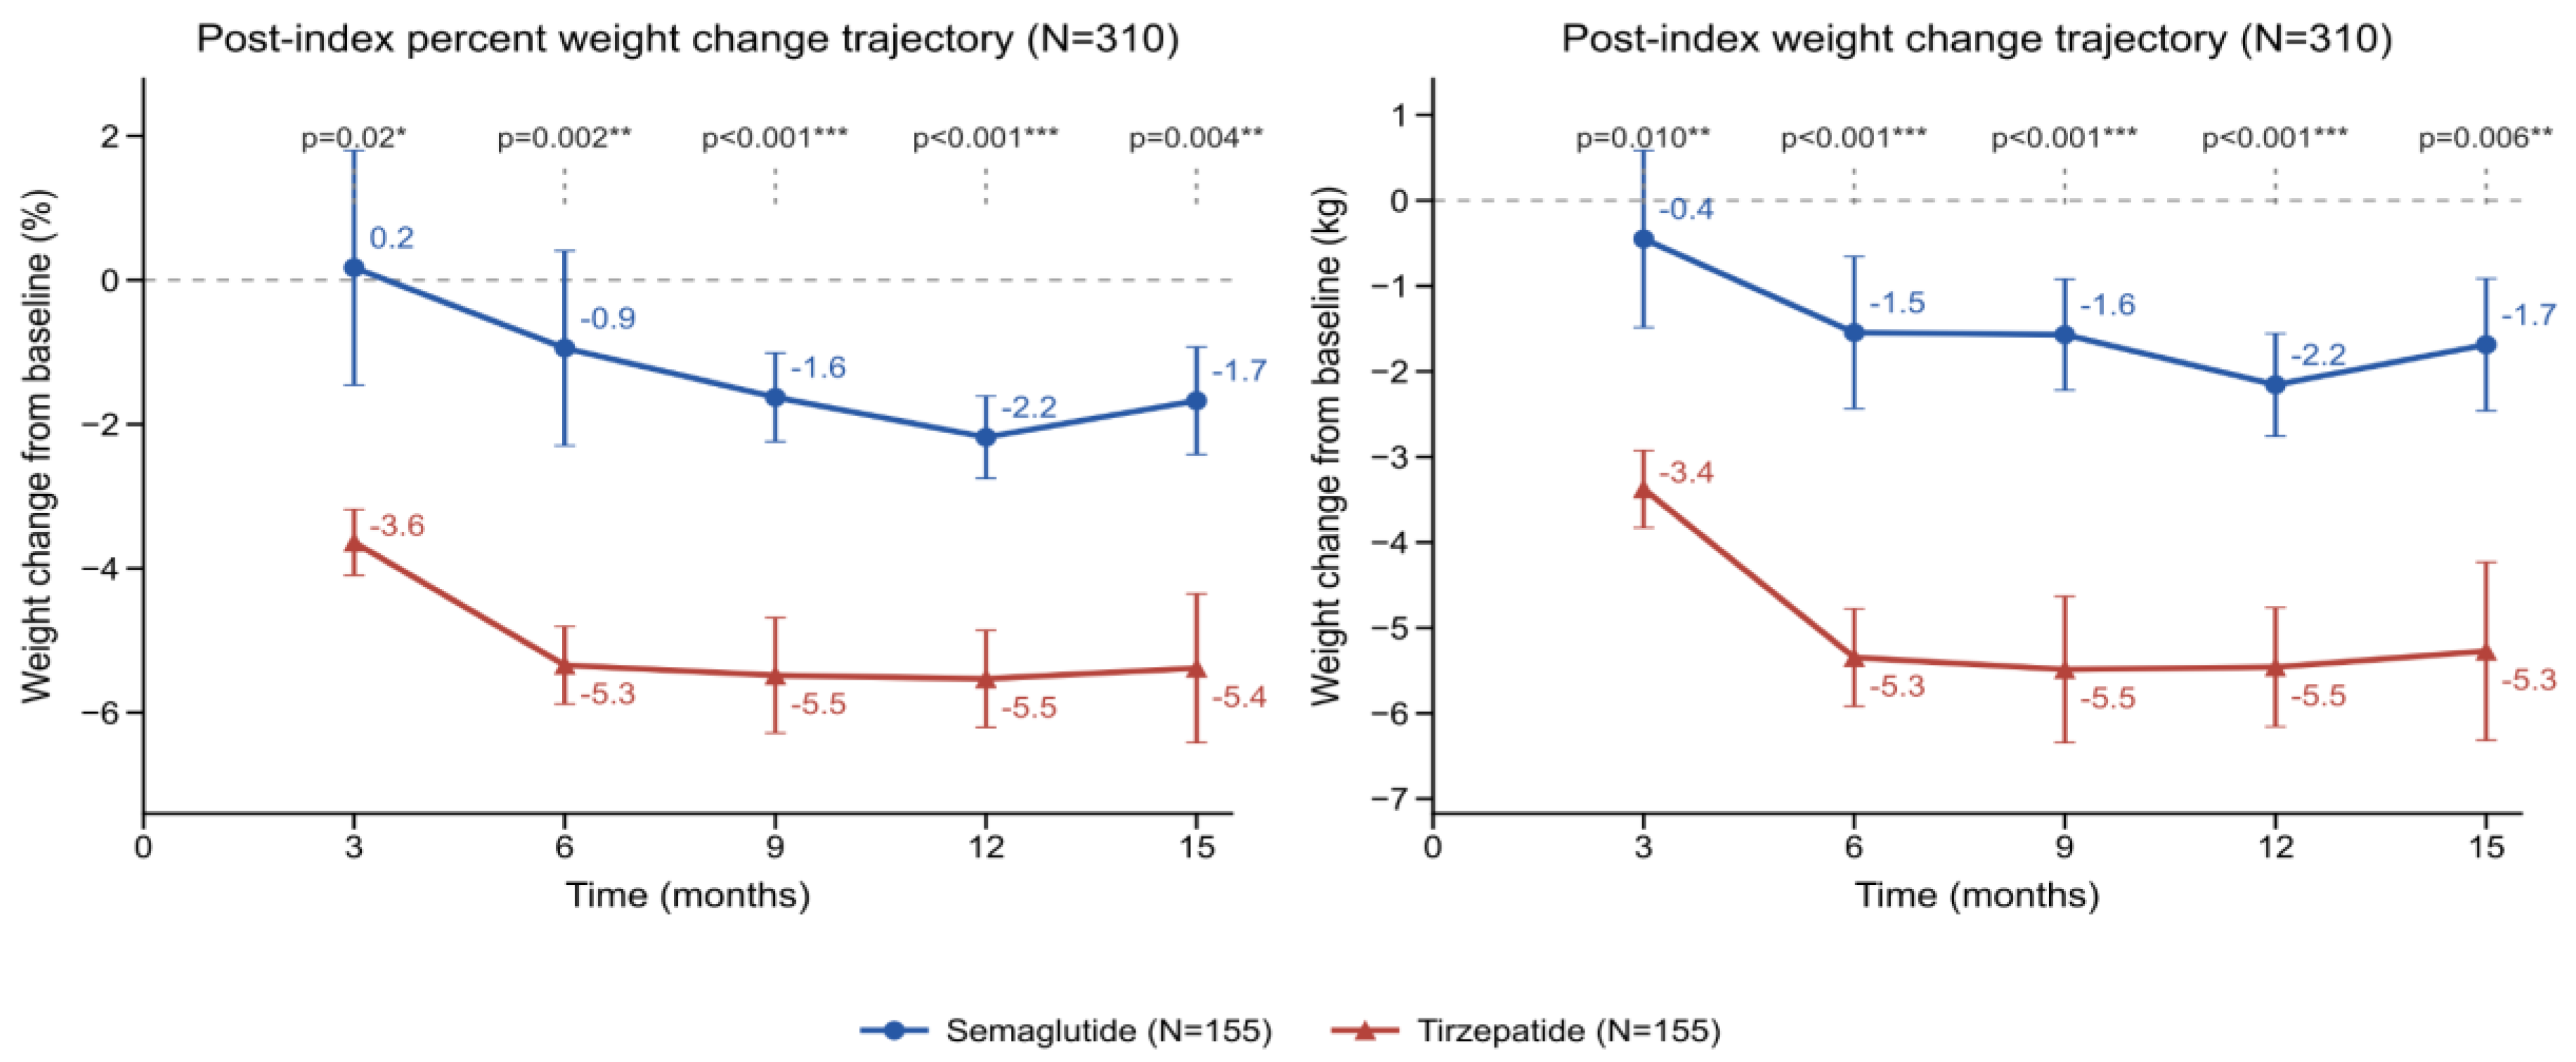
Figure 4.
Matched semaglutide-versus-tirzepatide note-derived adverse-event Kaplan-Meier panels. Head-to-head comparisons, with semaglutide and tirzepatide cumulative event curves displayed over 24 months; panels are ordered by significance and separated by the higher-risk arm.
Figure 4.
Matched semaglutide-versus-tirzepatide note-derived adverse-event Kaplan-Meier panels. Head-to-head comparisons, with semaglutide and tirzepatide cumulative event curves displayed over 24 months; panels are ordered by significance and separated by the higher-risk arm.
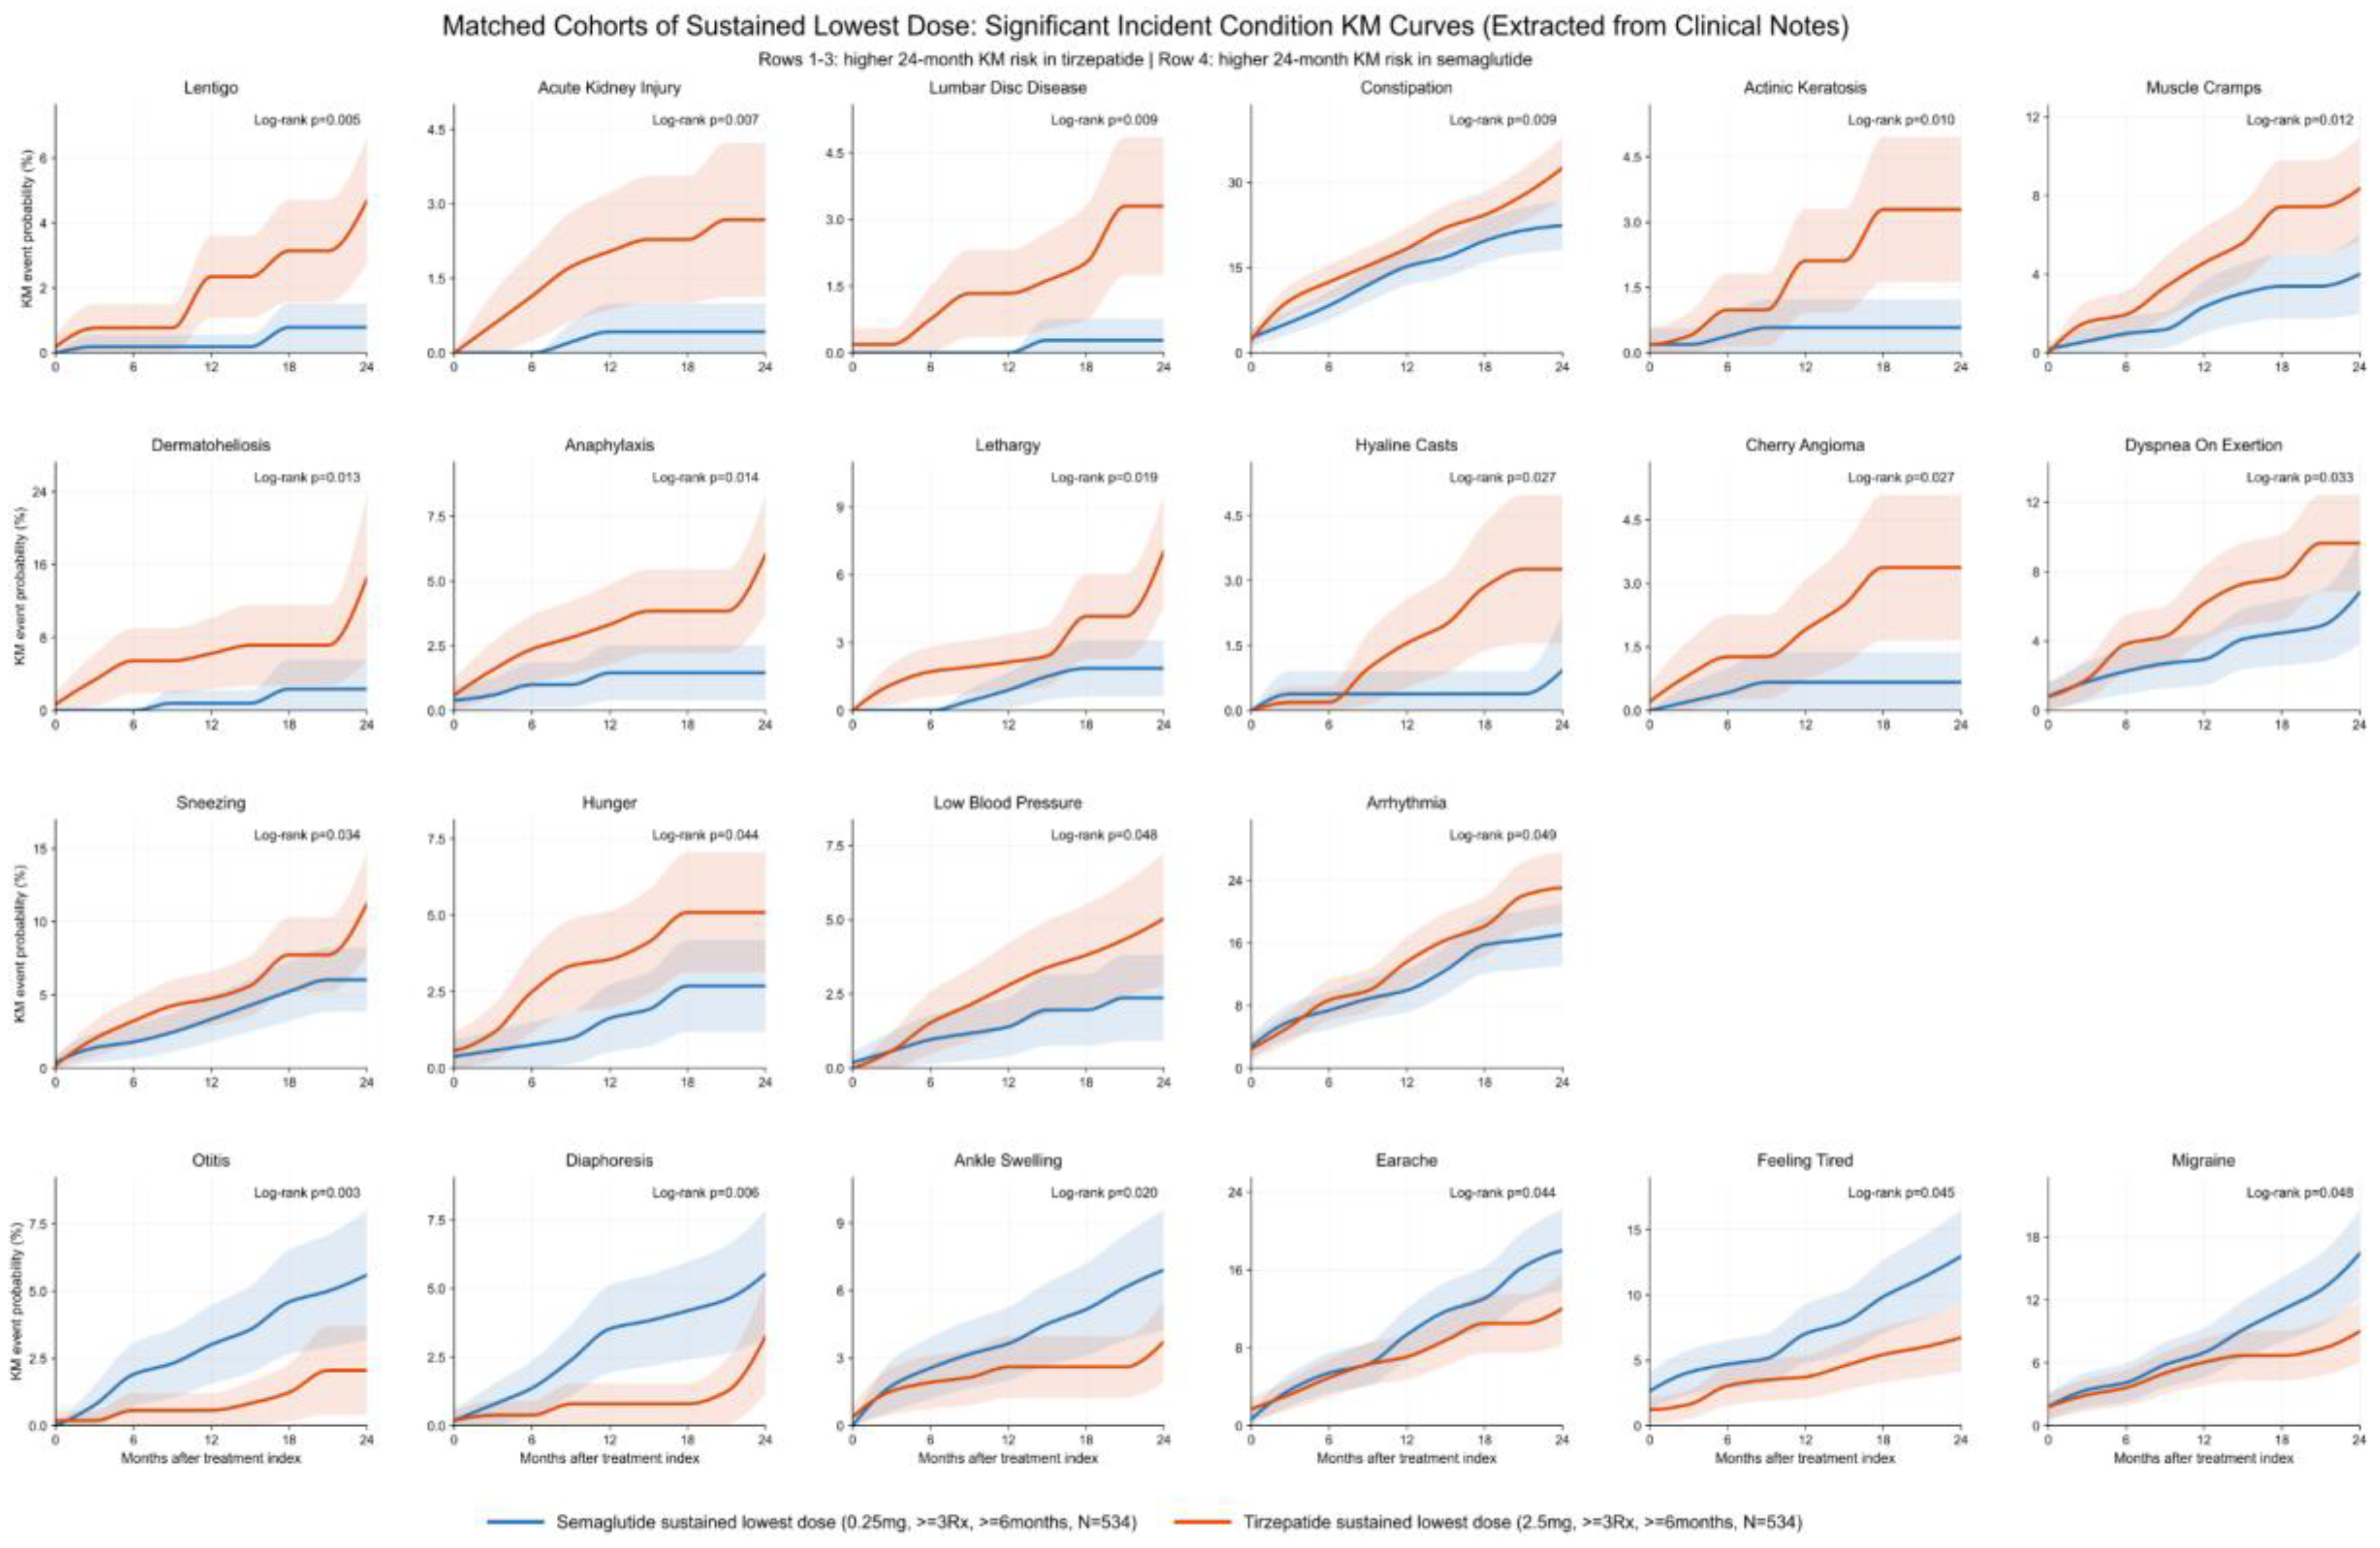
Figure 5.
Semaglutide-versus-tirzepatide mirrored medication-proxy grouped-bar panels across 3-month windows through 24 months. Each panel summarizes pre-to-post prevalence change for a clinically linked medication-proxy group; semaglutide and tirzepatide are shown side-by-side, significance stars indicate within-arm McNemar results, and bold panel titles indicate directional concordance with the linked note-derived signal.
Figure 5.
Semaglutide-versus-tirzepatide mirrored medication-proxy grouped-bar panels across 3-month windows through 24 months. Each panel summarizes pre-to-post prevalence change for a clinically linked medication-proxy group; semaglutide and tirzepatide are shown side-by-side, significance stars indicate within-arm McNemar results, and bold panel titles indicate directional concordance with the linked note-derived signal.
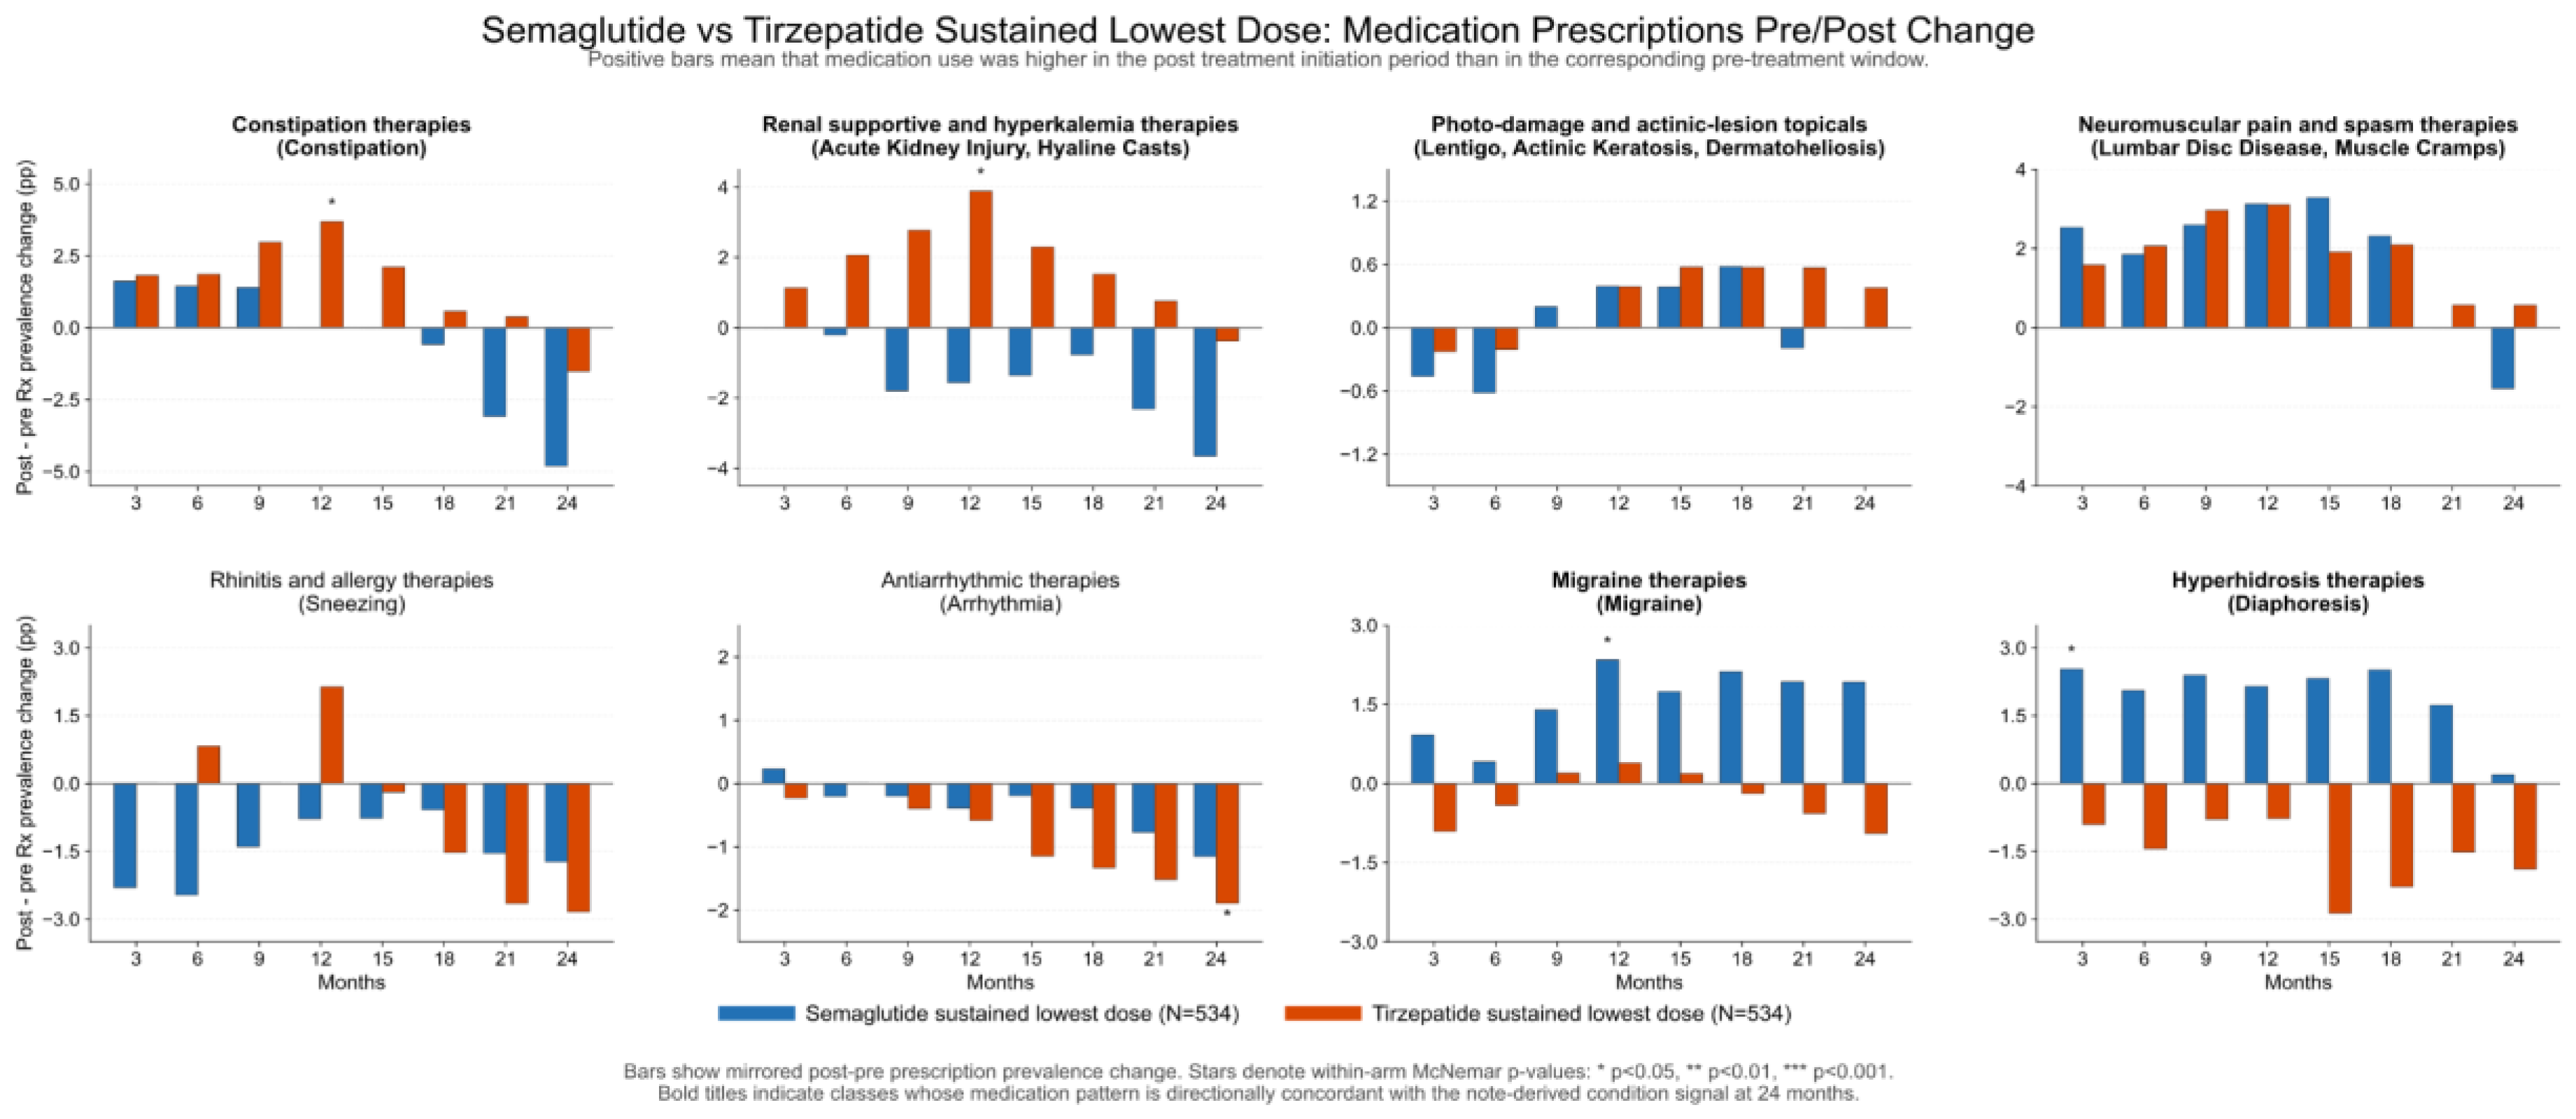
Figure 6.
Six-month whole-body burden-family heatmap comparing sustained lowest-dose semaglutide with matched metformin, DPP-4 inhibitor, and SGLT-2 inhibitor cohorts across cardiovascular, neuropsychiatric, pulmonary, hepatic, renal, and viral prior-burden families. Each cell shows the signed 6-month difference in approximate Kaplan-Meier event probability (semaglutide minus comparator, percentage points); significance stars denote the log-rank threshold.
Figure 6.
Six-month whole-body burden-family heatmap comparing sustained lowest-dose semaglutide with matched metformin, DPP-4 inhibitor, and SGLT-2 inhibitor cohorts across cardiovascular, neuropsychiatric, pulmonary, hepatic, renal, and viral prior-burden families. Each cell shows the signed 6-month difference in approximate Kaplan-Meier event probability (semaglutide minus comparator, percentage points); significance stars denote the log-rank threshold.
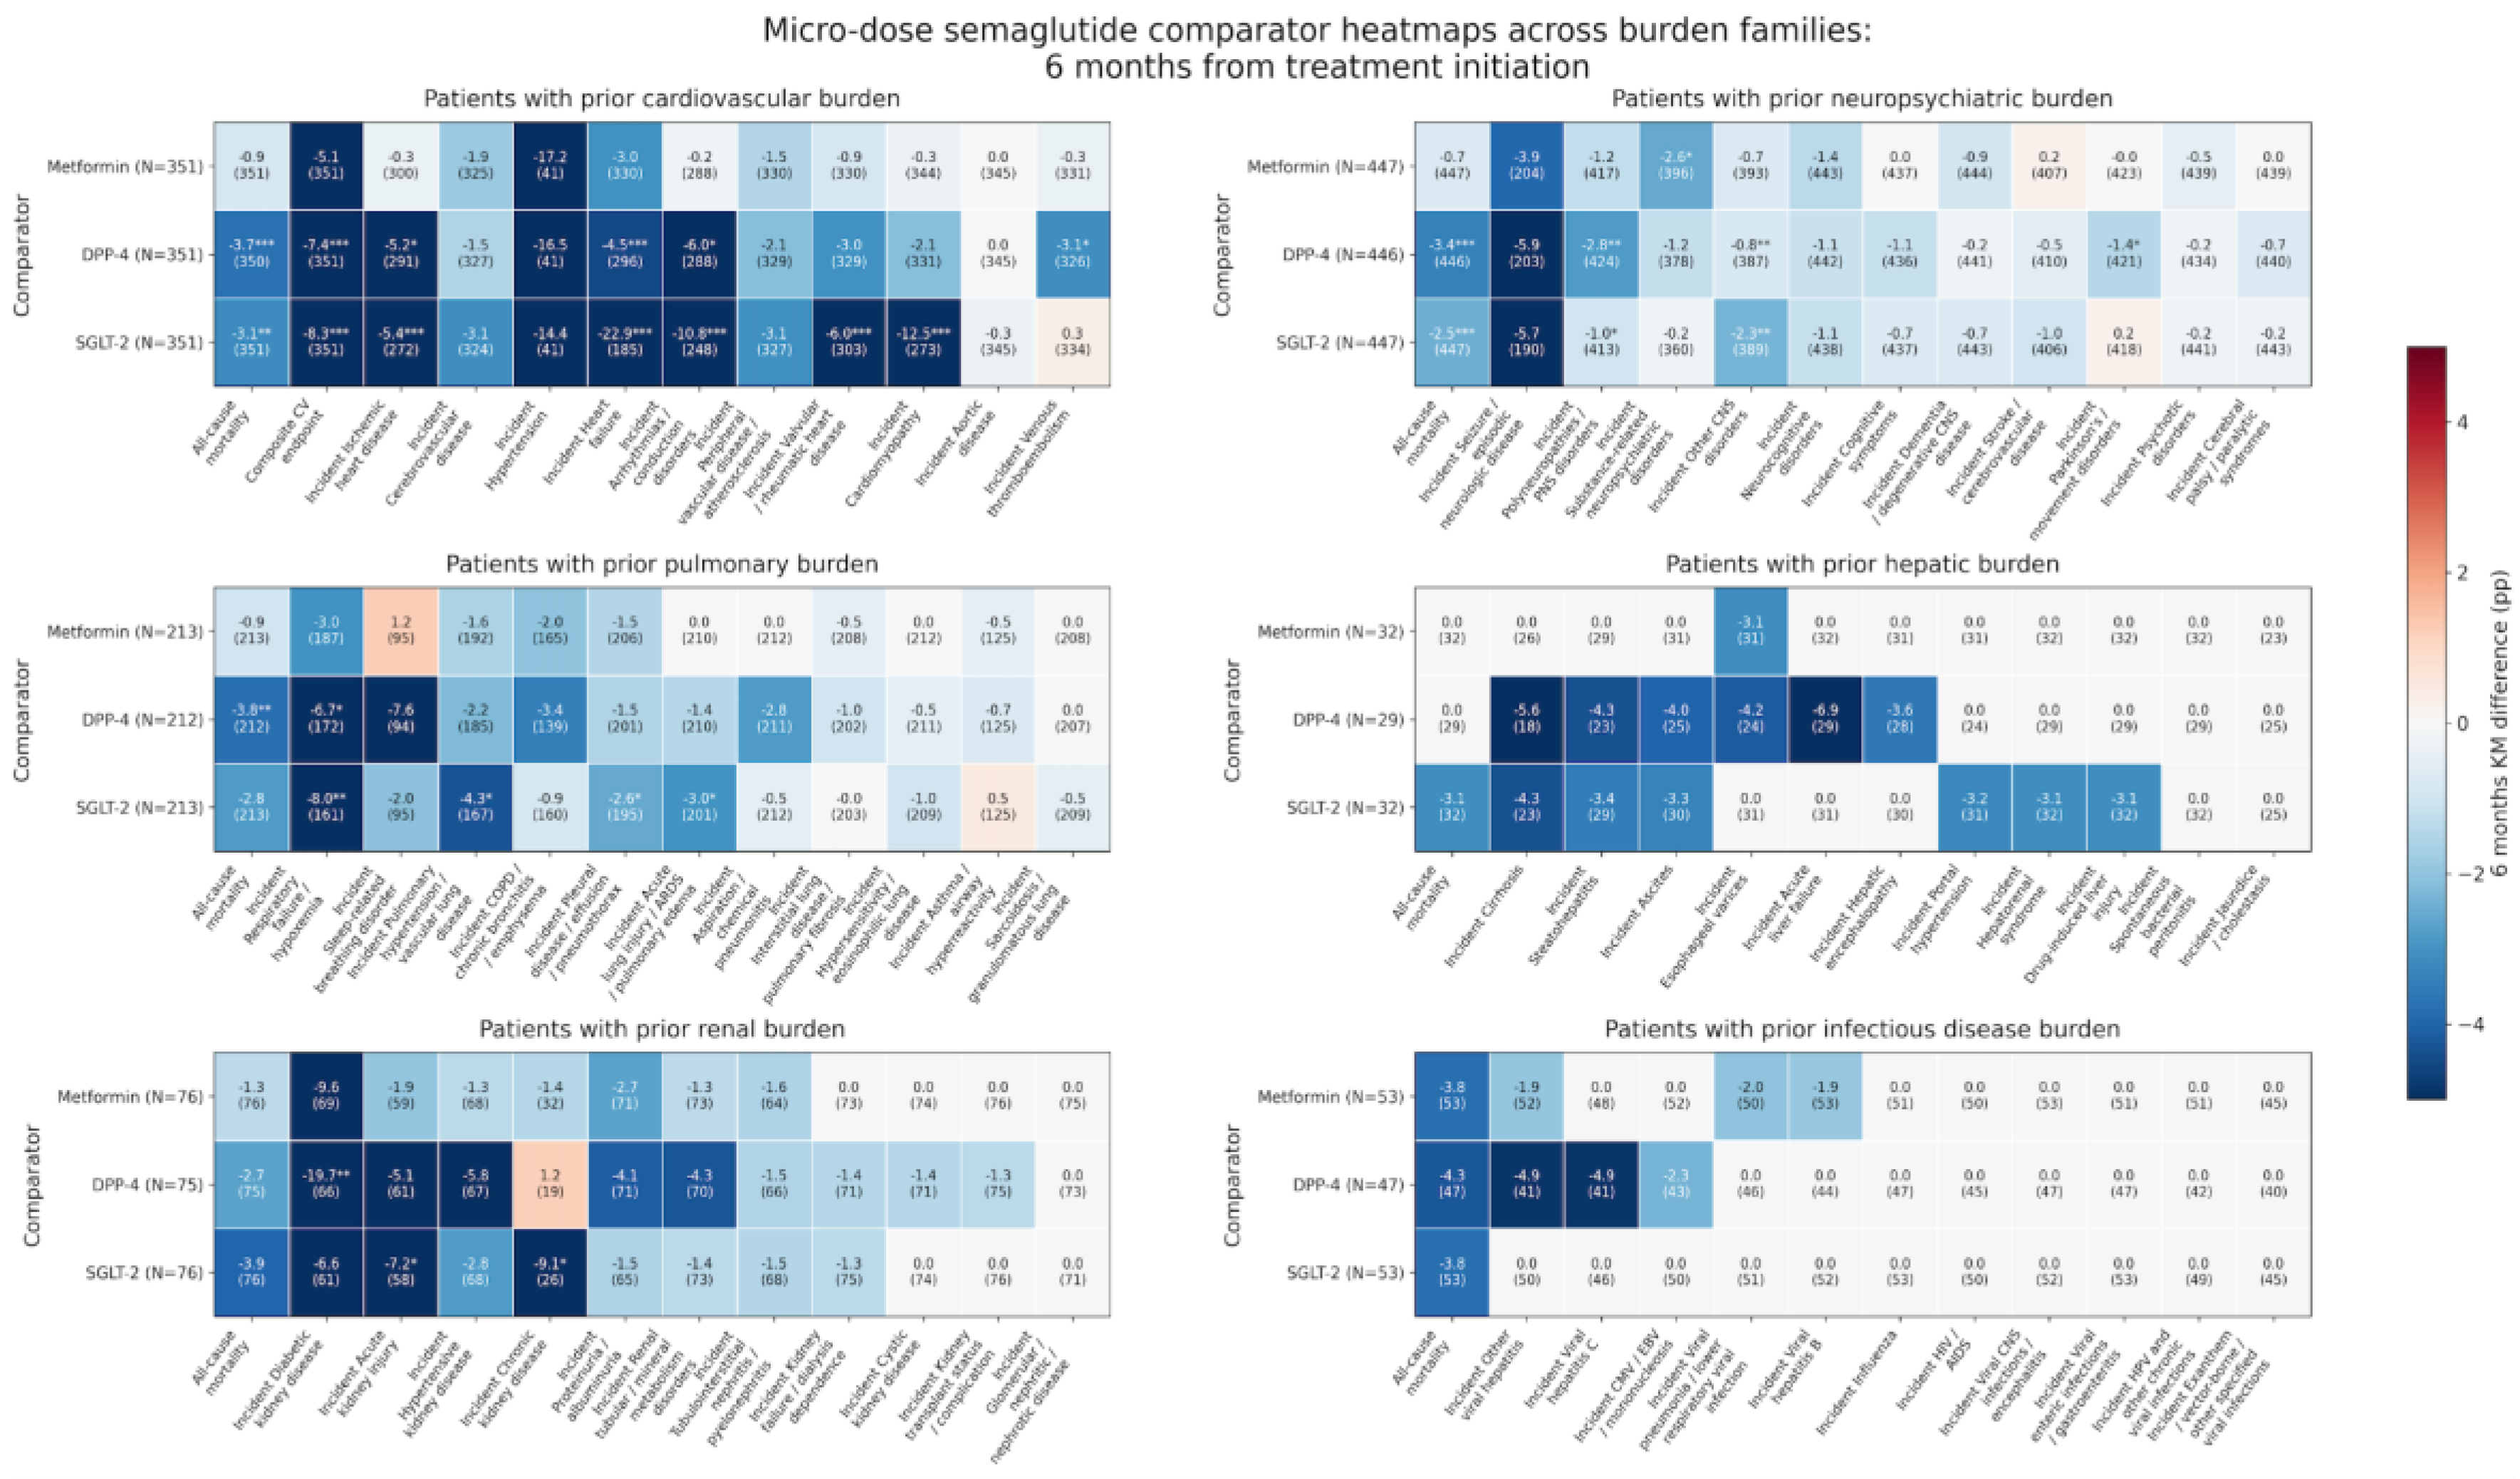
Figure 7.
Representative indication-aligned therapeutic comparator Kaplan-Meier analyses for sustained lowest-dose semaglutide. Kaplan-Meier curves are shown for 9 representative class-level therapeutic comparator analyses selected from the broader indication-aligned comparator framework for sustained lowest-dose semaglutide, used here as a real-world proxy for semaglutide microdosing. Blue denotes semaglutide and orange denotes the matched therapeutic comparator. Each panel represents a separate pairwise 1:1 propensity-matched analysis performed within the relevant pre-existing disease-burden group, using age at index, sex, baseline BMI, and baseline type 2 diabetes as matching covariates. Incident outcome analyses excluded patients with evidence of that same condition before follow-up; therefore, the number at risk differs by outcome. Panels were selected from eligible class-level comparisons with non-zero events in both arms and were prioritized by pooled log-rank p value while retaining representation across disease-burden groups with qualifying signals. Insets report the matched per-arm sample size and pooled log-rank p value. Follow-up is shown through 24 months after treatment initiation.
Figure 7.
Representative indication-aligned therapeutic comparator Kaplan-Meier analyses for sustained lowest-dose semaglutide. Kaplan-Meier curves are shown for 9 representative class-level therapeutic comparator analyses selected from the broader indication-aligned comparator framework for sustained lowest-dose semaglutide, used here as a real-world proxy for semaglutide microdosing. Blue denotes semaglutide and orange denotes the matched therapeutic comparator. Each panel represents a separate pairwise 1:1 propensity-matched analysis performed within the relevant pre-existing disease-burden group, using age at index, sex, baseline BMI, and baseline type 2 diabetes as matching covariates. Incident outcome analyses excluded patients with evidence of that same condition before follow-up; therefore, the number at risk differs by outcome. Panels were selected from eligible class-level comparisons with non-zero events in both arms and were prioritized by pooled log-rank p value while retaining representation across disease-burden groups with qualifying signals. Insets report the matched per-arm sample size and pooled log-rank p value. Follow-up is shown through 24 months after treatment initiation.
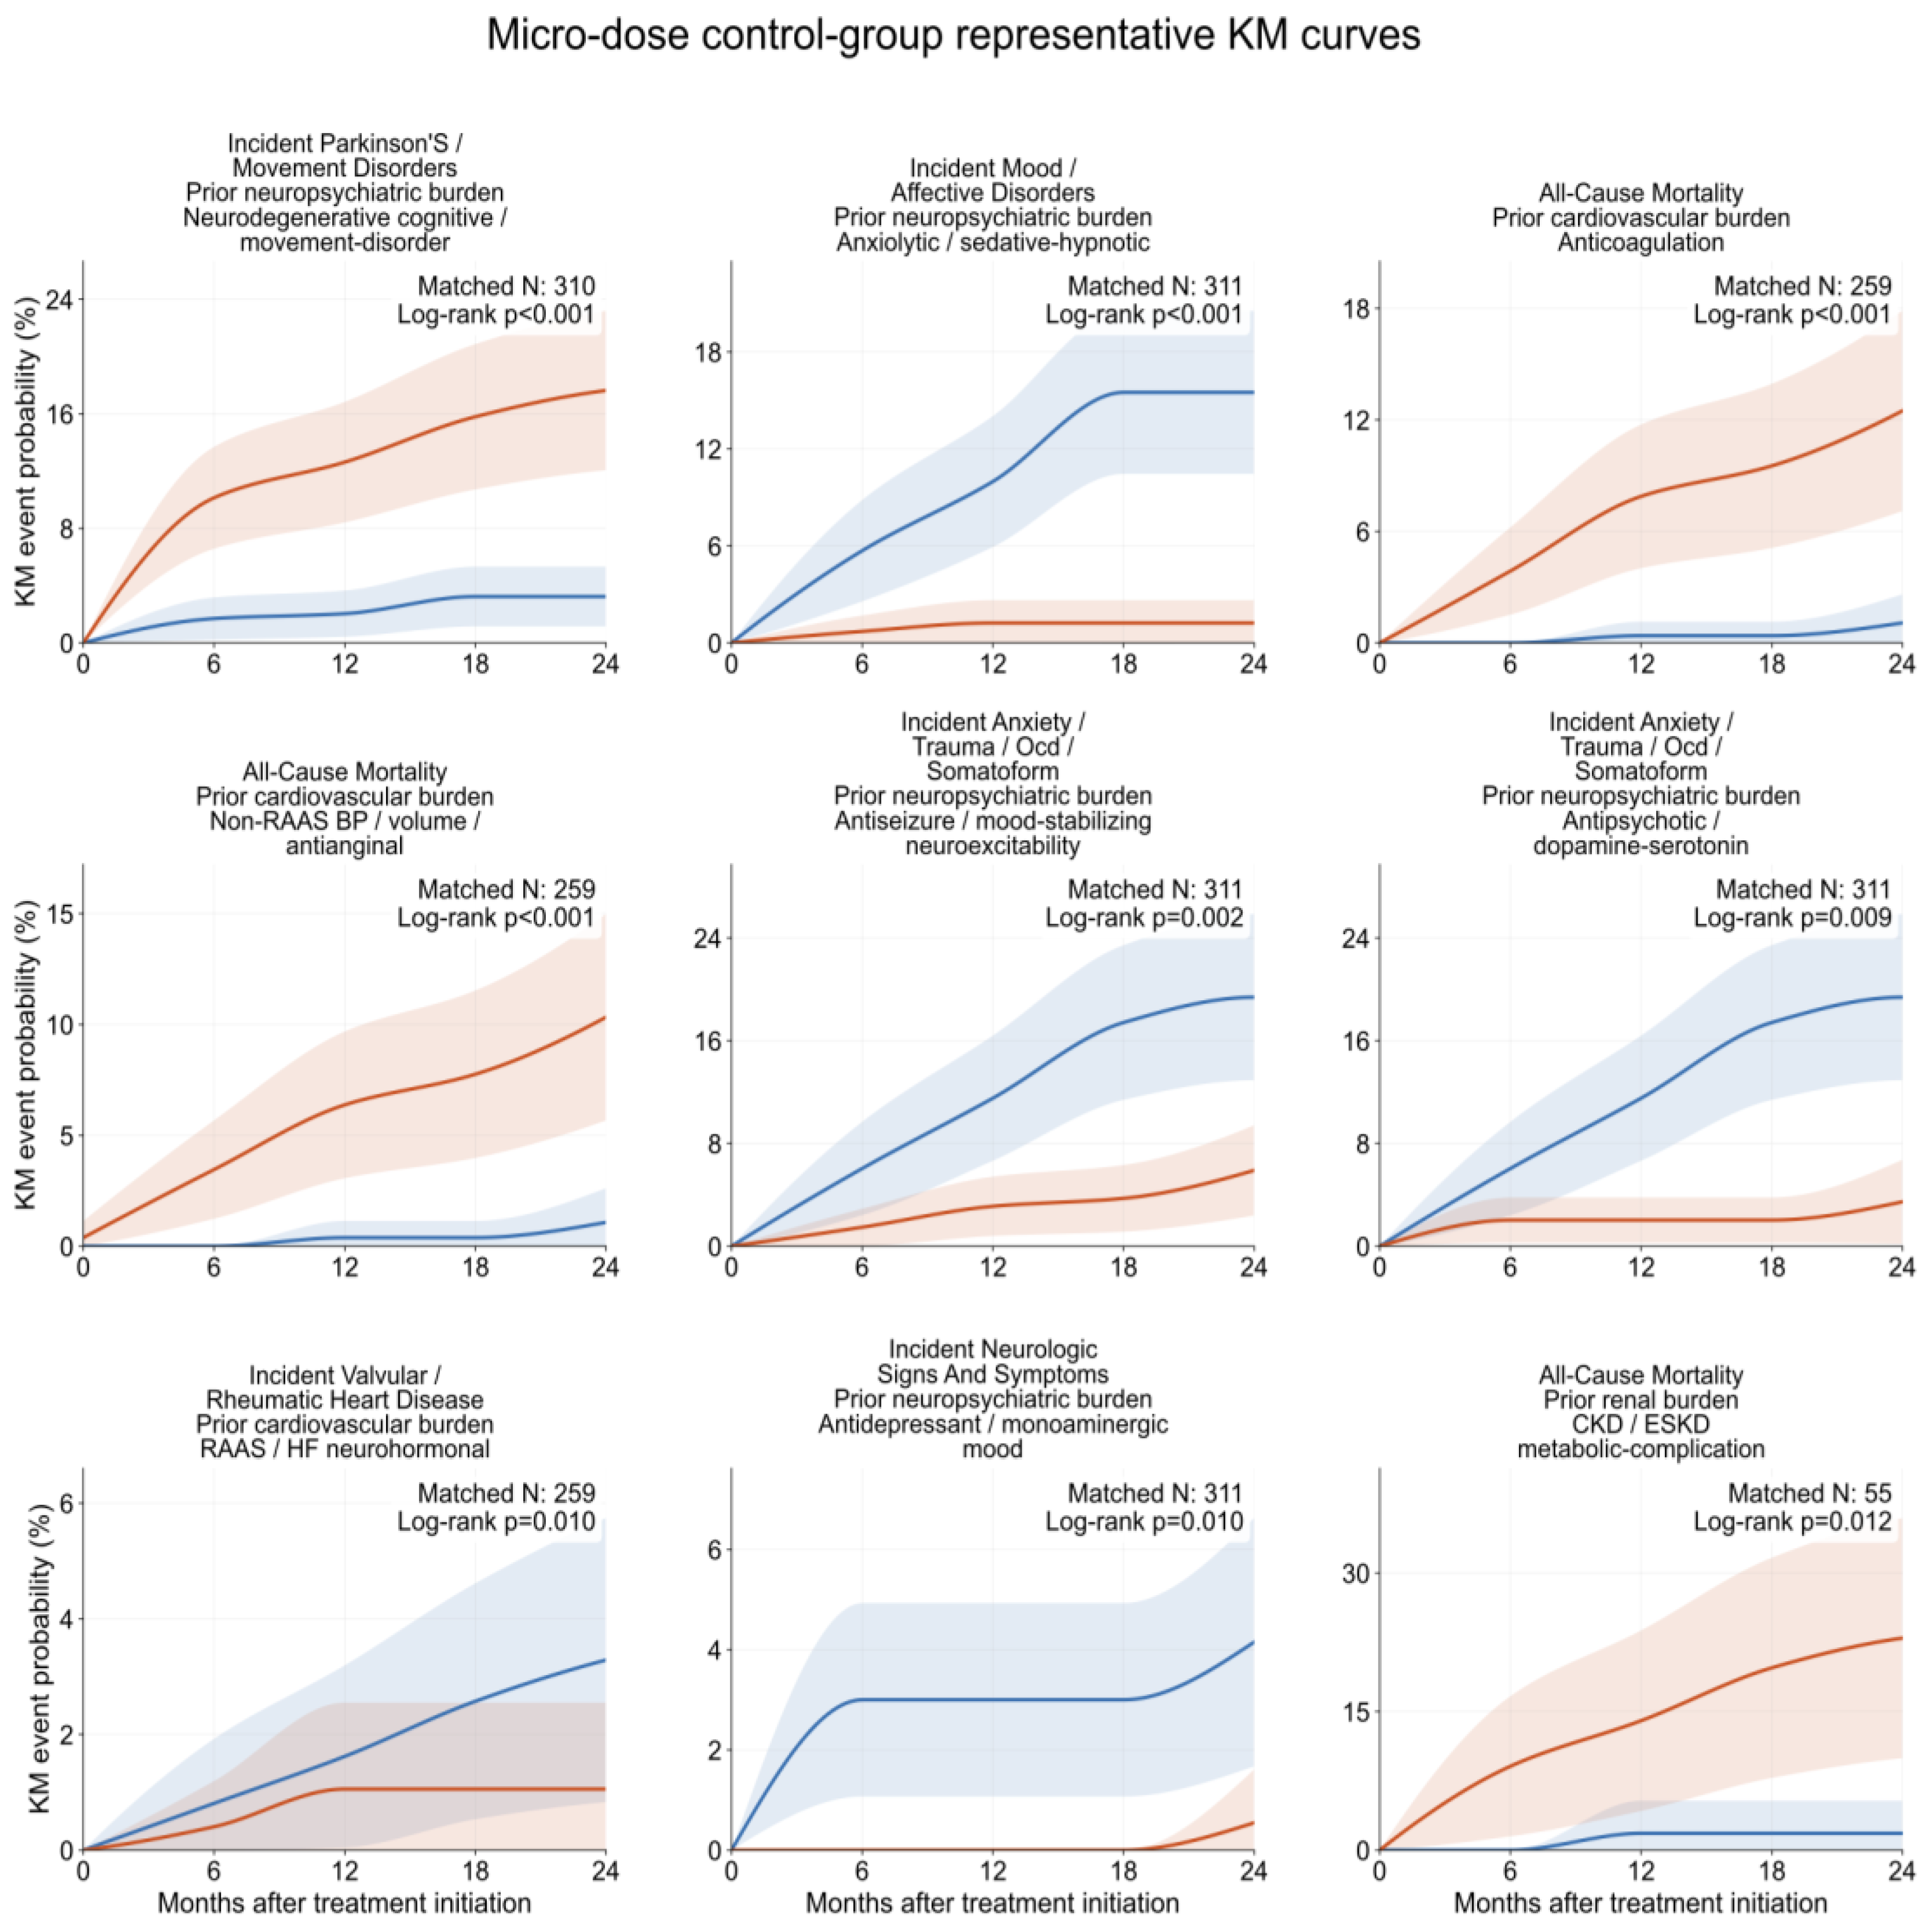

Table 1.
Final matched characteristics for the semaglutide-versus-tirzepatide sustained lowest-dose comparison. The table reports post-match age, female sex, baseline BMI, baseline type 2 diabetes, and index year distributions for the final head-to-head cohort.
Table 1.
Final matched characteristics for the semaglutide-versus-tirzepatide sustained lowest-dose comparison. The table reports post-match age, female sex, baseline BMI, baseline type 2 diabetes, and index year distributions for the final head-to-head cohort.
| Characteristic | Semaglutide (n=534) | Tirzepatide (n=534) |
|---|---|---|
| Age, mean (SD), y | 49.9 (15.2) | 52.9 (13.9) |
| Female sex, n (%) | 393 (73.6%) | 384 (71.9%) |
| Baseline BMI, mean (SD), kg/m² | 37.4 (6.4) | 36.3 (6.3) |
| Baseline type 2 diabetes, n (%) | 37 (6.9%) | 47 (8.8%) |
| Index year, mean (SD) | 2023.6 (0.7) | 2023.6 (0.7) |
Table 2.
Prescription-count and treatment-duration summaries. The table reports the distribution of prescription counts and treatment duration in the overall sustained lowest-dose semaglutide cohort and across matched comparator analyses.
Table 2.
Prescription-count and treatment-duration summaries. The table reports the distribution of prescription counts and treatment duration in the overall sustained lowest-dose semaglutide cohort and across matched comparator analyses.
| Population / arm | N represented | Prescription count median [IQR] | Duration, d median [IQR] |
|---|---|---|---|
| Overall semaglutide sustained lowest-dose cohort | 814 | 3 [3 to 4] | 371 [266 to 540] |
| Semaglutide across matched comparator analyses | 3,504 | 3 [3 to 4] | 375.5 [280 to 545] |
| Metformin across matched comparator analyses | 729 | 4 [2 to 10] | 680 [233.5 to 1642.5] |
| DPP-4 inhibitors across matched comparator analyses | 444 | 4 [2 to 8.2] | 356.5 [56 to 804] |
| SGLT-2 inhibitors across matched comparator analyses | 700 | 5 [3 to 9] | 339 [89.5 to 706] |
Table 3.
Top 10 non-semaglutide medication signals in the overall semaglutide within-cohort screen. The table lists the leading window-heterogeneity medication signals with baseline prevalence, peak prevalence, prevalence in each prespecified window, and heterogeneity p and q values.
Table 3.
Top 10 non-semaglutide medication signals in the overall semaglutide within-cohort screen. The table lists the leading window-heterogeneity medication signals with baseline prevalence, peak prevalence, prevalence in each prespecified window, and heterogeneity p and q values.
| Medication | Baseline prevalence (%) | Peak prevalence (%) | 0 to 6 months: prevalence (%) | 6 to 12 months: prevalence (%) | 12 to 18 months: prevalence (%) | 18 to 24 months: prevalence (%) | Heterogeneity p value | Heterogeneity q value |
|---|---|---|---|---|---|---|---|---|
| ondansetron | 11.43% | 18.78% | 16.71% | 15.54% | 18.78% | 17.41% | 0.003 | 0.94 |
| erythromycin | 0.49% | 2.39% | 0.49% | 0.62% | 1.58% | 2.39% | 0.008 | 0.94 |
| lactobacillus acidophilus | 0.00% | 0.90% | 0.12% | 0.15% | 0.90% | 0.00% | 0.009 | 0.94 |
| droperidol | 0.00% | 1.13% | 0.12% | 0.31% | 1.13% | 0.34% | 0.009 | 0.94 |
| phentermine | 5.28% | 9.58% | 9.58% | 6.62% | 6.56% | 8.87% | 0.011 | 0.94 |
| estradiol | 2.09% | 5.46% | 4.05% | 5.08% | 4.98% | 5.46% | 0.015 | 0.94 |
| armodafinil | 0.00% | 0.45% | 0.00% | 0.00% | 0.45% | 0.00% | 0.02 | 0.94 |
| lanolin | 0.00% | 0.45% | 0.00% | 0.00% | 0.45% | 0.00% | 0.02 | 0.94 |
| triazolam | 0.00% | 0.45% | 0.00% | 0.00% | 0.45% | 0.00% | 0.02 | 0.94 |
| benzocaine | 0.25% | 0.90% | 0.00% | 0.15% | 0.90% | 0.00% | 0.023 | 0.94 |
Table 4.
Top 10 clinically interpretable procedure signals in the overall semaglutide within-cohort screen. The table lists curated procedure heterogeneity signals with normalized labels, baseline prevalence, peak prevalence, window-specific prevalence, heterogeneity p values, and Benjamini-Hochberg-adjusted q values.
Table 4.
Top 10 clinically interpretable procedure signals in the overall semaglutide within-cohort screen. The table lists curated procedure heterogeneity signals with normalized labels, baseline prevalence, peak prevalence, window-specific prevalence, heterogeneity p values, and Benjamini-Hochberg-adjusted q values.
| Procedure | Baseline prevalence (%) | Peak prevalence (%) | 0 to 6 months: prevalence (%) | 6 to 12 months: prevalence (%) | 12 to 18 months: prevalence (%) | 18 to 24 months: prevalence (%) | Heterogeneity p value | Heterogeneity q value |
|---|---|---|---|---|---|---|---|---|
| Bilateral screening mammography with 3D tomosynthesis | 4.67% | 16.38% | 6.02% | 10.15% | 13.35% | 16.38% | <0.001 | <0.001 |
| Bilateral screening mammography with tomosynthesis (alternate code) | 7.86% | 7.86% | 5.65% | 2.92% | 1.81% | 2.39% | <0.001 | 0.001 |
| Quadrivalent influenza vaccination | 0.98% | 2.95% | 2.95% | 0.46% | 0.00% | 0.34% | <0.001 | 0.006 |
| Trivalent influenza vaccination | 0.61% | 3.85% | 1.35% | 1.54% | 3.85% | 1.37% | <0.001 | 0.403 |
| CTA chest, abdomen, and pelvis with contrast | 0.00% | 0.68% | 0.00% | 0.00% | 0.00% | 0.68% | <0.001 | 0.462 |
| Lipid chemistry profile | 3.93% | 5.04% | 5.04% | 2.77% | 1.58% | 1.02% | 0.001 | 0.546 |
| Comprehensive echocardiography with contrast/strain if indicated | 0.12% | 2.49% | 0.98% | 2.00% | 2.49% | 1.37% | 0.001 | 0.559 |
| Hemoglobin A1c measurement | 9.71% | 11.43% | 11.43% | 8.15% | 6.33% | 4.78% | 0.002 | 0.559 |
| Left diagnostic mammography with 3D tomosynthesis | 0.00% | 1.37% | 0.00% | 0.77% | 0.68% | 1.37% | 0.002 | 0.63 |
| DXA bone density study of the axial skeleton | 0.12% | 1.60% | 1.60% | 0.46% | 0.23% | 1.02% | 0.003 | 0.765 |
Disclaimer/Publisher’s Note: The statements, opinions and data contained in all publications are solely those of the individual author(s) and contributor(s) and not of MDPI and/or the editor(s). MDPI and/or the editor(s) disclaim responsibility for any injury to people or property resulting from any ideas, methods, instructions or products referred to in the content. |
© 2026 by the authors. Licensee MDPI, Basel, Switzerland. This article is an open access article distributed under the terms and conditions of the Creative Commons Attribution (CC BY) license (http://creativecommons.org/licenses/by/4.0/).
Copyright: This open access article is published under a Creative Commons CC BY 4.0 license, which permit the free download, distribution, and reuse, provided that the author and preprint are cited in any reuse.


