

Submitted:
08 June 2026
Posted:
09 June 2026
You are already at the latest version
Preprints on COVID-19 and SARS-CoV-2
Abstract
Respiratory viral infections continue to impose a large burden of hospitalization, organ failure and death, particularly among older adults and people with cardiometabolic disease. Whether prior semaglutide exposure is associated with lower post-infection severity across distinct respiratory viruses remains uncertain. We analyzed de-identified longitudinal electronic health record data from a federated U.S. network spanning more than 29 million patients. Adults with documented COVID-19 or influenza infection were classified by pre-infection semaglutide use versus no prior GLP-1 receptor agonist use and one-to-one propensity matched on demographics, BMI, HbA1c, vaccination status, prior infection status, antiviral use, healthcare utilization extent, several comorbidities, yielding matched cohorts of N=11,238 for COVID-19 and N=3,409 for influenza (flu). In the COVID-19 cohort, semaglutide exposure was associated with significantly lower (all P<0.001) 30-day mortality (0.1% vs 0.4%, RR 0.26), hospitalization (4.2% vs 7.2%, RR 0.58), ICU admission (1.0% vs 1.9%, RR 0.52), mechanical ventilation (0.4% vs 0.8%, RR 0.49), and the composite of all the outcomes listed (4.4% vs 7.7%, RR 0.57). In the flu cohort, semaglutide use was also associated (all P≤0.03) with significantly lower hospitalization (4.4% vs 7.8%, RR 0.57), ICU admissions (1.3% vs 1.9%, RR 0.67), mechanical ventilation (0.3% vs 0.6%, RR 0.43), and the composite outcome (4.5% vs 8.1%, RR 0.56). Significant risk reductions (all P<0.005) were also observed for acute coronary syndrome (COVID-19 RR 0.55; flu RR 0.42), acute respiratory failure (COVID-19 RR 0.63; flu RR 0.45), and acute kidney injury (COVID-19 RR 0.56; flu RR 0.54) in the 30-day observation period. Within the COVID-19 cohort, across both the full study period (vaccinated: RR, 0.54; unvaccinated: RR, 0.58) and specifically during the pandemic period ending May 11, 2023 (vaccinated: RR, 0.63; unvaccinated: RR, 0.59), prior semaglutide exposure was associated with significantly (p<0.01) and comparably lower composite COVID-19 severity, suggesting a public-health signal that may complement vaccination in documented recently vaccinated patients while also identifying a potentially scalable risk-reduction strategy for patients without documented recent vaccination. When restricting to those treated with standard-of-care therapeutics during the COVID-19 pandemic era, semaglutide users had significantly lower (p<0.05) 30-day composite risk among those on metformin (4.8% vs 7.6%; RR 0.64) and among those receiving Paxlovid ±7 days of infection (3.6% vs 10.1%; RR 0.35). Among those initiating corticosteroids ±7 days of infection, mortality and ICU admission were numerically lower but not statistically significant. Among the influenza cohort, semaglutide-associated composite risk reduction was comparable across vaccination strata (unvaccinated: RR, 0.56; vaccinated: RR, 0.59), suggesting a complementary public-health signal for reducing seasonal influenza severity both after documented vaccination and among patients without documented recent flu vaccination. Notably, semaglutide significantly reduced (P<0.01) composite risk even among adults aged ≥65 years for both COVID-19 (7.9% vs 11.8%; RR 0.67) and influenza (11.8% vs 16.2%; RR 0.73). Finally, composite risk did not vary significantly across pre-infection weight loss strata of <5%, 5–15%, and ≥15% for COVID (P=0.89) or flu (P=0.54), or across dosage strata of 0.25–0.5, 1.0, and 1.7–2.4 mg/week for COVID (P=0.50) or flu (P=0.32), suggesting semaglutide associated COVID and Flu protection may not require substantial weight loss or maximal dosing. Taken together with growing evidence of weight-loss-independent benefits of cardiovascular, renal, pulmonary and neurological systems, this study motivates prospective evaluation of low-dose semaglutide to blunt the severity of respiratory viral infections.
Keywords:
semaglutide
; COVID
; influenza
1. Introduction
Respiratory viral infections, including coronavirus disease 2019 (COVID-19) and seasonal influenza, remain major contributors to global morbidity and mortality.1 A consistent and reproducible observation across pandemics and endemic respiratory viruses is the disproportionate burden of severe disease among individuals with underlying metabolic dysfunction.2,3 Obesity and type 2 diabetes are associated with higher risks of hospitalization, respiratory failure, and death, driven by a combination of chronic low-grade inflammation, impaired innate and adaptive immune responses, endothelial dysfunction, and prothrombotic states.4,5 These pathophysiological features collectively amplify host susceptibility to severe viral illness and complicate recovery.
The intersection between metabolic disease and infectious outcomes has renewed interest in whether therapies targeting metabolic dysfunction may also modify the clinical course of viral infections.6 Among these, glucagon-like peptide-1 receptor agonists (GLP-1RAs) have emerged as a cornerstone of treatment for type 2 diabetes and obesity.7 Semaglutide, a long-acting GLP-1RA, produces substantial improvements in glycemic control, body weight, and cardiometabolic risk factors, and has demonstrated reductions in major adverse cardiovascular events in large randomized trials.8,9 Beyond these established effects, GLP-1 signaling has been implicated in pathways relevant to infection severity, including attenuation of systemic inflammation, modulation of macrophage and T-cell activity, improvement in endothelial function, and potential effects on pulmonary and vascular biology.10
Preclinical and translational studies suggest that GLP-1 receptor activation may dampen inflammatory cytokine signaling and improve tissue resilience under stress conditions.10 Observational clinical data have also hinted at reduced adverse outcomes in patients treated with GLP-1RAs during acute illnesses,11 although findings have been inconsistent and often limited by sample size, heterogeneity in comparator groups, and lack of longitudinal follow-up. Importantly, it remains unclear whether any observed benefit reflects drug-specific mechanisms or broader improvements in metabolic health that are shared across multiple therapeutic classes.
Real-world evidence derived from large-scale electronic health record data provides an opportunity to evaluate these associations in diverse patient populations under routine care conditions. Such analyses can capture longitudinal outcomes across multiple clinically relevant endpoints, including mortality, hospitalization, and escalation of care, while enabling comparisons across different therapeutic contexts. In this study, we evaluated the association between semaglutide use and severity of COVID-19 and influenza in a large, propensity-matched cohort. By focusing on comparisons with patients not receiving GLP-1 receptor agonists, we aimed to assess whether semaglutide use is associated with reduced risk of severe infection. We hypothesized that semaglutide treatment would be associated with lower rates of mortality, hospitalization, and overall disease severity following viral infection in routine clinical practice.
2. Results
2.1. Cohort Eligibility Criteria and Propensity Matching
Cohort derivation is summarized in Figure 1. Across the study period (January 1, 2020 to December 31, 2025), 644,710 adults with a documented COVID-19 infection and 160,456 adults with a documented influenza infection met initial eligibility criteria. Among the eligible COVID-19-infected population, 13,130 patients had ≥2 orders or administrations of semaglutide in the 12 months before the index infection ("exposed"), and 539,154 patients had no prior GLP-1 RA exposure ("comparator"). Among the eligible influenza-infected population, 3,900 patients had exposure to semaglutide and 136,295 patients had no prior GLP-1 RA exposure.
After 1:1 propensity matching on demographic and clinical covariates, the COVID-19 cohorts each comprised 11,238 matched patients and the influenza cohorts each comprised 3,409 matched patients. The majority of covariates were imbalanced before matching, with several variables showing standardized mean differences (SMDs) above 1.0, including type 2 diabetes, HbA1c category, obesity, and BMI category (Table 1). After matching, all variables in both cohorts achieved SMDs below 0.10, indicating baseline balance (Table 2; Figure S1). In the COVID-19 cohort, the proportion of patients aged ≥65 years was 30.5% (semaglutide) vs 33.9% (comparator, SMD 0.081), the proportion with type 2 diabetes was 58.7% (semaglutide) vs 59.4% (comparator, SMD 0.013), and the proportion with obesity was 52.5% (semaglutide) vs 54.8% (comparator, SMD 0.045). Similar balance was achieved in the influenza cohort, where the proportion aged 65 years or older was 23.0% (semaglutide) vs 25.6% (comparator, SMD 0.078), the proportion with type 2 diabetes was 51.5% (semaglutide) vs 50.1% (comparator, SMD 0.027), and the proportion with obesity was 52.6% (semaglutide) vs 54.8% (comparator, SMD 0.045).
2.2. Semaglutide Use is Associated with Reduced 30-Day Clinical Outcomes Following COVID-19 Infection
In the propensity-matched COVID-19 cohort, semaglutide use was associated with significantly lower 30-day risk across all primary outcomes (Figure 2). All-cause mortality occurred in 0.1% of semaglutide-treated patients compared with 0.4% of comparators (RR 0.26, 95% CI 0.13 to 0.50; P<0.001). Hospitalization occurred in 4.2% vs 7.2% (RR 0.58, 95% CI 0.52 to 0.65; P<0.001), and emergency department visits occurred in 8.4% vs 12.0% (RR 0.70, 95% CI 0.65 to 0.76; P<0.001). For more severe outcomes, intensive care admission occurred in 1.0% vs 1.9% (RR 0.52, 95% CI 0.42 to 0.66; P<0.001), and mechanical ventilation occurred in 0.4% vs 0.8% (RR 0.49, 95% CI 0.34 to 0.71; P<0.001). The composite outcome (death, hospitalization, intensive care admission, or mechanical ventilation) occurred in 4.4% of semaglutide-treated patients compared with 7.7% of comparators (RR 0.57, 95% CI 0.51 to 0.64; P<0.001). Together, these results demonstrate a coherent pattern of reduced 30-day disease severity among semaglutide-treated patients.
2.3. Semaglutide Use is Associated with Reduced 30-Day Clinical Outcomes Following Influenza Infection
In the propensity-matched influenza cohort, semaglutide use was associated with consistent reductions in 30-day risk across multiple outcomes (Figure 2). Hospitalization occurred in 4.4% of semaglutide-treated patients compared with 7.8% of comparators (RR 0.57, 95% CI 0.47 to 0.69; P<0.001). Emergency department visits occurred in 8.9% vs 14.6% (RR 0.61, 95% CI 0.53 to 0.70; P<0.001), and intensive care admission occurred in 1.3% vs 1.9% (RR 0.67, 95% CI 0.46 to 0.97; P=0.03). The composite outcome occurred in 4.5% of semaglutide-treated patients compared with 8.1% of comparators (RR 0.56, 95% CI 0.47 to 0.68; P<0.001). Mechanical ventilation was also significantly reduced (0.3% vs 0.6%; RR 0.43, 95% CI 0.20 to 0.93; P=0.03). All-cause mortality was numerically lower among semaglutide-treated patients, although this difference did not reach statistical significance (0.06% vs 0.2%; RR 0.29, 95% CI 0.06 to 1.37, P=0.10), reflecting low absolute event counts in both groups.
2.4. Semaglutide-Associated Risk Reduction is Consistent Across Vaccinated and Unvaccinated Patients
To evaluate whether the observed associations were modified by prior immunization, the matched cohorts were stratified by documentation of a COVID-19 or influenza vaccine in the 12 months prior to infection (Figure 3). Among COVID-19 patients, semaglutide use was associated with reduced composite outcome risk in both unvaccinated (n=8,686 vs 8,653; RR 0.58, 95% CI 0.51 to 0.65; P<0.001) and vaccinated (n=2,552 vs 2,585; RR 0.54, 95% CI 0.42 to 0.71; P<0.001) patients. A similar pattern was observed in the influenza cohort, with the composite outcome reduced in both unvaccinated (n=2,709 vs 2,706; RR 0.56, 95% CI 0.45 to 0.69; P<0.001) and vaccinated (n=700 vs 703; RR 0.59, 95% CI 0.39 to 0.90; P=0.01) patients. Risk reductions were similar in vaccinated and unvaccinated patients, indicating that the benefit of semaglutide exposure is not explained by higher vaccination rates.
2.5. Semaglutide is Associated with Reduced Cardiac, Pulmonary, and Renal Complications After Viral Infection
Beyond the primary severity endpoints, 30-day risk of cardiac, pulmonary, and renal complications was also assessed (Figure 4). Across both COVID-19 and influenza cohorts, semaglutide use was associated with statistically significant reductions in acute coronary syndrome (RR 0.55, 95% CI 0.40 to 0.75 in COVID-19, P<0.001; RR 0.42, 95% CI 0.24 to 0.75 in influenza, P=0.003), pulmonary outcomes including oxygen requirement, acute respiratory distress syndrome, and mechanical ventilation (RR 0.63, 95% CI 0.52 to 0.77 in COVID-19; RR 0.45, 95% CI 0.33 to 0.61 in influenza; both P<0.001), and renal outcomes including acute kidney injury and dialysis or renal replacement therapy (RR 0.56, 95% CI 0.47 to 0.66 in COVID-19; RR 0.54, 95% CI 0.40 to 0.74 in influenza; both P<0.001). In the COVID-19 cohort, reductions were also significant for sudden cardiac events (RR 0.60, 95% CI 0.41 to 0.87; P=0.007), heart failure or shock (RR 0.73, 95% CI 0.56 to 0.95; P=0.02), cerebrovascular events (RR 0.70, 95% CI 0.51 to 0.96; P=0.02), and thromboembolic events (RR 0.64, 95% CI 0.47 to 0.87; P=0.004). In the influenza cohort, heart failure or shock was also significantly reduced (RR 0.55, 95% CI 0.35 to 0.87; P=0.009), while reductions in sudden cardiac events, cerebrovascular events, and thromboembolic events were directionally consistent but did not reach statistical significance, reflecting low absolute event counts. These findings indicate that the protective effects observed for primary severity outcomes extend to organ-specific complications commonly observed during acute respiratory viral illness.
2.6. Semaglutide-Associated Risk Reduction Are Consistent Across Age Groups and Those with Medicare Insurance
To evaluate whether the observed associations were modified by age at the time of infection, the matched cohorts were stratified into three groups: 18–47, 48–64, and 65 years or older (Table 3). Among COVID-19 patients, semaglutide use was associated with a statistically significant reduction in 30-day composite outcome risk in every age stratum: 18–47 (RR 0.52, 95% CI 0.38 to 0.70; P<0.001), 48–64 (RR 0.52, 95% CI 0.43 to 0.63; P<0.001), and 65 years or older (RR 0.67, 95% CI 0.58 to 0.77; P<0.001). The relative risk reduction was largest in younger and middle-aged adults, while the absolute risk reduction was largest in patients 65 years or older, where baseline event rates were highest (11.8% in comparators). All-cause mortality reductions also reached statistical significance in patients 48–64 (RR 0.06, 95% CI 0.01 to 0.46; P<0.001) and 65 years or older (RR 0.40, 95% CI 0.19 to 0.86; P=0.01). A similar pattern was observed in the influenza cohort, with significant composite outcome reductions in all three age strata: 18–47 (RR 0.34, 95% CI 0.19 to 0.63; P<0.001), 48–64 (RR 0.51, 95% CI 0.36 to 0.71; P<0.001), and 65 years or older (RR 0.73, 95% CI 0.57 to 0.93; P=0.01). These findings indicate that the protective association is preserved across age groups, including older adults at highest baseline risk of severe outcomes.
A sensitivity analysis restricted to Medicare beneficiaries (Table S1) was performed to assess effect estimates in the older, higher-comorbidity subset of the cohort. In the COVID-19 cohort (n=714 semaglutide, 800 comparator), the composite outcome rate was 12.2% in semaglutide-treated patients and 15.6% in comparators (RR 0.78, 95% CI 0.60 to 1.01; P=0.05). Effect estimates in the influenza Medicare subset (n=127 sema, 131 comparator) were directionally consistent but did not reach statistical significance, reflecting low absolute event counts in this smaller subset. Attenuation of the relative effect estimate in this older population is consistent with the age-stratified results in Table 3, where the relative risk reduction was smaller in patients aged 65 years or older despite the larger absolute risk reduction
2.7. Semaglutide-Associated Risk Reduction is Preserved Irrespective of Chronic Corticosteroid Use
To evaluate whether the observed associations were modified by chronic corticosteroid exposure, the matched cohorts were stratified by documented chronic corticosteroid use, defined as ≥2 orders or administrations of any systemic corticosteroid in the 12 months prior to infection (Figure S2). Chronic corticosteroid use was identified in 1,922 of 11,238 (17.1%) semaglutide-treated and 1,786 of 11,238 (15.9%) comparator patients in the matched COVID-19 cohort, and in 588 of 3,409 (17.2%) semaglutide-treated and 553 of 3,409 (16.2%) comparator patients in the matched influenza cohort. Among COVID-19 patients, semaglutide use was associated with reduced composite outcome risk in both patients without chronic corticosteroid use (RR 0.55, 95% CI 0.49 to 0.62; P<0.001) and patients with chronic corticosteroid use (RR 0.64, 95% CI 0.51 to 0.81; P<0.001). A similar pattern was observed in the influenza cohort, with composite outcome risk reduced in both non-users (RR 0.59, 95% CI 0.47 to 0.73; P<0.001) and users (RR 0.48, 95% CI 0.32 to 0.72; P<0.001). These results indicate that the protective association of semaglutide was preserved across patients with or without baseline chronic corticosteroid exposure.
2.8. Comparisons by Therapeutic Exposures and Vaccination Status at Infection During the COVID-19 Pandemic Era
Among patients receiving standard-of-care therapeutics during the COVID-19 pandemic era, semaglutide use remained associated with reduced 30-day outcomes (Table 4). Among patients initiating systemic corticosteroids within ±7 days of diagnosis (n=373 pairs), semaglutide users had numerically lower mortality (0% vs 0.5%) and ICU admission (1.3% vs 1.9%), although the composite outcome did not differ (RR 1.00, 95% CI 0.60 to 1.65). Among patients on metformin in the 12 months prior to infection (n=872 pairs), semaglutide users had a significantly lower composite outcome rate (4.8% vs 7.6%; RR 0.64, 95% CI 0.44 to 0.93; P=0.02). Among patients initiating Paxlovid (nirmatrelvir/ritonavir) within ±7 days of diagnosis (n=473 pairs), semaglutide users had a substantially lower composite outcome rate (3.6% vs 10.1%; RR 0.35, 95% CI 0.21 to 0.61; P<0.001), with significant reductions in hospitalization (RR 0.37) and ICU admission (RR 0.20). The protective association was also preserved within pandemic-era vaccination strata: vaccinated (n=1,373 semaglutide vs 1,514 comparator; composite RR 0.63, 95% CI 0.45 to 0.88; P=0.007) and unvaccinated (n=3,229 vs 3,811; composite RR 0.59, 95% CI 0.50 to 0.70; P<0.001), with stronger associations in the higher-risk unvaccinated patients.
2.9.Semaglutide-Associated Risk Reduction is Consistent Across Pandemic and Seasonal COVID-19 Eras
When stratified by COVID-19 era, the association between semaglutide use and 30-day clinical outcomes was observed in both the pandemic phase (infections occurring before May 11, 2023, the date the United States Public Health Emergency for COVID-19 expired) and the seasonal phase (infections on or after May 11, 2023) (Figure S3).12 The largest absolute effect on mortality was observed in the pandemic era (RR 0.17, 95% CI 0.07 to 0.43, P<0.001), where baseline event rates were higher. In the seasonal era, mortality was lower in the semaglutide cohort but did not reach statistical significance (RR 0.59, 95% CI 0.21 to 1.67, P=0.32). Emergency department visits, intensive care admission, and the composite outcome were significantly reduced in both eras. Mechanical ventilation was significantly reduced in the pandemic era (RR 0.42, 95% CI 0.26 to 0.69; P<0.001) but did not reach statistical significance in the seasonal era (RR 0.75, 95% CI 0.42 to 1.34; P=0.32). These results indicate that the protective association between semaglutide and 30-day clinical outcomes persists across the major phases of the pandemic transition.
2.10. Within-Cohort Sub-Analyses: Weight Loss and Dose
Within the semaglutide-treated cohort, neither pre-infection percent weight loss nor maintenance subcutaneous dose was significantly associated with the 30-day composite outcome rate. In the COVID-19 cohort (n=12,070), composite outcome rates by weight loss groups were 2.5% for <5%, 2.7% for 5–15%, and 2.4% for ≥15% (P=0.89) (Figure 5A). In the influenza cohort (n=2,544), event rates were 2.8%, 2.6%, and 2.1% across the same weight loss groups (P=0.54) (Figure 5B). Stratification by maintenance subcutaneous dose, restricted to patients receiving Ozempic or Wegovy and excluding oral semaglutide (Rybelsus), produced similar results: in the COVID-19 cohort (n=8,954), event rates were 2.7% for 0.25–0.5 mg/week, 3.4% for 1.0 mg/week, and 3.0% for 1.7–2.4 mg/week (P=0.50) (Figure 5C); in the influenza cohort (n=1,938), event rates were 3.3%, 3.7%, and 2.4% across the same dose groups (P=0.32) (Figure 5D). Neither higher doses nor greater weight loss were associated with larger reductions in outcomes, suggesting the protective association may reflect drug-specific effects rather than metabolic improvement.
3. Discussion
In this large multi-site real-world cohort study, prior exposure to semaglutide was associated with significantly reduced 30-day risk of severe outcomes following both COVID-19 and influenza infection. The associations were substantial, including a 74% reduction in 30-day mortality and a 48% reduction in ICU admission for COVID-19, and a 33% reduction in ICU admission for influenza. Risk reductions extended to organ-specific cardiac, pulmonary, and renal outcomes were similar across vaccinated and unvaccinated patients, and persisted across both the pandemic and seasonal phases of COVID-19.
These results add to existing observational evidence suggesting that GLP-1 receptor agonists may favorably influence outcomes during acute illness and respiratory infections,13,14 but advances the field in several ways. The cohort spans both the pandemic and post-pandemic periods, includes two distinct respiratory viruses, and applies a strict propensity-score matching approach. The parallel evaluation in influenza is an important biological control: the consistency of effect direction across two distinct respiratory viruses argues against narrow virus-specific mechanisms and instead supports a host-directed effect.3,4
Previous work provides plausible biological rationale for a protective effect of semaglutide against severe disease following viral infection. GLP-1 receptor activation exerts effects beyond glycemic control, including reductions in systemic inflammation, modulation of macrophage and T-cell activity, improvement in endothelial function, and reductions in adverse cardiovascular events.8–10 During acute respiratory viral infection, dysregulated host inflammation, endothelial injury, and microvascular thrombosis are central drivers of severe disease.2,5 A pharmacotherapy that attenuates these pathways could reduce the risk of decompensation following viral exposure.
The protective association was preserved within subsets of patients receiving Paxlovid at the time of infection and chronic metformin therapy prior to infection. The persistence of the protective association across these subsets suggests that the effect is not contingent on differential administration of acute antiviral or anti-inflammatory therapy and is consistent with host-stabilization effects prior to infection. Among patients initiating systemic corticosteroids around the time of COVID-19 diagnosis, the composite outcome did not differ significantly between semaglutide users and non–GLP-1 RA comparators. Patients in this group represent a population with disease severe enough to warrant guideline-directed acute corticosteroid therapy, and the smaller cohort size (n=373) limited statistical power to detect modest effect-size differences.
The within-cohort sub-analyses indicated that neither pre-infection percent weight loss nor maintenance subcutaneous dose was significantly associated with the 30-day composite outcome rate. Taken together, these findings suggest that the observed protective association may not require substantial weight loss or maximal therapeutic dosing to manifest, and that pleiotropic effects on inflammation, vascular function, and immune cell behavior may operate at sub-maximal exposure. This finding is consistent with the cardiovascular benefits that have been observed with semaglutide.8,9
There are several limitations to this study. First, despite robust propensity-score matching, residual confounding by unmeasured variables remains possible, including healthcare engagement, adherence behaviors, and lifestyle factors not captured by electronic health record data. Second, ascertainment of vaccination, antiviral use, and prior infection may be incomplete if they occurred outside the health system. The substantially higher documented antiviral use compared with documented vaccination in both cohorts likely reflects this differential ascertainment, since antivirals are typically prescribed at the same encounter as the positive infection test and captured directly in the EHR, whereas vaccinations are commonly administered at pharmacies, employer clinics, or community sites outside the network. As a result, the unvaccinated stratum likely includes a meaningful proportion of patients who were vaccinated outside the participating health systems. Third, the study evaluated outcomes within 30 days of infection, and longer-term outcomes including post-acute sequelae and cardiovascular events beyond this window were not assessed. Beyond 30 days, attributing events to the viral infection becomes difficult given the high baseline rates of cardiovascular, renal, and metabolic conditions expected in a cohort enriched for diabetes and obesity. Fourth, dose and weight-loss measurements were not available for the entire semaglutide cohort, which reduced sample size and limited statistical power to detect modest differences across groups in these sub-analyses. Fifth, although the analysis used data from a federated network of academic medical centers, between-site variation in care patterns and practices may contribute to residual heterogeneity. Sixth, the comparator cohort was defined as patients without any GLP-1 receptor agonist exposure rather than an active-comparator group, which limits the ability to distinguish drug-specific effects of semaglutide from broader effects shared across the GLP-1 receptor agonist class.
In summary, prior semaglutide exposure was associated with significantly reduced 30-day mortality, ICU admission, mechanical ventilation, and composite clinical outcomes following both COVID-19 and influenza infection in a large propensity-matched real-world cohort. The associations were consistent across vaccination status and COVID-19 era, and extended to organ-specific complications in cardiac, pulmonary, and renal domains. These findings support continued investigation of GLP-1 receptor agonists as potential modifiers of acute respiratory viral disease severity, with prospective randomized evaluation and active-comparator observational analyses representing the most informative next steps.
4. Methods
4.1. Study Design and Cohort Definition
For this retrospective cohort study, two parallel cohorts were constructed: one for COVID-19 and one for influenza. Adults aged 18 years or older with a positive infection during the study period (January 1, 2020 to December 31, 2025) were eligible. COVID-19 infection was defined as a positive SARS-CoV-2 PCR or antigen test result or an ICD-10 code of U07.1. Influenza infection was defined as a positive influenza PCR or antigen test result (influenza A or B) or an ICD-10 code of J09.x, J10.x, or J11.x. For each cohort, each patient contributed a single index date corresponding to the first qualifying infection occurring after all cohort inclusion, exclusion, and exposure criteria were met. In the matched COVID-19 cohort, index infection was identified by ICD-10 code U07.1 in 9,894 of 11,238 (88.0%) semaglutide-exposed patients and 9,909 of 11,238 (88.2%) comparator patients, with the remaining 1,344 (12.0%) and 1,329 (11.8%) identified by positive SARS-CoV-2 PCR or antigen test. In the matched influenza cohort, index infection was identified by ICD-10 codes J09.x, J10.x, or J11.x in 3,290 of 3,409 (96.5%) semaglutide-exposed patients and 3,262 of 3,409 (95.7%) comparator patients, with the remaining 119 (3.5%) and 147 (4.3%) identified by positive influenza PCR or antigen test.
4.2. Inclusion and Exclusion Criteria
Patients were required to have at least 12 months of baseline electronic health record data prior to the index infection, defined as documentation of at least one clinical encounter occurring more than 12 months before the index infection date and at least one clinical encounter occurring within 12 months of the index infection date. Exclusion criteria, applied symmetrically to both cohorts, were: documented prior infection with the same pathogen in the 6 months prior to index (to ensure incident events); active malignancy in the 24 months prior, defined as a diagnosis of malignant neoplasms or administration of chemotherapy; organ transplant at any time prior; active immunosuppressive medication exposure in the 3 months prior; HIV or AIDS at any time prior; end-stage renal disease or dialysis dependence in the 12 months prior; and pregnancy in the 12 months prior. The relevant codes and definitions used to determine exclusion criteria are defined in Table S2.
4.3. Exposure Definition
Active semaglutide exposure was defined as 2 or more orders or administrations of any semaglutide formulation (Ozempic, Wegovy, Rybelsus) in the 12 months prior to the index infection. The no GLP-1 RA comparator cohort included patients with no orders or administrations of any GLP-1 receptor agonist (semaglutide, liraglutide, dulaglutide, exenatide) or tirzepatide at any time prior to the index infection.
4.4. Covariates and Propensity Score Matching
Baseline covariates were assessed within the 12 months prior to the index infection date. Demographic covariates included age category (18–47, 48–64, 65 and older), sex, race, and ethnicity. Anthropometric and metabolic covariates included BMI category (underweight, normal, overweight, class 1 obesity, class 2 obesity, class 3 obesity, unknown) and HbA1c category (normal, pre-diabetic, diabetic, unknown). Infection-context covariates included documentation of a COVID-19 or influenza vaccine in the 12 months prior to the index infection (any vaccination vs none); documentation of a prior infection with the relevant pathogen between 12 and 6 months before index (with infections within 6 months captured by the exclusion criterion above); and use of a guideline-recommended antiviral therapy within ±7 days of the index infection (nirmatrelvir/ritonavir, molnupiravir, or remdesivir for COVID-19; oseltamivir, zanamivir, peramivir, or baloxavir for influenza). For the COVID-19 cohort, an additional contextual variable was included: SARS-CoV-2 variant era at the time of index, defined by the dominant circulating variant (pre-Delta, before July 2021; Delta, July through December 2021; Omicron BA.1/BA.2, January through June 2022; Omicron BA.4/BA.5, July through December 2022; or Omicron XBB and later, January 2023 onward). Comorbidity indicators captured anxiety, asthma, atrial fibrillation, chronic kidney disease stage 3 or 4, chronic liver disease, chronic obstructive pulmonary disease, coronary artery disease, depression, heart failure, hypertension, NAFLD or MASH, obesity, history of stroke, type 2 diabetes mellitus, and current and former tobacco use. Healthcare utilization indicators captured any office or outpatient visit or hospital inpatient stay within the 12-month baseline period. The relevant codes used to determine baseline covariates are defined in Table S2.
Propensity scores were estimated via logistic regression including all baseline covariates listed above; the COVID-19 propensity model additionally included variant era. One-to-one nearest-neighbor matching without replacement was performed on the logit of the propensity score using a strict caliper of 0.01 standard deviations.
4.5. Outcome Definitions
Clinical outcomes were assessed within 30 days following the index infection date. Primary outcomes included all-cause mortality, hospitalization, emergency department visit, intensive care unit admission, and mechanical ventilation. A composite outcome was defined as the occurrence of all-cause mortality, hospitalization, intensive care unit admission, or mechanical ventilation within 30 days of index. Emergency department visits were assessed as a separate outcome and were not included in the composite. Cardiac, pulmonary, and renal complications were similarly assessed within the 30-day window using ICD-10 code groupings. Cardiac complications comprised acute coronary syndrome (myocardial infarction, angina, coronary thrombosis), sudden cardiac event (cardiac arrest, ventricular tachycardia or fibrillation, sudden cardiac death, atrioventricular block), heart failure or shock (acute heart failure, decompensation, cardiogenic shock), cerebrovascular event (ischemic stroke, hemorrhagic stroke, transient ischemic attack), and thromboembolic event (pulmonary embolism, deep vein thrombosis, systemic or peripheral arterial thromboembolism). Pulmonary complications comprised oxygen requirement, acute respiratory distress syndrome, and mechanical ventilation. Renal complications comprised acute kidney injury and dialysis or renal replacement therapy. The relevant codes used to determine outcomes are defined in Table S2.
4.6. Sub-Analysis by Chronic Corticosteroid Use
A sub-analysis was performed to assess whether the association between semaglutide and clinical outcomes was modified by chronic corticosteroid use. Chronic corticosteroid use was defined as 2 or more orders or administrations of any systemic corticosteroid in the 12 months prior to the index infection in order to capture sustained pharmacologic exposure rather than short-burst courses for unrelated indications. Eligible medications included dexamethasone, methylprednisolone, prednisone, prednisolone, hydrocortisone, betamethasone, triamcinolone, cortisone, fludrocortisone, deflazacort, and oral budesonide. Inhaled and topical corticosteroid formulations were excluded.
4.7. Stratified Analyses Within Co-Intervention Exposure Groups
Stratified analyses were performed within the propensity-matched COVID-19 cohort, restricted to the pandemic era (infections before May 11, 2023). For each analysis, the matched cohort was restricted to patients meeting a pre-specified co-intervention or vaccination criterion in both groups: (A) initiation of systemic corticosteroids (dexamethasone, methylprednisolone, prednisone, prednisolone, hydrocortisone, betamethasone, triamcinolone, cortisone, fludrocortisone, deflazacort, and oral budesonide) within ±7 days of COVID-19 diagnosis; (B) at least one order or administration of metformin within the 12 months prior to COVID-19 diagnosis; (C) initiation of Paxlovid (nirmatrelvir/ritonavir) within ±7 days of COVID-19 diagnosis; and (D) documented COVID-19 vaccination within the 12 months prior to COVID-19 diagnosis.
4.8. Within-Cohort Sub-analyses: Weight Loss and Dose
Two sub-analyses were conducted to assess whether 30-day composite outcome rates among semaglutide-treated patients vary with markers of drug response. These analyses were performed on the pre-matched semaglutide cohort and did not involve a comparator cohort. For the weight loss sub-analysis, percent weight loss was calculated as the difference between the weight measurement closest to first semaglutide order or administration (within the 90 days prior) and the weight measurement closest to the index infection date (within the 90 days prior), expressed as a percentage of the baseline weight. Patients without both weight measurements available were excluded. Weight loss strata were defined as: <5%, 5–15%, and ≥15%. For the semaglutide dose sub-analysis, the subcutaneous semaglutide dose closest to the infection date within the 12-month baseline period was identified. The dose analysis was restricted to patients receiving subcutaneous semaglutide (Ozempic or Wegovy); patients whose closest pre-infection prescription was for oral semaglutide (Rybelsus) were excluded, since the oral formulation uses a distinct dosing scale (3, 7, or 14 mg daily) that is not directly comparable to the weekly subcutaneous milligram dose. Patients without subcutaneous dose information available were excluded. Strata were defined according to standard subcutaneous semaglutide dosing across both Ozempic and Wegovy formulations: 0.25–0.5 mg/week (titration phase), 1.0 mg/week (Wegovy mid-titration and Ozempic standard maintenance), and 1.7–2.4 mg/week (including Wegovy therapeutic maintenance and Ozempic maximum).8,15
4.9. Statistical Analysis
Baseline characteristics were summarized as count with percent for categorical variables. Standardized mean differences were used to assess pre- and post-matching balance. Risk ratios with 95% confidence intervals were calculated using normal approximation on the log-risk-ratio scale. P values for between-group comparisons were derived from the Pearson chi-square test of independence without continuity correction. For comparisons in which a group had zero events, a 0.5 continuity correction was applied to the risk ratio and confidence interval. For within-cohort sub-analyses by weight loss and subcutaneous semaglutide dose stratum, P values were derived from the Cochran-Armitage test for trend. Two-sided P values below 0.05 were considered statistically significant. To account for multiple comparisons across the outcomes, adjusted P values are also reported using Benjamini-Hochberg false discovery rate.
4.10. Data Source
This study analyzed de-identified EHR data from academic medical centers in the United States via the nference nSights Analytics Platform. Prior to analysis, all data underwent expert determination de-identification satisfying HIPAA Privacy Rule requirements (45 CFR §164.514(b)(1)), employing a multi-layered transformation approach for both structured data (cryptographic hashing of identifiers, date-shifting, geographic truncation) and unstructured clinical text (ensemble deep learning and rule-based methods with >99% recall for personally identifiable information detection). nference established secure data environments within each participating center, housing these de-identified patient data governed by expert determination. These de-identified data environments were specifically designed to enable data access and analysis without requiring Institutional Review Board oversight, approval, or exemption confirmation. Accordingly, informed consent and IRB review were not required for this study.
4.11. Data Availability
This study involves the analysis of de-identified Electronic Health Record (EHR) data via the nference nSights Federated Clinical Analytics Platform (nSights). Data shown and reported in this manuscript were extracted from this environment using an established protocol for data extraction, aimed at preserving patient privacy. The data has been de-identified pursuant to an expert determination in accordance with the HIPAA Privacy Rule. Any data beyond what is reported in the manuscript, including but not limited to the raw EHR data, cannot be shared or released due to the parameters of the expert determination to maintain the data de-identification. The corresponding author should be contacted for additional details regarding nSights.
4.12. De-Identification and HIPAA Compliance Certification
Prior to analysis, all EHR data were de-identified under an expert determination consistent with the Health Insurance Portability and Accountability Act (HIPAA) Privacy Rule (45 CFR §164.514(b)(1)). The de-identification methodology employed a multi-layered transformation approach to both structured and unstructured data fields16. In structured data, direct identifiers including patient names and precise geographic locations were excluded entirely, while indirect identifiers underwent specific transformations: patient identifiers, medical record numbers, and accession numbers were replaced with one-way cryptographic hashes using confidential salts to preserve linkage across patient encounters; all dates were shifted backward by patient-specific random offsets (1–31 days) to preserve temporal relationships while obscuring exact event timing; the ZIP codes were truncated to two-digit state-level resolution; and continuous variables including age, height, weight, and body mass index were thresholded to prevent identification of extreme values (for example, ages ≥89 years transformed to ‘89+’ and BMI >40 transformed to ‘40+’). In unstructured clinical text, an ensemble de-identification system that combines attention-based deep learning models with rule-based methods achieved an estimated >99% recall for personally identifiable information (PII) detection, with detected identifiers replaced by plausible fictional surrogates16.
4.13. Data Harmonization
To address heterogeneity in EHR data, we harmonized clinical variables including medications, anthropometric measurements, and diagnoses to standardized concepts. For medications, we first constructed a standardized drug concept database combining the nSights knowledge graph with RXNorm (https://www.nlm.nih.gov/research/umls/rxnorm/index.html) hierarchies to capture ingredient, brand, and dose-specific information17. EHR medication records were matched using a hierarchical approach prioritizing RXNorm codes when available, followed by ingredient-level matching, and finally natural language processing and pattern matching on free-text medication orders when structured codes were absent. For anthropometric measurements (height, weight, BMI), we created a unified vocabulary from SNOMED (https://www.snomed.org/, https://athena.ohdsi.org) and LOINC (https://loinc.org/) terminologies and matched EHR measurement descriptions using standardized text matching algorithms with abbreviation expansion and synonym resolution; ambiguous mappings were resolved using OpenAI GPT-4o (https://platform.openai.com/docs/models/gpt-4o) with summary statistics as context, followed by manual verification. For diagnoses, we developed a hierarchical disease concept database from the nSights knowledge graph and matched EHR diagnosis descriptions and codes by identifying the most specific common child concept in the hierarchy. This approach enabled consistent identification of clinical entities while preserving granularity where available.
4.14. Code Availability
The analysis code is not publicly available. The corresponding author should be contacted for additional details.:
Author Contributions
V.S. conceived the study, and designed the study with A.J.V. Data queries and statistical analyses were conducted by R.M. and K.M. All authors interpreted the data, contributed to writing the manuscript and the revisions, and approved the final version for submission.
Funding
This research received no external funding.
Conflicts of Interest Statement
The authors are employees of nference, inc., which conducts research collaborations with various biopharmaceutical companies whose therapeutic products are included in this study. None of these companies, nor any other nference collaborator, funded, supported, or had any role in the independent study design, data acquisition, analysis, interpretation, manuscript preparation, or the decision to submit this work for publication. All analyses were conducted by the authors using de-identified electronic health record data. The authors declare no additional competing interests.
Acknowledgments
We thank the nference engineering team for the development of the nSights federated AI platform, and Patrick Lenehan for helpful clinical feedback.
References
- GBD 2023 Lower Respiratory Infections and Antimicrobial Resistance Collaborators. Global burden of lower respiratory infections and aetiologies, 1990-2023: a systematic analysis for the Global Burden of Disease Study 2023. Lancet Infect. Dis. 26, 343–361 (2026).
- Williamson, E. J. et al. Factors associated with COVID-19-related death using OpenSAFELY. Nature 584, 430–436 (2020).
- Apicella, M. et al. COVID-19 in people with diabetes: understanding the reasons for worse outcomes. Lancet Diabetes Endocrinol. 8, 782–792 (2020).
- Honce, R. & Schultz-Cherry, S. Impact of obesity on influenza A virus pathogenesis, immune response, and evolution. Front. Immunol. 10, 1071 (2019).
- Groff, D. et al. Short-term and long-term rates of postacute sequelae of SARS-CoV-2 infection: A systematic review. JAMA Netw. Open 4, e2128568 (2021).
- Darweesh, M., Mohammadi, S., Rahmati, M., Al-Hamadani, M. & Al-Harrasi, A. Metabolic reprogramming in viral infections: the interplay of glucose metabolism and immune responses. Front. Immunol. 16, 1578202 (2025).
- Moiz, A. et al. The expanding role of GLP-1 receptor agonists: a narrative review of current evidence and future directions. EClinicalMedicine 86, 103363 (2025).
- Marso, S. P. et al. Semaglutide and cardiovascular outcomes in patients with type 2 diabetes. N. Engl. J. Med. 375, 1834–1844 (2016).
- Lincoff, A. M. et al. Semaglutide and cardiovascular outcomes in obesity without diabetes. N. Engl. J. Med. 389, 2221–2232 (2023).
- Drucker, D. J. Mechanisms of action and therapeutic application of glucagon-like peptide-1. Cell Metab. 27, 740–756 (2018).
- Greco, S. et al. The impact of GLP-1 RAs and DPP-4is on hospitalisation and mortality in the COVID-19 era: A two-year observational study. Biomedicines 11, 2292 (2023).
- Health and Human Services Department. Notice of expiration of certain Notifications of Enforcement Discretion issued in response to the COVID-19 nationwide public health emergency. Federal Register Preprint at https://www.federalregister.gov/d/2023-07824.
- Kahkoska, A. R. et al. Association between glucagon-like peptide 1 receptor agonist and sodium-glucose cotransporter 2 inhibitor use and COVID-19 outcomes. Diabetes Care 44, 1564–1572 (2021).
- Han, S. et al. Association of glucagon-like peptide-1 receptor agonist use with risk of infections: A systematic review and meta-analysis. J. Infect. 91, 106645 (2025).
- Wilding, J. P. H. et al. Once-weekly semaglutide in adults with overweight or obesity. N. Engl. J. Med. 384, 989–1002 (2021).
- Murugadoss, K. et al. Building a best-in-class automated de-identification tool for electronic health records through ensemble learning. Patterns (N Y) 2, 100255 (2021).
- Venkatakrishnan, A. J. et al. Clinical nSights: A software platform to accelerate real world oncology analyses. Journal of Clinical Oncology (2024). [CrossRef]
Figure 1.
Cohort derivation for COVID-19 and influenza analyses. Flow diagram illustrating cohort selection for the COVID-19 (left) and influenza (right) analyses during the study period (January 1, 2020 to December 31, 2025). Patients with documented infection were restricted to adults (≥18 years) with at least 12 months of baseline data. Individuals were excluded for selected pre-existing conditions or exposures, including recent prior infection, active malignancy, organ transplant, immunosuppression, HIV/AIDS, end-stage renal disease, or pregnancy. From the eligible cohorts, patients with evidence of semaglutide exposure (≥2 orders or administrations within 12 months prior to infection) were identified and compared with patients without GLP-1 receptor agonist exposure. Propensity score matching (1:1) was performed, yielding matched cohorts of 11,238 semaglutide-treated and 11,238 non–GLP-1RA patients for COVID-19, and 3,409 semaglutide-treated and 3,409 non–GLP-1RA patients for influenza. Counts for exclusion criteria are not mutually exclusive.
Figure 1.
Cohort derivation for COVID-19 and influenza analyses. Flow diagram illustrating cohort selection for the COVID-19 (left) and influenza (right) analyses during the study period (January 1, 2020 to December 31, 2025). Patients with documented infection were restricted to adults (≥18 years) with at least 12 months of baseline data. Individuals were excluded for selected pre-existing conditions or exposures, including recent prior infection, active malignancy, organ transplant, immunosuppression, HIV/AIDS, end-stage renal disease, or pregnancy. From the eligible cohorts, patients with evidence of semaglutide exposure (≥2 orders or administrations within 12 months prior to infection) were identified and compared with patients without GLP-1 receptor agonist exposure. Propensity score matching (1:1) was performed, yielding matched cohorts of 11,238 semaglutide-treated and 11,238 non–GLP-1RA patients for COVID-19, and 3,409 semaglutide-treated and 3,409 non–GLP-1RA patients for influenza. Counts for exclusion criteria are not mutually exclusive.
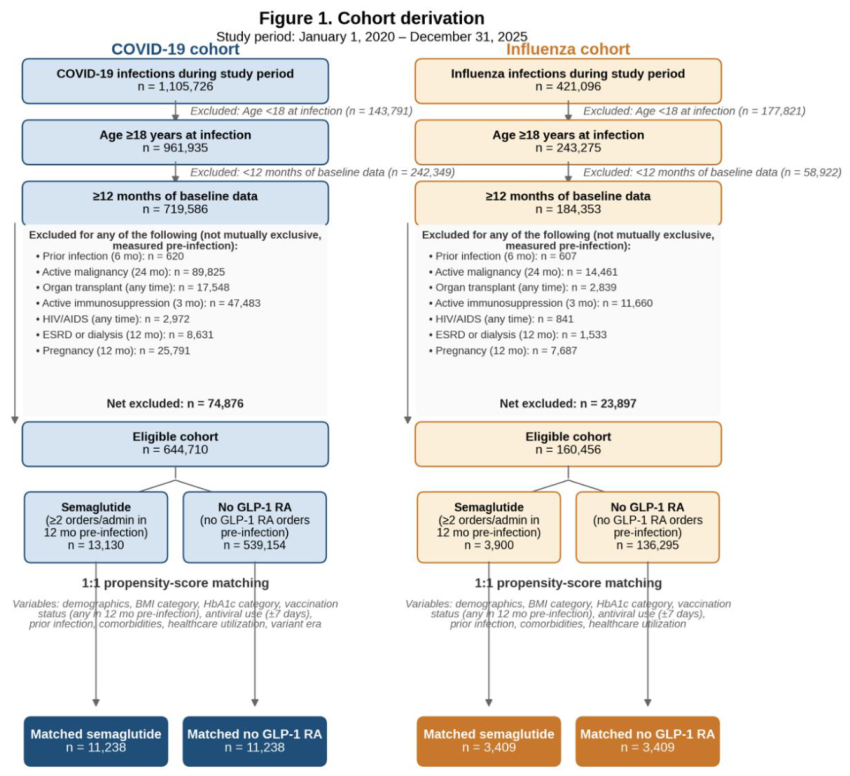
Figure 2.
Risk of clinical outcomes following COVID-19 and influenza infection in semaglutide-treated patients vs non–GLP-1RA comparators. Forest plot showing risk ratios (RRs) with 95% confidence intervals for clinical outcomes within 30 days after infection in propensity-matched COVID-19 and influenza cohorts. Outcomes include all-cause mortality, hospitalization, emergency department visits, intensive care unit (ICU) admission, mechanical ventilation, and a composite outcome (death, hospitalization, ICU admission, or mechanical ventilation). Squares indicate point estimates and horizontal lines represent 95% confidence intervals; the vertical dashed line denotes a risk ratio of 1.0. Values <1.0 favor semaglutide. P values are derived from the Pearson chi-square test of independence. Benjamini-Hochberg adjusted P values are reported alongside raw values; filled squares indicate adjusted P < 0.05.
Figure 2.
Risk of clinical outcomes following COVID-19 and influenza infection in semaglutide-treated patients vs non–GLP-1RA comparators. Forest plot showing risk ratios (RRs) with 95% confidence intervals for clinical outcomes within 30 days after infection in propensity-matched COVID-19 and influenza cohorts. Outcomes include all-cause mortality, hospitalization, emergency department visits, intensive care unit (ICU) admission, mechanical ventilation, and a composite outcome (death, hospitalization, ICU admission, or mechanical ventilation). Squares indicate point estimates and horizontal lines represent 95% confidence intervals; the vertical dashed line denotes a risk ratio of 1.0. Values <1.0 favor semaglutide. P values are derived from the Pearson chi-square test of independence. Benjamini-Hochberg adjusted P values are reported alongside raw values; filled squares indicate adjusted P < 0.05.
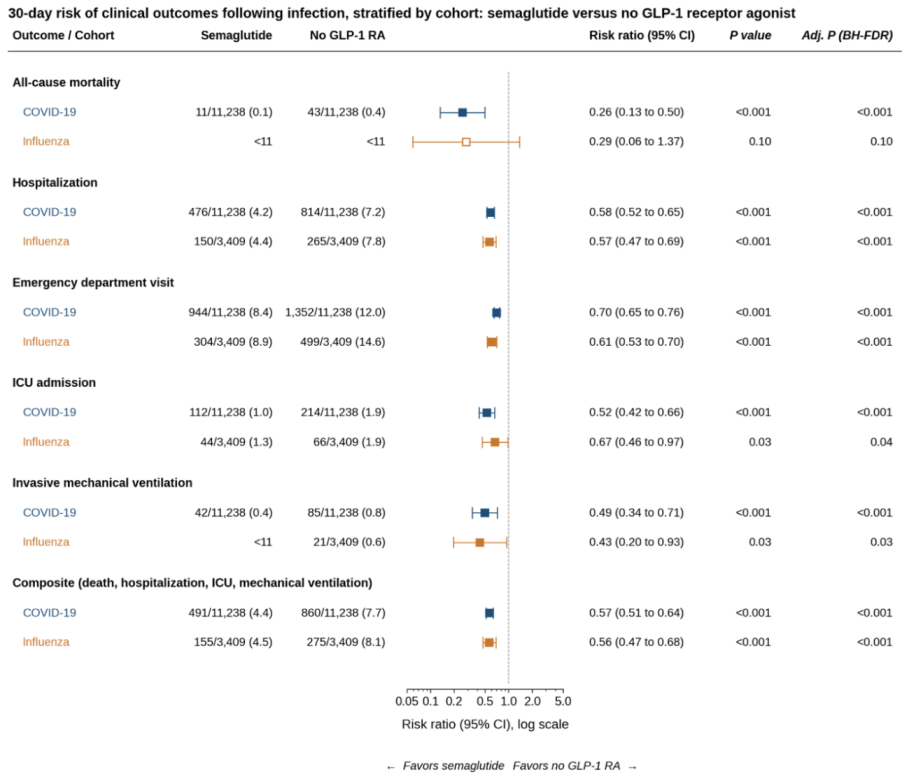
Figure 3.
Risk of clinical outcomes following COVID-19 and influenza infection in semaglutide-treated patients vs non–GLP-1RA comparators, stratified by prior vaccination status. Forest plot showing risk ratios (RRs) with 95% confidence intervals for clinical outcomes within 30 days after infection in propensity-matched COVID-19 and influenza cohorts, stratified by documentation of a COVID-19 or influenza vaccine in the 12 months prior to infection. Outcomes include all-cause mortality, hospitalization, emergency department visits, intensive care unit (ICU) admission, mechanical ventilation, and a composite outcome (death, hospitalization, ICU admission, or mechanical ventilation). Squares indicate point estimates and horizontal lines represent 95% confidence intervals; the vertical dashed line denotes a risk ratio of 1.0. Values <1.0 favor semaglutide. P values are derived from the Pearson chi-square test of independence. Benjamini-Hochberg adjusted P values are reported alongside raw values; filled squares indicate adjusted P < 0.05.
Figure 3.
Risk of clinical outcomes following COVID-19 and influenza infection in semaglutide-treated patients vs non–GLP-1RA comparators, stratified by prior vaccination status. Forest plot showing risk ratios (RRs) with 95% confidence intervals for clinical outcomes within 30 days after infection in propensity-matched COVID-19 and influenza cohorts, stratified by documentation of a COVID-19 or influenza vaccine in the 12 months prior to infection. Outcomes include all-cause mortality, hospitalization, emergency department visits, intensive care unit (ICU) admission, mechanical ventilation, and a composite outcome (death, hospitalization, ICU admission, or mechanical ventilation). Squares indicate point estimates and horizontal lines represent 95% confidence intervals; the vertical dashed line denotes a risk ratio of 1.0. Values <1.0 favor semaglutide. P values are derived from the Pearson chi-square test of independence. Benjamini-Hochberg adjusted P values are reported alongside raw values; filled squares indicate adjusted P < 0.05.
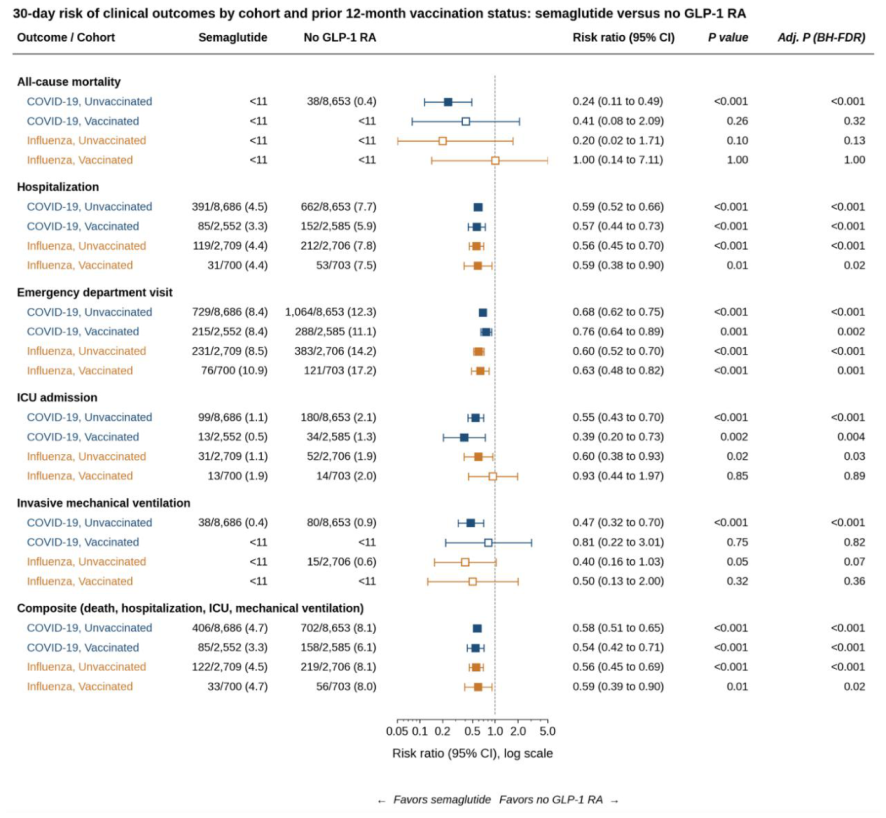
Figure 4.
Risk of cardiac, pulmonary, and renal outcomes following COVID-19 and influenza infection in semaglutide-treated patients vs non–GLP-1RA comparators. Forest plot showing risk ratios (RRs) with 95% confidence intervals for cardiac, pulmonary, and renal outcomes within 30 days after infection in propensity-matched COVID-19 and influenza cohorts. Outcomes include acute coronary syndrome (myocardial infarction, angina, coronary thrombosis), sudden cardiac event (cardiac arrest, ventricular tachycardia or fibrillation, sudden cardiac death, atrioventricular block), heart failure or shock (acute heart failure, decompensation, cardiogenic shock), cerebrovascular event (ischemic stroke, hemorrhagic stroke, transient ischemic attack), thromboembolic event (pulmonary embolism, deep vein thrombosis, systemic or peripheral arterial thromboembolism), pulmonary outcomes (oxygen requirement, acute respiratory distress syndrome, mechanical ventilation), and renal outcomes (acute kidney injury, dialysis or renal replacement therapy). Squares indicate point estimates and horizontal lines represent 95% confidence intervals; the vertical dashed line denotes a risk ratio of 1.0. Values <1.0 favor semaglutide. P values are derived from the Pearson chi-square test of independence. Benjamini-Hochberg adjusted P values are reported alongside raw values; filled squares indicate adjusted P < 0.05.
Figure 4.
Risk of cardiac, pulmonary, and renal outcomes following COVID-19 and influenza infection in semaglutide-treated patients vs non–GLP-1RA comparators. Forest plot showing risk ratios (RRs) with 95% confidence intervals for cardiac, pulmonary, and renal outcomes within 30 days after infection in propensity-matched COVID-19 and influenza cohorts. Outcomes include acute coronary syndrome (myocardial infarction, angina, coronary thrombosis), sudden cardiac event (cardiac arrest, ventricular tachycardia or fibrillation, sudden cardiac death, atrioventricular block), heart failure or shock (acute heart failure, decompensation, cardiogenic shock), cerebrovascular event (ischemic stroke, hemorrhagic stroke, transient ischemic attack), thromboembolic event (pulmonary embolism, deep vein thrombosis, systemic or peripheral arterial thromboembolism), pulmonary outcomes (oxygen requirement, acute respiratory distress syndrome, mechanical ventilation), and renal outcomes (acute kidney injury, dialysis or renal replacement therapy). Squares indicate point estimates and horizontal lines represent 95% confidence intervals; the vertical dashed line denotes a risk ratio of 1.0. Values <1.0 favor semaglutide. P values are derived from the Pearson chi-square test of independence. Benjamini-Hochberg adjusted P values are reported alongside raw values; filled squares indicate adjusted P < 0.05.
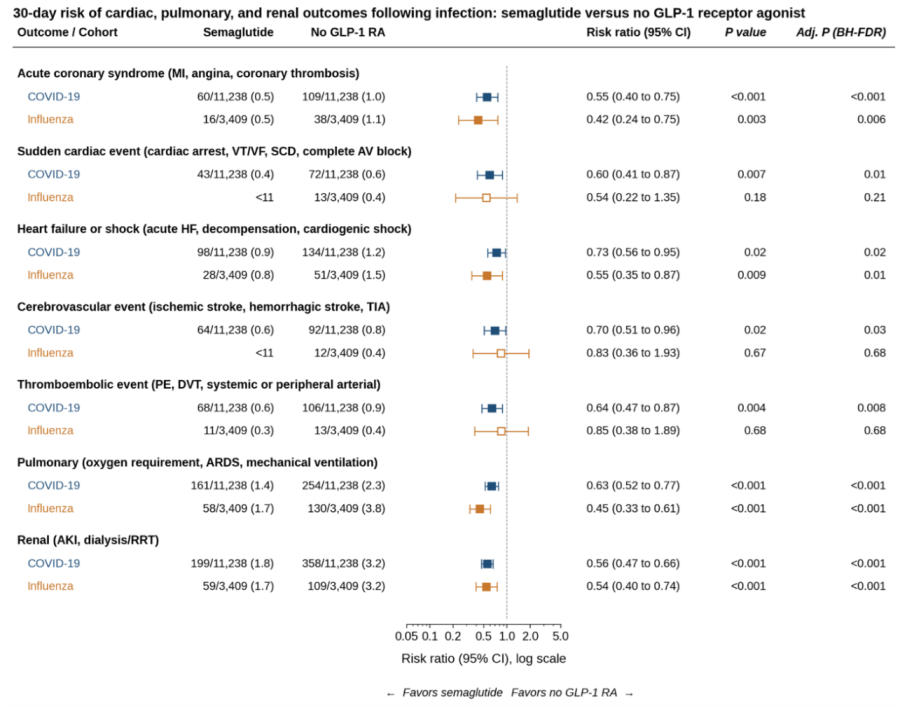
Figure 5.
Thirty-day composite outcome rate in semaglutide-treated patients, stratified by pre-infection weight loss (panels A and B) and semaglutide dose (panels C and D). Bar charts showing the rate of the 30-day composite outcome (death, hospitalization, ICU admission, or mechanical ventilation) within the pre-matched semaglutide cohorts. Panels (A) and (B) show event rates by percent weight loss prior to infection in the COVID-19 and influenza cohorts, respectively. Percent weight loss was calculated as the difference between the weight closest to first semaglutide order or administration (within 90 days prior) and the weight closest to the infection date (within 90 days prior), expressed as a percentage of the baseline weight; strata were defined as <5%, 5–15%, and ≥15%. Panels (C) and (D) show event rates by semaglutide dose in the COVID-19 and influenza cohorts, respectively. Dose was determined using the subcutaneous semaglutide dose received closest to the infection date within the 12-month baseline period prior to infection; strata were defined as 0.25–0.5 mg/week (titration), 1.0 mg/week (mid-titration), and 1.7–2.4 mg/week (therapeutic maintenance). Patients without the requisite weight or dose measurements were excluded from the corresponding analysis. Bars indicate the within-stratum event rate and error bars represent 95% Wilson score confidence intervals. P values are from the Cochran-Armitage test for trend across the three ordered strata.
Figure 5.
Thirty-day composite outcome rate in semaglutide-treated patients, stratified by pre-infection weight loss (panels A and B) and semaglutide dose (panels C and D). Bar charts showing the rate of the 30-day composite outcome (death, hospitalization, ICU admission, or mechanical ventilation) within the pre-matched semaglutide cohorts. Panels (A) and (B) show event rates by percent weight loss prior to infection in the COVID-19 and influenza cohorts, respectively. Percent weight loss was calculated as the difference between the weight closest to first semaglutide order or administration (within 90 days prior) and the weight closest to the infection date (within 90 days prior), expressed as a percentage of the baseline weight; strata were defined as <5%, 5–15%, and ≥15%. Panels (C) and (D) show event rates by semaglutide dose in the COVID-19 and influenza cohorts, respectively. Dose was determined using the subcutaneous semaglutide dose received closest to the infection date within the 12-month baseline period prior to infection; strata were defined as 0.25–0.5 mg/week (titration), 1.0 mg/week (mid-titration), and 1.7–2.4 mg/week (therapeutic maintenance). Patients without the requisite weight or dose measurements were excluded from the corresponding analysis. Bars indicate the within-stratum event rate and error bars represent 95% Wilson score confidence intervals. P values are from the Cochran-Armitage test for trend across the three ordered strata.
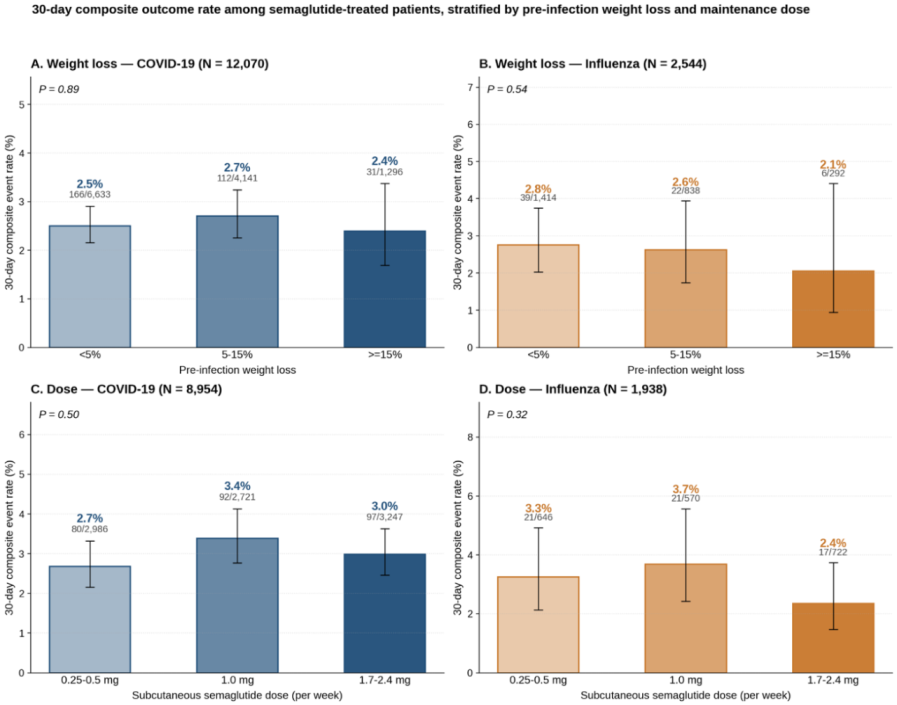

Table 1.
Pre-matching baseline characteristics of the semaglutide and no GLP-1 receptor agonist cohorts, COVID-19 and influenza. Demographic, clinical, and healthcare utilization characteristics measured in the 12 months prior to infection, before propensity-score matching. Standardized mean differences (SMDs) compare the semaglutide and no GLP-1 RA cohorts within each infection cohort.
Table 1.
Pre-matching baseline characteristics of the semaglutide and no GLP-1 receptor agonist cohorts, COVID-19 and influenza. Demographic, clinical, and healthcare utilization characteristics measured in the 12 months prior to infection, before propensity-score matching. Standardized mean differences (SMDs) compare the semaglutide and no GLP-1 RA cohorts within each infection cohort.
| Characteristic | COVID-19 cohort | Influenza cohort | ||||
|---|---|---|---|---|---|---|
| Semaglutide (n = 13,130) |
No GLP-1 RA (n = 539,154) |
SMD | Semaglutide (n = 3,900) |
No GLP-1 RA (n = 136,295) |
SMD | |
| Demographics | ||||||
| Age group, n (%) | 0.481 | 0.557 | ||||
| 18–47 years | 3,629 (27.6) | 263,396 (48.9) | 1,450 (37.2) | 86,188 (63.2) | ||
| 48–64 years | 5,885 (44.8) | 140,843 (26.1) | 1,605 (41.2) | 28,125 (20.6) | ||
| ≥65 years | 3,616 (27.5) | 134,915 (25.0) | 845 (21.7) | 21,982 (16.1) | ||
| Sex, n (%) | 0.243 | 0.263 | ||||
| Female | 8,916 (67.9) | 303,095 (56.2) | 2,709 (69.5) | 77,584 (56.9) | ||
| Male | 4,212 (32.1) | 235,997 (43.8) | 1,191 (30.5) | 58,692 (43.1) | ||
| Unknown | <11 | 62 (0.0) | 0 (0.0) | 19 (0.0) | ||
| Race, n (%) | 0.229 | 0.198 | ||||
| White | 10,168 (77.4) | 436,642 (81.0) | 2,980 (76.4) | 106,818 (78.4) | ||
| Black or African American | 2,049 (15.6) | 49,039 (9.1) | 598 (15.3) | 13,426 (9.9) | ||
| Asian | 231 (1.8) | 13,594 (2.5) | 82 (2.1) | 3,895 (2.9) | ||
| Native American or Pacific Islander | 127 (1.0) | 4,138 (0.8) | 42 (1.1) | 1,454 (1.1) | ||
| Other/Mixed | 210 (1.6) | 10,220 (1.9) | 73 (1.9) | 3,763 (2.8) | ||
| Unknown | 345 (2.6) | 25,521 (4.7) | 125 (3.2) | 6,939 (5.1) | ||
| Ethnicity, n (%) | 0.045 | 0.061 | ||||
| Hispanic or Latino | 601 (4.6) | 29,517 (5.5) | 216 (5.5) | 9,133 (6.7) | ||
| Not Hispanic or Latino | 10,794 (82.2) | 442,401 (82.1) | 3,087 (79.2) | 108,307 (79.5) | ||
| Unknown | 1,735 (13.2) | 67,236 (12.5) | 597 (15.3) | 18,855 (13.8) | ||
| Anthropometrics and metabolic status | ||||||
| BMI category, n (%) | 0.898 | 0.854 | ||||
| Underweight (<18.5) | 13 (0.1) | 6,155 (1.1) | <11 | 2,301 (1.7) | ||
| Normal (18.5–24.9) | 559 (4.3) | 111,788 (20.7) | 180 (4.6) | 34,557 (25.4) | ||
| Overweight (25–29.9) | 2,257 (17.2) | 133,832 (24.8) | 708 (18.2) | 37,130 (27.2) | ||
| Class 1 obesity (30–34.9) | 3,431 (26.1) | 85,348 (15.8) | 1,017 (26.1) | 23,731 (17.4) | ||
| Class 2 obesity (35–39.9) | 3,181 (24.2) | 41,301 (7.7) | 892 (22.9) | 11,902 (8.7) | ||
| Class 3 obesity (≥40) | 1,648 (12.6) | 15,126 (2.8) | 503 (12.9) | 5,017 (3.7) | ||
| Unknown | 2,041 (15.5) | 145,604 (27.0) | 597 (15.3) | 21,657 (15.9) | ||
| HbA1c category, n (%) | 1.385 | 1.275 | ||||
| Normal (4.0–5.6) | 2,226 (17.0) | 42,098 (7.8) | 719 (18.4) | 10,321 (7.6) | ||
| Pre-diabetic (5.7–6.4) | 2,473 (18.8) | 28,397 (5.3) | 639 (16.4) | 6,222 (4.6) | ||
| Diabetic (6.5–16.0) | 4,640 (35.3) | 16,748 (3.1) | 1,217 (31.2) | 3,393 (2.5) | ||
| Unknown | 3,791 (28.9) | 451,911 (83.8) | 1,325 (34.0) | 116,359 (85.4) | ||
| Infection context | ||||||
| Vaccinated, n (%) | 2,970 (22.6) | 101,175 (18.8) | 0.095 | 840 (21.5) | 14,779 (10.8) | 0.293 |
| Variant era, n (%) | 1.064 | – | ||||
| Pre-Delta | 583 (4.4) | 143,512 (26.6) | – | – | – | |
| Delta | 1,007 (7.7) | 117,533 (21.8) | – | – | – | |
| Omicron BA.1/BA.2 | 1,178 (9.0) | 82,311 (15.3) | – | – | – | |
| Omicron BA.4/BA.5 | 1,577 (12.0) | 64,659 (12.0) | – | – | – | |
| Omicron XBB or later | 8,785 (66.9) | 131,139 (24.3) | – | – | – | |
| Antiviral ±7 days of infection, n (%) | 6,814 (51.9) | 107,275 (19.9) | 0.708 | 2,479 (63.6) | 77,488 (56.9) | 0.137 |
| Prior infection, n (%) | 515 (3.9) | 3,677 (0.7) | 0.217 | 51 (1.3) | 735 (0.5) | 0.080 |
| Comorbidities, n (%) | ||||||
| Anxiety | 3,728 (28.4) | 70,787 (13.1) | 0.383 | 1,192 (30.6) | 18,933 (13.9) | 0.409 |
| Asthma | 1,759 (13.4) | 28,264 (5.2) | 0.283 | 552 (14.2) | 8,408 (6.2) | 0.267 |
| Atrial fibrillation | 873 (6.6) | 19,838 (3.7) | 0.134 | 220 (5.6) | 3,816 (2.8) | 0.142 |
| CKD, stage 3–4 | 1,437 (10.9) | 21,530 (4.0) | 0.267 | 346 (8.9) | 3,809 (2.8) | 0.262 |
| Chronic liver disease | 1,200 (9.1) | 9,693 (1.8) | 0.327 | 334 (8.6) | 2,327 (1.7) | 0.314 |
| COPD | 893 (6.8) | 17,839 (3.3) | 0.160 | 261 (6.7) | 4,875 (3.6) | 0.142 |
| Coronary artery disease | 1,843 (14.0) | 28,912 (5.4) | 0.296 | 520 (13.3) | 5,568 (4.1) | 0.332 |
| Depression | 3,538 (26.9) | 52,801 (9.8) | 0.454 | 1,036 (26.6) | 13,247 (9.7) | 0.448 |
| Heart failure | 1,025 (7.8) | 14,487 (2.7) | 0.231 | 299 (7.7) | 3,237 (2.4) | 0.244 |
| Hypertension | 8,577 (65.3) | 120,394 (22.3) | 0.961 | 2,303 (59.1) | 24,203 (17.8) | 0.938 |
| NAFLD/MASH | 1,056 (8.0) | 5,732 (1.1) | 0.340 | 286 (7.3) | 1,405 (1.0) | 0.319 |
| Obesity | 7,508 (57.2) | 40,489 (7.5) | 1.253 | 2,223 (57.0) | 9,169 (6.7) | 1.281 |
| Stroke, history of | 163 (1.2) | 4,050 (0.8) | 0.049 | 44 (1.1) | 732 (0.5) | 0.065 |
| Tobacco use, current | 784 (6.0) | 23,846 (4.4) | 0.070 | 278 (7.1) | 7,908 (5.8) | 0.054 |
| Tobacco use, former | 852 (6.5) | 17,965 (3.3) | 0.146 | 255 (6.5) | 4,109 (3.0) | 0.166 |
| Type 2 diabetes | 8,461 (64.4) | 31,555 (5.9) | 1.554 | 2,221 (56.9) | 6,119 (4.5) | 1.382 |
| Healthcare utilization (12 months pre-index), n (%) | ||||||
| Office or outpatient visit | 12,132 (92.4) | 314,750 (58.4) | 0.860 | 3,540 (90.8) | 70,477 (51.7) | 0.957 |
| Hospital inpatient stay | 1,187 (9.0) | 18,292 (3.4) | 0.236 | 284 (7.3) | 4,198 (3.1) | 0.190 |
Table 2.
Post-matching baseline characteristics (1:1 propensity-score matched) of the semaglutide and no GLP-1 receptor agonist cohorts, COVID-19 and influenza. Demographic, clinical, and healthcare utilization characteristics measured in the 12 months prior to infection, after 1:1 propensity-score matching. Standardized mean differences (SMDs) compare the semaglutide and no GLP-1 RA cohorts within each infection cohort.
Table 2.
Post-matching baseline characteristics (1:1 propensity-score matched) of the semaglutide and no GLP-1 receptor agonist cohorts, COVID-19 and influenza. Demographic, clinical, and healthcare utilization characteristics measured in the 12 months prior to infection, after 1:1 propensity-score matching. Standardized mean differences (SMDs) compare the semaglutide and no GLP-1 RA cohorts within each infection cohort.
| Characteristic | COVID-19 cohort | Influenza cohort | ||||
|---|---|---|---|---|---|---|
| Semaglutide (n = 11,238) |
No GLP-1 RA (n = 11,238) |
SMD | Semaglutide (n = 3,409) |
No GLP-1 RA (n = 3,409) |
SMD | |
| Demographics | ||||||
| Age group, n (%) | 0.081 | 0.078 | ||||
| 18–47 years | 3,109 (27.7) | 2,815 (25.0) | 1,309 (38.4) | 1,192 (35.0) | ||
| 48–64 years | 4,707 (41.9) | 4,612 (41.0) | 1,315 (38.6) | 1,345 (39.5) | ||
| ≥65 years | 3,422 (30.5) | 3,811 (33.9) | 785 (23.0) | 872 (25.6) | ||
| Sex, n (%) | 0.016 | 0.021 | ||||
| Female | 7,459 (66.4) | 7,387 (65.7) | 2,328 (68.3) | 2,294 (67.3) | ||
| Male | 3,777 (33.6) | 3,850 (34.3) | 1,081 (31.7) | 1,115 (32.7) | ||
| Unknown | <11 | <11 | 0 (0.0) | 0 (0.0) | ||
| Race, n (%) | 0.041 | 0.050 | ||||
| White | 8,792 (78.2) | 8,783 (78.2) | 2,636 (77.3) | 2,663 (78.1) | ||
| Black or African American | 1,646 (14.6) | 1,604 (14.3) | 477 (14.0) | 457 (13.4) | ||
| Asian | 206 (1.8) | 261 (2.3) | 73 (2.1) | 82 (2.4) | ||
| Native American or Pacific Islander | 102 (0.9) | 121 (1.1) | 36 (1.1) | 32 (0.9) | ||
| Other/Mixed | 181 (1.6) | 168 (1.5) | 70 (2.1) | 80 (2.3) | ||
| Unknown | 311 (2.8) | 301 (2.7) | 117 (3.4) | 95 (2.8) | ||
| Ethnicity, n (%) | 0.005 | 0.010 | ||||
| Hispanic or Latino | 501 (4.5) | 510 (4.5) | 202 (5.9) | 200 (5.9) | ||
| Not Hispanic or Latino | 9,294 (82.7) | 9,296 (82.7) | 2,711 (79.5) | 2,724 (79.9) | ||
| Unknown | 1,443 (12.8) | 1,432 (12.7) | 496 (14.5) | 485 (14.2) | ||
| Anthropometrics and metabolic status | ||||||
| BMI category, n (%) | 0.060 | 0.084 | ||||
| Underweight (<18.5) | 12 (0.1) | 24 (0.2) | <11 | <11 | ||
| Normal (18.5–24.9) | 549 (4.9) | 479 (4.3) | 180 (5.3) | 136 (4.0) | ||
| Overweight (25–29.9) | 2,148 (19.1) | 2,207 (19.6) | 680 (19.9) | 671 (19.7) | ||
| Class 1 obesity (30–34.9) | 3,029 (27.0) | 3,133 (27.9) | 911 (26.7) | 962 (28.2) | ||
| Class 2 obesity (35–39.9) | 2,635 (23.4) | 2,703 (24.1) | 743 (21.8) | 776 (22.8) | ||
| Class 3 obesity (≥40) | 1,289 (11.5) | 1,271 (11.3) | 422 (12.4) | 408 (12.0) | ||
| Unknown | 1,576 (14.0) | 1,421 (12.6) | 470 (13.8) | 447 (13.1) | ||
| HbA1c category, n (%) | 0.028 | 0.046 | ||||
| Normal (4.0–5.6) | 1,981 (17.6) | 2,019 (18.0) | 647 (19.0) | 682 (20.0) | ||
| Pre-diabetic (5.7–6.4) | 2,121 (18.9) | 2,160 (19.2) | 553 (16.2) | 592 (17.4) | ||
| Diabetic (6.5–16.0) | 3,592 (32.0) | 3,660 (32.6) | 954 (28.0) | 929 (27.3) | ||
| Unknown | 3,544 (31.5) | 3,399 (30.2) | 1,255 (36.8) | 1,206 (35.4) | ||
| Infection context | ||||||
| Vaccinated, n (%) | 2,552 (22.7) | 2,585 (23.0) | 0.007 | 700 (20.5) | 703 (20.6) | 0.002 |
| Variant era, n (%) | 0.027 | – | ||||
| Pre-Delta | 573 (5.1) | 603 (5.4) | – | – | – | |
| Delta | 921 (8.2) | 942 (8.4) | – | – | – | |
| Omicron BA.1/BA.2 | 1,081 (9.6) | 1,110 (9.9) | – | – | – | |
| Omicron BA.4/BA.5 | 1,410 (12.5) | 1,473 (13.1) | – | – | – | |
| Omicron XBB or later | 7,253 (64.5) | 7,110 (63.3) | – | – | – | |
| Antiviral ±7 days of infection, n (%) | 5,638 (50.2) | 5,589 (49.7) | 0.009 | 2,148 (63.0) | 2,079 (61.0) | 0.042 |
| Prior infection, n (%) | 361 (3.2) | 336 (3.0) | 0.013 | 40 (1.2) | 36 (1.1) | 0.011 |
| Comorbidities, n (%) | ||||||
| Anxiety | 3,069 (27.3) | 3,064 (27.3) | 0.001 | 1,004 (29.5) | 1,045 (30.7) | 0.026 |
| Asthma | 1,404 (12.5) | 1,389 (12.4) | 0.004 | 448 (13.1) | 428 (12.6) | 0.018 |
| Atrial fibrillation | 806 (7.2) | 877 (7.8) | 0.024 | 203 (6.0) | 209 (6.1) | 0.007 |
| CKD, stage 3–4 | 1,273 (11.3) | 1,317 (11.7) | 0.012 | 300 (8.8) | 299 (8.8) | 0.001 |
| Chronic liver disease | 879 (7.8) | 835 (7.4) | 0.015 | 255 (7.5) | 229 (6.7) | 0.030 |
| COPD | 774 (6.9) | 789 (7.0) | 0.005 | 242 (7.1) | 260 (7.6) | 0.020 |
| Coronary artery disease | 1,604 (14.3) | 1,676 (14.9) | 0.018 | 442 (13.0) | 477 (14.0) | 0.030 |
| Depression | 2,852 (25.4) | 2,869 (25.5) | 0.003 | 865 (25.4) | 857 (25.1) | 0.005 |
| Heart failure | 882 (7.8) | 901 (8.0) | 0.006 | 266 (7.8) | 283 (8.3) | 0.018 |
| Hypertension | 7,077 (63.0) | 7,357 (65.5) | 0.052 | 1,915 (56.2) | 1,964 (57.6) | 0.029 |
| NAFLD/MASH | 755 (6.7) | 680 (6.1) | 0.027 | 212 (6.2) | 177 (5.2) | 0.044 |
| Obesity | 5,902 (52.5) | 6,154 (54.8) | 0.045 | 1,792 (52.6) | 1,868 (54.8) | 0.045 |
| Stroke, history of | 147 (1.3) | 167 (1.5) | 0.015 | 40 (1.2) | 43 (1.3) | 0.008 |
| Tobacco use, current | 679 (6.0) | 725 (6.5) | 0.017 | 242 (7.1) | 248 (7.3) | 0.007 |
| Tobacco use, former | 724 (6.4) | 744 (6.6) | 0.007 | 218 (6.4) | 210 (6.2) | 0.010 |
| Type 2 diabetes | 6,600 (58.7) | 6,671 (59.4) | 0.013 | 1,754 (51.5) | 1,708 (50.1) | 0.027 |
| Healthcare utilization (12 months pre-index), n (%) | ||||||
| Office or outpatient visit | 10,276 (91.4) | 10,360 (92.2) | 0.027 | 3,059 (89.7) | 3,094 (90.8) | 0.035 |
| Hospital inpatient stay | 986 (8.8) | 1,011 (9.0) | 0.008 | 234 (6.9) | 226 (6.6) | 0.009 |
Table 3.
Thirty-day risk of clinical outcomes following COVID-19 and influenza infection in semaglutide-treated patients vs non–GLP-1RA comparators, stratified by age group at infection. .
Table 3.
Thirty-day risk of clinical outcomes following COVID-19 and influenza infection in semaglutide-treated patients vs non–GLP-1RA comparators, stratified by age group at infection. .
| Outcome | Semaglutide n/N (%) | Comparator n/N (%) |
RR (95% CI) | P | Adj. P |
|---|---|---|---|---|---|
| COVID-19 cohort — age 18–47 | |||||
| All-cause mortality | <11 | <11 | 0.45 (0.04–4.99) | 0.51 | 0.54 |
| Hospitalization | 58/3,109 (1.9%) | 99/2,815 (3.5%) | 0.53 (0.39–0.73) | <0.001 | <0.001 |
| Emergency department visit | 198/3,109 (6.4%) | 258/2,815 (9.2%) | 0.69 (0.58–0.83) | <0.001 | <0.001 |
| ICU admission | 12/3,109 (0.4%) | 27/2,815 (1.0%) | 0.40 (0.20–0.79) | 0.006 | 0.01 |
| Mechanical ventilation | <11 | 15/2,815 (0.5%) | 0.42 (0.17–1.03) | 0.05 | 0.07 |
| Composite outcome | 61/3,109 (2.0%) | 107/2,815 (3.8%) | 0.52 (0.38–0.70) | <0.001 | <0.001 |
| COVID-19 cohort — age 48–64 | |||||
| All-cause mortality | <11 | 16/4,612 (0.3%) | 0.06 (0.01–0.46) | <0.001 | <0.001 |
| Hospitalization | 152/4,707 (3.2%) | 288/4,612 (6.2%) | 0.52 (0.43–0.63) | <0.001 | <0.001 |
| Emergency department visit | 338/4,707 (7.2%) | 462/4,612 (10.0%) | 0.72 (0.63–0.82) | <0.001 | <0.001 |
| ICU admission | 36/4,707 (0.8%) | 84/4,612 (1.8%) | 0.42 (0.28–0.62) | <0.001 | <0.001 |
| Mechanical ventilation | 17/4,707 (0.4%) | 33/4,612 (0.7%) | 0.50 (0.28–0.90) | 0.02 | 0.03 |
| Composite outcome | 161/4,707 (3.4%) | 303/4,612 (6.6%) | 0.52 (0.43–0.63) | <0.001 | <0.001 |
| COVID-19 cohort — age 65+ | |||||
| All-cause mortality | <11 | 25/3,811 (0.7%) | 0.40 (0.19–0.86) | 0.01 | 0.02 |
| Hospitalization | 266/3,422 (7.8%) | 427/3,811 (11.2%) | 0.69 (0.60–0.80) | <0.001 | <0.001 |
| Emergency department visit | 408/3,422 (11.9%) | 632/3,811 (16.6%) | 0.72 (0.64–0.81) | <0.001 | <0.001 |
| ICU admission | 64/3,422 (1.9%) | 103/3,811 (2.7%) | 0.69 (0.51–0.94) | 0.02 | 0.03 |
| Mechanical ventilation | 18/3,422 (0.5%) | 37/3,811 (1.0%) | 0.54 (0.31–0.95) | 0.03 | 0.04 |
| Composite outcome | 269/3,422 (7.9%) | 450/3,811 (11.8%) | 0.67 (0.58–0.77) | <0.001 | <0.001 |
| Influenza cohort — age 18–47 | |||||
| All-cause mortality | <11 | <11 | 0.18 (0.01–3.79) | 0.23 | 0.27 |
| Hospitalization | 13/1,309 (1.0%) | 35/1,192 (2.9%) | 0.34 (0.18–0.64) | <0.001 | <0.001 |
| Emergency department visit | 75/1,309 (5.7%) | 127/1,192 (10.7%) | 0.54 (0.41–0.71) | <0.001 | <0.001 |
| ICU admission | <11 | <11 | 0.52 (0.15–1.77) | 0.29 | 0.32 |
| Mechanical ventilation | <11 | <11 | 0.18 (0.01–3.79) | 0.23 | 0.27 |
| Composite outcome | 14/1,309 (1.1%) | 37/1,192 (3.1%) | 0.34 (0.19–0.63) | <0.001 | <0.001 |
| Influenza cohort — age 48–64 | |||||
| All-cause mortality | <11 | <11 | 1.02 (0.06–16.34) | 0.99 | 0.99 |
| Hospitalization | 47/1,315 (3.6%) | 92/1,345 (6.8%) | 0.52 (0.37–0.74) | <0.001 | <0.001 |
| Emergency department visit | 103/1,315 (7.8%) | 178/1,345 (13.2%) | 0.59 (0.47–0.75) | <0.001 | <0.001 |
| ICU admission | 17/1,315 (1.3%) | 29/1,345 (2.2%) | 0.60 (0.33–1.09) | 0.09 | 0.12 |
| Mechanical ventilation | <11 | <11 | 0.45 (0.14–1.47) | 0.18 | 0.23 |
| Composite outcome | 48/1,315 (3.7%) | 97/1,345 (7.2%) | 0.51 (0.36–0.71) | <0.001 | <0.001 |
| Influenza cohort — age 65+ | |||||
| All-cause mortality | <11 | <11 | 0.56 (0.10–3.02) | 0.49 | 0.53 |
| Hospitalization | 90/785 (11.5%) | 138/872 (15.8%) | 0.72 (0.57–0.93) | 0.01 | 0.02 |
| Emergency department visit | 126/785 (16.1%) | 194/872 (22.2%) | 0.72 (0.59–0.88) | 0.001 | 0.003 |
| ICU admission | 23/785 (2.9%) | 30/872 (3.4%) | 0.85 (0.50–1.45) | 0.56 | 0.57 |
| Mechanical ventilation | <11 | <11 | 0.56 (0.19–1.62) | 0.27 | 0.32 |
| Composite outcome | 93/785 (11.8%) | 141/872 (16.2%) | 0.73 (0.57–0.93) | 0.01 | 0.02 |
Table 4.
Thirty-day COVID-19 outcomes during the pandemic era among propensity-matched semaglutide users versus non–GLP-1 RA comparators, stratified by use of specific co-interventions or by vaccination status. (A) Among patients who initiated systemic corticosteroids within ±7 days of COVID-19 diagnosis (n=373 pairs). (B) Among patients on metformin within the 12 months prior to COVID-19 diagnosis (n=872 pairs). (C) Among patients who initiated Paxlovid (nirmatrelvir/ritonavir) within ±7 days of COVID-19 diagnosis (n=473 pairs). (D) Stratified by COVID-19 vaccination status documented within the 12 months prior to COVID-19 diagnosis (vaccinated: n=1,373 semaglutide / 1,514 comparator; unvaccinated: n=3,229 semaglutide / 3,811 comparator). Risk ratios with adjusted P < 0.05 are shown in bold.
Table 4.
Thirty-day COVID-19 outcomes during the pandemic era among propensity-matched semaglutide users versus non–GLP-1 RA comparators, stratified by use of specific co-interventions or by vaccination status. (A) Among patients who initiated systemic corticosteroids within ±7 days of COVID-19 diagnosis (n=373 pairs). (B) Among patients on metformin within the 12 months prior to COVID-19 diagnosis (n=872 pairs). (C) Among patients who initiated Paxlovid (nirmatrelvir/ritonavir) within ±7 days of COVID-19 diagnosis (n=473 pairs). (D) Stratified by COVID-19 vaccination status documented within the 12 months prior to COVID-19 diagnosis (vaccinated: n=1,373 semaglutide / 1,514 comparator; unvaccinated: n=3,229 semaglutide / 3,811 comparator). Risk ratios with adjusted P < 0.05 are shown in bold.
| Outcome | Semaglutide n/N (%) | Comparator n/N (%) |
RR (95% CI) | P | Adj. P |
|---|---|---|---|---|---|
| A. Corticosteroids | |||||
| All-cause mortality | <11 | <11 | 0.20 (0.01–4.15) | 0.50 | 1.00 |
| Hospitalization | 27/373 (7.2%) | 27/373 (7.2%) | 1.00 (0.60–1.67) | 1.00 | 1.00 |
| Emergency department visit | 41/373 (11.0%) | 42/373 (11.3%) | 0.98 (0.65–1.46) | 1.00 | 1.00 |
| Intensive care unit admission | <11 | <11 | 0.71 (0.23–2.23) | 0.77 | 1.00 |
| Mechanical ventilation | <11 | <11 | 1.00 (0.14–7.06) | 1.00 | 1.00 |
| Composite outcome | 28/373 (7.5%) | 28/373 (7.5%) | 1.00 (0.60–1.65) | 1.00 | 1.00 |
| B. Metformin | |||||
| All-cause mortality | <11 | <11 | 0.14 (0.01–2.76) | 0.25 | 0.30 |
| Hospitalization | 41/872 (4.7%) | 63/872 (7.2%) | 0.65 (0.44–0.95) | 0.03 | 0.06 |
| Emergency department visit | 91/872 (10.4%) | 103/872 (11.8%) | 0.88 (0.68–1.15) | 0.40 | 0.40 |
| Intensive care unit admission | <11 | 18/872 (2.1%) | 0.39 (0.16–0.93) | 0.04 | 0.06 |
| Mechanical ventilation | <11 | <11 | 0.20 (0.04–0.91) | 0.04 | 0.06 |
| Composite outcome | 42/872 (4.8%) | 66/872 (7.6%) | 0.64 (0.44–0.93) | 0.02 | 0.06 |
| C. Paxlovid | |||||
| All-cause mortality | <11 | <11 | 0.25 (0.03–2.23) | 0.37 | 0.37 |
| Hospitalization | 17/473 (3.6%) | 46/473 (9.7%) | 0.37 (0.22–0.64) | <0.001 | 0.002 |
| Emergency department visit | 45/473 (9.5%) | 59/473 (12.5%) | 0.76 (0.53–1.10) | 0.18 | 0.22 |
| Intensive care unit admission | <11 | 15/473 (3.2%) | 0.20 (0.06–0.69) | 0.007 | 0.01 |
| Mechanical ventilation | <11 | <11 | 0.14 (0.02–1.16) | 0.07 | 0.11 |
| Composite outcome | 17/473 (3.6%) | 48/473 (10.1%) | 0.35 (0.21–0.61) | <0.001 | 0.002 |
| D. COVID-19 vaccination status (pandemic era) | |||||
| Vaccinated | |||||
| All-cause mortality | <11 | <11 | 0.22 (0.01–4.59) | 0.50 | 0.50 |
| Hospitalization | 51/1,373 (3.7%) | 85/1,514 (5.6%) | 0.66 (0.47–0.93) | 0.02 | 0.03 |
| Emergency department visit | 128/1,373 (9.3%) | 161/1,514 (10.6%) | 0.88 (0.70–1.09) | 0.26 | 0.31 |
| Intensive care unit admission | <11 | 23/1,514 (1.5%) | 0.29 (0.12–0.70) | 0.004 | 0.007 |
| Mechanical ventilation | <11 | <11 | 0.44 (0.09–2.27) | 0.46 | 0.50 |
| Composite outcome | 51/1,373 (3.7%) | 89/1,514 (5.9%) | 0.63 (0.45–0.88) | 0.007 | 0.01 |
| Unvaccinated | |||||
| All-cause mortality | <11 | 32/3,811 (0.8%) | 0.18 (0.07–0.47) | <0.001 | 0.001 |
| Hospitalization | 181/3,229 (5.6%) | 353/3,811 (9.3%) | 0.61 (0.51–0.72) | <0.001 | 0.001 |
| Emergency department visit | 322/3,229 (10.0%) | 517/3,811 (13.6%) | 0.74 (0.64–0.84) | <0.001 | 0.001 |
| Intensive care unit admission | 44/3,229 (1.4%) | 96/3,811 (2.5%) | 0.54 (0.38–0.77) | <0.001 | 0.001 |
| Mechanical ventilation | 20/3,229 (0.6%) | 55/3,811 (1.4%) | 0.43 (0.26–0.71) | <0.001 | 0.001 |
| Composite outcome | 186/3,229 (5.8%) | 371/3,811 (9.7%) | 0.59 (0.50–0.70) | <0.001 | 0.001 |
Disclaimer/Publisher’s Note: The statements, opinions and data contained in all publications are solely those of the individual author(s) and contributor(s) and not of MDPI and/or the editor(s). MDPI and/or the editor(s) disclaim responsibility for any injury to people or property resulting from any ideas, methods, instructions or products referred to in the content. |
© 2026 by the authors. Licensee MDPI, Basel, Switzerland. This article is an open access article distributed under the terms and conditions of the Creative Commons Attribution (CC BY) license (http://creativecommons.org/licenses/by/4.0/).
Copyright: This open access article is published under a Creative Commons CC BY 4.0 license, which permit the free download, distribution, and reuse, provided that the author and preprint are cited in any reuse.


