

Submitted:
05 June 2026
Posted:
08 June 2026
You are already at the latest version
Abstract
Biodiversity and landscape heterogeneity are key components of agroecosystem func-tioning because they support ecosystem services and strengthen the capacity of agricultural systems to undertake sustainable agroecological transitions. This study as-sesses the landscape structure of the municipality of Ruvo di Puglia, within the Bio-Distretto delle Lame, to evaluate its potential to support such a transition. Biodistricts are territories in which farmers, local authorities, citizens and other stakeholders collaborate to manage natural and agricultural resources sustainably, often with a strong connection to organic farming. The research combines freely availa-ble Sentinel-2 imagery with UAV-based ground truthing to update land-use/land-cover information and to derive landscape indicators. A systematic sampling scheme was designed in QGIS, and UAV flights over 14 areas were used to generate training and validation vectors. Two classification strategies were tested on 2024 Sentinel-2 data: a supervised pixel-based approach and an unsupervised multi-temporal object-based approach (GEOBIA). The best-performing map was obtained from the supervised classification of July NDVI data, with an overall accuracy of 91.76%. Comparison with the 2018 official land-cover dataset indicates a decrease in agricultural land (-490.91 ha), a reduction in arable crops (-1,216.43 ha), and an increase in permanent crops (+725.52 ha), suggesting a shift toward specialization. At the same time, natural and semi-natural areas increased, improving the landscape potential for ecological functions. However, the high fragmentation detected by the landscape metrics (average patch size approximately 0.25 ha) may limit habitat continuity and species stability. The results should therefore be interpreted as an assessment of landscape structure and potential biodiversity support, rather than as a direct measurement of biological diversity. Strengthening ecotones, hedgerows and semi-natural linear elements with native species would further improve landscape resilience and support agroecological planning.
Keywords:
agroecology
; bio-district
; landscape diversity
; landscape ecology
; landscape metrics
; remote sensing
; sentinel-2
; UAV
; land-use/land-cover classification
1. Introduction
1.1. Background
Agricultural landscapes currently face the dual challenge of sustaining food production while preserving the ecological foundations on which farming depends. Landscape simplification, biodiversity loss, soil degradation and climate pressures increasingly threaten the long-term resilience of agroecosystems, particularly in Mediterranean areas where climatic variability and land-use intensification interact strongly.
Bio-districts bring together farmers, local authorities, citizens, tourism operators and other local actors to manage natural and agricultural resources in a coordinated and sustainable manner. By fostering short supply chains, supporting organic farming and maintaining traditional land uses, bio-districts can contribute to the preservation of heterogeneous landscapes composed of mixed crops, terraced fields, hedgerows, woodlots and semi-natural habitats. Organic agriculture provides a regulatory and practical framework that prioritizes environmental health by limiting synthetic inputs. Agroecology broadens this perspective by framing agriculture as a socio-ecological system embedded within wider landscapes. From this viewpoint, biodiversity conservation and landscape stewardship must extend beyond individual farms, because ecological processes operate across fields, habitats and regions and support essential ecosystem services such as soil fertility, pollination, water regulation, and natural pest and disease control.
As a result, bio-districts offer a practical context in which biodiversity conservation and landscape management become shared community priorities rather than isolated farm-level decisions. Understanding how biodiversity is shaped and maintained at different spatial scales from plots to farms to entire landscapes is therefore essential for guiding ecological transition processes. The design of a landscape supportive of the agroecological transition is a process entailing the shaping and intentional planning of the landscape according well defined goals or outcomes [1].
The structural features of landscapes are fundamental for biodiversity as they provide habitat for species communities, and diversified ecological niches and connected landscapes facilitate species movement and enhance the provision of key ecosystem services. The analysis of landscape biodiversity, measured through indicators such as patch diversity, habitat connectivity, and land-cover composition, is an approach that has repeatedly proven useful and supportive of biodiversity management and conservation strategies that allow the achievement of richer species communities and more stable ecological functions and that is rediscovered as very current. New monitoring tools, including satellite imagery and drone-based surveys, offer unprecedented opportunities to quantify these patterns and assess how agricultural practices and anthropic activities interact with landscape-level biodiversity.
1.2. Problem Statement
Mediterranean agricultural landscapes face growing pressures related to land degradation, the simplification of the agricultural mosaic and biodiversity loss, conditions that threaten ecological resilience and production stability in a context of increasing climate variability. In response to these challenges, integrated land management approaches, such as bio-districts, are emerging as key tools for connecting sustainable agricultural practices, landscape planning, and participatory governance. Within the framework of organic farming and inspired by the principles of agroecology, bio-districts promote crop diversification, habitat protection, and coordinated management of natural resources to strengthen ecosystem services related to soil fertility, water regulation, and biodiversity conservation.
At present, the Bio-Distretto delle Lame relies on land-use information that is not sufficiently updated or detailed for operational agroecological planning. The available official cartography provides an important reference baseline, but its spatial resolution and date of production limit its ability to describe current fine-scale landscape patterns, especially small patches, ecotones and linear semi-natural elements.
This study focuses on the municipality of Ruvo di Puglia within the Bio-Distretto delle Lame, where updated spatial data are needed to support agroecological planning. By developing an updated land-use/land-cover map and calculating landscape ecology indicators, the research proposes a method for assessing the landscape structure that can support biodiversity-related ecosystem services at territorial scale. While acknowledging that landscape metrics are proxies of habitat structure and potential ecological functionality rather than direct measurements of species diversity; the results are intended to inform local planning, community strategies and future monitoring activities.
1.3. Research Aim
The aim of the research was to assess the landscape endowment and structural conditions of the municipality of Ruvo di Puglia, within the Bio-Distretto delle Lame, in order to evaluate its potential ability to support the agroecological transition. To achieve this aim, remote sensing technologies were used to produce updated land-use/land-cover information, and a set of landscape ecology indicators was calculated to describe composition, fragmentation and connectivity. The specific objectives were: (i) to evaluate land-cover changes in the municipality of Ruvo di Puglia by comparing current data with historical maps and official sources; and (ii) to assess landscape and cropping-system diversity through quantitative indicators relevant to agroecosystem functioning.
2. Materials and Methods
2.1. Study Area
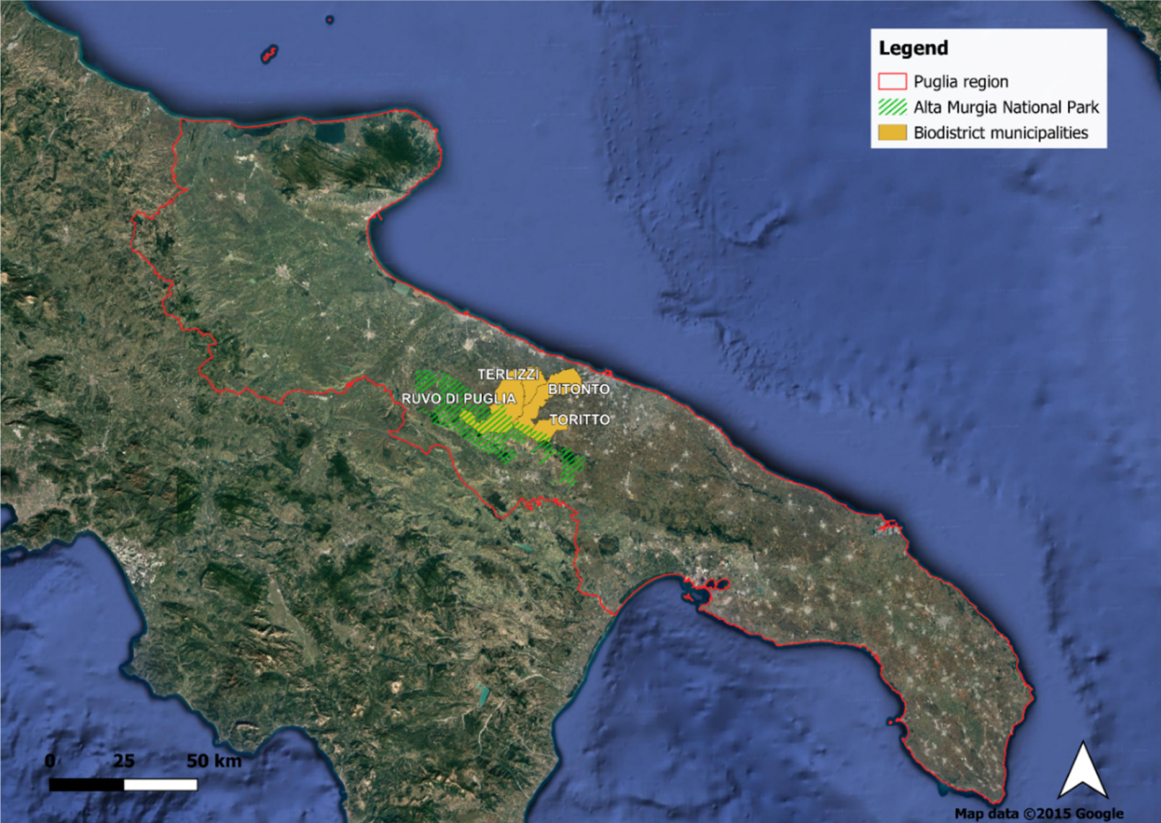
The study was carried out in the municipality of Ruvo di Puglia, which is part of the Metropolitan City of Bari (Apulia, southern Italy) and covers an area of approximately 222.04 km2. The municipality borders Bitonto to the east, Corato to the west, Terlizzi to the north-east and Bisceglie to the north. The area is characterized by the karst morphology typical of Apulia, including sinkholes, karst valleys, caves and endorheic depressions. Agricultural land use, especially olive groves, vineyards and other permanent crops, is a defining feature of the local economy and landscape. A portion of the municipal territory overlaps with the Alta Murgia National Park, a protected area of high biodiversity value.
Figure 1.
Map of Ruvo di Puglia.
2.2. Data Collection
The methodological framework is built on integrated remote sensing techniques, which make use of electromagnetic radiation to obtain information about the Earth’s surface without direct contact, achieving the spatial and spectral data needed for biodiversity evaluation, land use classification, and environmental monitoring. UAV imagery and Multispectral Sentinel-2 satellite data were used as complementary data sources.
2.3. Data Acquisition Procedures
A DJI Mavic 3 Enterprise with a 12 MP camera was used for UAV surveys, enabling extremely high-resolution observations of local land cover features. The Copernicus Program’s Sentinel-2 constellation provided systematic, free and multitemporal coverage of satellite data [2].
A systematic sampling approach was used (in QGIS) to identify the sampling sites and plan for the drone flights in the municipality. A standard grid of 50 x 50 m (2,500 m2 each cell) was produced, and points were placed in the middle of each grid cell to create a regular point pattern. The portion of the Alta Murgia National Park overlapping the municipality was excluded from UAV operations in order to avoid disturbing the inhabiting protected species.
Take-off and landing locations, flight routes with a minimum overlaps of 60% frontal and 80% lateral, and the recording of GPS coordinates using Ground Control Points for greater positional accuracy, were all part of UAV mission planning.
Sentinel-2 Level-2A images were downloaded from the Copernicus Open Access Hub, selecting cloud-free scenes.
2.4. Data Processing and Classification
UAV imagery was processed through Agisoft Metashape using a typical photogrammetric methodology that includes picture alignment, dense point cloud generation, and the creation of Digital Terrain Models (DTM) and Digital Elevation Models (DEM). These steps were used to build orthorectified mosaics, that after being exported as georeferenced TIFF files, were then imported into QGIS. Based on UAV orthomosaics, representative land-cover samples were manually digitized to produce training datasets for satellite image classification. Two independent datasets were prepared: a primary training vector used to calibrate the classifier and an independent validation vector used for accuracy assessment [2] .
2.4.1. Pre-Elaboration of Satellite images
The Sentinel-2 satellite images time series for 2024 were prepared following two different approaches, A and B, aiming to explore possibilities for maximizing the potential and limitations offered by data, i.e., the available spatial resolution, the wealth of spectral information and the advantage of observing the same piece of land and the corresponding land cover categories at different moments of the year.
Approach A consisted of supervised classification of monthly Sentinel-2 multispectral images and monthly NDVI layers. Random Forest and Support Vector Machine classifiers were tested using UAV-derived training data. The Random Forest model was configured with 500 trees and cross-validation enabled; the official regional Digital Terrain Model was included as an additional input variable to account for topographic effects. Classification performance was evaluated through confusion matrices and standard accuracy metrics.
Approach B consisted of an unsupervised multi-temporal Geographic Object-Based Image Analysis (GEOBIA) workflow designed to explore whether land-cover patterns could be derived with reduced dependence on a priori labelled training data. Twenty-four Sentinel-2 images from 2024 (tile 33TXF), corresponding to two cloud-free scenes per month, were used to produce monthly multispectral and NDVI composites. NDVI was calculated at 10 m resolution and resampled to 20 m to reduce local variability and ephasize phenological trends. Image segmentation was performed using the GRASS GIS i.segment module within a semi-automated processing chain developed at the CIHEAM Bari Geomatics Laboratory. Objects were described using spectral, geometric, textural and contextual features. K-means and ISODATA clustering were then applied to the multi-temporal NDVI series, and Dynamic Time Warping was used to aggregate phenologically similar groups.
2.4.2. Obtaining Land Cover Classes
Both the multispectral and NDVI time-series products generated through Approaches A and B were subsequently processed to derive harmonized macro land-cover classes and refine vegetation typologies. The final classification was performed using the Random Forest (RF) algorithm implemented in the Orfeo Tool Box (OTB) within the QGIS environment. The RF model was configured with 500 trees and a minimum split size of 3, while the cross-validation option was enabled to assess model robustness. The official regional Digital Terrain Model was also included as an ancillary input variable to account for topographic effects on spectral response. The outputs obtained from the supervised pixel-based workflow and the unsupervised/object-based workflow were then harmonized into a common set of macro land-cover classes and evaluated using the same accuracy assessment procedure. This step was essential to compare the two methodological approaches under a consistent validation framework and to identify the most reliable cartographic product for the subsequent calculation of landscape metrics. The resulting datasets were therefore subjected to the final Accuracy analysis.
2.4.3. Accuracy Assessment
Accuracy assessment was performed using independent validation datasets derived from UAV orthomosaics. Confusion matrices were used to compute Overall Accuracy, Kappa coefficient, Producer’s Accuracy and User’s Accuracy, allowing the reliability of each cartographic output to be compared. The independence of the validation dataset is a critical methodological point and should be explicitly documented in the final version.
In order to assess classification reliability and to compare supervised pixel-based and unsupervised object-based approaches, independent validation datasets from UAV orthomosaics were used to assess accuracy.
2.5. Biodiversity Analysis
Based on the best-performing map identified through the accuracy assessment, landscape diversity was evaluated through a set of quantitative indicators describing spatial heterogeneity, fragmentation and connectivity. These indicators were used as proxies for the landscape potential to support biodiversity-related ecological functions.
According to existing the principles of landscape ecology, the landscape is understood as a mosaic of spatially different patches (ecotopes or habitats) and transition zones (ecotones) [3]. Input for the GIS-based methods used in the analysis were provided by the elaboration of both Sentinel-2 satellite imagery and UAV-derived orthomosaics. Sentinel-2 images were repeatedly supervisedly classified to create spatial datasets of land cover classes; the findings were verified by focused field surveys and compared with official cartographic sources (SIT, 2024).
Ruvo di Puglia’s whole municipal area was the reference analytical unit (ecoregion). Using QGIS 3.34.8 (Prizren), a structured workflow comprising GIS-based interpretation, integration of official cartographic data, field verification, data validation, map modification, database construction, and indicator computation was used to characterize the landscape. Urban areas, water bodies and channels, wetlands, herbaceous and permanent crops, and ecological infrastructures such hedgerows, spontaneous vegetation patches, tree lines, forests, and woodlands were among the identified land cover categories. In order to facilitate landscape-level analysis, these classes were then combined into macro-categories (Table 1).
Fourteen landscape indicators were selected from the scientific literature according to their relevance for ecological and agroecological functions (Table 2). The indicators were grouped into three categories: composition, fragmentation and connection. Together, these metrics describe the spatial arrangement of land-cover classes, the degree of fragmentation of the landscape mosaic and the potential continuity of ecological interfaces.
2.5. Overall Validation and Comparison with Pre-Existing Data
To guarantee the reliability of intermediate and final results, validation was incorporated throughout the research workflow. The generated land-use/land-cover maps were checked against official reference datasets, including the Corine Land Cover 2018 inventory [16] provided through regional and national geographic information systems, and against UAV and field-derived evidence. Because CLC 2018 has a coarser spatial resolution and a larger minimum mapping unit than the Sentinel-2/UAV-based products, comparisons between 2018 and 2024 were interpreted cautiously as observed differences may reflect both real land-cover change and differences in mapping scale and thematic detail.
A participatory review with Bio-Distretto delle Lame stakeholders, including local authorities, farmers’ associations and research institutes, was also planned to verify the practical usefulness of the generated maps and to support their integration into future agricultural and territorial decision-making.
3. Results
3.1. Results from Classification of Satellite Images
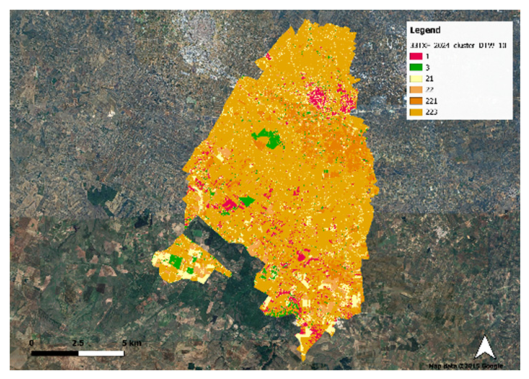
For all outputs of the classification processes, an accuracy assessment was performed using the validation vector. The seven best performing maps are reported in Table 3 with details of single class accuracy. This table shows that the highest classification accuracy was achieved using the supervised classification method applied to imagery from the month of July (map A2) (Table 4).
The classification process produced seven cartographic outputs derived from two methodological approaches: Approach A, based on supervised pixel-based classification, and Approach B, based on unsupervised multi-temporal object-based analysis followed by supervised labelling. The main characteristics of each cartographic output are reported in Table 3, and the corresponding maps are shown in Figures 2–12.
Figure 2.
Land Cover according CLC updated 2018.
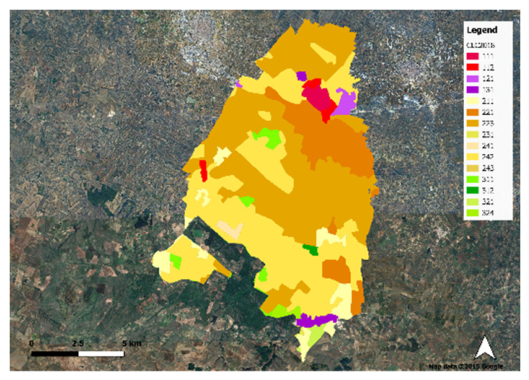
Figure 3.
A 1.
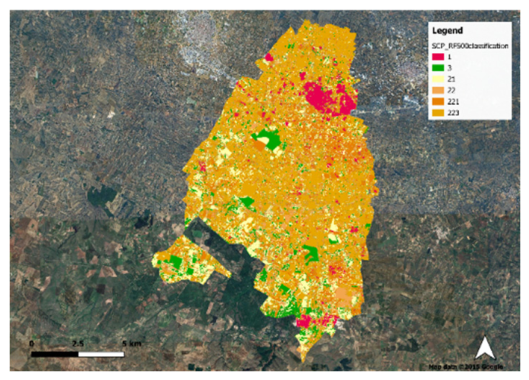
Figure 4.
A 2.
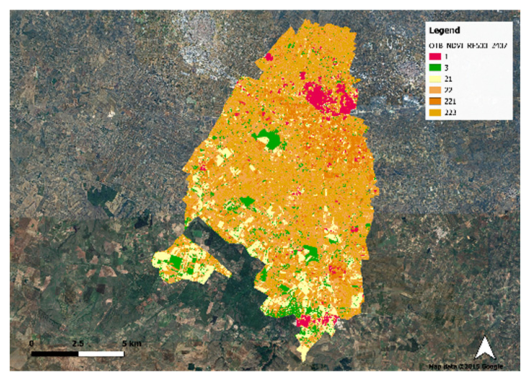
Figure 5.
B 1.
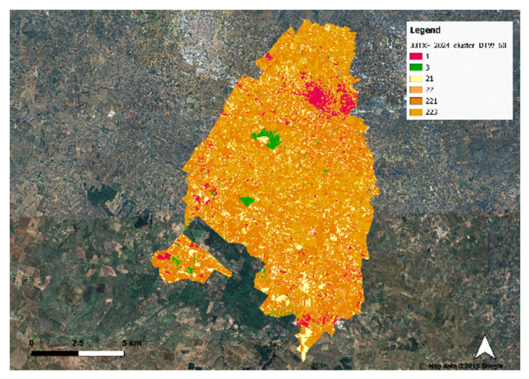
Figure 6.
B 2.
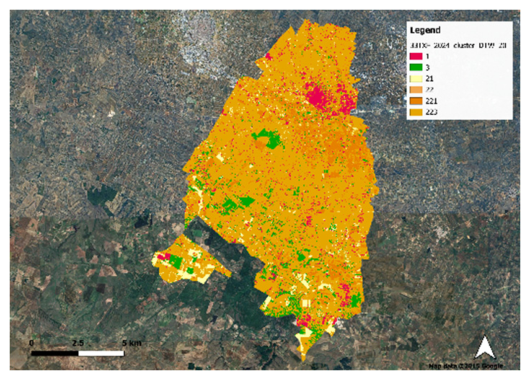
Figure 7.
B 3.
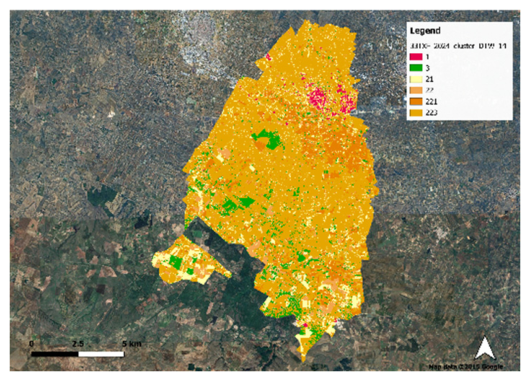
Figure 8.
A 3.
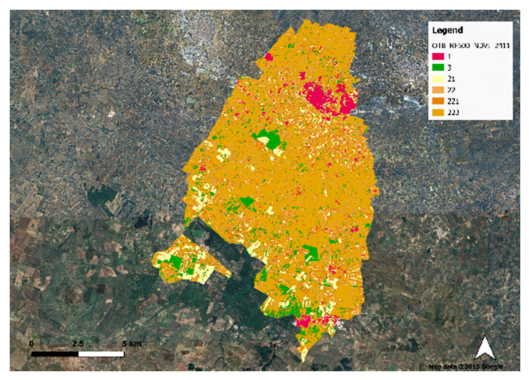
Figure 12.
B 4.
3.2. Calculation of the Indicators of Diversity at Landscape Level
The landscape-level analysis was carried out using the best-performing classified map. Fourteen landscape indicators were calculated, as described in the Materials and Methods section, and grouped into composition, fragmentation and connection metrics. Their values are reported in Table 5, Table 6 and Table 7 and compared with those derived from the official CLC 2018 cartography. This comparison provides useful context, but it should not be interpreted as a fully homogeneous diachronic comparison because of the different spatial resolution and mapping rules of the two datasets.
4. Discussion
The rationale for testing two classification approaches was to assess whether a repeatable, cost-effective and updatable land-use/land-cover monitoring workflow could be developed for a heterogeneous Mediterranean agricultural landscape. In this perspective, the comparison between Approach A and Approach B should not be interpreted only as a technical exercise, but as a way to evaluate the trade-off between operational accuracy and reduction of dependence on a priori labelled data. Approach A, based on supervised pix-el-based classification supported by UAV-derived training data, represents the moltioperational solution in the present study. Approach B, based on an unsupervised multi-temporal GEOBIA workflow, was instead tested as a more exploratory strategy aimed at reducing the need for training samples while preserving the capacity to capture phenological and spatial patterns from Sentinel-2 imagery.
The results clearly indicate that the supervised approach provided the most reliable cartographic output. The best-performing map (A2) reached an overall accuracy of 91.76% and a Kappa coefficient of 0.81, values that are above the commonly adopted minimum benchmark for land-use/land-cover mapping and support the use of this product for sub-sequent landscape-metric calculations [9]. This performance is consistent with previous studies and reviews showing that Sentinel-2 data, particularly when combined with ma-chine-learning classifiers such as Random Forest and trained with representative reference samples, can provide high classification performance in agricultural landscapes where spectral separability is strongly influenced by crop type, phenological stage and management practices [10]. In this study, the use of UAV-derived training and validation data strengthened the reliability of the supervised workflow, while the inclusion of the Digital Terrain Model helped account for topographic variability within the municipal territory.
The unsupervised GEOBIA workflow showed lower accuracy and more limited interpretability, although it remains methodologically relevant. Object-based approaches are widely recognized for their ability to incorporate spatial, geometric and contextual information and to reduce the salt-and-pepper effect typical of pixel-based classifications [11,12]. Moreover, clustering of vegetation-index time series has been successfully applied in other contexts for mapping broad vegetation dynamics [13]. However, in the Ruvo di Puglia case study, the k-means configurations tested within the GEOBIA framework did not produce land-cover clusters that could be easily translated into stable and interpretable classes. This result suggests that, in highly fragmented Mediterranean agroecosystems, the benefits of object-based segmentation may be constrained when object boundaries and spectral groupings do not correspond to agronomically or ecologically meaningful units.
Several factors help explain the weaker performance of Approach B. First, UAV observations and terrain information revealed frequent altitudinal variation, even within individual plots. This variability can generate different NDVI responses among neighboring trees belonging to the same crop and variety, producing spectral noise that complicates both segmentation and clustering. Second, management heterogeneity strongly affects the spectral response of permanent crops. Differences in tree density, pruning, tillage, bare-soil exposure, grass cover and irrigation can produce substantial intra-class variability in olive groves, vineyards and orchards. In addition, vineyards covered with plastic sheets for phenological management or hail protection may be spectrally confused with artificial surfaces or other non-agricultural classes. These conditions explain why the supervised approach, guided by labelled reference samples, was more robust than the un-supervised GEOBIA workflow in this specific landscape.
Nevertheless, the lower performance of Approach B should not be interpreted as a rejection of unsupervised or object-based approaches. Rather, it highlights the need for further methodological refinement before these workflows can be used operationally in complex agricultural mosaics. Future developments could test alternative clustering strategies, such as Gaussian Mixture Models and Affinity Propagation, or hybrid frameworks combining unsupervised segmentation with limited supervised labelling. Such approaches may be particularly useful where frequent map updates are required but the systematic production of large training datasets is costly or impractical. From this point of view, the scientific contribution of the present work is also methodological: it identifies both the potential and the operational limits of reducing dependence on a priori labelled samples in a real Mediterranean bio-district context.
The role of UAV data deserves specific attention. In many remote-sensing workflows, UAV imagery is mainly used to produce training samples or to support multi-scale comparison and validation between very-high-resolution observations and satellite products [10]. In this study, UAV data also served as an independent source for validation and post-classification quality control. This distinction is important because it supports a more scalable monitoring strategy: satellite imagery provides repeated, low-cost and spatially continuous observations, while UAV surveys can be scheduled selectively to verify uncertain classes, validate outputs and improve the interpretation of fine-scale elements such as field margins, ecotones, small semi-natural patches and crop discontinuities. This integrated use of Sentinel-2 and UAV data is consistent with the growing literature on UAV-satellite synergies and helps bridge the gap between coarse or outdated official cartography and the spatial detail required for local agroecological planning [10].
The comparison between the 2024 classification and the 2018 official cartography suggests a structural transformation of the agricultural landscape of the Ruvo di Puglia Bio-District. The results indicate a decrease in total agricultural area, an expansion of permanent crops and a marked reduction in arable land. These changes point to a process of specialization in perennial production systems, especially olive, vine and fruit crops, together with a partial increase in natural and semi-natural areas. However, these trends must be interpreted cautiously because the datasets used for comparison differ in spatial resolution, minimum mapping unit and classification rules. As also highlighted by broader assessments of land-cover products, differences between maps may reflect both real land-use changes and cartographic-scale effects [14,15]. A harmonized multi-year Sentinel-2 time series would therefore be needed to separate actual transition trajectories from differences related to mapping scale and thematic detail.
The landscape indicators provide a complementary interpretation of these land-use dynamics. Composition metrics confirm the dominant role of permanent crops in the spatial identity of the local agroecosystem, while arable crops show both a reduction in total area and a tendency to persist in fewer and larger patches. Natural and semi-natural elements increased in area, but the fragmentation metrics indicate that they remain spatially discontinuous. The average patch size of approximately 0.25 ha and the high patch density describe a fine-grained and disaggregated mosaic. Such a configuration may increase edge habitats and landscape heterogeneity, but it may also limit habitat continuity and reduce the stability of ecological processes for species and communities requiring connected or continuous habitats.
This point is particularly relevant for interpreting the biodiversity-related meaning of the results. The indicators used in this study should be considered proxies of habitat structure and potential ecological functionality, rather than direct measurements of species richness or biological diversity. Increased heterogeneity may support some components of biodiversity, especially species associated with woody vegetation, ecotonal environments and transitional habitats. At the same time, the reduction and discontinuity of open agricultural habitats may negatively affect species linked to herbaceous cover, cereal fields and extensive arable systems, including many pollinators and other organisms de-pendent on open landscapes. Therefore, the observed increase in natural or semi-natural areas should not automatically be interpreted as an overall improvement in biodiversity conditions.
Connectivity indicators, particularly ecotone length and ecotone intensity, are central for evaluating the agroecological potential of the landscape. High ecotone values around permanent crops and at interfaces with natural vegetation indicate opportunities for strengthening ecological networks. However, the functional role of these interfaces de-pends not only on their extent, but also on their vegetation structure, continuity, management intensity and capacity to connect habitat patches across the agricultural matrix. Since the territories included within the Alta Murgia National Park were excluded from the mapping process, the mapped natural areas do not correspond to protected areas but rather to portions of the municipal territory likely affected by secondary succession following land-use change. These dynamics may reflect both positive environmental awareness and less favorable socio-economic processes, such as marginalization or abandonment of agricultural plots. Overall, the discussion of the results suggests that agroecological planning in the Bio-Distretto delle Lame should move beyond the simple quantification of natural and semi-natural areas and focus on their spatial arrangement, ecological quality and management. Priority actions should include the restoration of hedgerows with native species, the maintenance of spontaneous vegetation strips, the protection of small natural patches acting as steppingstones, the enhancement of field margins and the adoption of low-disturbance practices in permanent crops. In this way, landscape management could support the competitiveness of specialized supply chains while also reconstructing functional ecological networks, thereby strengthening agroecosystem resilience and providing a stronger territorial basis for the agroecological transition.
5. Conclusions
This study fits within the growing body of research employing satellite remote sensing for updating land-use and land-cover (LULC) information, a field in which Sentinel-2 is now widely recognized as a highly effective data source due to its spatial resolution, revisit frequency, and free availability. The scientific literature has consistently highlighted the capacity of Sentinel-2 to improve monitoring of agricultural, forest, and natural land covers, while also recognizing limitations in heterogeneous and fragmented landscapes, where spectral and phenological variability may reduce class separability [16].
Compared with studies focusing primarily on land-use classification, the present work introduces an additional interpretative layer by integrating LULC mapping with landscape ecology indicators and an agroecological assessment framework. This aspect is particularly relevant because recent literature increasingly emphasizes that agroecological transition cannot be evaluated exclusively at farm scale but requires consideration of landscape structure, ecological connectivity, semi-natural habitats, and their capacity to sustain ecosystem services such as pollination, biological pest regulation, soil fertility, and water regulation [17].
From a methodological perspective, the comparison between the supervised pixel-based approach and the unsupervised GEOBIA workflow represents one of the key contributions of this study. The supervised approach produced the most robust results, achieving an overall accuracy of 91.76%, consistent with findings reported in previous studies indicating that supervised methods applied to Sentinel-2 imagery generally provide strong classification performance when representative training datasets are available. In complex agricultural landscapes, however, classification accuracy strongly depends on training data quality, adequate representation of land-cover classes, and the phenological consistency of input imagery [18].
The unsupervised GEOBIA workflow, although not achieving the same level of accuracy, retains substantial methodological relevance. Object-based approaches are widely recognized for their ability to incorporate spatial information and reduce the “salt-and-pepper” effect typically associated with pixel-based classifications, particularly when the objective is to characterize patches, field margins, and landscape elements. However, their performance critically depends on segmentation quality, analysis scale, and the capability of generated objects to correspond to ecologically and agronomically meaningful units. In the present study, the strong heterogeneity of the Ruvo di Puglia landscape — including topographic variability, parcel-scale heterogeneity, intra- and inter-field spectral variability, and diversified agronomic practices — limited the interpretability and performance of the unsupervised classification, highlighting the need for further methodological developments before fully operational implementation in Mediterranean agricultural systems [19].
An additional element of originality concerns the role assigned to UAV surveys. Rather than being employed primarily for model training, UAV-derived information was integrated as an independent validation and quality-control component supporting satellite classification outputs. This approach strengthens mapping reliability and improves the characterization of fine-scale landscape elements such as ecotones, vegetated margins, small semi-natural patches, and agricultural discontinuities, which are often poorly represented in coarse-resolution or outdated official datasets. In this respect, the proposed workflow contributes to bridging the gap between institutional cartography and the operational requirements of local-scale agroecological planning.
The results reveal relevant land-use changes between 2018 and 2024, including an expansion of permanent crops and natural or semi-natural areas, accompanied by a reduction in arable land. These dynamics suggest the coexistence of two parallel processes: specialization of perennial farming systems and secondary re-naturalization processes affecting marginal or less intensively managed areas. Nevertheless, because the comparison relies on datasets characterized by different spatial resolutions, classification criteria, and thematic specifications, these findings should be interpreted as indicative territorial trends requiring further validation through harmonized multi-year monitoring frameworks.
From an ecological perspective, increased landscape heterogeneity may represent an opportunity to strengthen biodiversity conservation and ecosystem service provision, as demonstrated by studies highlighting the role of semi-natural habitats, hedgerows, vegetated margins, and diversified agricultural mosaics. However, current literature also indicates that heterogeneity alone does not automatically generate ecological benefits unless accompanied by adequate habitat continuity, structural quality, and ecological functionality. A more diversified but fragmented landscape may favor species associated with woody vegetation and ecotonal environments while negatively affecting organisms dependent on extensive and continuous open habitats [10].
Therefore, the principal scientific contribution of this work does not rely exclusively on producing an updated land-use/land-cover map but rather on proposing an integrated framework capable of linking satellite classification, UAV validation, landscape ecology metrics, and agroecological interpretation. Applied to the Bio-Distretto delle Lame context, this framework provides an operational knowledge base supporting local planning processes, identifying structural vulnerabilities of the agricultural mosaic, and informing actions aimed at strengthening ecological connectivity. Within this perspective, agroecological transition should not focus exclusively on increasing the quantity of natural and semi-natural elements but also on improving their spatial distribution, continuity, and ecological quality through measures such as native hedgerow restoration, conservation of spontaneous vegetation strips, protection of small natural patches, and adoption of low-disturbance practices within permanent cropping systems.
Overall, the study provides not only an updated land-use/land-cover assessment, but also a methodological framework for comparing supervised and unsupervised classification strategies in heterogeneous Mediterranean agricultural landscapes. While the supervised pixel-based approach currently represents the most reliable operational solution, the unsupervised GEOBIA workflow remains a promising exploratory pathway for reducing dependence on labelled training datasets, provided that further methodological refinements are introduced.
Supplementary Materials
The following supporting information can be downloaded at the website of this paper posted on Preprints.org, Annex 1: UAV settings for the mission; Annex 2: Sampling areas; Annex 3: UAV data elaboration in Metashape environment; Annex 4: Biodiversity indicators; Annex 5: Results: cartographies And Annex 6: Accuracy assessment.
Author Contributions
For research articles with several authors, a short paragraph specifying their individual contributions must be provided. The following statements should be used “Conceptualization, Calabrese Generosa, Mariano Fracchiolla and Franco Santoro; methodology, Generosa Calabrese and Franco Santoro.; software, NA; validation, Alessia Perrino, Generosa Calabrese, Gabriele Favia and Mariano Fracchiolla; formal analysis, Ayantu Tadesse Generosa Calabrese, Franco Santoro, Alessia Perrino; investigation, Carlo Ranieri, Alessia Perrino, Generosa Calabrese, Gabrile Favia; data curation, Alessia Perrino, Generosa Calabrese, Franco Santoro.; writing—original draft preparation, Ayantu Deressa Tadesse.; writing review and editing, Generosa Calabrese, Franco Santoro, Ayantu Deressa Tadesse; visualization, Ayantu Deressa Tadesse and Alessia Perrino; supervision, Generosa Calabrese, Franco Santoro.; project administration, NA; funding acquisition, NA. All authors have read and agreed to the published version of the manuscript.
Funding
This research did not receive any external funding. The study was conducted entirely by CIHEAM Bari within the Master of Science in “Mediterranean Organic Agriculture”.
Data Availability Statement
The original contributions presented in this study are included in the article. Further inquiries can be directed to the corresponding author.
Acknowledgments
The authors acknowledge the support of the Bio-Distretto delle Lame and all local stakeholders involved in this study. The authors are also grateful to the anonymous reviewers for their valuable comments and suggestions, which greatly contributed to improving the quality of this manuscript. During the preparation of this manuscript, ChatGPT 5.5 was used for language polishing. All authors have reviewed and revised the manuscript and take full responsibility for its content.
Conflicts of Interest
The authors declare that they have no conflicts of financial interest.:
Abbreviations
The following abbreviations are used in this manuscript:
| UAV | Unmanned Aerial Vehicle |
| NDVI | Normalized Difference Vegetation Index |
| GEOBIA | Geographic Object Based Image Analysis |
| QGIS | Quantum Geographic Information System |
| DTM | Digital Terrain Model |
| DEM | Digital Elevation Model |
| RF | Random Forest |
| OTB | Orfeo ToolBox |
| SCP | Semi-Automatic Classification Plugin |
| CLC | Corine Land Cover |
| UA | User’s Accuracy |
| MP | Megapixel |
References
- Haan, N.L.; Iuliano, B.G.; Gratton, C.; Landis, D.A. Chapter Five - Designing agricultural landscapes for arthropod-based ecosystem services in North America. In The Future of Agricultural Landscapes, Part II; Bohan, D.A., Vanbergen, A.J.B.T.-A., Eds.; Academic Press, 2021; Vol. 64, pp. 191–250. ISBN 0065-2504. [Google Scholar] [CrossRef]
- Filchev, L.; Pashova, L.; Kolev, V.; Frye, S. Surveys, catalogues, databases/archives, and state-of-the-art methods for geoscience data processing. In Knowledge Discovery in Big Data from Astronomy and Earth Observation; Elsevier, 2020; pp. 103–136. [Google Scholar]
- Calabrese, G.; Ceglie, F.; Perrino, E.; Verrastro, V.; Giannini, P.; La Notte NOTTE, P. Correlation between grape and wine quality, landscape diversity, on-field biodiversity, in doc Gioia del Colle, Italy. In Proceedings of Terroir 2014; GIOIA DEL COLLE: IVES, 2014; pp. 248–256. ISSN ISBN 9635035837. [Google Scholar]
- Turner, M.G.; Gardner, R.H.; O’Neill, R. V Landscape ecology. In Theory Pract. Process; 2001. [Google Scholar]
- Turner, M.G. Landscape Ecology in Theory and Practice; Springer Science Business Media: Frostburg, 2001. [Google Scholar]
- Rempel, R.S.; Elkie, P.C.; Carr, A. Patch analyst user’s manual: a tool for quantifying landscape structure; Ontario Ministry of Natural Resources, Boreal Science …: Thunder Bay, 1999; ISBN 0777882957. [Google Scholar]
- McGarigal, K.; Marks, B.J. Spatial pattern analysis program for quantifying landscape structure. US Dep. Agric. For. Serv. 1995, 10, 1–122. [Google Scholar]
- UNEP, C.B.D. SBSsTA. 2001. Main theme: forest biological diversity. Report of the adec technical expem group on forest biological diversity SBSTTA seventh meeting, montreal, 2001; pp. 12–16. [Google Scholar]
- Anderson, J.; Hardy, E.; Roach, J.; Witmer, R. A land use and land cover classification system for use with remote sensor data; Stevens Point, 1976. [Google Scholar] [CrossRef]
- Priyadarshana, T.S.; Martin, E.A.; Sirami, C.; Woodcock, B.A.; Goodale, E.; Martínez-Núñez, C.; Lee, M.; Pagani-Núñez, E.; Raderschall, C.A.; Brotons, L. Crop and landscape heterogeneity increase biodiversity in agricultural landscapes: A global review and meta-analysis. Ecol. Lett. 2024, 27, e14412. [Google Scholar] [CrossRef] [PubMed]
- Blaschke, T.; Hay, G.J.; Kelly, M.; Lang, S.; Hofmann, P.; Addink, E.; Feitosa, R.Q.; Van der Meer, F.; Van der Werff, H.; Van Coillie, F. Geographic object-based image analysis–towards a new paradigm. ISPRS J. Photogramm. Remote Sens. 2014, 87, 180–191. [Google Scholar] [CrossRef] [PubMed]
- Kucharczyk, M.; Hay, G.J.; Ghaffarian, S.; Hugenholtz, C.H. Geographic object-based image analysis: a primer and future directions. Remote Sens. 2020, 12, 2012. [Google Scholar] [CrossRef]
- Kuppala, N.; Navneet Krishna, C.; Sajith Variyar, V. V.; Sivanpillai, R. Mapping Vegetation Dynamics in Wyoming: A Multi-Temporal Analysis using Landsat NDVI and Clustering. Int. Arch. Photogramm. Remote Sens. Spat. Inf. Sci. 2025, XLVIII–M-5, 87–94. [Google Scholar] [CrossRef]
- Sinanet CLC2018_shapefile. Available online: https://groupware.sinanet.isprambiente.it/uso-copertura-e-consumo-di-suolo/library/copertura-del-suolo/corine-land-cover/clc2018_shapefile/ (accessed on 10 Sep 2025).
- Venter, Z.S.; Barton, D.N.; Chakraborty, T.; Simensen, T.; Singh, G. Global 10 m land use land cover datasets: A comparison of dynamic world, world cover and esri land cover. Remote Sens. 2022, 14, 4101. [Google Scholar] [CrossRef]
- Phiri, D.; Simwanda, M.; Salekin, S.; Nyirenda, V.R.; Murayama, Y.; Ranagalage, M. Sentinel-2 Data for Land Cover/Use Mapping: A Review. Remote Sens. 2020, 12, 2291. [Google Scholar] [CrossRef]
- Lavigne, C. Agroecology landscapes. Landsc. Ecol. 2021, 36, 2235–2257. [Google Scholar] [CrossRef] [PubMed]
- Vogiatzis, M.; Eleftheriadis, I. Comparison of pixel-based classification algorithms using Landsat-8 OLI and Sentinel-2 MSI for land use/land cover mapping in a heterogeneous landscape. 2023. [Google Scholar]
- Chmielewski, S.; Bochniak, A.; Natapov, A.; Wężyk, P. Introducing GEOBIA to landscape imageability assessment: A multi-temporal case study of the nature reserve “Kozki”, Poland. Remote Sens. 2020, 12, 2792. [Google Scholar] [CrossRef]

Table 1.
Macrocatagories of land use and cover classes.
| Macrocategories | Cover classes |
|---|---|
| MA | artifac artifacts (urban fabric and other man-made categories) |
| EN | natural herbaceous vegetation |
| AN | natural arboreous vegetation |
| ASN | natural herbaceous and arboreous |
| W | wetlands |
| SW | salty wetlands |
| CP | permanents crops |
| CE | herbaceous crops |
| CA | associated crops |
Table 2.
List and classification of the chosen indicators of landscape diversity.
| Indicators of composition | 1 | Relative Richness Number (RR) [4,5] |
| 2 | Relative Richness Area (RA) [5] | |
| 3 | Land Use Sustainability (LUS) | |
| Indicators of fragmentations | 4 | Patch Average Area (PAA) [6] |
| 5 | Patch Average Area (for individual classes ) [6] | |
| 6 | Patch Density (PD) [7] | |
| 7 | Patch Density (for individual classes) [7] | |
| 8 | Sustainability of the Ecotope System (SUS) | |
| 9 | Agricultural Ecotope Composition (CEtopeC) | |
| 10 | Road Density (RD) | |
| Indicators of connection | 11 | Crop Ecotone Composition (CEtopeC) |
| 12 | Water Body Density (WBD) [8] | |
| 13 | Ecotone Length (EL) | |
| 14 | Ecotone Intensity (EI) |
Table 3.
Synthesis of Accuracy Analysis for the raster files analyzed.
| Results of Accuracy Analysis for the raster files analysed | ||||||
|---|---|---|---|---|---|---|
| Map ID | Overall Acc. (%) | Kappa | Class with PA* min (%) | Class with PA min (%) | Class with UA** min (%) | Class with UA min (%) |
| A 1 | 90.20 | 0.78 | 3 | natural vegetation | 21 | arable land |
| A 2 | 91.76 | 0.81 | 1 | artificial surfaces | 3 | natural vegetation |
| A 3 | 88.21 | 0.71 | 1 | artificial surfaces | 21 | arable land |
| B 1 | 63.17 | 0.26 | 3 | natural vegetation | 21 | arable land |
| B 2 | 60.43 | 0.25 | 21 | arable land | 21 | arable land |
| B 3 | 60.60 | 0.21 | 1 | artificial surfaces | 21 | arable land |
| B 4 | 56.83 | 0.17 | 21 | arable land | 21 | arable land |
Table 4.
Approach A (S-pb) and Approach B (Us/Mt-ob) characteristics.
| Approach | Map ID | Process | Main properties |
|---|---|---|---|
| A | A 1 | Supervised SCP | A2 Copernicus Sentinel 2 (pixel 10x10 m) |
| A | A 2 | Supervised OTB | NDVI month July (pixel 20x20 m) |
| A | A 3 | Supervised OTB | NDVI month November (pixel 20x20 m) |
| B | B 1 | Unsupervised/GEOBIA + Supervised OTB |
60 clusters (pixel 20x20 m) |
| B | B 2 | Unsupervised/GEOBIA+ Supervised OTB |
20 clusters (pixel 20x20 m) |
| B | B 3 | Unsupervised/GEOBIA + Supervised OTB |
14 clusters (pixel 20x20 m) |
| B | B 4 | Unsupervised/GEOBIA + Supervised OTB |
10 clusters (pixel 20x20 m) |
Table 5.
Results of Indicators of Fragmentation.
| Indicators of Composition | ||||||||||||||
|---|---|---|---|---|---|---|---|---|---|---|---|---|---|---|
| Region of Interest | Relative Richness Number (RR) | Relative Richness Area (RA) | Land Use Sustainability | Crop Ecotope Composition | ||||||||||
| RR MA | RR EN | RR AN | RR CP | RR CE | RR CA | RA MA | RA EN | RA AN | RA CP | RA CE | RA CA | LUS (%) | CEC | |
| A 2 | 2.76 | 0.00 | 10.31 | 75.53 | 11.40 | 0.00 | 4.03 | 0.00 | 7.52 | 75.50 | 12.95 | 0.00 | 8.50% | 5.83 |
| CLC 2018 | 18.18 | 6.82 | 13.64 | 20.45 | 18.18 | 22.73 | 4.31 | 0.62 | 1.91 | 52.12 | 5.13 | 35.91 | 2.72% | 3.04 |
Table 6.
Results of Indicators of Fragmentation.
| Indicators of Fragmentation | ||||||||||||||||
|---|---|---|---|---|---|---|---|---|---|---|---|---|---|---|---|---|
| Region of Interest | Patch Average Area | Patch Density (PD) | Sustainability of ecotone system | Crop Ecotone Composition | ||||||||||||
| PAA | PAA MA | PAA EN | PAA AN | PAA CP | PAA CE | PAA CA | PD | PD MA | PAA EN | PD AN | PD CP | PD CE | PD CA | SES | CEC | |
| A 2 | 0.25 | 0.37 | 0.00 | 0.18 | 0.25 | 0.28 | 0.00 | 399.86 | 273.52 | 0.00 | 548.18 | 400.02 | 352.12 | 0.00 | 0.09 | 8.00 |
| CLC 2018 | 275.50 | 65.33 | 25.01 | 38.64 | 702.06 | 77.68 | 435.24 | 0.36 | 1.53 | 4.00 | 2.59 | 0.14 | 1.29 | 0.23 | 0.10 | 1.87 |
Table 7.
Results of Indicators of Connection.
| Indicators of Connection | ||||||||||||||
|---|---|---|---|---|---|---|---|---|---|---|---|---|---|---|
| Region of Interest | Ecotone Lenght | Ecotone Intensity | ||||||||||||
| EL | EL MA | EL EN | EL AN | EL CP | EL CE | ELCA | EI | EI MA | EI EN | EI AN | EI CP | EI CE | EI CA | |
| A 2 | 0.20 | 0.19 | 0.00 | 0.16 | 0.22 | 0.18 | 0.00 | 489.78 | 530.08 | 0.00 | 641.78 | 464.56 | 561.11 | 0.00 |
| CLC 2018 | 8.94 | 3.82 | 2.16 | 4.26 | 16.25 | 5.71 | 13.87 | 11.19 | 26.17 | 46.27 | 23.49 | 6.16 | 17.50 | 7.21 |
Disclaimer/Publisher’s Note: The statements, opinions and data contained in all publications are solely those of the individual author(s) and contributor(s) and not of MDPI and/or the editor(s). MDPI and/or the editor(s) disclaim responsibility for any injury to people or property resulting from any ideas, methods, instructions or products referred to in the content. |
© 2026 by the authors. Licensee MDPI, Basel, Switzerland. This article is an open access article distributed under the terms and conditions of the Creative Commons Attribution (CC BY) license (http://creativecommons.org/licenses/by/4.0/).
Copyright: This open access article is published under a Creative Commons CC BY 4.0 license, which permit the free download, distribution, and reuse, provided that the author and preprint are cited in any reuse.