

Submitted:
05 June 2026
Posted:
08 June 2026
You are already at the latest version
Abstract
Background/Objectives: Gamma-aminobutyric acid (GABA) is increasingly recognized as an important modulator of pancreatic beta-cell function, but the mechanisms by which it regulates intracellular Ca2+ oscillations and coordinated beta-cell activity remain insufficiently understood. The aim of this study was to investigate how GABA influences the amplitude, frequency, phase adjustment, entrainment, and synchronization of beta-cell Ca2+ oscillations. Methods: We developed an extended mathematical model based on our previously established Dual Anaplerotic Model of the GABA shunt. The model incorporates explicit dynamics of cytosolic Ca2+, endoplasmic reticulum Ca2+, ATP, and a regulatory variable controlling Ca2+ influx, while extracellular GABA is represented as a delayed interstitial signal feeding back on cellular excitability. Single-cell and two-cell simulations were performed to analyze GABA-dependent oscillatory regulation and intercellular coupling. Results: The model reproduced key experimental observations under both control and GABA-deficient conditions, including reduced Ca2+-oscillation amplitude and prolonged oscillation period when GABA production was suppressed. Mechanistically, GABA affected single-cell oscillations through two complementary pathways: metabolically, by modulating ATP production through PEP-related and TCA-related contributions linked to the GABA shunt; and extracellularly, by adjusting the phase of Ca2+ influx through fast and delayed inhibitory feedback. In the two-cell model, delayed interstitial GABA signaling was sufficient to entrain and synchronize non-identical oscillators over finite ranges of parameter mismatch, and weak effective electrical coupling further broadened these synchronization ranges. Conclusions: GABA acts as a dual regulator of beta-cell dynamics, linking intracellular metabolism to Ca2+-oscillation patterning and promoting coordinated activity through intercellular phase adjustment. The model provides a mechanistic framework connecting GABA metabolism, ATP dynamics, Ca2+ signaling, and beta-cell synchronization in pancreatic islets.
Keywords:
GABA
; pancreatic beta cells
; Ca2+ oscillations
; GABA shunt
; ATP dynamics
; entrainment
; synchronization
; mathematical modeling
1. Introduction
Pancreatic beta cells play a central role in glucose homeostasis by coupling metabolic stimulation to insulin secretion, and impairment of this function is a major determinant of diabetes mellitus. In beta cells, nutrient metabolism, ATP production, electrical activity, Ca2+ influx, and intracellular Ca2+ oscillations are tightly interconnected components of stimulus–secretion coupling. Because pulsatile and coordinated beta-cell activity is essential for efficient insulin release, identifying endogenous regulators of beta-cell Ca2+ dynamics remains important for understanding both normal islet physiology and beta-cell dysfunction in diabetes [1].
Among such regulators, gamma-aminobutyric acid (GABA) has attracted attention for several decades. Early work demonstrated that pancreatic beta cells contain unusually high concentrations of GABA, establishing the endocrine pancreas as a major non-neuronal site of GABA accumulation [2]. This concept was extended by the demonstration that glutamic acid decarboxylase (GAD) and GABA colocalize with synaptic-like microvesicles in beta cells, suggesting specialized machinery for GABA storage and secretion [3]. Subsequently, regulated exocytosis of GABA-containing synaptic-like microvesicles was directly demonstrated in pancreatic beta cells [4], and GABA was later shown to function as an autocrine excitatory transmitter in human beta cells through GABAA receptor-dependent signaling [5]. Together, these studies established that GABA is not merely a by-product of amino acid metabolism, but an endogenous signaling molecule with functional relevance in pancreatic islets.
In parallel with this signaling perspective, a substantial body of work emphasized the metabolic role of GABA in beta-cell physiology. Broader analyses of amino acid metabolism highlighted the importance of mitochondrial coupling and non-glucose metabolic pathways in insulin secretion [6]. This view was strengthened by the finding that glucose suppresses GABA release from pancreatic beta cells through increased GABA shunt activity [7]. Shortly thereafter, it was shown that glucose-promoted GABA metabolism contributes to insulin secretion and is associated with changes in ATP content and ATP/ADP ratio in beta cells [8]. Additional mechanistic work on glutamate dehydrogenase and amino acid transporters further supported the idea that glutamate/GABA-related pathways are functionally integrated with beta-cell metabolism and secretory activity [9,10]. This metabolic interpretation was explicitly developed in later reviews that argued for a specific role of GABA metabolism and the GABA shunt in sustained insulin secretion and beta-cell bioenergetics [11,12,13].
More recent work brought GABA into the context of oscillatory and collective beta-cell behavior. A major advance came with the demonstration that human beta cells release GABA from cytosolic pools in a pulsatile manner and that this release imposes a synchronizing rhythm on pulsatile insulin secretion, with a critical contribution of the volume-regulated anion channel (VRAC) [14]. More recent reviews have synthesized growing evidence that islet GABA signaling combines receptor-mediated auto/paracrine actions with metabolic coupling through the GABA shunt, particularly in human islets [15,16]. Most importantly for the present study, Ferreira et al. [17] showed that beta-cell-specific loss of GAD65 and GAD67 abolishes endogenous islet GABA and results in abnormal Ca2+ oscillations characterized by altered active-phase duration and reduced amplitudes, together with impaired insulin secretion. These findings strongly support the view that endogenous beta-cell-derived GABA is an important determinant of islet Ca2+ rhythm generation and coordinated activity.
Despite these advances, the mechanistic basis by which GABA regulates beta-cell Ca2+ oscillations remains incompletely understood. In particular, it is still unresolved how GABA-dependent metabolic effects and GABA-dependent modulation of intercellular signaling are translated into quantitative changes in oscillatory frequency, amplitude, entrainment, and the eventual synchronization of beta-cell populations. This unresolved issue is especially important because coordinated oscillatory activity at the islet level is essential for robust pulsatile insulin secretion. In our recent work, we proposed the Dual Anaplerotic Model (DAM), in which the GABA shunt was incorporated as an anaplerotic component of beta-cell metabolism, functionally linked to oscillatory redistribution of mitochondrial and cytosolic metabolites and to ATP generation [18]. That framework now provides a basis for extending the model toward explicit Ca2+ dynamics and for interpreting recent experimental observations on GABA-dependent beta-cell behavior.
In the present study, we use an extended mathematical model to investigate how GABA links intracellular metabolism to Ca2+ oscillations and coordinated beta-cell dynamics. Building on the DAM framework, we incorporate explicit dynamics of cytosolic Ca2+, endoplasmic reticulum Ca2+, ATP, and a regulatory variable governing Ca2+ influx, while representing extracellular GABA as a delayed interstitial signal that feeds back onto cellular excitability. This formulation enables us to address two interconnected questions. First, we ask how altered GABA production affects the amplitude, frequency, and temporal organization of Ca2+ oscillations in a single beta cell, and which underlying mechanisms dominate this response. Second, we ask whether the same GABA-dependent processes can provide an effective coupling pathway between non-identical beta cells and thereby promote entrainment and synchronization.
By combining explicit ATP- Ca2+ dynamics with metabolically grounded GABA dynamics and delayed intercellular GABA signaling, the model goes beyond previous conceptual descriptions of GABA action and provides a unified mechanistic framework for interpreting both single-cell and collective beta-cell behavior. In this way, the study not only offers a mechanistic explanation for the experimentally observed effects of GABA deficiency on Ca2+ oscillations [17], but also provides a plausible theoretical basis for the synchronizing role of pulsatile beta-cell-derived GABA within the islet [14,15]. Overall, our findings support the view that GABA is an important regulator of beta-cell oscillatory dynamics and collective activity, acting through a functional link between mitochondrial metabolism, ATP production, Ca2+ influx, and intercellular phase coordination.
2. Model
The mathematical model developed in this study is based on established frameworks of intracellular Ca2+ dynamics and incorporates key mechanisms described in previous models, such as the Integrated Oscillator Model (IOM) [19]. These mechanisms are reduced to a minimal formulation that preserves the essential oscillatory behavior arising from Ca2+ exchange between the cytosol and the endoplasmic reticulum, in line with classical minimal models of calcium oscillations [20,21,22]. In addition, the model explicitly incorporates coupling between Ca2+ and metabolic dynamics, thereby reproducing the characteristic phase relationship between Ca2+ and metabolic/ATP oscillations reported in previous studies [19,22,23]. Within this framework, the primary aim of the model is to introduce GABA-dependent processes in order to investigate how GABA modulates Ca2+ oscillations, their phase relationships, and synchronization in pancreatic beta cells.
We first introduce a Single-Cell Model, which describes intracellular Ca2+ dynamics within an individual beta cell. The model integrates metabolic and electrophysiological components, with particular emphasis on the role of GABA in mitochondrial ATP production via the anaplerotic GABA shunt. In addition, GABA release is incorporated as a dynamic process that introduces delayed negative feedback on Ca2+ influx, thereby modulating the temporal characteristics of intracellular Ca2+ oscillations.
The framework is subsequently extended to a Two-Cell Coupled Model, in which individual cellular oscillators are interconnected through GABA-mediated coupling. This formulation enables us to examine how the coupling between oscillatory Ca2+ dynamics and oscillatory GABA signaling at the single-cell level can facilitate phase alignment and promote synchronization of Ca2+ oscillations across cells.
2.1. Single-Cell Model
The cellular processes governing intracellular Ca2+ oscillations in a single β-cell are schematically illustrated in Figure 1. The model includes Ca2+ fluxes between the cytosol and the endoplasmic reticulum (ER), as well as Ca2+ influx across the plasma membrane through voltage-gated Ca2+ channels (VGCCs). VGCC opening is regulated by the membrane potential, such that depolarization promotes Ca2+ entry. Membrane depolarization is, in turn, favored by closure of ATP-sensitive K+ channels (KATP channels), driven by an increase in local ATP concentration near the plasma membrane. This local ATP signal is associated with PEP-cycle activity and ATP delivery to the microdomain surrounding KATP channels, whereas mitochondrial oxidative phosphorylation provides the principal energetic background for this process [23,24]. Within this framework, ATP production is additionally influenced by the GABA shunt, which acts as an anaplerotic pathway [18] feeding succinate into the TCA cycle and thereby reinforcing mitochondrial oxidative metabolism. In this manner, GABA metabolism contributes to ATP generation and functionally couples mitochondrial metabolism to the regulation of Ca2+ dynamics. The model further includes net cytosolic GABA production (), as described in detail in our previous study [18], as well as its release into the interstitial space through VRAC, thereby generating the interstitial GABA signal . Interstitial GABA is assumed to inhibit Ca2+ influx through mechanisms involving both and receptors [17], as will be described in more detail below. In effective form, these pathways are represented in the model as a delayed negative-feedback loop through which GABA release suppresses Ca2+ entry and modulates the temporal characteristics of intracellular Ca2+ oscillations.
2.1.1. Ca2+ Dynamics
Intracellular Ca2+ dynamics is described by the following two differential equations:
which represent the temporal evolution of Ca2+ concentration in the cytosol () and in the endoplasmic reticulum (), respectively. The model accounts for Ca2+ exchange between the cytosol and the ER, as well as Ca2+ fluxes across the plasma membrane.
In the following, the individual flux terms are described in more detail. The values of the model constants given below represent reference values in arbitrary units.
Within this framework, the flux represents the active uptake of Ca2+ from the cytosol into the ER, mediated by the sarco/endoplasmic reticulum Ca2+-ATPase (SERCA). In the present model, this flux is described by
where , assuming a linear dependence of pump activity on cytosolic Ca2+ concentration. In this formulation, the dependence of the flux on ATP concentration is neglected, as its variations in the cytosol are relatively small. This simplification is justified by experimental evidence showing that cytosolic ATP levels exhibit relatively small fluctuations compared to those in the submembrane compartment [25] and in the microdomain associated with channels, where local ATP dynamics are sufficient to regulate channel permeability [23]. Instead, the model explicitly incorporates Ca2+ dependence, as SERCA activity is tightly regulated by cytosolic Ca2+ levels. An increase in enhances Ca2+ binding to the pump, thereby increasing its turnover rate and facilitating Ca2+ sequestration into the ER. Capturing this dependence is essential for accurately reproducing intracellular Ca2+ dynamics, particularly the feedback mechanisms governing Ca2+ oscillations and ER loading.
The flux describes passive Ca2+ leak from the ER back into the cytosol, reflecting the basal permeability of the ER membrane. In the present model, this flux is described by
where , and the leak rate is assumed to increase linearly with the ER luminal Ca2+ concentration. This assumption reflects the fact that passive Ca2+ efflux from the ER depends on the ER Ca2+ load, with higher generating a larger concentration gradient and thereby a greater leak flux into the cytosol. Notably, the dependence of the flux on the concentration difference between the ER and the cytosol is not modeled explicitly. This simplification is justified by the fact that Ca2+ concentration in the ER is several orders of magnitude higher than in the cytosol. Consequently, the concentration gradient effectively follows variations in , which supports the approximation of the leak flux as being proportional to .
The term represents Ca2+ release from the ER through Ca2+-permeable ER channels and accounts for channel-mediated mobilization of stored Ca2+ into the cytosol. In the present model, this flux is described by
with , , and . This formulation assumes a sigmoidal dependence of channel activation on cytosolic Ca2+ concentration, reflecting the cooperative nature of Ca2+-induced Ca2+ release (CICR). The multiplicative dependence on accounts for the fact that the magnitude of Ca2+ release is also governed by the ER Ca2+ load, with higher luminal Ca2+ levels providing a stronger driving force for Ca2+ efflux.
In addition to intracellular Ca2+ exchange, the model also includes Ca2+ transport across the plasma membrane, represented by the fluxes and . The efflux term describes Ca2+ extrusion from the cytosol to the extracellular space via plasma membrane Ca2+ clearance mechanisms, predominantly Ca2+-ATPases and related outward transport processes. In the present model, this flux is described by
with , assuming a linear dependence of Ca2+ extrusion on cytosolic Ca2+ concentration. The proportional dependence on captures the first-order approximation of Ca2+ extrusion kinetics, where the rate of transport increases with substrate availability. This is consistent with the behavior of plasma membrane Ca2+ pumps and exchangers, which respond to elevated cytosolic Ca2+ by enhancing Ca2+ clearance, thereby contributing to the restoration of basal intracellular Ca2+ levels.
The influx term denotes Ca2+ entry from the extracellular space into the cytosol, primarily through voltage-gated Ca2+ channels (VGCCs). In the present model, this flux is described by
where represents the maximum influx rate modulated by intracellular signaling, and denotes the channel activation variable. In the model, we additionally include an inhibitory dependence of the influx term on , thereby phenomenologically representing calcium-dependent inactivation (CDI) of voltage-gated Ca2+ channels. In this way, an increase in intracellular Ca2+ reduces channel availability and thereby limits further Ca2+ influx [26,27]. Here, denotes the half-saturation constant controlling the dependence of the influx on cytosolic Ca2+.
The parameter is further defined as
where is the baseline maximal influx rate in the absence of inhibitory GABAergic input, and quantifies the strength by which interstitial GABA suppresses influx. Here, denotes the interstitial GABA concentration, which follows the intracellular GABA concentration with a time delay, as described in more detail below. In this way, we assume that the delayed interstitial GABA signal modulates Ca2+ influx via a rapid inhibitory feedback loop. This term provides a phenomenological description of the fast ionotropic action of extracellular GABA on beta-cell excitability and membrane-potential-dependent Ca2+ entry, consistent with the current view that GABA released from beta cells acts through both GABAA and GABAB receptors and that exogenous GABA suppresses islet Ca2+ oscillations through a mechanism involving both receptor classes [15,17].
In modeling the influx (Eq. 7), we additionally introduce a slower inhibitory feedback loop via the regulatory variable . The gating variable follows first-order kinetics,
where determines the timescale of adaptation of the gating process. The steady-state value depends on both ATP and GABA levels,
where is the baseline steady-state activation level in the absence of GABA, and determines the strength of GABA-dependent inhibition of channel activation. Since positively regulates the influx (Eq. 7), a reduction in mediated by (Eq. 10) implies that delayed interstitial GABA gradually reduces the effective drive for Ca2+ influx on a slower timescale. Physiologically, this slow inhibitory component is intended to phenomenologically represent a metabotropic -like pathway acting on slower excitability and adaptation processes, consistent with inhibitory G-protein (Gi/o)-dependent inhibition of adenylyl cyclase and the resulting reduction in Ca2+ influx [15]. Together, these terms (Eqs. 7–10) define a physiologically plausible delayed negative feedback loop through which interstitial GABA () can suppress excessive Ca2+ entry [17]. The parameter represents the threshold ATP concentration above which Ca2+ channels can become active (open), whereas below this threshold the channels remain closed.
2.1.2. ATP Dynamics and Coupling to the DAM
In the present model, ATP dynamics is described at the level of the submembrane ATP pool, rather than bulk cytosolic ATP, because ATP oscillations in the submembrane region are substantially more pronounced and are more directly relevant for the regulation of Ca2+ influx and KATP-dependent excitability than ATP in the bulk cytosol [23]. The temporal evolution of ATP is therefore described by:
where denotes ATP production, represents ATP consumption by Ca2+-ATPases, and accounts for other ATP-consuming cellular processes.
The ATP production term is written as
where is the half-saturation constant controlling the inhibitory effect of cytosolic Ca2+ on the PEP-dependent component of ATP production, and is the corresponding Hill coefficient determining the steepness of this dependence. Equation (12) separates ATP production into two physiologically distinct components. The first term describes ATP production associated with the cataplerotic phase and the associated PEP-cycle activity, whereas the second term represents the oxidative mitochondrial contribution associated with TCA-cycle activity.
The inverse dependence of the first term on is an essential feature of the model. It reflects the idea that ATP production via the PEP cycle is most effective when cytosolic Ca2+ is low, i.e., during the cataplerotic phase, when carbon is preferentially routed through pyruvate carboxylase (PC) rather than pyruvate dehydrogenase (PDH), and when PEP cycling becomes an important source of ATP delivery to the submembrane region [18,23]. In this regime, the availability of carbon skeletons for PEP cycling depends strongly on the anaplerotic input provided by the GABA shunt. Within the DAM framework [18], this cataplerotic contribution is associated with the flux , which describes carbon redistribution toward the GABA-related pool during the cataplerotic phase of the oscillation cycle. In the present formulation, this flux is identified with the effective GABA production flux, . Accordingly, the effective strength of the PEP-dependent ATP-producing branch is written as
where is the basal contribution of the PEP-related ATP-producing component, and determines how strongly this component is enhanced by the cataplerotic flux . In this way, the model links GABA-dependent cataplerotic carbon redistribution directly to the PEP-cycle-associated ATP production that is most effective during the low- Ca2+ phase of the oscillation.
The second term in Eq. (12), , represents the oxidative component of ATP production. This term captures the fact that mitochondrial ATP synthesis in the submembrane region is also stimulated during the oxidative phase, when elevated cytosolic Ca2+ promotes mitochondrial metabolism, in part through activation of PDH and enhanced TCA-cycle turnover. In the DAM framework, this oxidative contribution is linked to the GABA shunt flux , which describes the return of carbon from the GABA-related pool back into the left part of the TCA cycle, thereby reinforcing oxidative ATP production during the phase in which fresh carbon enters the cycle through GABA-shunt-dependent anaplerosis [18]. In the present formulation, this flux is identified with the effective GABA-shunt contribution, . We therefore write
where is the basal oxidative contribution to ATP production, and quantifies the extent to which this component is increased by the flux . Thus, the model explicitly links GABA-shunt-mediated return of carbon into the TCA cycle to the oxidative ATP-producing branch that predominates during the high- Ca2+ phase of the oscillation.
A key point is that the fluxes and , as well as the dynamics of cytosolic GABA, are not introduced here as ad hoc functions, but are taken directly from the previously published DAM formulation [18]. In the original DAM study, the time courses of and ATP were prescribed from experimental fits, whereas the remaining metabolic pools and inter-pool fluxes were modeled explicitly. In the present study, this logic is extended one step further: the same DAM subsystem is retained for the calculation of , , and , but and ATP are now computed self-consistently from the differential equations of the present model. Thus, the DAM provides the internal metabolic structure required to determine how GABA-shunt-dependent carbon redistribution feeds back onto ATP production and, indirectly, onto Ca2+ dynamics.
ATP consumption by Ca2+-transporting ATPases is described by
where denotes the effective rate constant for ATP consumption by Ca2+-ATPases. This term represents the ATP cost of Ca2+ sequestration and extrusion. In this effective formulation, ATP consumption is assumed to increase linearly with cytosolic Ca2+, reflecting the enhanced activity of Ca2+-ATPases when intracellular Ca2+ levels are elevated.
Finally, we include a further ATP consumption term,
where denotes the effective rate constant for ATP consumption by other ATP-dependent cellular processes that are not modeled explicitly. These include, for example, ATP utilization in biosynthetic reactions, maintenance processes, cyclic nucleotide metabolism, and broader inhibitory effects associated with high ATP availability, including feedback on metabolic enzymes. This term therefore represents a generic ATP sink that prevents unbounded ATP accumulation and contributes to shaping the oscillatory ATP profile.
Together, Eqs. (11)–(16) define the ATP dynamics of the present single-cell model. Relative to the original DAM formulation, the essential novelty here is that ATP is no longer prescribed externally, but emerges dynamically from the interplay between Ca2+-dependent ATP consumption, PEP-cycle-associated ATP production, oxidative ATP production, and the metabolic redistribution of carbon through the GABA shunt. This explicit treatment of ATP dynamics is crucial, because ATP acts as the central link between mitochondrial metabolism, GABA-shunt activity, and Ca2+-dependent excitability in the present model.
2.1.3. DAM-Based GABA Dynamics
To describe GABA dynamics in a metabolically consistent way, we retained the DAM subsystem introduced in our previous study [18], including the same pool variables , , , and , as well as the same inter-pool fluxes , , , , and . In the original DAM formulation, these equations were used together with experimentally fitted time courses of and ATP. In the present study, however, and ATP are no longer prescribed externally, but are computed self-consistently from the differential equations introduced above. Thus, the DAM subsystem is retained in its original form, whereas its coupling to the rest of the model is extended by replacing the previously imposed and ATP dynamics with explicitly calculated variables.
Within this framework, the variable , representing the GABA pool in the original DAM model, directly provides the cytosolic GABA dynamics used in the present study. Accordingly, cytosolic GABA is not introduced here through an additional phenomenological equation, but follows directly from the original DAM equations. This preserves the metabolic interpretation of GABA as an integral part of the oscillatory redistribution of carbon between the glycolytic pool, the two TCA-cycle-related pools, and the GABA pool, as described previously [18].
As in the DAM model, the flux represents the cataplerotic branch associated with transfer from the right half of the TCA cycle toward the GABA pool, whereas represents the oxidative return flux from the GABA pool back toward the left half of the TCA cycle. These two fluxes are of particular importance in the present model because they provide the metabolic link between the DAM subsystem and ATP production. Specifically, modulates the PEP-cycle-related contribution to ATP production, whereas modulates the oxidative TCA-related contribution, as introduced in Eqs. (13) and (14). In this way, the previously developed DAM structure is preserved, while its metabolic output is now dynamically coupled to the explicitly modeled ATP and Ca2+ oscillations.
The remaining DAM equations and parameter values are the same as in the original publication [18] and are therefore not repeated here in full. This approach avoids unnecessary duplication while maintaining full consistency with the previously established metabolic framework. The essential extension introduced in the present study is that the DAM subsystem now operates within a closed dynamical model in which , , ATP, and GABA mutually interact. Consequently, GABA dynamics is no longer driven by externally imposed oscillatory inputs, but emerges from the coupled metabolic-calcium system itself.
To account for the fact that extracellular GABA does not follow cytosolic GABA instantaneously, the interstitial GABA concentration is modeled as a delayed function of cytosolic GABA,
where denotes the proportionality factor relating cytosolic and interstitial GABA levels, and represents a short effective delay associated with GABA release, diffusion in the interstitial space, and uptake/clearance. The introduction of the factor is physiologically motivated by the fact that beta cells maintain a high intracellular GABA pool, estimated to be in the millimolar range, whereas interstitial GABA in the islet is thought to lie in the nanomolar-to-low-micromolar range [14,15,16]. At present, however, a quantitative phase delay between cytosolic and interstitial GABA oscillations in pancreatic beta cells has not been experimentally established. Available evidence indicates that human beta cells release GABA directly from a cytosolic pool via VRAC in a pulsatile manner, with secretion periods typically in the 4–10 min range, while taurine transporter (TauT)-mediated uptake contributes to maintaining low interstitial GABA levels; together, these findings support a rapid release-clearance cycle but do not provide a direct numerical estimate of the lag between intracellular and extracellular GABA dynamics [14,15,16]. Recent work further showed that endogenous beta-cell-derived GABA is required for proper islet Ca2+ oscillation dynamics and suggested that GABA signaling may operate as a delayed negative feedback mechanism, yet the magnitude of this delay has likewise not been measured directly [17]. Accordingly, in the absence of direct experimental constraints, interstitial GABA is represented here by a small effective delay.
2.2. Two-Cell Coupled Model
To demonstrate how GABA promotes coordinated activity between pancreatic beta cells, we extended the single-cell model to a system of two coupled cells (Figure 2). Each cell retained the same intracellular dynamics as in the single-cell case, including Ca2+ handling, ATP production, and GABA oscillations, while coupling was introduced through a shared interstitial GABA signal. In this way, intracellular metabolic oscillations are converted into an intercellular coupling signal capable of entraining Ca2+ dynamics between neighboring beta cells.
The common interstitial GABA signal is defined as the average value of the interstitial GABA level associated with each individual cell. The arithmetic mean of the interstitial GABA level of the two-cell system is given by
where denotes the interstitial GABA signal associated with the -th cell (see Eq. 17).
As illustrated schematically in Figure 2, the shared interstitial GABA signal, , acts on both neighboring cells through and receptor-mediated pathways. Through these interactions, the common interstitial GABA pool modulates Ca2+ influx into each cell and thereby influences the timing and amplitude of intracellular Ca2+ oscillations. Because both cells are exposed to the same extracellular inhibitory GABA signal, this coupling provides a mechanism for phase alignment of their Ca2+ dynamics. In this way, GABA-mediated intercellular coupling can promote synchronization of Ca2+ signals in two-cell as well as multicellular systems, thereby supporting coordinated pulsatile insulin secretion at the islet level.
3. Results
The mathematical model defined by Eqs. (1)–(18) was used to investigate how GABA regulates Ca2+ oscillations and coordinated beta-cell dynamics. We begin by analyzing the consequences of altered GABA production, since this question is directly motivated by recent experimental observations showing that reduced endogenous GABA availability leads to decreased Ca2+ oscillation amplitude and prolonged oscillatory periods in pancreatic beta cells [17]. The first part of the Results section therefore examines how changes in GABA production affect the amplitude, frequency, and temporal organization of cytosolic Ca2+ oscillations in a single beta cell. We then dissect the underlying mechanisms by separating the metabolic contribution of GABA to ATP production from its extracellular signaling effect on Ca2+ influx, thereby identifying the dominant processes responsible for the observed oscillatory phenotype. Finally, we extend the analysis to coupled cells and show how delayed interstitial GABA signaling provides a physiologically plausible pathway for phase adjustment, entrainment, and synchronization of beta-cell oscillations. In this way, the Results section proceeds from experimentally motivated single-cell effects of altered GABA production to the emergence of coordinated multicellular dynamics.
3.1. GABA Controls Amplitude and Frequency of Ca2+ Oscillations in a Single Beta Cell
Within the proposed single-cell framework, we first examine how GABA production modulates intracellular Ca2+ oscillations. This question is directly motivated by the experimental findings of Ferreira et al. [17], who showed that endogenous beta-cell-derived GABA is essential for maintaining properly shaped Ca2+ oscillations, whereas loss of GABA signaling leads to a reduced oscillation amplitude and a prolonged oscillation period.
To investigate this effect, we varied the relative strength of the flux representing GABA production. Specifically, we introduced the dimensionless parameter , which rescales the DAM flux [18]. In the present model, is identified with the effective GABA production flux, , such that
Here, corresponds to complete suppression of GABA production, whereas retains the original DAM flux unchanged. In this way, provides a direct control parameter for intracellular GABA generation. Because cytosolic GABA in turn determines both the metabolic contribution of GABA to ATP production and the delayed interstitial GABA signal, varying alters the coupled dynamics of GABA, ATP, and Ca2+ oscillations, as illustrated in Figure 3.
Figure 3A shows the model dynamics for the reference condition, , for which GABA production remains unchanged relative to the original DAM formulation. The upper panel displays oscillations of intracellular GABA, , together with the corresponding interstitial GABA signal, . As expected from Eq. (17), follows the intracellular oscillations with a small delay and reaches concentrations that are approximately two orders of magnitude lower than those of . The lower panel shows the corresponding oscillations of cytosolic calcium, , and local ATP concentration near channels, illustrating the coupled metabolic and signaling dynamics under reference conditions.
Figure 3B shows the corresponding model dynamics under strongly reduced GABA production, . Under these conditions, both intracellular and interstitial GABA concentrations are substantially reduced relative to the reference case. This reduction is accompanied by pronounced changes in Ca2+ dynamics. In particular, the amplitudes of oscillations are reduced and the oscillation frequency decreases, corresponding to a prolongation of the oscillation period. Thus, diminished GABA production leads to both weaker and slower cytosolic Ca2+ oscillations. These predictions are in good qualitative agreement with the experimental observations of Ferreira et al. [17], who reported that impaired endogenous GABA signaling is associated with reduced Ca2+ oscillation amplitude and prolonged oscillatory periods.
Figure 3C summarizes the dependence of the model output on . The upper panel shows that the average intracellular GABA concentration, , increases monotonically with increasing GABA production. The lower panel shows the corresponding changes in Ca2+ oscillatory behavior. Both the minimum and maximum values of increase with , and the oscillation frequency rises as well. The model therefore predicts that GABA production affects not only the amplitude of cytosolic Ca2+ oscillations, but also their temporal organization. Higher GABA production is associated with larger-amplitude and higher-frequency calcium oscillations, whereas reduced GABA production leads to smaller amplitudes and lower oscillation frequencies.
Because GABA influences the system through more than one pathway, including intracellular metabolic effects on ATP production and extracellular signaling effects on Ca2+ influx, we next analyze these mechanisms separately. This allows us to distinguish the relative contributions of the metabolic and signaling actions of GABA to the modulation of Ca2+ oscillatory dynamics.
3.1.1. Impact of GABA-Dependent ATP Production on Ca2+ Oscillations
In the analysis above, variation of the overall GABA production rate altered both intracellular GABA metabolism and extracellular GABA signaling. We next isolate the metabolic contribution of GABA and examine how GABA-dependent ATP production affects Ca2+ oscillations (Figure 4). For this purpose, GABA production itself is kept unchanged, whereas its contribution to ATP generation is selectively reduced through the parameters and . As defined in Eqs. (13) and (14), these parameters determine how strongly GABA production enhances ATP generation through the PEP-related and TCA-related components, respectively. This approach allows us to assess how the intracellular metabolic action of GABA, independently of its receptor-mediated extracellular effects, contributes to the modulation of Ca2+ oscillatory dynamics.
Figure 4A shows the effect of the parameter , which determines the GABA-dependent contribution to ATP production through the PEP-related branch, on the properties of cytosolic Ca2+ oscillations. As decreases, corresponding to a progressive reduction of the GABA effect on this component of ATP production, both the minimum and maximum values of oscillations decrease, accompanied by a clear reduction in oscillation amplitude. The oscillation frequency also decreases, with the decline being most pronounced at lower values of .
Figure 4B shows the corresponding effect of the parameter , which determines the GABA-dependent contribution to ATP production through the TCA-related branch. In this case, decreasing likewise lowers both the minimum and maximum values of oscillations, whereas the oscillation amplitude remains comparatively stable over most of the parameter range. The oscillation frequency nevertheless decreases, with the effect becoming somewhat more pronounced at higher values of .
Taken together, these results indicate that GABA-dependent ATP production in both metabolic branches contributes to the maintenance of higher cytosolic Ca2+ levels and higher oscillation frequencies. However, the PEP-related branch has a more prominent effect on oscillation amplitude, whereas the TCA-related branch primarily affects oscillation timing while leaving the amplitude relatively preserved.
To further explain the changes in Ca2+ oscillation amplitude and frequency shown in Figure 4, we next examine how selective blockade of the GABA-dependent contribution to ATP production reshapes the coupled dynamics of local ATP near channels and cytosolic Ca2+. These two variables are tightly interdependent, and their temporal interplay provides the mechanistic basis for the changes in Ca2+ oscillatory behavior observed in the model.
Figure 5 shows the dynamics of local ATP near channels and cytosolic calcium, , under reference conditions (Fig. 5A), after blocking the GABA-dependent contribution to ATP production through the PEP-related branch (Fig. 5B), and after blocking the corresponding contribution through the TCA-related branch (Fig. 5C). Here, denotes the threshold ATP level required to activate the Ca2+ influx pathway in the model (Eq. 10). When ATP rises above this threshold, Ca2+ influx is initiated and begins to increase. The subsequent rise in cytosolic Ca2+ activates Ca2+-removal processes, which in turn reduce and terminate the calcium pulse. Thus, the timing and magnitude of ATP excursions relative to determine both the onset and the strength of the corresponding Ca2+ response.
When the GABA-dependent contribution to ATP production through the PEP-related branch is blocked (), ATP generation during the cataplerotic phase becomes slower. This branch corresponds to the GABA-dependent support of the PEP cycle, which is most effective when is low. As a result, the local ATP concentration near channels rises more gradually, as reflected by the shallower ATP upstroke in Figure 5B. Consequently, ATP exceeds the threshold value only weakly, leading to a smaller Ca2+ influx and, therefore, to a lower peak of . Because the Ca2+ rise remains reduced, the subsequent oxidative support of ATP production also remains limited. Together, these effects lead to both a lower amplitude and a lower frequency of Ca2+ oscillations.
When the GABA-dependent contribution to ATP production through the TCA-related branch is blocked (), ATP production during the oxidative phase is reduced because the contribution of the GABA shunt to oxidative ATP production, mediated by the return of carbon from the GABA pool into the TCA cycle, is abolished. Under these conditions, the local ATP concentration declines more strongly during the active phase of the oscillation. During the following cataplerotic phase, ATP production increases again; however, because ATP starts from a lower level, more time is required to reach the threshold value . This primarily prolongs the oscillation period and thus lowers the oscillation frequency. In contrast, the amplitude of the Ca2+ oscillations remains relatively preserved, because the late ATP rise still produces a sufficient overshoot above to trigger a pronounced Ca2+ influx, as shown in Figure 5C.
Taken together, the results in Figure 5 show that the GABA-dependent ATP-producing contribution through the PEP cycle is particularly important for generating a rapid and sufficiently large ATP rise during the cataplerotic phase, which in turn determines both the amplitude and the frequency of the subsequent Ca2+ oscillations. By contrast, the GABA-dependent contribution associated with the GABA shunt and oxidative TCA-cycle metabolism primarily supports ATP during the oxidative phase and therefore affects oscillation timing more strongly than oscillation amplitude.
3.1.2. Impact of GABA-Dependent Ca2+ Influx on Ca2+ Oscillations
We next examine how interstitial GABA modulates Ca2+ entry into the cell and, consequently, the dynamics of cytosolic Ca2+ oscillations. In the model, this regulation acts through the influx term , which describes Ca2+ entry from the extracellular space into the cytosol. As summarized in Eqs. (7)–(10), affects through two inhibitory mechanisms. First, it directly reduces the effective maximal Ca2+ influx rate by decreasing . Second, it gradually lowers the effective channel activation variable , thereby introducing a slower inhibitory feedback on Ca2+ entry. Together, these two actions represent the combined fast and delayed effects of interstitial GABA on Ca2+ influx and provide the basis for analyzing how extracellular GABA signaling reshapes Ca2+ oscillatory dynamics.
To quantify this effect, we introduce the dimensionless parameter , which rescales the interstitial GABA signal according to
The parameter ranges from 0 to 1 and therefore controls the strength of the -dependent inhibition in Eqs. (8) and (10). A value of corresponds to a complete blockade of the interstitial GABA effect on Ca2+ influx, whereas preserves the full inhibitory contribution of used in the reference model.
The resulting changes in Ca2+ dynamics are shown in Figure 6. Figure 6A compares representative time courses of for the reference case () and for complete blockade of the interstitial GABA effect (). Blocking the effect of interstitial GABA on leads to a slight increase in the amplitude of oscillations, consistent with the inhibitory action of on Ca2+ entry. In contrast, the oscillation frequency changes only modestly. This behavior is also evident in Figure 6A, where the two calcium traces remain very similar in shape but gradually develop a phase shift over time. The shaded region highlights the resulting slow beating interval, which arises from the small difference in oscillation frequency between the two conditions.
This behavior is quantified in Figure 6B, which shows the dependence of , , and oscillation frequency on . As the strength of interstitial GABA signaling is reduced, both the minimum and maximum values of increase slightly, indicating a modest increase in oscillation amplitude. By contrast, the oscillation frequency changes only weakly over the entire parameter range. Thus, Figure 6B confirms that the primary effect of interstitial GABA on the single-cell oscillator is not a strong shift in intrinsic oscillation frequency, but rather a comparatively small modulation of Ca2+ influx that manifests mainly through subtle changes in oscillation amplitude and timing.
Although the isolated effect of interstitial GABA on Ca2+ influx produces only a modest change in oscillation frequency, it still plays an important mechanistic role by adjusting oscillatory phase. In the present model, the intrinsic rhythm of the single-cell oscillator is determined primarily by ATP dynamics, whereas GABA-dependent modulation of acts mainly as a phase-adjusting mechanism. Accordingly, when GABA acts only through Ca2+ influx, the resulting traces remain similar in overall amplitude and period but progressively drift in phase, as illustrated by the beating pattern in Figure 6A. Thus, the GABA-dependent regulation of Ca2+ influx does not constitute the dominant mechanism setting the intrinsic oscillation frequency; rather, it fine-tunes oscillatory timing by shifting phase. This distinction becomes especially important in the coupled-cell setting, where even a moderate GABA-dependent phase adjustment of Ca2+ entry can facilitate entrainment between neighboring cells and thereby promote efficient synchronization, as examined in the next section.
3.2. Intercellular GABA Couples and Entrains Ca2+ Oscillations in Two Beta Cells
We next examined whether the GABA-dependent modulation of Ca2+ influx, which in the single-cell analysis acted primarily as a phase-adjusting mechanism, is sufficient to promote entrainment and synchronization between two coupled beta cells. For this purpose, we used the two-cell model introduced in Section 2.2, in which each cell retains its own intracellular metabolic and Ca2+ dynamics, whereas coupling is mediated through the shared interstitial GABA signal . In this way, intracellular GABA oscillations generated by the metabolic subsystem are transformed into a common extracellular coupling signal that acts back on both cells and modulates Ca2+ influx in each of them.
The corresponding dynamics are shown in Figure 7. At the beginning of the simulation (Fig. 7A), the two cells exhibit a clear phase difference in their cytosolic Ca2+ oscillations, indicating that they are initially not entrained. Consistent with this, the two interstitial GABA signals are also phase-shifted during the initial regime. After the onset of GABA-mediated coupling, both cells begin to sense the shared interstitial GABA signal , which progressively reduces the phase difference between the two oscillators by jointly modulating Ca2+ influx. To make the late stage of this process more visible, Figure 7 contains a break in the time axis. In the later regime shown in Fig. 7B, the two interstitial GABA signals overlap and form a common oscillatory signal, while the corresponding cytosolic Ca2+ traces also overlap almost completely, indicating effective entrainment and near-complete synchronization.
As an additional quantitative confirmation of this transition, synchronization was characterized by a time-dependent Pearson correlation coefficient, , calculated over an exponentially weighted moving window, following the general approach of Pozzi et al. [28]. In the present context, this coefficient serves as a compact measure of the transition from an initially phase-shifted regime to a synchronized state and does not require further methodological detail here. As shown in Fig. 7C, the correlation is initially low or negative, consistent with the phase-shifted oscillations in Fig. 7A, and then rises progressively toward values close to 1 after GABA-mediated coupling is switched on, indicating convergence of the two Ca2+ oscillators to a common rhythm.
These results show that even a relatively modest GABA-dependent modulation of Ca2+ influx is sufficient to coordinate oscillatory beta-cell activity when transmitted through the interstitial space. In mechanistic terms, ATP-dependent metabolic dynamics primarily determine the intrinsic oscillatory rhythm of each cell, whereas intercellular GABA provides the coupling signal that adjusts phase and gradually aligns the two oscillators. Thus, the model supports a division of roles in which metabolism sets the intrinsic pace of the oscillations, while extracellular GABA-mediated signaling enables entrainment and synchronization between neighboring cells. This interpretation is consistent with the experimental view that beta-cell-derived GABA can function as an intercellular coordinating signal within the islet [14].
To further evaluate the physiological relevance of this coupling mechanism, we next examined how strongly the parameters of the two cells may differ while synchronization is still maintained. This question is important because beta cells within the islet are intrinsically heterogeneous and therefore do not share identical metabolic, signaling, or excitability properties. In the model, such physiological variability is represented by differences in selected parameter values between the two cells. We therefore asked whether GABA-mediated coupling remains sufficiently robust to entrain cells that differ in their intrinsic oscillatory characteristics. Rather than analyzing all model parameters, we selected a representative set of nine parameters according to their mechanistic roles in the system. Specifically, the selected set includes parameters describing the metabolic component of the model, namely GABA production, the PEP-related and TCA-related contributions to ATP generation, and the two ATP-consumption terms; parameters representing extracellular GABA action on Ca2+ influx, including the overall strength of the interstitial GABA signal and the fast and slow inhibitory coupling pathways; and a parameter characterizing intrinsic cellular excitability through the ATP threshold for activation of Ca2+ influx. In this way, the selected set spans the principal determinants of the intrinsic oscillatory rhythm, the strength of intercellular GABA-mediated phase adjustment, and the baseline responsiveness of the Ca2+-influx pathway. Table 1 summarizes the corresponding synchronization ranges and thereby illustrates not only the robustness of the model itself, but also the capacity of GABA-mediated entrainment to synchronize metabolically and functionally non-identical beta cells.
In non-identical cells, GABA-mediated coupling does not necessarily induce complete in-phase synchronization of the two Ca2+ signals (), because the cells represent non-identical oscillators with slightly different intrinsic frequencies and intrinsic dynamics. Thus, coupling does not fully equalize their signals, but rather stabilizes their relative phase, allowing the cells to oscillate with a common rhythm while maintaining a finite phase difference (). Table 1 shows the ranges of selected parameters in the second cell relative to the first cell for which GABA-mediated coupling still supports stable phase locking with a moving Pearson correlation coefficient of , corresponding to a Ca2+ signal phase lag of up to approximately 10% of the oscillation period.
Column A of Table 1 shows the synchronization ranges obtained for the reference strength of the interstitial GABA signal (). To assess how stronger interstitial GABA action influences synchronization between the two cells, Column B shows the corresponding ranges for the increased value (). Comparison of Columns A and B shows that increasing the influence of interstitial GABA generally broadens the range of parameter mismatch over which stable phase locking is still achieved (). This indicates that a stronger shared GABA signal more effectively compensates for differences in the intrinsic properties of the two cells and thereby enhances the robustness of synchronization.
A notable exception is the parameter , for which increasing reduces the upper limit of the synchronization range. A positive deviation of in the second cell enhances the PEP-related contribution to ATP production, causing local ATP to rise more rapidly and to reach the threshold for Ca2+ influx earlier. As a result, the corresponding Ca2+ pulse is advanced in time relative to that of the first cell. This interpretation is consistent with Figure 5A and 5B, which show that the PEP-related branch strongly affects the rate of ATP rise and the timing of threshold crossing. Moreover, Figure 4A indicates that increasing above its reference value () changes oscillation frequency less strongly than decreasing it below the reference value, which explains the relatively broad positive synchronization range under reference coupling. When interstitial GABA signaling is strengthened (), however, the delayed GABA-dependent inhibition of Ca2+ influx is also enhanced. Under these conditions, larger positive deviations of lead to a less favorable balance between earlier ATP-dependent triggering and stronger delayed inhibitory feedback, thereby narrowing the upper bound of the synchronization range. In other words, stronger interstitial GABA generally improves phase locking, but in the case of excessive enhancement of the PEP-related ATP-producing branch it can also accentuate the timing mismatch that limits stable entrainment.
To further extend the analysis, we asked whether synchronization could be reinforced not only by paracrine GABA-mediated coupling, but also by a weak effective electrical interaction between the cells. This question is physiologically relevant because beta cells within the islet are connected not only through extracellular signaling, but also through direct electrical coupling via gap junctions, predominantly formed by connexin-36 (Cx36) channels. Experimental studies have shown that Cx36-mediated gap-junction coupling is important for the synchronization of glucose-induced Ca2+ oscillations and pulsatile insulin secretion in beta cells and intact islets [29,30,31]. In addition, experimental and computational studies have demonstrated that gap-junction coupling, together with beta-cell heterogeneity, can shape coordinated Ca2+ wave propagation and population-level synchronization within the islet [32]. Because the present model does not include an explicit equation for membrane potential, we represented this effect phenomenologically by adding an additional term to Eq. (8), which defines the conductance of Ca2+ influx,
where determines the strength of weak effective electrical coupling. This term does not represent direct diffusion of Ca2+ between cells; rather, it provides an effective description of how electrical coupling can influence cellular excitability and, consequently, voltage-dependent Ca2+ entry. The results of this case are summarized in Column C of Table 1 (, ). Comparison with Column B shows that the addition of weak electrical coupling further broadens the ranges of all selected parameters for which stable phase locking is maintained (). This indicates that weak electrical coupling can complement GABA-mediated synchronization and further increase the robustness of coordinated activity between non-identical cells.
Viewed together, the results summarized in Table 1 show that GABA-mediated intercellular coupling is sufficiently robust to entrain beta cells even in the presence of physiologically plausible heterogeneity, and that this robustness can be further enhanced by weak effective electrical coupling. The model therefore supports the view that extracellular GABA can act as an effective coordinating signal that aligns the phases of non-identical beta-cell oscillators and promotes synchronized Ca2+ activity at the islet level, while electrical coupling provides an additional stabilizing influence on this process. This interpretation is consistent with experimental evidence showing that pulsatile GABA release from beta cells can contribute to the coordination of islet activity [14], with the broader view that extracellular GABA participates in receptor-mediated auto/paracrine regulation of islet function [15], and with recent findings that endogenous beta-cell-derived GABA is required for proper Ca2+ oscillation dynamics and insulin secretion [17].
4. Discussion
The present study provides a mechanistic framework linking intracellular GABA metabolism to both single-cell Ca2+ oscillations and intercellular synchronization in pancreatic beta cells. By combining the previously developed DAM framework [18] with explicit equations for cytosolic Ca2+, ER Ca2+, ATP, and GABA-dependent regulation of Ca2+ influx, we were able to connect metabolic, signaling, and collective aspects of beta-cell function within a single dynamical model. In this way, the model extends earlier conceptual work on the metabolic role of the GABA shunt in beta cells [8,12,13] toward an explicit explanation of how GABA shapes Ca2+ oscillatory dynamics and coordinated beta-cell behavior.
A central result of the study is that reduced GABA production leads to lower-amplitude and lower-frequency Ca2+ oscillations. This prediction is in good qualitative agreement with the recent experiments of Ferreira et al. [17], who showed that endogenous beta-cell-derived GABA is required for properly shaped Ca2+ oscillations and normal insulin secretion. In the present model, this phenotype is not imposed phenomenologically, but emerges from the coupled effects of reduced intracellular GABA metabolism and weaker extracellular GABA signaling. Thus, the model provides a mechanistic explanation for how impaired endogenous GABA availability can alter both the magnitude and timing of beta-cell Ca2+ signals.
The analysis further shows that the metabolic action of GABA is best understood within the dual-anaplerotic logic of the DAM. In this framework, GABA contributes to ATP production in two related but functionally distinct ways. First, through the GABA shunt, it supports oxidative ATP production during the oxidative phase by returning carbon from the GABA pool into the TCA cycle. Second, by increasing the effective carbon volume available for subsequent cataplerosis, it indirectly promotes the PEP cycle and thereby strengthens local ATP production during the cataplerotic phase. The model indicates that this PEP-related contribution is especially important for generating a rapid and sufficiently large ATP rise near KATP channels, which in turn is crucial for both the amplitude and the frequency of the ensuing Ca2+ oscillations. By contrast, the oxidative TCA-related contribution primarily stabilizes ATP during the active phase and therefore affects oscillation timing more strongly than oscillation amplitude. This interpretation is consistent with the broader view that GABA metabolism is functionally integrated with beta-cell bioenergetics and insulin secretion [8,13,23,24].
A second important result is that extracellular GABA signaling, when considered in isolation, exerts only a modest effect on the intrinsic oscillation frequency of a single cell, but plays a key role in phase adjustment. In the model, this extracellular action is represented by a fast inhibitory effect on the effective Ca2+-influx term and a slower inhibitory effect mediated through the regulatory variable . Physiologically, these two components correspond to a simplified description of ionotropic and metabotropic GABAergic actions, respectively, and are consistent with the current view that beta-cell-derived GABA acts through both auto/paracrine receptor-mediated pathways and metabolic coupling [15,16,17]. The present results therefore suggest a functional division of labor between the two major GABA actions in the model: ATP dynamics primarily determine the intrinsic oscillatory rhythm, whereas extracellular GABA-dependent modulation of Ca2+ influx primarily adjusts oscillatory phase.
This distinction becomes particularly important at the multicellular level. Once two cells are coupled through the shared interstitial GABA signal, even a relatively small GABA-dependent phase adjustment of Ca2+ influx is sufficient to entrain the two oscillators and drive them toward synchronized activity. Importantly, this synchronization persists over finite ranges of parameter mismatch between the two cells, which is physiologically relevant because beta cells within the islet are intrinsically heterogeneous in their metabolic activity, signaling properties, and excitability. The model therefore supports the view that extracellular GABA can act as an effective coordinating signal that aligns the phases of non-identical beta-cell oscillators. In addition, our analysis shows that weak effective electrical coupling can further broaden the parameter ranges over which stable phase locking is maintained, indicating that paracrine GABA signaling and electrical interactions may act in a complementary manner to stabilize coordinated beta-cell activity. This interpretation is consistent with experimental evidence that pulsatile GABA release from beta cells can contribute to the coordination of islet activity [14], with the broader view that extracellular GABA participates in receptor-mediated auto/paracrine regulation of islet function [15], with the observation that endogenous GABA is required for proper Ca2+ oscillation dynamics [17], and with studies showing that Cx36-mediated coupling supports synchronized beta-cell Ca2+ activity and pulsatile insulin secretion [29,30,31,32].
From a modeling perspective, the present framework does not aim to replace detailed electrophysiological models of beta-cell activity, but rather to complement them. Previous mathematical studies have provided important insight into bursting dynamics, the interaction between metabolic and electrical oscillations, oscillations in KATP conductance, phantom bursting, and the behavior of coupled and multicellular islet models [22,33,34,35,36,37]. Our model adds to this line of work by explicitly incorporating intracellular GABA dynamics, GABA-dependent ATP production, delayed interstitial GABA signaling, and a phenomenological weak electrical-coupling term into a minimal Ca2+–ATP oscillatory framework. In this sense, it can be viewed as a metabolically and paracrinely enriched module that captures how paracrine GABA signaling and electrical interactions may jointly contribute to beta-cell coordination, and that could in future work be integrated with more detailed membrane-potential-based models of beta-cell electrophysiology and islet network behavior.
The model also has several limitations. Membrane potential and individual ionic currents are not described explicitly, and the effects of GABAA and GABAB receptors are represented only phenomenologically through effective modulation of Ca2+ influx and the slow regulatory variable . Likewise, the interstitial GABA signal is represented by a simple delayed relation to cytosolic GABA, and the present multicellular analysis is restricted to a pair of coupled cells. In addition, electrical coupling is not modeled through explicit gap-junction currents or membrane-potential equations, but only through a weak effective term acting on the Ca2+-influx conductance. These simplifications mean that the model is primarily suited to the slow oscillatory timescale considered here and does not yet address the faster and ultrafast electrical bursting dynamics that also contribute to beta-cell activity. Future extensions should therefore combine the present GABA-centered metabolic framework with more detailed electrophysiological descriptions, explicit gap-junction coupling, and larger multicellular islet architectures, thereby linking GABA metabolism, membrane excitability, electrical connectivity, and spatially distributed islet synchronization in a unified model [19,35,37].
In conclusion, the present study identifies GABA as a dual regulator of beta-cell dynamics: metabolically, it shapes the intrinsic amplitude and frequency of Ca2+ oscillations through its effects on ATP production, and paracrinely, it promotes entrainment and synchronization by adjusting the phase of Ca2+ influx between neighboring cells. The model further suggests that this GABA-mediated coordinating effect can be reinforced by weak electrical coupling, thereby increasing the robustness of synchronized activity in heterogeneous beta-cell populations. Together, these findings provide a coherent mechanistic framework that connects GABA metabolism, local ATP dynamics, Ca2+ oscillations, intercellular phase coordination, and coordinated collective activity in pancreatic islets.
Author Contributions
Conceptualization, M.M.; methodology, V.G.; software, V.G.; formal analysis, V.G.; writing—original draft preparation, M.M. and V.G.; writing—review and editing, M.M. and V.G.; visualization, V.G.; supervision, M.M.; Both authors have read and agreed to the published version of the manuscript.
Funding
This research was funded by the Slovenian Research and Innovation Agency (research core funding no. P1-0055 and research project no. J3-60062).
Institutional Review Board Statement
Not applicable.
Informed Consent Statement
Not applicable.
Data Availability Statement
The original contributions presented in this study are included in the article. Further inquiries can be directed to the corresponding author.
Conflicts of Interest
The authors declare no conflicts of interest.
Abbreviations
The following abbreviations are used in this manuscript:
| a.u. | arbitrary units | |
| αKG | α-ketoglutarate | |
| ADP | adenosine diphosphate | |
| ATP | adenosine triphosphate | |
| ATPopen | threshold ATP level required to activate Ca2+ influx | |
| ATPase | ATP-consuming Ca2+ pumps | |
| cAMP | cyclic adenosine monophosphate | |
| Cacyt | cytosolic calcium | |
| CaER | endoplasmic reticulum calcium | |
| CDI | Ca2+-dependent inactivation | |
| CICR | Ca2+-induced Ca2+ release | |
| Cl− | chloride ion | |
| corr | Pearson correlation coefficient | |
| Cx36 | connexin-36 | |
| DAM | Dual Anaplerotic Model | |
| ER | endoplasmic reticulum | |
| ETC | electron transport chain | |
| FADH2 | reduced flavin adenine dinucleotide | |
| Fum | fumarate | |
| freq | oscillation frequency | |
| GABA | γ-aminobutyric acid | |
| GABAA | GABAA receptor | |
| GABAB | GABAB receptor | |
| GABAcyt | cytosolic GABA | |
| GABAis | interstitial GABA | |
| GABAis,avg | average interstitial GABA signal shared by coupled cells | |
| GAD | glutamic acid decarboxylase | |
| GAD65 | 65-kDa isoform of glutamic acid decarboxylase | |
| GAD67 | 67-kDa isoform of glutamic acid decarboxylase | |
| Gi/o | inhibitory G protein pathway | |
| IOM | Integrated Oscillator Model | |
| KATP | ATP-sensitive potassium channel | |
| NADH | reduced nicotinamide adenine dinucleotide | |
| OAA | oxaloacetate | |
| OxPhos | oxidative phosphorylation | |
| PC | pyruvate carboxylase | |
| PDH | pyruvate dehydrogenase | |
| PEP | phosphoenolpyruvate | |
| Pyr | pyruvate | |
| SERCA | sarco/endoplasmic reticulum Ca2+-ATPase | |
| Suc | succinate | |
| TCA | tricarboxylic acid cycle | |
| TauT | taurine transporter | |
| VGCC | voltage-gated calcium channel | |
| VRAC | volume-regulated anion channel | |
| MDPI | Multidisciplinary Digital Publishing Institute | |
| DOAJ | Directory of open access journals | |
| TLA | Three letter acronym | |
| LD | Linear dichroism | |
In figure labels, the subscripts avg, min, max, 1, and 2 denote average, minimum, maximum, and cell indices, respectively.
References
- Rorsman, P.; Ashcroft, F.M. Pancreatic β-cell electrical activity and insulin secretion: Of mice and men. Physiol. Rev. 2018, 98(1), 117–214. [Google Scholar] [CrossRef] [PubMed]
- Taniguchi, H.; Okada, Y.; Seguchi, H.; Shimada, C.; Seki, M.; Tsutou, A.; Baba, S. High concentration of gamma-aminobutyric acid in pancreatic beta cells. Diabetes 1979, 28(7), 629–633. [Google Scholar] [CrossRef]
- Reetz, A.; Solimena, M.; Matteoli, M.; Folli, F.; Takei, K.; De Camilli, P. GABA and pancreatic beta-cells: Colocalization of glutamic acid decarboxylase (GAD) and GABA with synaptic-like microvesicles suggests their role in GABA storage and secretion. EMBO J. 1991, 10(5), 1275–1284. [Google Scholar] [CrossRef] [PubMed]
- Braun, M.; Wendt, A.; Birnir, B.; Broman, J.; Eliasson, L.; Galvanovskis, J.; Gromada, J.; Rorsman, P. Regulated exocytosis of GABA-containing synaptic-like microvesicles in pancreatic beta-cells. J. Gen. Physiol. 2004, 123(3), 191–204. [Google Scholar] [CrossRef]
- Braun, M.; Ramracheya, R.; Bengtsson, M.; Clark, A.; Walker, J.N.; Johnson, P.R.; Rorsman, P. Gamma-aminobutyric acid (GABA) is an autocrine excitatory transmitter in human pancreatic beta-cells. Diabetes 2010, 59(7), 1694–1701. [Google Scholar] [CrossRef]
- Newsholme, P.; Brennan, L.; Bender, K. Amino acid metabolism, β-cell function, and diabetes. Diabetes 2006, 55 (Suppl. 2), S39–S47. [Google Scholar] [CrossRef]
- Wang, C.; Kerckhofs, K.; Van de Casteele, M.; Smolders, I.; Pipeleers, D.; Ling, Z. Glucose inhibits GABA release by pancreatic beta-cells through an increase in GABA shunt activity. Am. J. Physiol. Endocrinol. Metab. 2006, 290(3), E494–E499. [Google Scholar] [CrossRef]
- Pizarro-Delgado, J.; Braun, M.; Hernández-Fisac, I.; Martín-Del-Río, R.; Tamarit-Rodriguez, J. Glucose promotion of GABA metabolism contributes to the stimulation of insulin secretion in β-cells. Biochem. J. 2010, 431(3), 381–389. [Google Scholar] [CrossRef] [PubMed]
- Fahien, L.A.; MacDonald, M.J. The complex mechanism of glutamate dehydrogenase in insulin secretion. Diabetes 2011, 60(10), 2450–2454. [Google Scholar] [CrossRef]
- Jenstad, M.; Chaudhry, F.A. The amino acid transporters of the glutamate/GABA-glutamine cycle and their impact on insulin and glucagon secretion. Front. Endocrinol. 2013, 4, 199. [Google Scholar] [CrossRef]
- Pizarro-Delgado, J.; Tamarit-Rodriguez, J. Does GABA metabolism play any specific role in the stimulation of insulin secretion in β-cells? Int. J. Diabetes Clin. Res. 2014, 1, 007. Available online: https://www.clinmedjournals.org/articles/ijdcr/ijdcr-1-007.php. [CrossRef]
- Tamarit-Rodriguez, J. Metabolic role of GABA in the secretory function of pancreatic β-cells: Its hypothetical implication in β-cell degradation in type 2 diabetes. Metabolites 2023, 13(6), 697. [Google Scholar] [CrossRef]
- Tamarit-Rodriguez, J. Stimulus–secretion coupling mechanisms of glucose-induced insulin secretion: Biochemical discrepancies among the canonical, ADP privation, and GABA-shunt models. Int. J. Mol. Sci. 2025, 26(7), 2947. [Google Scholar] [CrossRef]
- Menegaz, D.; Hagan, D.W.; Almaça, J.; Cianciaruso, C.; Rodriguez-Diaz, R.; Molina, J.; Dolan, R.M.; Becker, M.W.; Schwalie, P.C.; Nano, R.; Lebreton, F.; Kang, C.; Sah, R.; Gaisano, H.Y.; Berggren, P.-O.; Baekkeskov, S.; Caicedo, A.; Phelps, E.A. Mechanism and effects of pulsatile GABA secretion from cytosolic pools in the human beta cell. Nat. Metab. 2019, 1(11), 1110–1126. [Google Scholar] [CrossRef]
- Hagan, D.W.; Ferreira, S.M.; Santos, G.J.; Phelps, E.A. The role of GABA in islet function. Front. Endocrinol. 2022, 13, 972115. [Google Scholar] [CrossRef]
- Jin, Z.; Korol, S.V. GABA signalling in human pancreatic islets. Front. Endocrinol. 2023, 14, 1059110. [Google Scholar] [CrossRef]
- Ferreira, S.M.; Hagan, D.W.; Stis, A.E.; Widener, A.E.; Cuaycal, A.E.; Rancourt, C.; Readey, A.G.; Smurlick, D.S.; Fu, D.A.; Campbell-Thompson, M.; Rupnik, M.S.; Phelps, E.A. Beta cell secreted GABA sets appropriate insulin secretion by modulating islet calcium oscillations. Mol. Metab. 2025, 102, 102268. [Google Scholar] [CrossRef] [PubMed]
- Grubelnik, V.; Zmazek, J.; Marhl, M. The Dual Anaplerotic Model (DAM): Integral roles of pyruvate carboxylase and the GABA shunt in beta cell insulin secretion. Life 2026, 16(1), 171. [Google Scholar] [CrossRef] [PubMed]
- Bertram, R.; Satin, L.S.; Sherman, A.S. Closing in on the mechanisms of pulsatile insulin secretion. Diabetes 2018, 67(3), 351–359. [Google Scholar] [CrossRef] [PubMed]
- Pedersen, M.G. Contributions of mathematical modeling of beta cells to the understanding of beta-cell oscillations and insulin secretion. J. Diabetes Sci. Technol. 2009, 3(1), 12–20. [Google Scholar] [CrossRef]
- Han, K.; Kang, H.; Kim, J.; Choi, M. Mathematical models for insulin secretion in pancreatic β-cells. Islets 2012, 4(2), 94–107. [Google Scholar] [CrossRef]
- Bertram, R.; Marinelli, I.; Fletcher, P.A.; Satin, L.S.; Sherman, A.S. Deconstructing the integrated oscillator model for pancreatic β-cells. Math. Biosci. 2023, 365, 109085. [Google Scholar] [CrossRef] [PubMed]
- Grubelnik, V.; Zmazek, J.; Marhl, M. The synergistic impact of glycolysis, mitochondrial OxPhos, and PEP cycling on ATP production in beta cells. Int. J. Mol. Sci. 2025, 26(4), 1454. [Google Scholar] [CrossRef] [PubMed]
- Lewandowski, S.L.; Cardone, R.L.; Foster, H.R.; Ho, T.; Potapenko, E.; Poudel, C.; VanDeusen, H.R.; Sdao, S.M.; Alves, T.C.; Zhao, X.; et al. Pyruvate kinase controls signal strength in the insulin secretory pathway. Cell Metab. 2020, 32(5), 736–750.e5. [Google Scholar] [CrossRef]
- Li, J.; Shuai, H.Y.; Gylfe, E.; Tengholm, A. Oscillations of sub-membrane ATP in glucose-stimulated beta cells depend on negative feedback from Ca2+. Diabetologia 2013, 56(7), 1577–1586. [Google Scholar] [CrossRef] [PubMed]
- Peterson, B.Z.; DeMaria, C.D.; Adelman, J.P.; Yue, D.T. Calmodulin is the Ca2+ sensor for Ca2+-dependent inactivation of L-type calcium channels. Neuron 1999, 22(3), 549–558. [Google Scholar] [CrossRef]
- Ames, J.B. L-Type Ca2+ channel regulation by calmodulin and CaBP1. Biomolecules 2021, 11(12), 1811. [Google Scholar] [CrossRef]
- Pozzi, F.; Di Matteo, T.; Aste, T. Exponential smoothing weighted correlations. Eur. Phys. J. B 2012, 85, 175. [Google Scholar] [CrossRef]
- Calabrese, A.; Zhang, M.; Serre-Beinier, V.; Caton, D.; Mas, C.; Satin, L.S.; Meda, P. Connexin 36 controls synchronization of Ca2+ oscillations and insulin secretion in MIN6 cells. Diabetes 2003, 52(2), 417–424. [Google Scholar] [CrossRef]
- Ravier, M.A.; Güldenagel, M.; Charollais, A.; Gjinovci, A.; Caille, D.; Söhl, G.; Wollheim, C.B.; Willecke, K.; Henquin, J.C.; Meda, P. Loss of connexin36 channels alters beta-cell coupling, islet synchronization of glucose-induced Ca2+ and insulin oscillations, and basal insulin release. Diabetes 2005, 54(6), 1798–1807. [Google Scholar] [CrossRef]
- Benninger, R.K.P.; Zhang, M.; Head, W.S.; Satin, L.S.; Piston, D.W. Gap junction coupling and calcium waves in the pancreatic islet. Biophys. J. 2008, 95(11), 5048–5061. [Google Scholar] [CrossRef]
- Benninger, R.K.P.; Hutchens, T.; Head, W.S.; McCaughey, M.J.; Zhang, M.; Le Marchand, S.J.; Satin, L.S.; Piston, D.W. Intrinsic islet heterogeneity and gap junction coupling determine spatiotemporal Ca2+ wave dynamics. Biophys. J. 2014, 107(11), 2723–2733. [Google Scholar] [CrossRef] [PubMed]
- Marinelli, I.; Vo, T.; Gerardo-Giorda, L.; Bertram, R. Transitions between bursting modes in the integrated oscillator model for pancreatic β-cells. J. Theor. Biol. 2018, 454, 310–319. [Google Scholar] [CrossRef]
- Fazli, M.; Vo, T.; Bertram, R. Phantom bursting may underlie electrical bursting in single pancreatic β-cells. J. Theor. Biol. 2020, 501, 110346. [Google Scholar] [CrossRef]
- Marinelli, I.; Fletcher, P.A.; Sherman, A.S.; Satin, L.S.; Bertram, R. Symbiosis of Electrical and Metabolic Oscillations in Pancreatic β-Cells. Front. Physiol. 2021, 12, 781581. [Google Scholar] [CrossRef] [PubMed]
- Marinelli, I.; Thompson, B.M.; Parekh, V.S.; Fletcher, P.A.; Gerardo-Giorda, L.; Sherman, A.S.; Satin, L.S.; Bertram, R. Oscillations in K(ATP) conductance drive slow calcium oscillations in pancreatic β-cells. Biophys. J. 2022, 121(8), 1449–1464. [Google Scholar] [CrossRef] [PubMed]
- Félix-Martínez, G.J.; Godínez-Fernández, J.R. A primer on modelling pancreatic islets: from models of coupled β-cells to multicellular islet models. Islets 2023, 15(1), 2231609. [Google Scholar] [CrossRef]
Figure 1.
Schematic representation of the cellular processes influencing intracellular Ca2+ oscillatory dynamics in a single beta cell. The individual fluxes and regulatory influences are described in detail in the main text. Abbreviations: αKG—α-ketoglutarate; ATP—adenosine triphosphate; ATPase—ATP-consuming Ca2+ pumps; cAMP—cyclic adenosine monophosphate; —cytosolic calcium; —endoplasmic reticulum calcium; Cl−—chloride ion; ER—endoplasmic reticulum; ETC—electron transport chain; FADH2—reduced flavin adenine dinucleotide; Fum—fumarate; GABA—γ-aminobutyric acid; —cytosolic GABA; —interstitial GABA; — receptor; — receptor; —GABA production flux; —GABA shunt flux; —ATP-sensitive potassium channel; NADH—reduced nicotinamide adenine dinucleotide; OAA—oxaloacetate; OxPhos—oxidative phosphorylation; PC—pyruvate carboxylase; PDH—pyruvate dehydrogenase; PEP—phosphoenolpyruvate; Pyr—pyruvate; SERCA—sarco/endoplasmic reticulum Ca2+-ATPase; Suc—succinate; TCA—tricarboxylic acid cycle; VGCC—voltage-gated calcium channel; VRAC—volume-regulated anion channel.
Figure 1.
Schematic representation of the cellular processes influencing intracellular Ca2+ oscillatory dynamics in a single beta cell. The individual fluxes and regulatory influences are described in detail in the main text. Abbreviations: αKG—α-ketoglutarate; ATP—adenosine triphosphate; ATPase—ATP-consuming Ca2+ pumps; cAMP—cyclic adenosine monophosphate; —cytosolic calcium; —endoplasmic reticulum calcium; Cl−—chloride ion; ER—endoplasmic reticulum; ETC—electron transport chain; FADH2—reduced flavin adenine dinucleotide; Fum—fumarate; GABA—γ-aminobutyric acid; —cytosolic GABA; —interstitial GABA; — receptor; — receptor; —GABA production flux; —GABA shunt flux; —ATP-sensitive potassium channel; NADH—reduced nicotinamide adenine dinucleotide; OAA—oxaloacetate; OxPhos—oxidative phosphorylation; PC—pyruvate carboxylase; PDH—pyruvate dehydrogenase; PEP—phosphoenolpyruvate; Pyr—pyruvate; SERCA—sarco/endoplasmic reticulum Ca2+-ATPase; Suc—succinate; TCA—tricarboxylic acid cycle; VGCC—voltage-gated calcium channel; VRAC—volume-regulated anion channel.
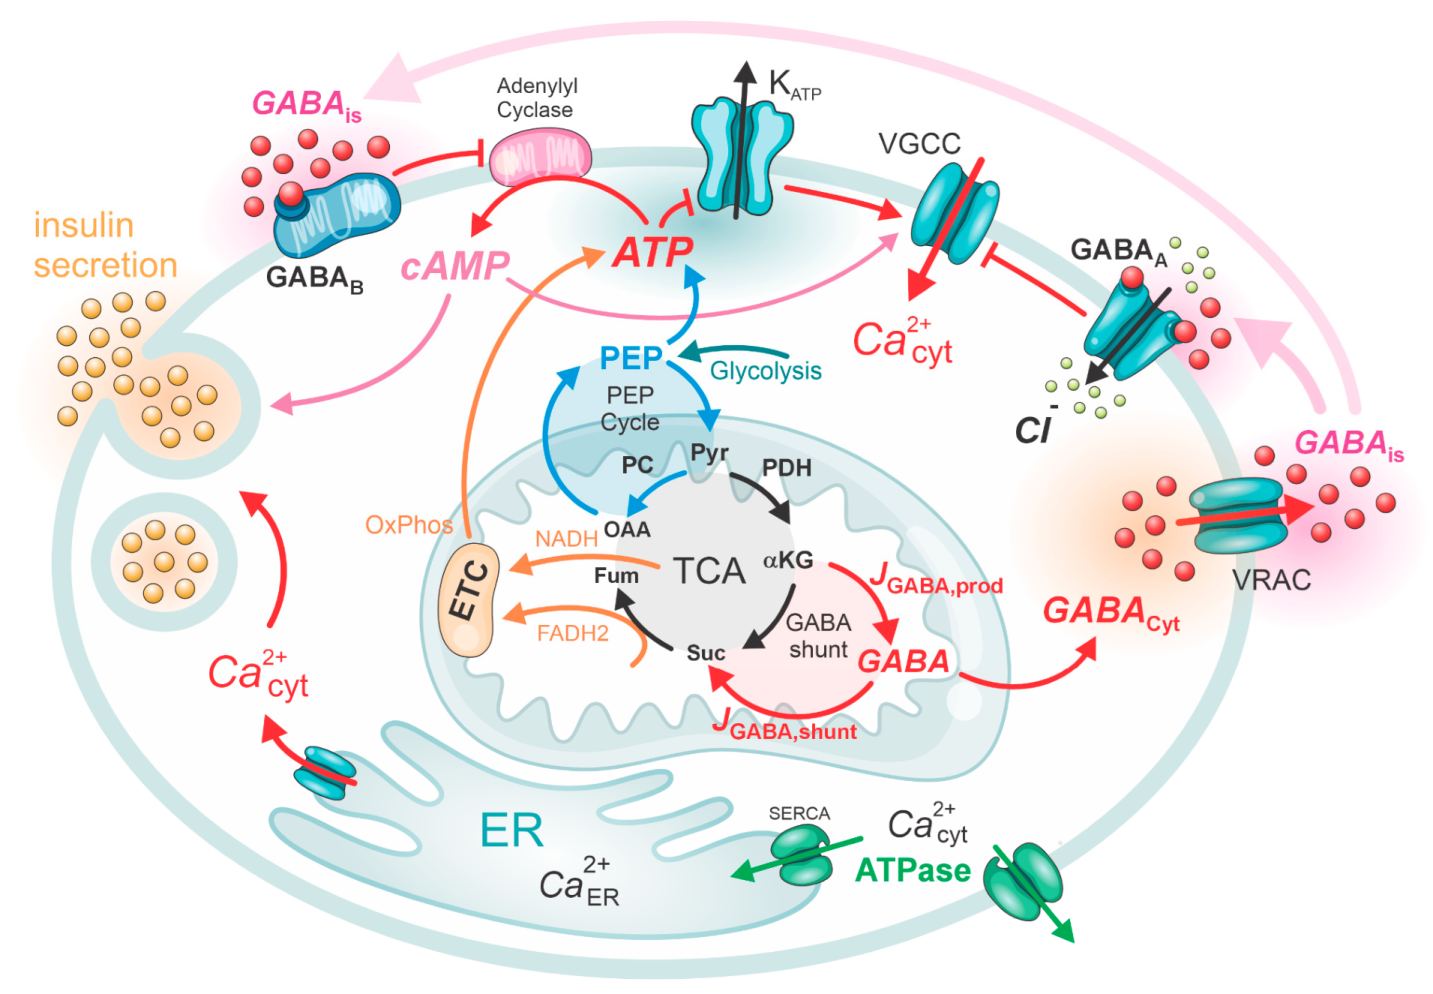
Figure 2.
Schematic representation of GABA-mediated intercellular coupling between two beta cells and its role in the synchronization of intracellular Ca2+ oscillations. The individual labels are defined in Figure 1. In addition, is introduced here as the average interstitial GABA signal shared by the coupled cells. Through and receptor-mediated pathways, this common extracellular GABA signal exerts an inhibitory effect on Ca2+ influx into each cell, thereby modulating intracellular Ca2+ signals and promoting synchronized intracellular activity across the coupled system.
Figure 2.
Schematic representation of GABA-mediated intercellular coupling between two beta cells and its role in the synchronization of intracellular Ca2+ oscillations. The individual labels are defined in Figure 1. In addition, is introduced here as the average interstitial GABA signal shared by the coupled cells. Through and receptor-mediated pathways, this common extracellular GABA signal exerts an inhibitory effect on Ca2+ influx into each cell, thereby modulating intracellular Ca2+ signals and promoting synchronized intracellular activity across the coupled system.
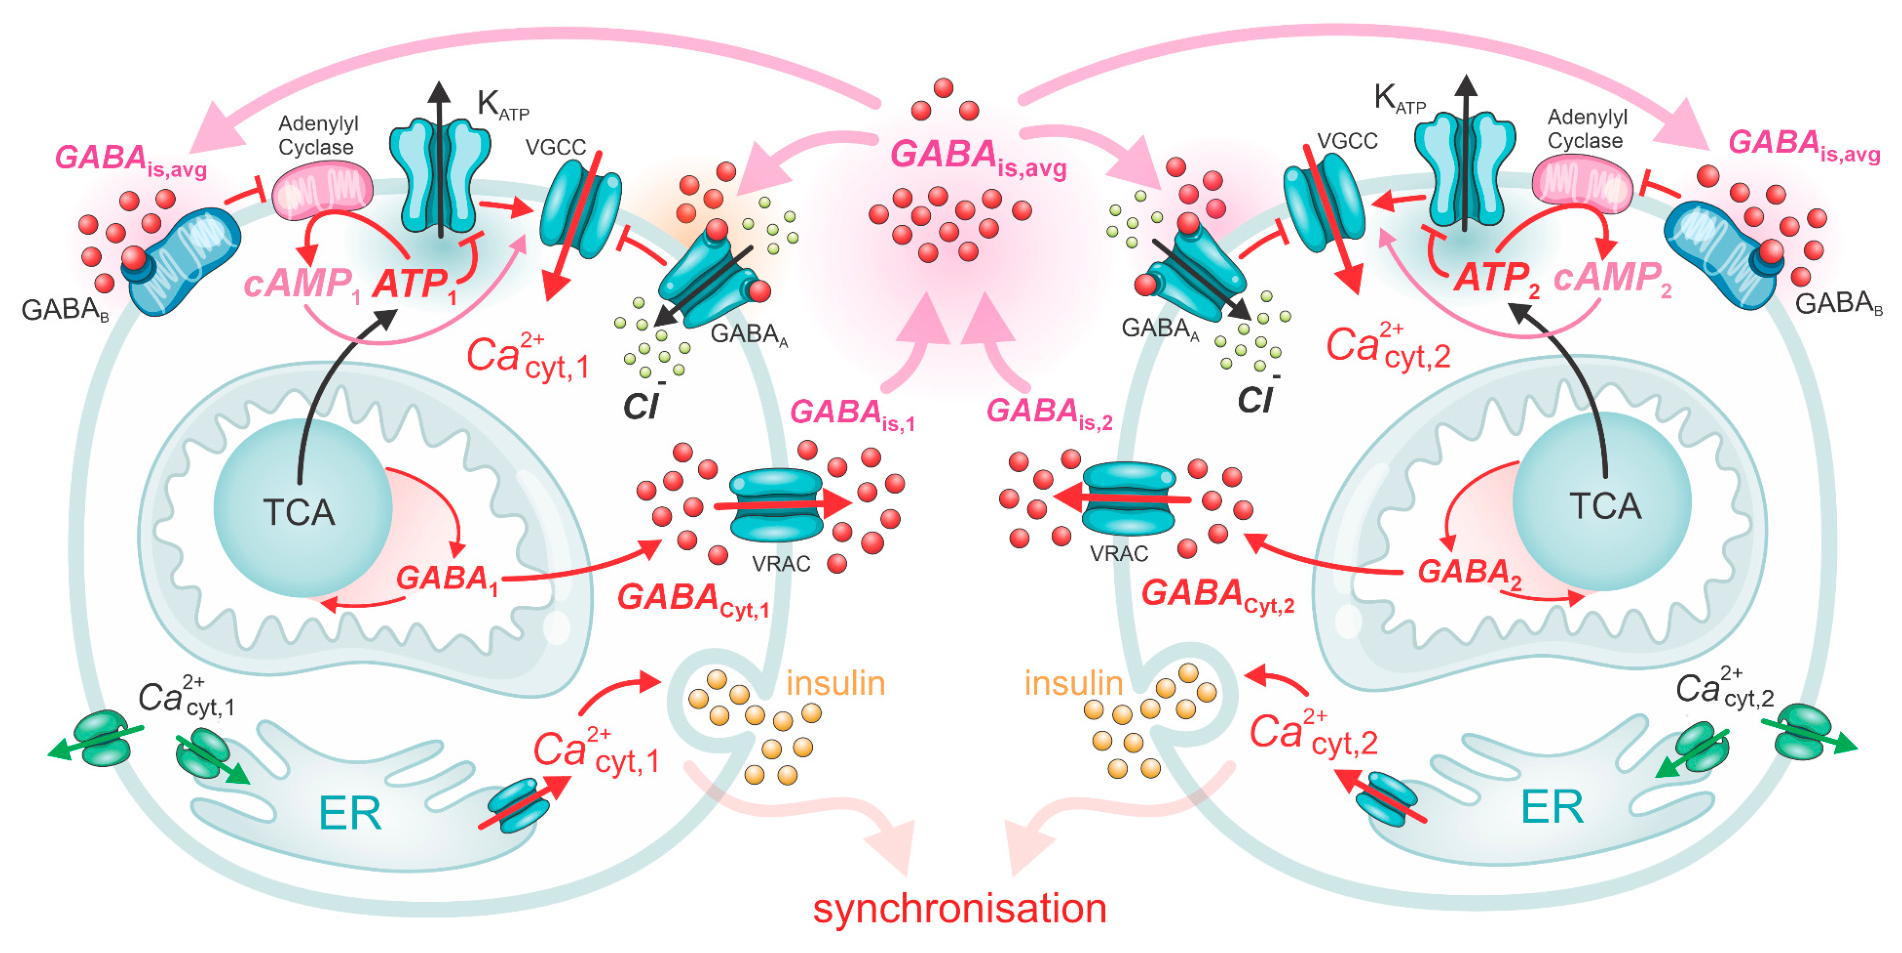
Figure 3.
Effect of GABA production on single-cell oscillatory dynamics. (A) Reference dynamics for , showing intracellular , interstitial , cytosolic calcium , and local ATP near channels. (B) Modified dynamics under reduced GABA production, . (C) Dependence of the average intracellular GABA concentration, , the minimum and maximum values of the calcium oscillations, and , and the oscillation frequency on .
Figure 3.
Effect of GABA production on single-cell oscillatory dynamics. (A) Reference dynamics for , showing intracellular , interstitial , cytosolic calcium , and local ATP near channels. (B) Modified dynamics under reduced GABA production, . (C) Dependence of the average intracellular GABA concentration, , the minimum and maximum values of the calcium oscillations, and , and the oscillation frequency on .
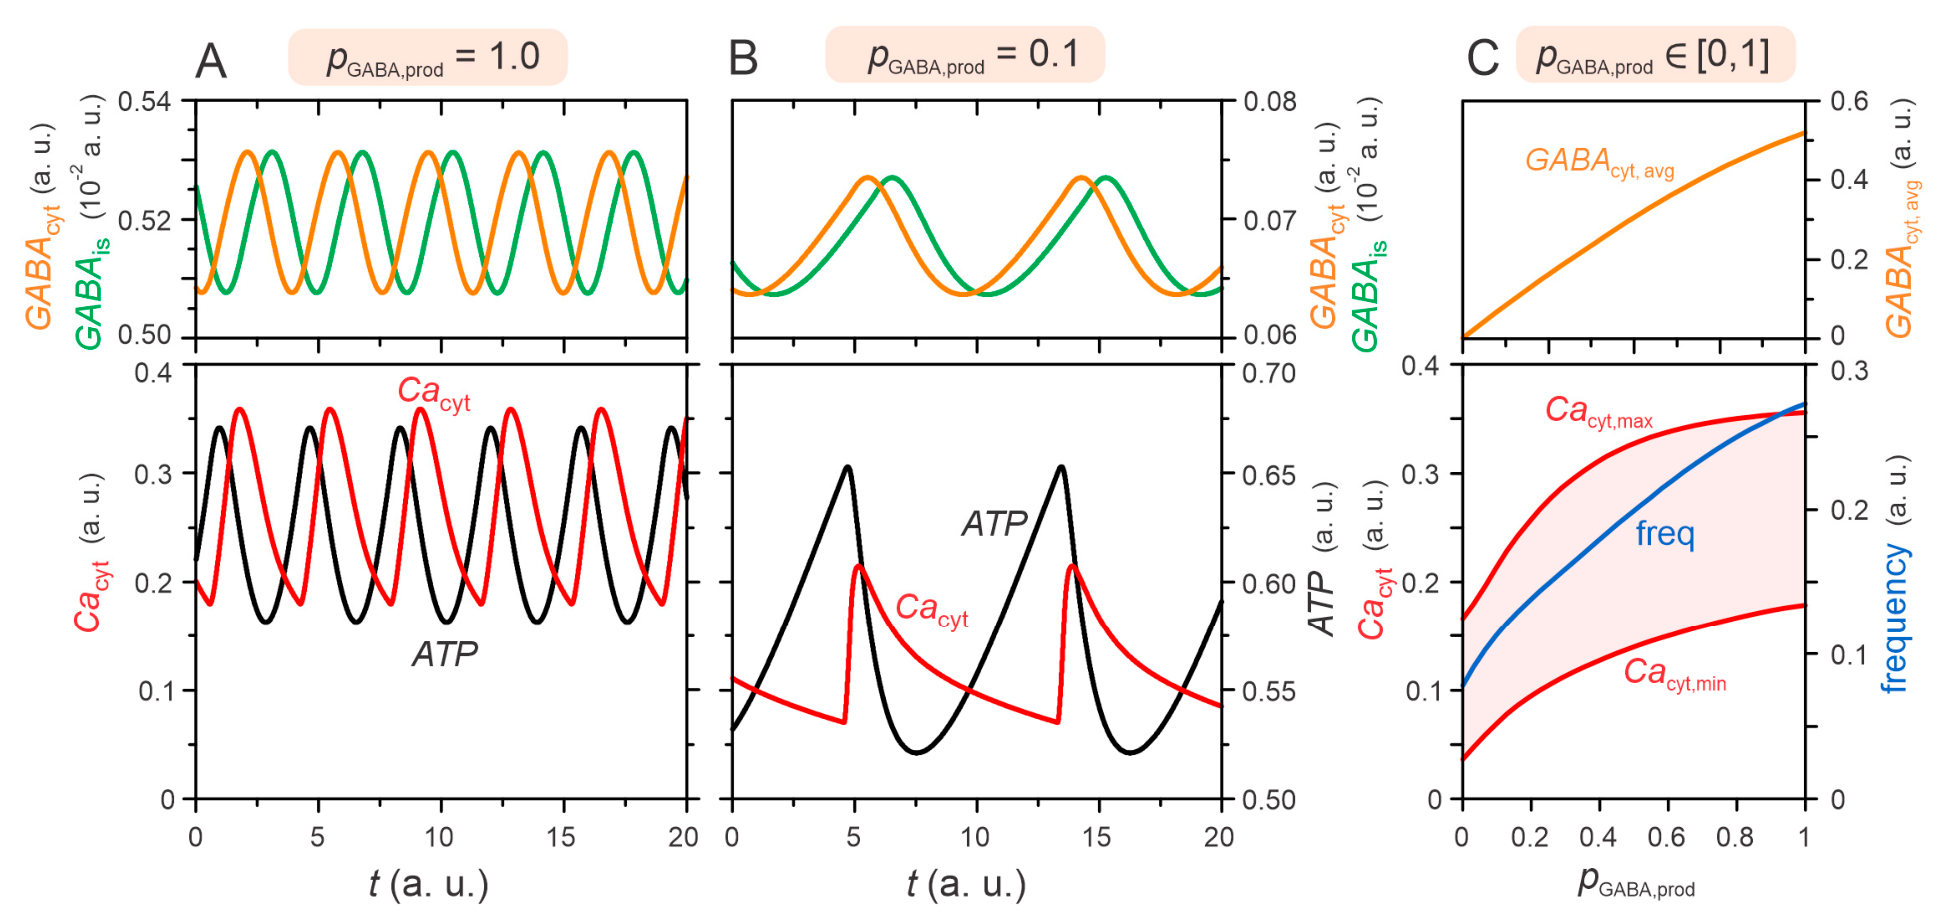
Figure 4.
Effect of GABA-dependent ATP production on Ca2+ oscillations. (A) Dependence of the minimum and maximum values of cytosolic Ca2+ oscillations, and , and oscillation frequency, , on the parameter , which quantifies the GABA-dependent contribution to ATP production through the PEP-related branch. (B) Dependence of , , and on the parameter , which determines the GABA-dependent contribution to ATP production through the TCA-related branch. Vertical dashed lines indicate the reference values of and used in the baseline model. Open circles mark the corresponding reference values of , , and at these parameter values.
Figure 4.
Effect of GABA-dependent ATP production on Ca2+ oscillations. (A) Dependence of the minimum and maximum values of cytosolic Ca2+ oscillations, and , and oscillation frequency, , on the parameter , which quantifies the GABA-dependent contribution to ATP production through the PEP-related branch. (B) Dependence of , , and on the parameter , which determines the GABA-dependent contribution to ATP production through the TCA-related branch. Vertical dashed lines indicate the reference values of and used in the baseline model. Open circles mark the corresponding reference values of , , and at these parameter values.
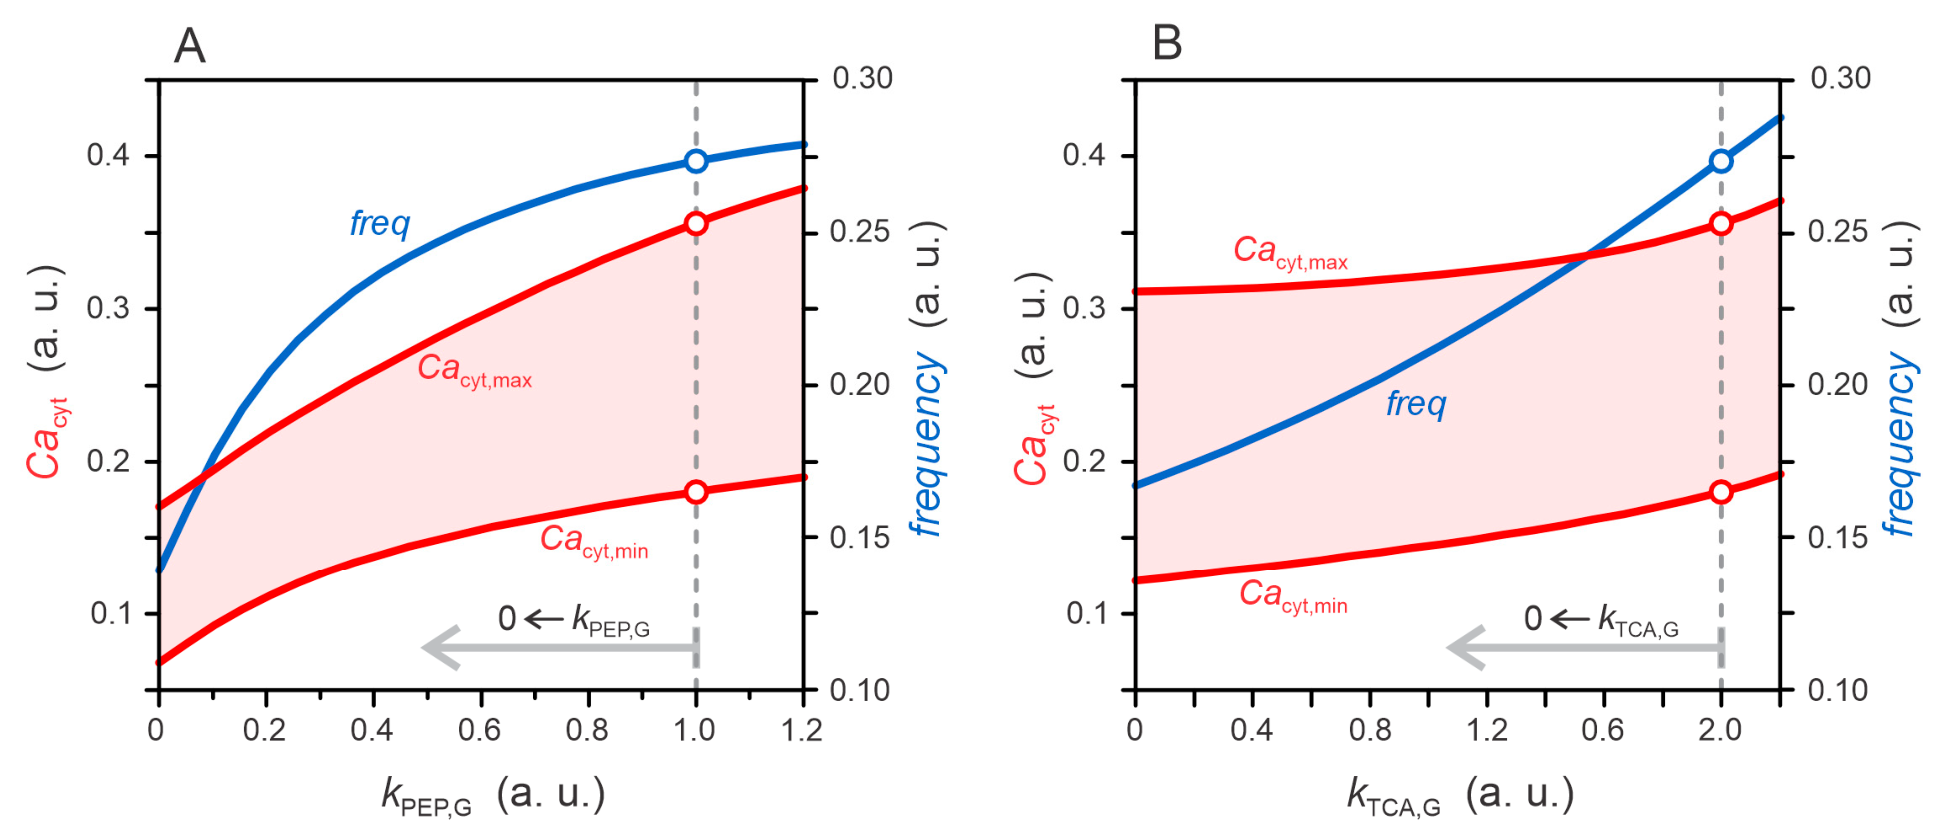
Figure 5.
Effect of GABA-dependent ATP production on the coupled dynamics of local ATP and cytosolic Ca2+. (A) Reference model dynamics. (B) Dynamics after blocking the GABA-dependent contribution to ATP production through the PEP-related branch (). (C) Dynamics after blocking the GABA-dependent contribution to ATP production within the TCA-related branch (). In the left panels, black curves show the local ATP concentration near channels, and red curves show cytosolic calcium, . The horizontal gray line indicates , the threshold ATP level required to activate Ca2+ influx in the model. Vertical dashed lines mark the time points at which ATP crosses ; the interval between two successive crossings corresponds to one oscillatory cycle. The right panels show enlarged views of the ATP transients in the vicinity of the threshold-crossing regions.
Figure 5.
Effect of GABA-dependent ATP production on the coupled dynamics of local ATP and cytosolic Ca2+. (A) Reference model dynamics. (B) Dynamics after blocking the GABA-dependent contribution to ATP production through the PEP-related branch (). (C) Dynamics after blocking the GABA-dependent contribution to ATP production within the TCA-related branch (). In the left panels, black curves show the local ATP concentration near channels, and red curves show cytosolic calcium, . The horizontal gray line indicates , the threshold ATP level required to activate Ca2+ influx in the model. Vertical dashed lines mark the time points at which ATP crosses ; the interval between two successive crossings corresponds to one oscillatory cycle. The right panels show enlarged views of the ATP transients in the vicinity of the threshold-crossing regions.
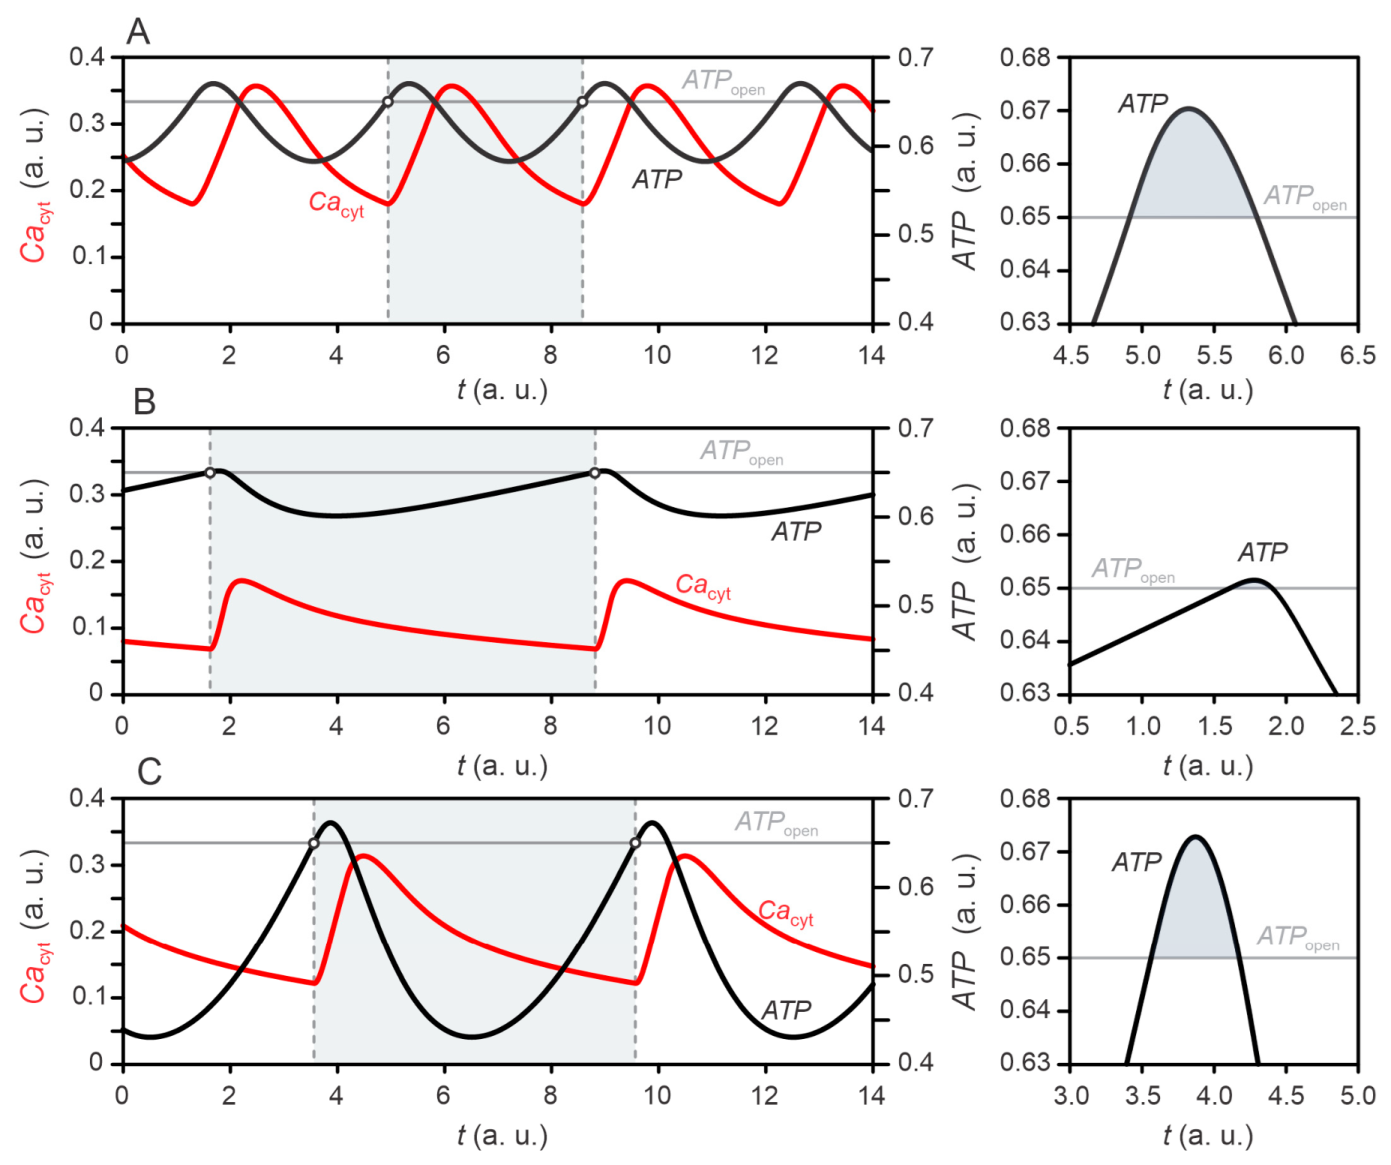
Figure 6.
Effect of interstitial GABA on cytosolic Ca2+ oscillations. (A) Time courses of cytosolic calcium, , shown for the reference interstitial GABA effect () and for complete blockade of this effect (). The shaded region highlights the gradual phase divergence between the two oscillatory signals, giving rise to a slow beating interval. (B) Dependence of the minimum and maximum values of the calcium oscillations, and , and the oscillation frequency, , on . The vertical dashed line indicates the reference value used in the baseline model. Open circles denote the corresponding reference values of , , and .
Figure 6.
Effect of interstitial GABA on cytosolic Ca2+ oscillations. (A) Time courses of cytosolic calcium, , shown for the reference interstitial GABA effect () and for complete blockade of this effect (). The shaded region highlights the gradual phase divergence between the two oscillatory signals, giving rise to a slow beating interval. (B) Dependence of the minimum and maximum values of the calcium oscillations, and , and the oscillation frequency, , on . The vertical dashed line indicates the reference value used in the baseline model. Open circles denote the corresponding reference values of , , and .
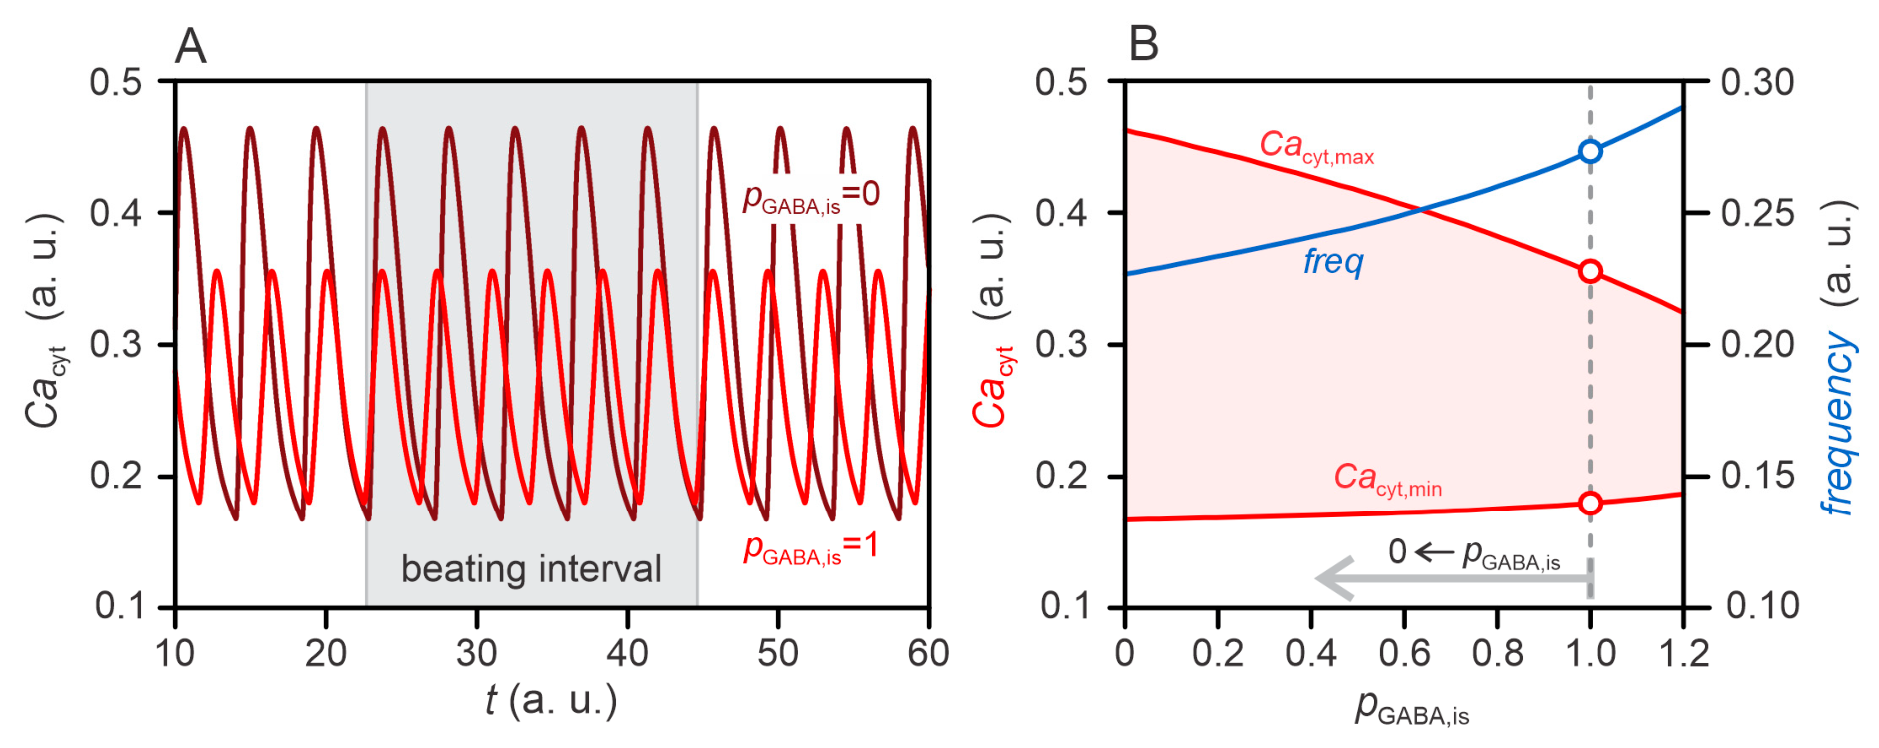
Figure 7.
GABA-mediated intercellular coupling entrains Ca2+ oscillations in two beta cells. (A) Early transient regime before full entrainment. The upper panel shows the interstitial GABA signals of the two cells, and , which are phase-shifted relative to each other. The lower panel shows the corresponding cytosolic Ca2+ signals, and , which are also clearly phase-shifted, indicating that the two cells are not yet synchronized. (B) Late regime after GABA-mediated entrainment. The two interstitial GABA signals overlap and form a common signal, . The corresponding Ca2+ signals also overlap, , indicating effective synchronization of the two cells. (C) Time evolution of the exponentially weighted moving Pearson correlation coefficient, , calculated between the two Ca2+ signals following Pozzi et al. [28]. The gray vertical bands mark the time intervals shown in panels A and B, while the arrows indicate their correspondence with the correlation trace. The green vertical line denotes the onset of GABA-mediated intercellular coupling, and the light green shaded region indicates the time interval after coupling is switched on.
Figure 7.
GABA-mediated intercellular coupling entrains Ca2+ oscillations in two beta cells. (A) Early transient regime before full entrainment. The upper panel shows the interstitial GABA signals of the two cells, and , which are phase-shifted relative to each other. The lower panel shows the corresponding cytosolic Ca2+ signals, and , which are also clearly phase-shifted, indicating that the two cells are not yet synchronized. (B) Late regime after GABA-mediated entrainment. The two interstitial GABA signals overlap and form a common signal, . The corresponding Ca2+ signals also overlap, , indicating effective synchronization of the two cells. (C) Time evolution of the exponentially weighted moving Pearson correlation coefficient, , calculated between the two Ca2+ signals following Pozzi et al. [28]. The gray vertical bands mark the time intervals shown in panels A and B, while the arrows indicate their correspondence with the correlation trace. The green vertical line denotes the onset of GABA-mediated intercellular coupling, and the light green shaded region indicates the time interval after coupling is switched on.
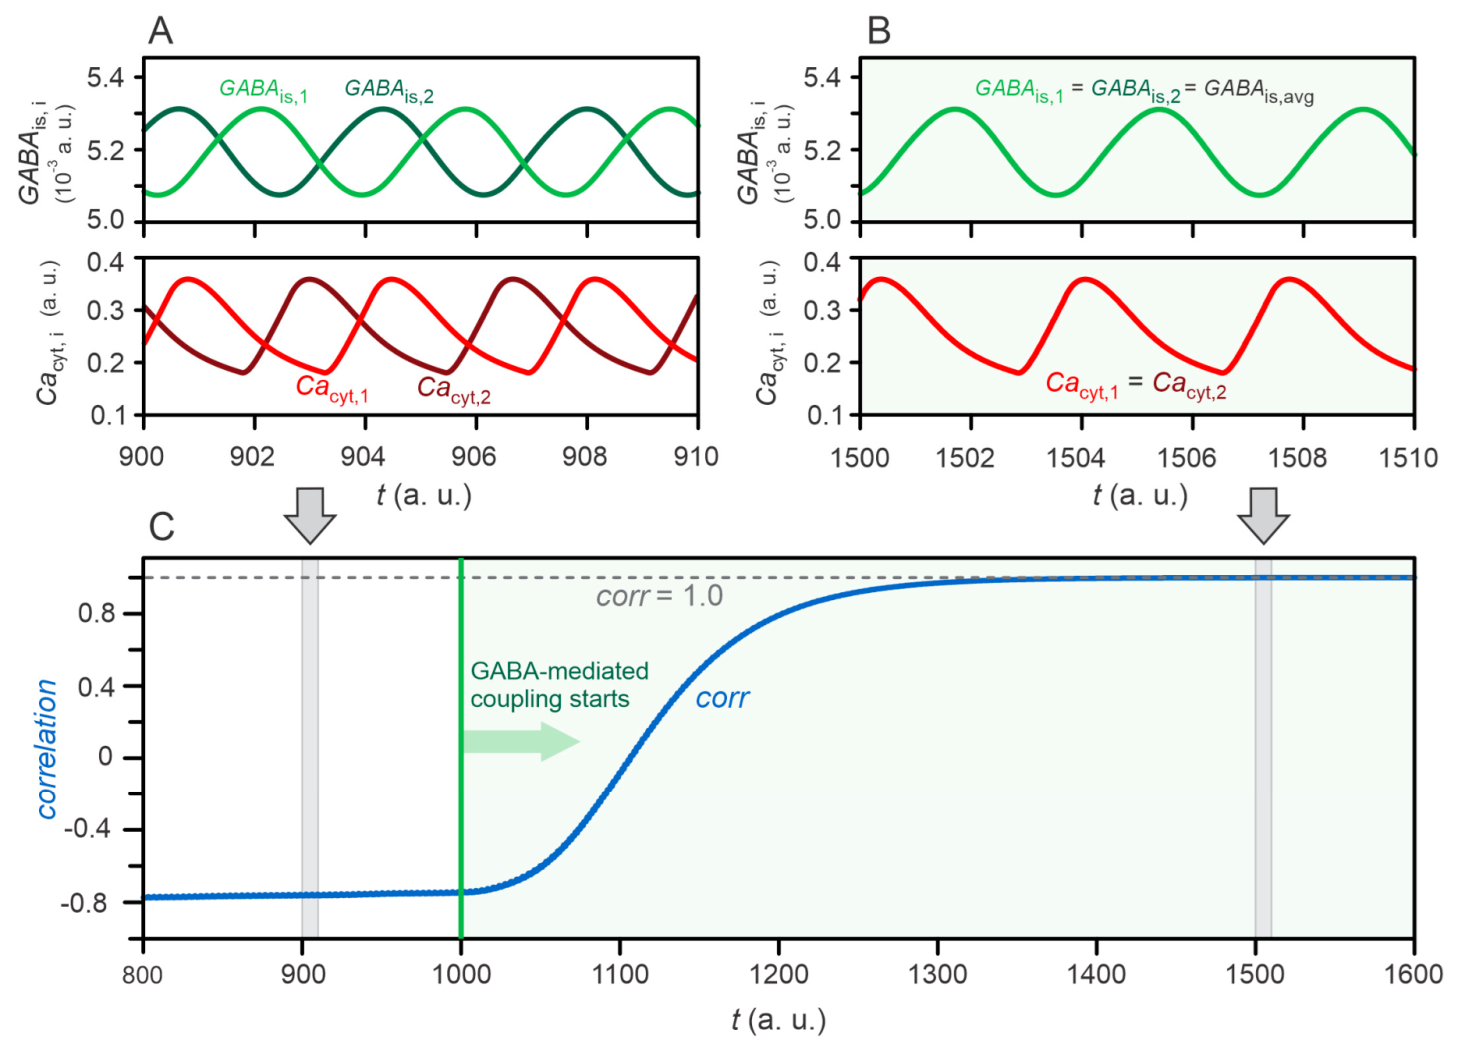

Table 1.
Representative synchronization ranges for selected model parameters in two non-identical beta cells. The ranges indicate how much the parameter value in the second cell can deviate from the reference value of the first cell while stable phase locking is still maintained, defined by a moving Pearson correlation coefficient . (A) Reference GABA-mediated coupling, , without electrical coupling, . (B) Increased interstitial GABA influence, , without electrical coupling, . (C) Increased interstitial GABA influence combined with weak effective electrical coupling, , .
Table 1.
Representative synchronization ranges for selected model parameters in two non-identical beta cells. The ranges indicate how much the parameter value in the second cell can deviate from the reference value of the first cell while stable phase locking is still maintained, defined by a moving Pearson correlation coefficient . (A) Reference GABA-mediated coupling, , without electrical coupling, . (B) Increased interstitial GABA influence, , without electrical coupling, . (C) Increased interstitial GABA influence combined with weak effective electrical coupling, , .
| Parameter | Eq. | Ref. val. | ||||||
| (19) | 1 | -3% | 4% | -9% | +78% | -16% | +78% | |
| (20) | 1 | -4% | 4% | -5% | +22% | -11% | +24% | |
| (8) | 500 | -9% | +9% | -16% | +22% | -36% | +88% | |
| (10) | 100 | -5% | +5% | -7% | +27% | -18% | +28% | |
| (13) | 1 | -10% | +105% | -44% | +24% | -48% | +50% | |
| (14) | 2 | -2% | +2% | -7% | +7% | -10% | +15% | |
| (15) | 1.5 | -1% | +1% | -5% | +3% | -7% | +5% | |
| (16) | 0.1 | -13% | +10% | -20% | +82% | -34% | +91% | |
| (10) | 0.65 | -2% | +2% | -3% | +3% | -6% | +6% | |
Disclaimer/Publisher’s Note: The statements, opinions and data contained in all publications are solely those of the individual author(s) and contributor(s) and not of MDPI and/or the editor(s). MDPI and/or the editor(s) disclaim responsibility for any injury to people or property resulting from any ideas, methods, instructions or products referred to in the content. |
© 2026 by the authors. Licensee MDPI, Basel, Switzerland. This article is an open access article distributed under the terms and conditions of the Creative Commons Attribution (CC BY) license (http://creativecommons.org/licenses/by/4.0/).
Copyright: This open access article is published under a Creative Commons CC BY 4.0 license, which permit the free download, distribution, and reuse, provided that the author and preprint are cited in any reuse.


