

Submitted:
05 June 2026
Posted:
08 June 2026
You are already at the latest version
Abstract
(1) Background: Network medicine has reshaped how systemic comorbidities are quantified, but the internal comorbidity structure of oral diseases remains undescribed at fine ICD-10 granularity. (2) Methods: We analyzed 2,863,671 outpatient visit records from 583,614 patients (2011–2025). Using ICD-10 four-character codes (75 disease nodes), comorbidity networks were built for five age strata via relative risk and Bonferroni-corrected Fisher’s exact tests; longitudinal sequences were mined for progression trajectories; and quasi-causal analyses (Cox regression, negative outcome controls, Baron–Kenny mediation) evaluated pathway directionality and specificity. (3) Results: The all-age network contained 75 nodes and 167 edges (modularity = 0.53) forming eight communities. Complexity peaked at 18–29 years and declined with age. Dental caries became the strongest hub in the 60+ group (degree = 9). Adjusted Cox regression confirmed directionality (pulpitis → tooth defect HR = 2.65; caries → pulpitis HR = 2.25), and negative outcome controls confirmed biological specificity. Mediation analysis showed pulpitis completely mediated the caries → tooth defect association (proportion mediated ≈ 100%, 95% CI 90%–128%). An oral mucosal immune cluster (burning mouth syndrome, lichen planus, candidiasis, xerostomia) emerged as a clinically actionable community. (4) Conclusions: Oral diseases form biologically coherent, age-evolving comorbidity communities, with pulpitis as the critical mediating intervention point in the caries-to-tooth-defect cascade, providing a reusable network-medicine substrate for age- and sex-specific risk-stratified disease management.
Keywords:
comorbidity network
; oral diseases
; network medicine
; age stratification
; disease progression
; electronic health records
1. Introduction
Comorbidity refers to the co-occurrence of two or more diseases in the same patient, either simultaneously or sequentially. Traditional comorbidity research tests association strength between diseases pairwise, but this approach fails to capture systemic interactions among multiple diseases. The introduction of network science has provided a novel perspective: Hidalgo et al. first constructed a large-scale human disease comorbidity network using the U.S. Medicare database, revealing systematic co-occurrence patterns that exceed random expectations [1]. Subsequently, multilayer comorbidity network approaches have been used to track the evolution of diseases across age [2,3]; electronic health record mining has become an important avenue for discovering disease associations [4]; and network medicine has emerged as a key paradigm for understanding complex inter-disease relationships [5,6]. Menche et al. demonstrated that disease-associated proteins cluster in localized neighborhoods within the interactome, with overlapping network modules predicting disease co-occurrence [6]; Zhou et al. constructed a human symptoms–disease network showing that phenotypic similarity can complement molecular evidence [7]. Dervic et al. recently released a large-scale comorbidity network dataset covering 8.9 million inpatients [8]. These studies demonstrate that network methods can reveal systematic inter-disease associations — disease clustering, hub disease identification, and progression pathway prediction — that traditional epidemiology cannot uncover.
However, existing oral-disease comorbidity research has focused almost exclusively on associations between oral and systemic diseases. Larvin et al. constructed a comorbidity network between periodontal disease and systemic diseases using UK Biobank data [9]; Alves-Costa et al. identified dental caries as a hub node in the chronic disease network [10]; Botelho et al. systematically reviewed the evidence linking oral health and systemic noncommunicable diseases [11]; and Beukers et al. and Limo et al. confirmed the multimorbidity of periodontal disease with systemic diseases from clinical and community perspectives [12,13]. A common feature of these studies is that the oral disease coding is extremely coarse — typically using only K02 (dental caries) and K05 (periodontal disease) as two three-character code nodes. This means that the internal comorbidity structure of oral diseases — for example, the complex associations among dental caries and pulp diseases, periodontal disease and tooth loss, and oral mucosal diseases — has never been systematically described. Moreover, computational approaches to oral disease in the bioengineering literature have so far operated predominantly at the image level — for example, deep-learning recognition of periodontitis, dental caries, and periapical lesions on dental radiographs [14,15] — rather than at the population level, leaving the intra-oral comorbidity structure itself uncharacterized.
Understanding this internal structure has substantial bioengineering and clinical value: oral diseases affected approximately 3.69 billion people worldwide in 2021 [16], with global costs exceeding US$ 540 billion [17]. Oral diseases have well-known clinical progression relationships — caries can progress to pulpitis, periapical periodontitis, and ultimately tooth loss — but this “common knowledge” lacks quantitative network evidence from large-scale population data. Furthermore, whether comorbidity patterns change significantly with age, and whether sex differences [18,19] are structurally reflected at the network level, remain without systematic data support. Translating intra-oral comorbidity structure into a computable, age-resolved network would also create a substrate on which downstream engineering applications — clinical decision-support, risk-prediction modelling, and screening-pathway optimization — can be built.
This study aimed to construct and characterize the first intra-oral comorbidity network at ICD-10 four-character granularity, using real-world outpatient data from 583,614 patients spanning 15 years (2011–2025) at a specialized dental hospital (75 disease nodes). Specifically, we sought to (i) delineate age-stratified community structures, (ii) test whether the clinically recognized caries–pulpitis–tooth defect progression chain can be quantitatively supported by temporal and quasi-causal evidence, and (iii) examine sex-specific network differences.
2. Materials and Methods
2.1. Study Design and Data Source
This study comprised two parallel analyses: (i) cross-sectional comorbidity networks were constructed within each age stratum to characterize disease co-occurrence structures; and (ii) disease progression trajectories were mined along patient longitudinal visit sequences. Data were obtained from the Hospital Information System (HIS) of a specialized dental hospital in China, spanning January 2011 to March 2025. Patients aged 0–100 years with valid sex coding (1 = male, 2 = female) were included. Data quality control involved (i) deduplication of same-patient, same-date, same-department, same-diagnosis records; (ii) exclusion of clinically implausible diagnoses (e.g., periodontitis K05.6 in patients aged 0–5 years); and (iii) exclusion of records with extreme visit frequencies (>100 visits per year). The final cohort comprised 583,614 patients with 2,863,671 outpatient visit records; 57.0% were female, the median age was 29 years, and 17 clinical departments were involved. Reporting followed the STROBE guideline [20].
2.2. ICD-10 Code Processing and Age Stratification
Original diagnostic codes were standardized to ICD-10 four-character codes (e.g., K07.101 → K07.1). The inclusion scope comprised the entire oral disease chapter K00–K14 as well as oral-related codes including S02.5 (tooth fracture), S03.2 (tooth luxation), T81.0 (post-extraction hemorrhage), C00–C06 (oral malignant neoplasms), B37.0 (oral candidiasis), G90.6 (burning mouth syndrome), and L43.9 (lichen planus). A frequency threshold of ≥100 visits was applied, yielding 75 four-character code disease nodes. The complete code list is provided in Table S1.
Based on the clinical characteristics of oral diseases, five unequal-width age strata were used (Table 1): L1 (0–17 years, 124,950 patients; deciduous caries, mixed dentition, early orthodontics), L2 (18–29 years, 187,338 patients; peak orthodontics, third molars, gingivitis), L3 (30–44 years, 172,531 patients; early periodontitis, pulp disease), L4 (45–59 years, 81,960 patients; periodontal progression, onset of tooth loss), and L5 (60+ years, 56,637 patients; tooth loss, prosthetic needs). The same patient could be assigned to different age strata at different visit ages; patients crossing age strata accounted for 6.8%.
2.3. Comorbidity Network Construction
Following the operational definition used in large-scale comorbidity network studies [1,2], a comorbidity pair was defined when a patient received diagnoses of two different diseases across any visits within the same age stratum, regardless of whether these visits occurred on the same day or on different days. This definition captures sequential co-occurrence (diseases diagnosed at different time points) rather than strictly concurrent comorbidity; as in prior EHR-based comorbidity studies, disease resolution cannot be reliably determined from administrative data, and the two definitions converge for chronic conditions. Because each visit recorded only one ICD-10 code (a system constraint of the hospital information system), co-occurrence necessarily required at least two separate visits. For each disease pair, a 2 × 2 contingency table was constructed and the relative risk (RR) was calculated:
Because the measure is computed within age strata from cross-sectional prevalence data rather than incidence rates in a prospective cohort, it is technically a prevalence ratio (PR); we retain the term RR for consistency with the comorbidity network literature. Fisher’s exact test assessed significance, with Bonferroni correction for multiple comparisons [21]. Edge inclusion criteria were RR > 1.5 [1,2,21] (validated across 1.2–3.0 in sensitivity analysis S2), corrected p < 0.05, all contingency-table cells ≥ 5 patients, and co-occurring patient count ≥ 10. Edge weights were defined as log2(RR). Six undirected weighted comorbidity networks were constructed for the five age strata and the all-age cohort.
2.4. Network Topology and Centrality Analysis
Global topological metrics included number of nodes, number of edges, density, average degree, clustering coefficient, average path length, modularity, and assortativity [22]. Node-level metrics included degree (reported as raw edge counts), weighted degree, betweenness centrality, PageRank, closeness centrality, and eigenvector centrality. Centrality metrics of ten major oral diseases were tracked across age strata and plotted as age-evolution curves. Three inter-layer network similarity metrics quantified structural similarity between age strata (details in Supplementary Methods SM1).
2.5. Community Detection and Disease Progression Trajectory Mining
The Louvain algorithm [23] was used to identify comorbidity communities with a fixed random seed (seed = 42) to ensure reproducibility [24]. Community detection was run separately for each age stratum, and the age stability of community composition was analyzed.
For each patient, all diseases were ordered by first diagnosis date to construct patient-level longitudinal sequences. Frequent sequence mining was performed to extract 2-sequences and 3-sequences (support ≥ 50 patients, minimum interval ≥ 30 days). The denominator for support percentage was the total number of patients with ≥ 2 different diagnoses (N = 370,192; 63.4% of all patients). A directed progression network was constructed based on frequency direction ratios. Bifurcation path analysis was performed for five hub diseases (K02.9 dental caries, K04.0 pulpitis, K04.4 apical periodontitis, K05.6 periodontitis, K08.1 partial edentulism), and convergence source analysis was performed for three terminal diseases (K08.1 partial edentulism, K08.3 retained root, K07.1 malocclusion).
To evaluate temporal consistency of the key progression pathway (caries → pulpitis → tooth defect), three analyses were performed. First, the temporal precedence ratio (TPR) was computed for each disease pair. For a disease pair (A, B), TPR was defined as the proportion of co-occurring patients in whom A was first diagnosed ≥ 30 days before B:
Patients with concurrent diagnoses (<30 days apart) were excluded from the denominator. A TPR significantly > 0.5 (two-sided binomial test) indicates temporal directionality. Second, temporal cumulative incidence was estimated by Kaplan–Meier methods (lifelines 0.30.0) at 3, 6, 12, 24, and 60 months after the first diagnosis of disease A; patients who did not develop disease B were censored at their last recorded visit, with 95% confidence intervals obtained from the Greenwood formula. Because non-informative censoring is assumed, these estimates should be interpreted with caution. Third, for patients with all three diagnoses (caries, pulpitis, tooth defect), the empirical distribution of the six possible temporal orderings was compared against the null expectation of 16.7% per ordering.
2.6. Quasi-Causal Inference Analyses
To move beyond temporal precedence toward causal inference, three primary analyses were performed, with three additional sensitivity analyses in the Supplementary Materials. Cox proportional hazards regression assessed each pathway pair, with disease A as the exposure and time-to-disease-B as the outcome, adjusting for baseline age, sex, and log-transformed total visit count (proxy for healthcare utilization); hazard ratios (HR) with 95% confidence intervals were reported. Negative outcome controls evaluated biological specificity: the ability of dental caries to predict diseases outside the caries–pulpitis–periapical chain was assessed in the same Cox framework, with oral candidiasis (B37.0) and lichen planus (L43.9) as negative outcomes; a pathway-specific signal should show HR > 1 for pathway outcomes and HR ≤ 1 for unrelated outcomes. Baron–Kenny mediation analysis [25] with logistic regression was performed on the three-step pathway caries → pulpitis → tooth defect to quantify the proportion of the caries → tooth defect association mediated through pulpitis, adjusting for age, sex, and visit count; 95% confidence intervals for the proportion mediated were obtained from 500 bootstrap resamples. Because this analysis used cross-sectional binary indicators (ever-diagnosed), the results quantify statistical mediation and should be interpreted as supportive rather than definitive causal evidence. Three additional quasi-causal analyses are reported in Supplementary Results S9: inter-diagnosis gap stratification (minimum gap 30–730 days), visit frequency stratification (Berkson’s bias assessment), and constraint-based causal discovery using the Peter–Clark algorithm(PC) and Fast Causal Inference(FCI) algorithms [26] with IDA-based causal effect estimation [27].
2.7. Sex-Stratified Comparison and Sensitivity Analysis
All-age comorbidity networks were constructed separately for males and females, comparing topology, centrality rankings, community structures, and sex-specific edges. The robustness of conclusions was systematically tested across eight dimensions: (1) ICD granularity (3- vs. 4-character codes); (2) RR threshold (1.2/1.5/2.0/3.0); (3) age grouping (5 unequal-width strata vs. 8 equal-width 10-year strata); (4) co-occurrence measure (RR vs. Phi coefficient); (5) community algorithm (Louvain vs. Greedy Modularity vs. Label Propagation); (6) time window (30/90/180 days); (7) single-diagnosis bias estimation; and (8) temporal stability (network topology across three 5-year periods). All analyses were performed in Python 3.9.6 with NetworkX 3.2.1, SciPy 1.13.1, lifelines 0.30.0, statsmodels 0.14.6, and matplotlib 3.9.4. Additional software for supplementary analyses (causal-learn 0.1.4, scikit-learn 1.6.1) is documented in Supplementary Methods SM3.
3. Results
3.1. Network Overview and Age-Stratified Topology
The all-age comorbidity network comprised 75 nodes and 167 edges, with density 0.060, average degree 4.45, clustering coefficient 0.414, average path length 3.06, and modularity 0.53 (Figure 1). Patient-level bootstrap resampling (200 iterations) yielded narrow 95% confidence intervals for all metrics (edges [163, 183]; modularity [0.49, 0.57]; see Table 2 footnote), confirming the stability of the observed network structure. Topological metrics of each age-stratum network showed distinct age-dependent changes (Table 2; bar-chart comparisons in Figure S1).
Node counts include all disease codes meeting the frequency threshold (≥ 100 visits) in each age stratum, including isolated nodes without significant comorbidity edges. The all-age network contained 69 connected nodes and 6 isolated nodes (G50.0, K05.0, K07.0, K11.2, K11.5, S01.5). Bootstrap 95% CIs were obtained by resampling patients with replacement (200 iterations); in each iteration, the entire network was reconstructed. All-age network: edges 167 [163,183]; density 0.060 [0.059, 0.066]; avg. degree 4.45 [4.35, 4.88]; clustering coeff. 0.414 [0.356, 0.449]; avg. path length 3.06 [2.91, 3.25]; modularity 0.53 [0.49, 0.57]. Per-layer bootstrap CIs are provided in Table S2.
Network complexity (number of edges) peaked in the 18–29 group (86 edges), was similar in 30–44 (83 edges), and declined with age to 60 edges in the 60+ group. Modularity was highest in 0–17 (0.73), indicating that childhood comorbidities were the most modular with the clearest boundaries. Average path length reached its maximum in L1 (4.48) and minimum in L5 (3.27), indicating that the elderly network — although sparser — has a more compact core. Inter-layer similarity analysis confirmed that the L4–L5 transition was the most stable (DeltaCon similarity 0.261), while L1–L2 was the most dramatic (DeltaCon similarity 0.187) (Table S3, Figure S6).
3.2. Hub Diseases and Centrality Evolution
The centrality metrics of major oral diseases exhibited characteristic evolution curves across age strata (Figure 2).
The degree centrality of dental caries (K02.9) remained low (2–3) from L1 to L3, surged to 7 in L4, and peaked at 9 in L5 (the highest in the entire network); PageRank peaked in L5 (0.054, Table S2), confirming that dental caries is the strongest comorbidity hub aged 60+. Apical periodontitis (K04.4) peaked at L1–L2 (7–8) and then declined, suggesting that young adulthood is the stage of most complex periapical comorbidity. Malocclusion (K07.1) dropped from 7 in L2 to 1 in L4 and 0 in L5, reflecting that orthodontic-related comorbidities are strictly confined to younger populations. Periodontitis (K05.6) maintained degree = 5 in both L2 and L5, exhibiting sustained hub status across age groups — consistent with the 2018 periodontitis staging framework that recognizes periodontitis as a chronic condition requiring lifelong management [28]. In the all-age network, the nodes with the highest degree centrality were recurrent aphthous ulcer (K12.1, degree = 19) and oral mass (K13.7, degree = 16), while gingivitis (K05.1) had the highest betweenness centrality (0.238), serving as a bridge connector between communities.
3.3. Disease Community Structure and Age Stability
The Louvain algorithm partitioned the all-age network into eight comorbidity communities (Table S4, Figure S2): a restorative/defect cluster (18 members; the largest, spanning pulpitis through partial edentulism), a developmental/caries cluster (11 members), a cyst/mass cluster (9 members), an extraction/surgical cluster (8 members), an oral mucosal immune cluster (8 members; burning mouth syndrome [global prevalence ≈ 1.7% [29]], lichen planus, candidiasis, xerostomia), a periodontal cluster (7 members), an oral neoplasm cluster (6 members), and a parotid cluster (2 members). Community stability analysis (Figure S3) showed that the periodontal cluster was the most stable across all age strata (normalized mutual information (NMI) between adjacent strata: range 0.72–0.89), while dental caries (K02.9) had the most unstable community assignment — shifting from an independent caries community in L1 to the restorative/defect community in L4–L5 (NMI 0.41–0.58) — reflecting a fundamental shift in the comorbidity pattern of caries with age.
3.4. Disease Progression Trajectories
Frequent sequence mining identified 627 two-step sequences and 20 three-step sequences with support ≥ 50. Table 3 lists the five most frequent two-step sequences alongside negative controls.
The full top-10 list is provided in Table S5. Classic textbook pathways were quantitatively characterized: caries → pulpitis → tooth defect was observed in 1846 patients (0.50%); caries → apical periodontitis → tooth defect in 1297 (0.35%); and the periodontitis → partial edentulism degradation chain in 10,357 (2.80%). Bifurcation path analysis (Figure S4) showed that after pulpitis (K04.0), 29.9% of patients progressed to tooth defect (restoration), 16.2% to dental caries (new caries), and 11.5% to apical periodontitis (worsening). After dental caries (K02.9), 14.1% progressed to tooth defect, 12.8% to pulpitis, and 10.9% to apical periodontitis. Convergence source analysis demonstrated that partial edentulism (K08.1) receives upstream flows from at least five distinct pathways — periodontitis (7.9%), tooth defect (6.2%), retained root (5.9%), apical periodontitis (4.8%), and dental caries (4.6%) — highlighting that tooth-loss prevention must simultaneously address multiple upstream conditions.
Temporal consistency analysis provided further evidence for directionality (Table 4). Pulpitis → tooth defect exhibited the strongest temporal directionality (TPR = 0.771, p < 0.001); apical periodontitis → tooth defect was also strongly directional (TPR = 0.680, p < 0.001). For caries → pulpitis, the overall TPR was 0.540 (p < 0.001), only marginally above random, reflecting a clinical scenario in which patients present with symptomatic pulpitis before a separate caries code is recorded; however, in the pediatric stratum (0–17 years), the TPR rose to 0.631 (p < 0.001). Negative control pairs showed reversed or near-random temporal directionality (Temporomandibular joint(TMJ) disorder → pulpitis, TPR = 0.369; malocclusion → pulpitis, TPR = 0.459), confirming pathway specificity. The full temporal precedence analysis is provided in Table S6.
Patients with concurrent diagnoses (<30 days apart) were excluded from the TPR denominator. Median gap was computed among forward cases only.
Kaplan–Meier temporal cumulative incidence analysis showed monotonically increasing cumulative incidence for all pathway pairs. The cumulative incidence of tooth defect following pulpitis was 32.9% (95% CI 32.5–33.3%) at 3 months and 57.2% (56.6–57.8%) at 5 years, while the negative control pair (TMJ disorder → pulpitis) showed minimal incidence (1.2% at 3 months, 13.2% at 5 years). Among 2240 patients with all three diagnoses, the ordering caries → pulpitis → tooth defect was the most frequent (951 patients, 42.5%), 2.5-fold enriched over the null expectation of 16.7% (χ² test, p < 0.001).
Analysis of inter-diagnosis gap distributions revealed that the proportion of same-day co-diagnoses was low for pathway pairs (caries–pulpitis: 1.6%; pulpitis–tooth defect: 3.3%), and the majority of co-occurring patients had gaps exceeding 30 days, reducing concern that the single-code-per-visit constraint artificially generated the observed temporal patterns (Table S7).
3.5. Quasi-Causal Inference Analyses
Three quasi-causal analyses supported the directionality and specificity of key progression pathways (Table 5).
Cox regression. After adjusting for age, sex, and total visit count (proxy for healthcare utilization), HRs remained large and significant for all pathway pairs, while negative exposure controls yielded HR < 1 (TMJ → pulpitis: HR = 0.399; malocclusion → pulpitis: HR = 0.162), indicating that the associations are not driven by healthcare utilization confounding.
Negative outcome controls. Caries predicted pathway outcomes (HR > 1) but did not predict clinically unrelated diseases (oral candidiasis: HR = 0.145; lichen planus: HR = 0.409; both HR well below 1.0), confirming biological specificity.
Mediation analysis. Baron–Kenny analysis revealed that pulpitis completely mediated the caries → tooth defect association: total effect modest (OR = 1.082, p < 0.001), direct effect null (OR = 0.996, p = 0.60), mediator effect through pulpitis strong (OR = 2.282, p < 0.001). The proportion mediated was approximately 100% (point estimate 105%, 95% CI 90%–128%), consistent with complete mediation. The proportion mediated through periapical periodontitis was 12.2%.
Three additional quasi-causal sensitivity analyses — gap-stratified TPR, visit frequency stratification, and PC/FCI causal discovery with IDA estimation — are reported in Supplementary Results S9 and yielded consistent results. Notably, the PC algorithm reversed the topological order of caries and pulpitis, demonstrating that constraint-based Directed acyclic graph(DAG) learning on cross-sectional binary data identifies statistical conditioning structure rather than temporal causation, and confirming that temporal information is necessary for disease progression inference (Figure 3).
3.6. Sex Differences
The all-age comorbidity networks for males and females showed significant topological differences (Figure 4, Figure S7). The male network had 126 edges with 27 male-specific edges; the female network had 132 edges with 33 female-specific edges and stronger local clustering (clustering coefficient 0.342 vs. 0.290). Sex-specific comorbidity associations had clear clinical implications (Table 6).
Male-specific edges predominantly involved oral neoplasms and precancerous lesions, reflecting clustering driven by male risk factors such as smoking and alcohol [30], while female-specific edges predominantly involved xerostomia and immune-mediated mucosal diseases, possibly related to the female predominance of Sjögren’s syndrome (female-to-male ratio 9–10:1) [31,32].
3.7. Sensitivity Analysis
The eight-dimensional sensitivity analysis systematically tested the robustness of the main findings (Table 7).
When the RR threshold varied from 1.2 to 3.0, the number of edges decreased from 191 to 106, but hub node rankings remained stable. The three community detection algorithms produced highly consistent results. The single-diagnosis bias analysis (S7) confirmed that only 7 edges survived when co-occurrence was restricted to strict same-day encounters — compared with 167 in the main network — demonstrating that the cross-visit design captures a substantially broader comorbidity structure. The temporal stability analysis (S8) found 21 edges stable across all three periods, including pathologically fundamental associations such as periapical periodontitis ↔ periapical abscess and recurrent aphthous ulcer ↔ lichen planus. Detailed sensitivity panels are provided in Figure S5.
4. Discussion
4.1. Major Findings and Network-Medicine Implications
This study constructed a comprehensive comorbidity network within oral diseases based on ICD-10 four-character codes, addressing the gap in the literature where intra-oral comorbidity relationships have not been systematically described at this granularity. Unlike Larvin et al. [9] and Alves-Costa et al. [10], who focused on oral–systemic comorbidities, this study revealed the rich internal structure of the oral disease spectrum using 75 four-character code nodes. The eight communities in the all-age network included both clinically expected clusters — such as the periodontal cluster (K05.x) and the restorative/defect cluster (K04 → K07.3 → K08) — and findings beyond expectations: the oral mucosal immune cluster formed a separate community independent of the oral neoplasm cluster. This cluster — comprising burning mouth syndrome (G90.6), lichen planus (L43.9), oral candidiasis (B37.0), and xerostomia (K11.7) — suggests that these immune-mediated and dryness-related mucosal diseases may share pathogenic mechanisms, possibly related to salivary hypofunction or autoimmune dysregulation. This interpretation is supported by evidence that Oral lichen planus(OLP) is associated with autoimmune thyroid disease and diabetes [33] and with multiple systemic conditions and medications [34], and by multi-center data showing that Chinese OLP patients frequently present with comorbid mucosal complaints [35]. Clinically, this finding supports a combined screening approach: when a patient presents with one of these conditions (e.g., lichen planus), clinicians should actively assess for the others (xerostomia, candidiasis), particularly in middle-aged and elderly women where these conditions cluster most strongly.
Methodologically, this study shares the multilayer age-stratified framework of Dervic et al. [2], but differs in two key respects: (i) it operates at the subspecialty level (75 four-character codes within oral diseases) rather than the cross-specialty level (ICD chapters or three-character codes), and (ii) it uses outpatient data from a specialized dental hospital rather than inpatient data from a general hospital, capturing earlier disease stages and ambulatory care patterns that are invisible in hospitalization-based comorbidity networks. From a network-medicine perspective, these findings resonate with the observation by Menche et al. [6] that diseases with overlapping molecular neighborhoods tend to co-occur. While our study operates at the phenotypic rather than the molecular level, the formation of clinically coherent disease communities suggests that shared pathobiological mechanisms drive comorbidity clustering even within a single clinical specialty. From a bioengineering perspective, the age-resolved network is itself a reusable computational substrate on which predictive analytics and decision-support tools can be built.
4.2. Clinical Implications of Age-Evolution Patterns
Network complexity peaked in 18–29 because multiple diseases — orthodontics, third molars, caries, initial periodontitis — intersect during this period. The high visit frequency of orthodontic patients (monthly recalls over 2–3 years) may also contribute to L2 complexity by increasing opportunities for co-diagnosis; malocclusion (K07.1) had degree = 7 in L2, although this reflects genuine clinical co-management rather than a pure artifact. The degree centrality of dental caries (K02.9) reached 9 in the 60+ group (highest in the network), quantitatively confirming the clinically recognized comorbidity burden of caries in the elderly — caries in older adults is not merely an isolated condition but forms a complex comorbidity network with periodontal disease, prosthetic needs, tooth loss, and other conditions. Our network analysis adds a structural dimension to evidence on the oral disease burden in older adults [36,37]: dental caries as the highest-degree hub connects periodontal disease, tooth loss, and prosthetic needs into a tightly coupled module, suggesting that interventions targeting caries in elderly patients could have cascading benefits across the comorbidity cluster. Periodontitis maintained a degree of 5 across young adulthood and old age, exhibiting sustained hub status consistent with its chronic progressive nature [28,38], while malocclusion completely detached from the network after age 45, indicating a strict age window for orthodontic-related comorbidities. These findings translate into specific clinical recommendations. For elderly patients (60+), each dental visit should include concurrent caries and periodontal screening; early caries intervention in this group may yield cascading benefits across the comorbidity cluster. For young adults (18–29), clinicians should be alert to periapical complications during orthodontic treatment, given the peak comorbidity complexity in this age group.
4.3. Quasi-Causal Evidence for Progression Pathways
The quasi-causal analyses strengthened the observational findings beyond simple temporal precedence.
First, Cox regression adjusting for age, sex, and healthcare utilization confirmed that the associations are not confounded by differential healthcare-seeking behavior. After adjustment, pathway pairs retained large hazard ratios (pulpitis → tooth defect HR = 2.65; caries → pulpitis HR = 2.25), while negative controls showed no positive association (HR < 1). Notably, the direct association between caries and tooth defect was weak (RR = 1.13; Cox HR = 1.04), which is precisely why the mediation analysis proved informative: the caries → tooth defect path operates almost entirely through pulpitis rather than as a direct relationship. Furthermore, negative outcome controls demonstrated that caries predicts pathway diseases but not clinically unrelated diseases (oral candidiasis HR = 0.15; lichen planus HR = 0.41), confirming biological specificity rather than a generic healthcare utilization effect. Additional robustness checks — visit frequency stratification (Table S9) and gap-stratified TPR (Table S8) — further supported these findings.
Second, the mediation analysis revealed that pulpitis completely mediates the caries → tooth defect association (proportion mediated ≈ 100%, 95% CI 90%–128%), with no residual direct effect (OR = 0.996, p = 0.60). This quantitative demonstration that caries does not independently lead to tooth defect — but acts through pulpitis — provides large-scale population-level support for the clinical consensus that timely pulpitis management is critical for preventing tooth structure loss. From a clinical perspective, this means that the window between caries progression to pulp involvement and subsequent structural damage represents the most effective intervention point: early endodontic treatment or vital pulp therapy at this stage may prevent the downstream cascade toward tooth defect and eventual tooth loss.
Third, constraint-based causal discovery (PC algorithm, Figure 3) provided an informative methodological comparison: while IDA-based effect estimates were consistent with the Cox results, the algorithm reversed the direction of several clinically established pathways, placing caries and pulpitis as terminal “sinks.” This demonstrates that DAG learning on cross-sectional binary prevalence data identifies statistical conditioning structure rather than temporal causation [39], showing why temporal methods are essential for disease progression inference from EHR data.
Although these analyses do not constitute formal causal proof, the consistent results across confounding adjustment, specificity testing, mediation decomposition, and additional sensitivity analyses (Supplementary Results S9) provide stronger support for disease progression directionality than temporal precedence alone.
4.4. Sex Differences
Male and female comorbidity networks exhibited structural differences reflecting known epidemiological patterns: male-specific edges involved oral neoplasm co-occurrence driven by smoking and alcohol risk factors [30], while female-specific edges involved xerostomia and immune-mediated mucosal diseases related to the female predominance of Sjögren’s syndrome [31]. The department transfer network further corroborated disease progression patterns: the Department of Operative Dentistry and Endodontics was the largest source and the Department of Oral and Maxillofacial Surgery the largest sink (Supplementary Results S9.4).
4.5. Limitations
Several limitations should be noted. First, data were from a single tertiary dental hospital with outpatient records only and one ICD code per visit, which may overestimate comorbidity strength (referral bias, a form of Berkson’s bias) while underestimating concurrent diagnoses. However, same-day co-diagnoses accounted for only 1.6–6.8% of pathway pairs; gap-distribution analysis supports the validity of the observed temporal patterns; and a visit-frequency stratified sensitivity analysis (S9) showed that while network density scaled with visit frequency (68 edges in low-frequency vs. 128 in high-frequency groups), hub disease rankings remained consistent across strata, suggesting the core network structure is not solely an artifact of healthcare utilization. Second, ICD-10 four-character codes cannot capture the 2018 periodontitis staging/grading system [28]; K05.3 (chronic periodontitis, former classification) and K05.6 (periodontitis, current classification) formed a strong edge (RR = 4.85) that reflects coding redundancy rather than true comorbidity. Third, this remains an observational study; the Cox models may be subject to immortal time bias (weaker associations such as caries → tooth defect HR = 1.04 should be interpreted with caution), and the mediation analysis used cross-sectional indicators rather than time-ordered variables. Detection bias likely explains the weak directionality for the caries → pulpitis pair. Fourth, no systemic disease or tooth-level linkage data were available; future studies incorporating these data would enable oral–systemic interaction analysis and within-tooth progression tracking.
5. Conclusions
This study constructed a comprehensive comorbidity network within oral diseases using 75 ICD-10 four-character codes from 583,614 patients. The network revealed eight disease communities with age-dependent topology, where dental caries emerged as the dominant hub in the elderly (degree = 9) and periodontitis maintained sustained importance across age groups. Cox regression and mediation analysis provided quasi-causal support for key progression pathways; in particular, pulpitis completely mediates the caries-to-tooth-defect association, identifying early pulpitis management as a critical intervention point. Sex-stratified networks reflected distinct risk profiles, and all findings remained robust across multiple sensitivity dimensions. From a bioengineering perspective, the reproducible age-stratified network-mining pipeline provides a substrate for age- and sex-specific risk-stratified oral disease management and downstream decision-support engineering.
Supplementary Materials
The following supporting information can be downloaded at the website of this paper posted on Preprints.org, Table S1: The 75 ICD-10 four-character disease codes included in the analysis; Table S2: Bootstrap 95% confidence intervals for network topology metrics; Table S3: Inter-layer network similarity metrics; Table S4: Disease community membership in the all-age network; Table S5: Top 10 most frequent two-step progression sequences; Table S6: Full temporal precedence analysis; Table S7: Inter-diagnosis gap distribution for key pathway pairs; Table S8: Gap-stratified temporal precedence ratio; Table S9: TPR stratified by visit frequency tertiles; Figure S1: Topology bar charts across age strata; Figure S2: Community structure visualization; Figure S3: Community stability heatmap; Figure S4: Bifurcation path analysis for hub diseases; Figure S5: Sensitivity analysis panels; Figure S6: Inter-layer similarity analysis; Figure S7: Sex-stratified network comparison; Supplementary Methods SM1–SM3; Supplementary Results S9: Quasi-causal sensitivity analyses.
Author Contributions
Conceptualization, W.C. and R.Z.; Methodology, Z.C., Y.C. and X.T.; Software, W.C., Y.C. and X.T.; Validation, Y.S. and X.C.; Formal Analysis, W.C. and P.H.; Data Curation, W.C., P.H., Z.C. and Y.S.; Writing—Original Draft Preparation, W.C.; Writing—Review & Editing, X.C., Q.C. and R.Z.; Visualization, W.C. and P.H.; Supervision, Q.C. and R.Z.; Resources, Q.C.; Project Administration, R.Z.; Funding Acquisition, R.Z. All authors have read and agreed to the published version of the manuscript.
Funding
This research was funded by the National Key R&D Program of China (grant number 2024YFC2510700), the Science and Technology Special Project, Institute of Wenzhou, Zhejiang University (grant number XMGL-KJZX-202401), and the Exploration and Development Project of ZJUSS (grant number RD2024JCYL03).
Institutional Review Board Statement
The study was conducted in accordance with the Declaration of Helsinki and approved by the Medical Ethics Committee of the Affiliated Hospital of Stomatology, Zhejiang University School of Medicine (Approval No. ZJUSS-IRB-2026-164; date of approval: 25 May 2026).
Informed Consent Statement
Patient consent was waived because the study used retrospective, fully de-identified administrative data; the waiver was granted by the Medical Ethics Committee of the Affiliated Hospital of Stomatology, Zhejiang University School of Medicine.
Data Availability Statement
All analysis code and aggregated results (network edges, centrality metrics, community assignments, sensitivity analyses, and quasi-causal analysis outputs) are publicly available at https://github.com/duzida/oral-comorbidity-network. Raw patient-level data cannot be shared due to privacy constraints but are available from the corresponding author upon reasonable request, subject to institutional data governance approval.
Conflicts of Interest
The authors declare no conflict of interest.
Use of Generative AI: The authors did not use generative AI tools in any aspect of this work.
References
- Hidalgo, C.A.; Blumm, N.; Barabási, A.L.; Christakis, N.A. A dynamic network approach for the study of human phenotypes. PLoS Comput. Biol. 2009, 5, e1000353. [Google Scholar] [CrossRef] [PubMed]
- Dervic, E.; Sorger, J.; Yang, L.; Leutner, M.; Kautzky-Willer, A.; Klimek, P.; Thurner, S. Unraveling cradle-to-grave disease trajectories from multilayer comorbidity networks. npj Digit. Med. 2024, 7, 56. [Google Scholar] [CrossRef] [PubMed]
- Chmiel, A.; Klimek, P.; Thurner, S. Spreading of diseases through comorbidity networks across life and gender. New J. Phys. 2014, 16, 115013. [Google Scholar] [CrossRef]
- Jensen, P.B.; Jensen, L.J.; Brunak, S. Mining electronic health records: towards better research applications and clinical care. Nat. Rev. Genet. 2012, 13, 395–405. [Google Scholar] [CrossRef]
- Barabási, A.L.; Gulbahce, N.; Loscalzo, J. Network medicine: a network-based approach to human disease. Nat. Rev. Genet. 2011, 12, 56–68. [Google Scholar] [CrossRef]
- Menche, J.; Sharma, A.; Kitsak, M.; Ghiassian, S.D.; Vidal, M.; Loscalzo, J.; Barabási, A.L. Uncovering disease-disease relationships through the incomplete interactome. Science 2015, 347, 1257601. [Google Scholar] [CrossRef]
- Zhou, X.; Menche, J.; Barabási, A.L.; Sharma, A. Human symptoms–disease network. Nat. Commun. 2014, 5, 4212. [Google Scholar] [CrossRef]
- Dervic, E.; Ledebur, K.; Thurner, S.; Klimek, P. Comorbidity networks from population-wide health data: aggregated data of 8.9M hospital patients (1997–2014). Sci. Data 2025, 12, 215. [Google Scholar] [CrossRef]
- Larvin, H.; Kang, J.; Aggarwal, V.R.; Pavitt, S.; Wu, J. Systemic multimorbidity clusters in people with periodontitis. J. Dent. Res. 2022, 101, 1335–1342. [Google Scholar] [CrossRef]
- Alves-Costa, S.; Rodrigues, F.A.; Ferraro, A.A.; Nascimento, G.G.; Leite, F.R.M.; Souza, B.F.; Ribeiro, C.C.C. Caries is the hub of a complex network of chronic diseases across the life decades. J. Dent. Res. 2025. [Google Scholar] [CrossRef] [PubMed]
- Botelho, J.; Mascarenhas, P.; Viana, J.; Proença, L.; Orlandi, M.; Leira, Y.; Chambrone, L.; Mendes, J.J.; Machado, V. An umbrella review of the evidence linking oral health and systemic noncommunicable diseases. Nat. Commun. 2022, 13, 7614. [Google Scholar] [CrossRef]
- Beukers, N.G.F.M.; Su, N.; van der Heijden, G.J.M.G.; Loos, B.G. Periodontitis is associated with multimorbidity in a large dental school population. J. Clin. Periodontol. 2023, 50, 1621–1632. [Google Scholar] [CrossRef]
- Limo, L.; Nicholson, K.; Stranges, S.; Gomaa, N. Suboptimal oral health, multimorbidity, and access to dental care. JDR Clin. Trans. Res. 2024, 9, 13S–22S. [Google Scholar] [CrossRef]
- Chen, I.D.S.; Yang, C.M.; Chen, M.J.; Chen, M.C.; Weng, R.M.; Yeh, C.H. Deep learning-based recognition of periodontitis and dental caries in dental X-ray images. Bioengineering 2023, 10, 911. [Google Scholar] [CrossRef]
- Chuo, Y.; Lin, W.M.; Chen, T.Y.; Chan, M.L.; Chang, Y.S.; Lin, Y.R.; Lin, Y.J.; Shao, Y.H.; Chen, C.A.; Chen, S.L.; Abu, P.A.R. A high-accuracy detection system: based on transfer learning for apical lesions on periapical radiograph. Bioengineering 2022, 9, 777. [Google Scholar] [CrossRef]
- GBD 2021 Oral Disorders Collaborators. Trends in the global, regional, and national burden of oral conditions from 1990 to 2021: a systematic analysis for the Global Burden of Disease Study 2021. Lancet 2025, 405, 897–910. [Google Scholar] [CrossRef] [PubMed]
- Listl, S.; Galloway, J.; Mossey, P.A.; Marcenes, W. Global economic impact of dental diseases. J. Dent. Res. 2015, 94, 1355–1361. [Google Scholar] [CrossRef] [PubMed]
- Lipsky, M.S.; Su, S.; Crespo, C.J.; Hung, M. Men and oral health: a review of sex and gender differences. Am. J. Mens. Health 2021, 15, 15579883211016361. [Google Scholar] [CrossRef]
- Shiau, H.J.; Reynolds, M.A. Sex differences in destructive periodontal disease: exploring the biologic basis. J. Periodontol. 2010, 81, 1505–1517. [Google Scholar] [CrossRef] [PubMed]
- von Elm, E.; Altman, D.G.; Egger, M.; Pocock, S.J.; Gøtzsche, P.C.; Vandenbroucke, J.P. The Strengthening the Reporting of Observational Studies in Epidemiology (STROBE) statement: guidelines for reporting observational studies. PLoS Med. 2007, 4, e296. [Google Scholar] [CrossRef]
- Fotouhi, B.; Momeni, N.; Riolo, M.A.; Buckeridge, D.L. Statistical methods for constructing disease comorbidity networks from longitudinal inpatient data. Appl. Netw. Sci. 2018, 3, 46. [Google Scholar] [CrossRef] [PubMed]
- Newman, M.E.J. Networks: An Introduction; Oxford University Press: Oxford, UK, 2010. [Google Scholar]
- Blondel, V.D.; Guillaume, J.L.; Lambiotte, R.; Lefebvre, E. Fast unfolding of communities in large networks. J. Stat. Mech. 2008, 2008, P10008. [Google Scholar] [CrossRef]
- Girvan, M.; Newman, M.E.J. Community structure in social and biological networks. Proc. Natl. Acad. Sci. USA 2002, 99, 7821–7826. [Google Scholar] [CrossRef]
- Baron, R.M.; Kenny, D.A. The moderator-mediator variable distinction in social psychological research: conceptual, strategic, and statistical considerations. J. Pers. Soc. Psychol. 1986, 51, 1173–1182. [Google Scholar] [CrossRef]
- Spirtes, P.; Glymour, C.; Scheines, R. Causation, Prediction, and Search, 2nd ed.; MIT Press: Cambridge, MA, USA, 2000. [Google Scholar]
- Maathuis, M.H.; Kalisch, M.; Bühlmann, P. Estimating high-dimensional intervention effects from observational data. Ann. Stat. 2009, 37, 3133–3164. [Google Scholar] [CrossRef]
- Tonetti, M.S.; Greenwell, H.; Kornman, K.S. Staging and grading of periodontitis: framework and proposal of a new classification and case definition. J. Periodontol. 2018, 89 (Suppl. 1), S159–S172. [Google Scholar] [CrossRef]
- Wu, S.; Zhang, W.; Yan, J.; Noma, N.; Young, A.; Yan, Z. Worldwide prevalence estimates of burning mouth syndrome: a systematic review and meta-analysis. Oral Dis. 2022, 28, 1431–1440. [Google Scholar] [CrossRef]
- Warnakulasuriya, S.; Kujan, O.; Aguirre-Urizar, J.M.; Bagan, J.V.; González-Moles, M.Á.; Kerr, A.R.; Lodi, G.; Mello, F.W.; Monteiro, L.; Ogden, G.R.; et al. Oral potentially malignant disorders: a consensus report from an international seminar on nomenclature and classification. Oral Dis. 2021, 27, 1862–1880. [Google Scholar] [CrossRef] [PubMed]
- Mavragani, C.P.; Moutsopoulos, H.M. Sjögren’s syndrome: old and new therapeutic targets. J. Autoimmun. 2020, 110, 102364. [Google Scholar] [CrossRef] [PubMed]
- Vivino, F.B.; Bunya, V.Y.; Massaro-Giordano, G.; Johr, C.R.; Giattino, S.L.; Schorpion, A.; Shafer, B.; Peck, A.; Sivils, K.; Rasmussen, A.; et al. Sjögren’s syndrome: an update on disease pathogenesis, clinical manifestations and treatment. Clin. Immunol. 2019, 203, 81–121. [Google Scholar] [CrossRef]
- De Porras-Carrique, T.; Ramos-García, P.; Aguilar-Diosdado, M.; Warnakulasuriya, S.; González-Moles, M.Á. Autoimmune disorders in oral lichen planus: a systematic review and meta-analysis. Oral Dis. 2023, 29, 1382–1394. [Google Scholar] [CrossRef] [PubMed]
- Dave, A.; Shariff, J.; Philipone, E. Association between oral lichen planus and systemic conditions and medications: case-control study. Oral Dis. 2021, 27, 515–524. [Google Scholar] [CrossRef]
- Liu, J.; Xu, H.; Tang, G.; Zhou, Z.; Han, X.; Sun, A.; Hua, H.; Yan, Z.; Zhao, Y.; Zhang, W.; et al. A multi-center cross-sectional study of 1495 Chinese oral lichen planus patients. Oral Dis. 2024, 30, 3155–3164. [Google Scholar] [CrossRef]
- Thomson, W.M. Epidemiology of oral health conditions in older people. Gerodontology 2014, 31 (Suppl. 1), 9–16. [Google Scholar] [CrossRef]
- Griffin, S.O.; Jones, J.A.; Brunson, D.; Griffin, P.M.; Bailey, W.D. Burden of oral disease among older adults and implications for public health priorities. Am. J. Public Health 2012, 102, 411–418. [Google Scholar] [CrossRef] [PubMed]
- Bernabe, E.; Marcenes, W.; Hernandez, C.R.; Bailey, J.; Abreu, L.G.; Alipour, V.; Amini, S.; Arabloo, J.; Arefi, Z.; Arora, A.; et al. Global, regional, and national levels and trends in burden of oral conditions from 1990 to 2017: a systematic analysis for the Global Burden of Disease 2017 Study. J. Dent. Res. 2020, 99, 362–373. [Google Scholar] [CrossRef] [PubMed]
- Rothman, K.J.; Greenland, S.; Lash, T.L. Modern Epidemiology, 3rd ed.; Lippincott Williams & Wilkins: Philadelphia, PA, USA, 2008. [Google Scholar]
Figure 1.
Visualization of age-stratified comorbidity networks (2 × 3 grid: five age strata + all-age network). Node colour indicates ICD-10 three-character disease category; node size is proportional to log2(visit frequency); edge width reflects log2(RR).
Figure 1.
Visualization of age-stratified comorbidity networks (2 × 3 grid: five age strata + all-age network). Node colour indicates ICD-10 three-character disease category; node size is proportional to log2(visit frequency); edge width reflects log2(RR).
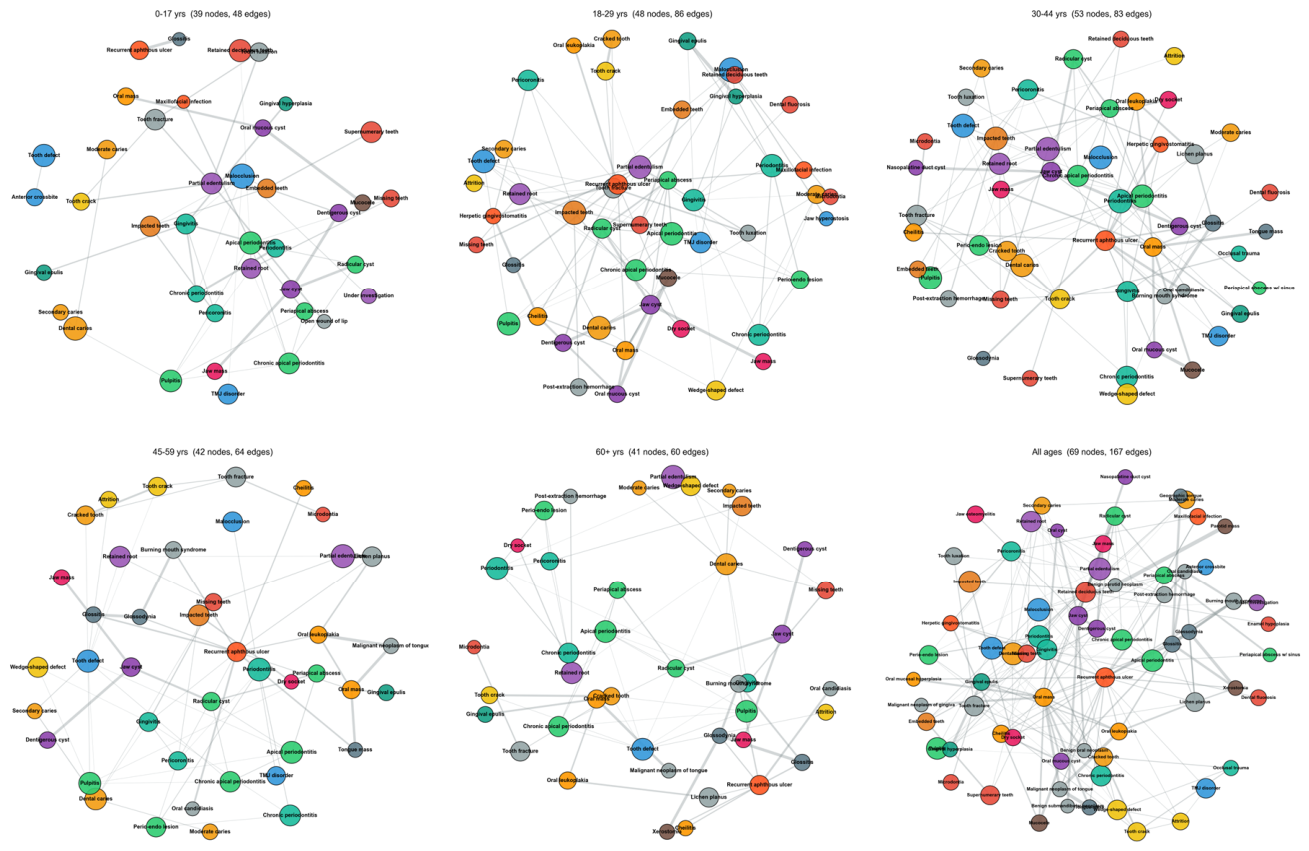
Figure 2.
Evolution curves of centrality metrics for major oral diseases across age strata. Top: degree centrality; middle: PageRank; bottom: betweenness centrality.
Figure 2.
Evolution curves of centrality metrics for major oral diseases across age strata. Top: degree centrality; middle: PageRank; bottom: betweenness centrality.
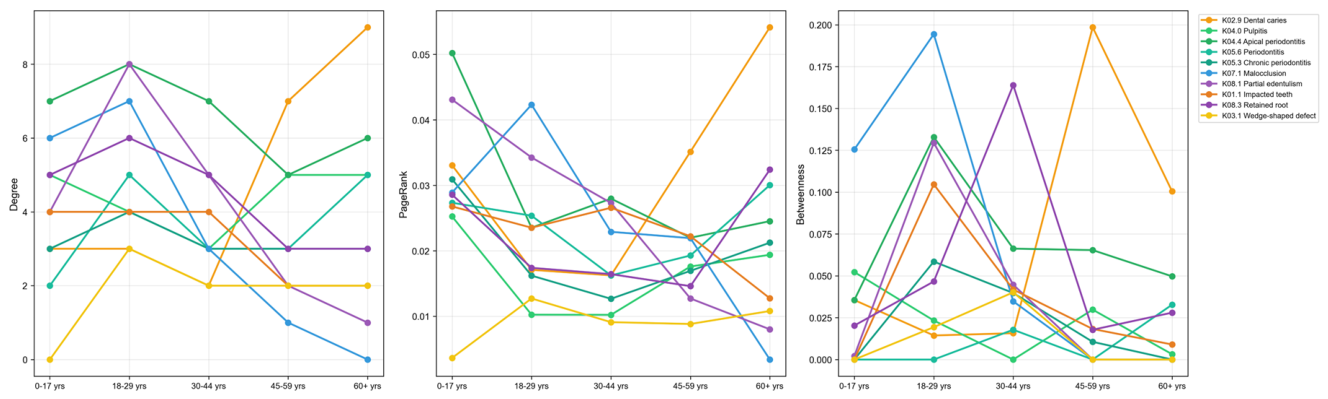
Figure 3.
PC algorithm DAG for 13 key oral diseases. The PC-derived DAG reversed the direction of caries and pulpitis, placing them as terminal sinks, demonstrating that constraint-based DAG learning on cross-sectional binary data identifies conditioning structure rather than temporal causation.
Figure 3.
PC algorithm DAG for 13 key oral diseases. The PC-derived DAG reversed the direction of caries and pulpitis, placing them as terminal sinks, demonstrating that constraint-based DAG learning on cross-sectional binary data identifies conditioning structure rather than temporal causation.
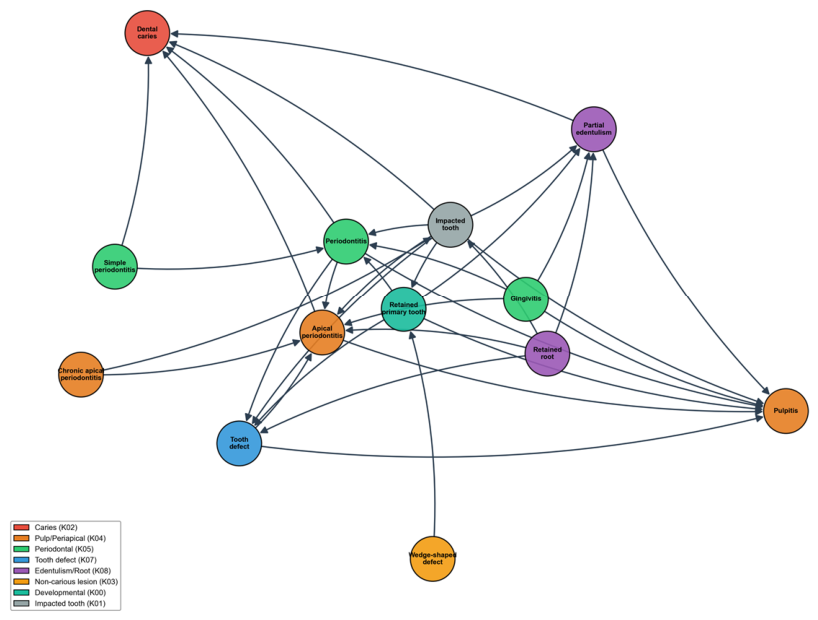
Figure 4.
Sex-stratified comorbidity network comparison. Left: male network; right: female network. Sex-specific edges are highlighted.
Figure 4.
Sex-stratified comorbidity network comparison. Left: male network; right: female network. Sex-specific edges are highlighted.
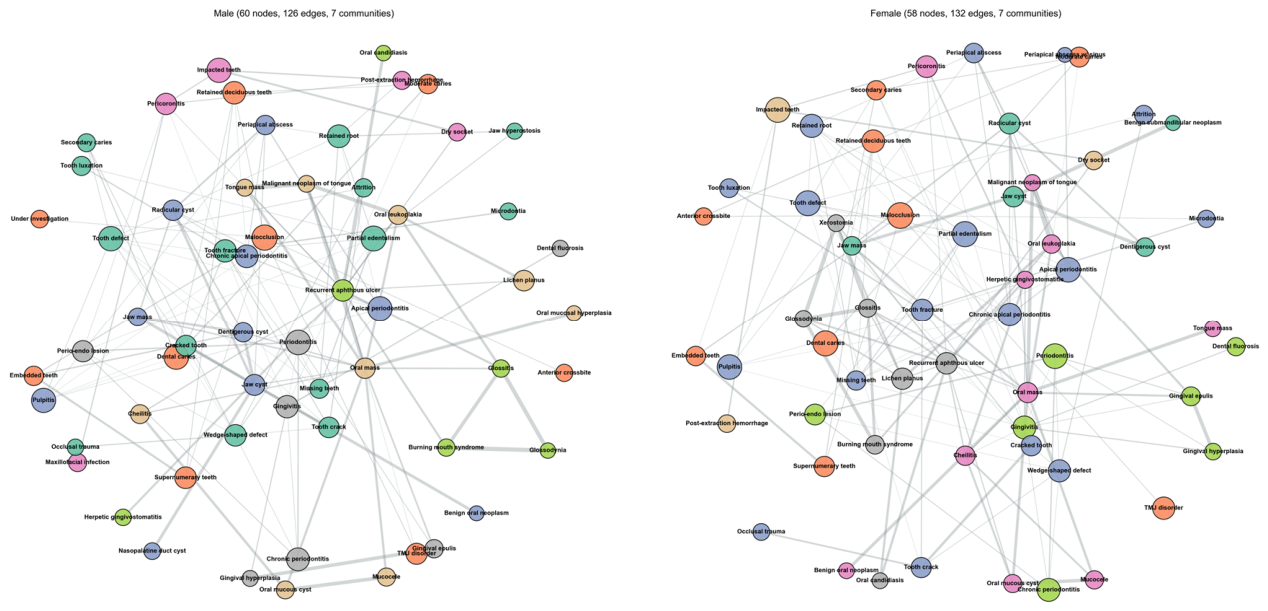

Table 1.
Age stratification and patient distribution.
| Age stratum | Age range | No. of patients | Oral disease characteristics |
|---|---|---|---|
| L1 | 0–17 years | 124,950 | Deciduous caries, mixed dentition, early orthodontics |
| L2 | 18–29 years | 187,338 | Peak orthodontics, third molars, gingivitis |
| L3 | 30–44 years | 172,531 | Early periodontitis, pulp disease |
| L4 | 45–59 years | 81,960 | Periodontal progression, onset of tooth loss |
| L5 | 60+ years | 56,637 | Tooth loss, prosthetic needs |
Table 2.
Topological metrics of comorbidity networks by age stratum.
| Age stratum | Nodes | Edges | Density | Avg. degree | Clustering coeff. | Avg. path length | Modularity |
|---|---|---|---|---|---|---|---|
| L1 (0–17) | 54 | 48 | 0.034 | 1.78 | 0.202 | 4.48 | 0.73 |
| L2 (18–29) | 65 | 86 | 0.041 | 2.65 | 0.284 | 3.91 | 0.68 |
| L3 (30–44) | 71 | 83 | 0.033 | 2.34 | 0.192 | 3.77 | 0.57 |
| L4 (45–59) | 66 | 64 | 0.030 | 1.94 | 0.259 | 3.83 | 0.61 |
| L5 (60+) | 63 | 60 | 0.031 | 1.90 | 0.191 | 3.27 | 0.71 |
| All ages | 75 | 167 | 0.060 | 4.45 | 0.414 | 3.06 | 0.53 |
Table 3.
Top 5 most frequent disease progression sequences and negative controls.
| Rank | Sequence | No. of patients | Support (%) | RR (95% CI) |
|---|---|---|---|---|
| 1 | Dental caries → Tooth defect | 16,934 | 4.58 | 1.13 (1.12–1.14) |
| 2 | Pulpitis → Tooth defect | 16,429 | 4.44 | 2.11 (2.08–2.13) |
| 3 | Apical periodontitis → Tooth defect | 12,708 | 3.43 | 1.66 (1.64–1.68) |
| 4 | Dental caries → Pulpitis | 11,961 | 3.23 | 1.47 (1.45–1.49) |
| 5 | Dental caries → Apical periodontitis | 11,472 | 3.10 | 1.08 (1.06–1.09) |
Table 4.
Temporal precedence analysis of key disease pairs.
| Disease pair | TPR | Binomial p | Median gap (days) | Type |
|---|---|---|---|---|
| Pulpitis → Tooth defect | 0.771 | <0.001 | 77 | Pathway |
| Periapical → Tooth defect | 0.680 | <0.001 | 135 | Pathway |
| Caries → Tooth defect | 0.601 | <0.001 | 283 | Pathway |
| Caries → Pulpitis | 0.540 | <0.001 | 247 | Pathway |
| Malocclusion → Pulpitis | 0.459 | <0.001 | 286 | Negative ctrl |
| TMJ disorder → Pulpitis | 0.369 | <0.001 | 304 | Negative ctrl |
Table 5.
Quasi-causal inference results for key progression pathways.
| Disease pair | Cox HR (95% CI) a | Negative outcome HR b | Type |
|---|---|---|---|
| Pulpitis → Tooth defect | 2.652 (2.613–2.691) *** | — | Pathway |
| Caries → Pulpitis | 2.248 (2.207–2.290) *** | — | Pathway |
| Periapical → Tooth defect | 1.642 (1.617–1.668) *** | — | Pathway |
| Caries → Periapical | 1.308 (1.284–1.332) *** | — | Pathway |
| Caries → Candidiasis | — | 0.145 (0.052–0.404) *** | Negative ctrl |
| Caries → Lichen planus | — | 0.409 (0.332–0.504) *** | Negative ctrl |
| TMJ → Pulpitis | 0.399 (0.362–0.439) *** | — | Negative ctrl |
a Cox proportional hazards model adjusted for age, sex, and log(visit count). b HR for caries predicting clinically unrelated diseases. *** p < 0.001.
Table 6.
Sex-specific comorbidity associations.
| Sex | Comorbidity association | RR (95% CI) | Co-occurring cases | Clinical interpretation |
|---|---|---|---|---|
| Male | Tongue mass ↔ Malignant neoplasm of tongue | 419.4 (217.5–808.6) | 10 | Extremely strong oral neoplasm co-occurrence in males |
| Male | Oral mass ↔ Oral mucosal hyperplasia | 42.9 (22.8–80.6) | 12 | Proliferative oral mucosal lesions |
| Male | Jaw cyst ↔ Nasopalatine duct cyst | 41.0 (25.6–65.7) | 22 | Jaw cystic disease clustering |
| Male | Oral leukoplakia ↔ Glossitis | 23.8 (13.1–43.4) | 11 | Precancerous lesion co-occurrence |
| Female | Glossodynia ↔ Xerostomia | 162.3 (101.3–259.9) | 18 | Oral dryness syndrome-related |
| Female | Glossitis ↔ Xerostomia | 77.9 (46.3–131.1) | 15 | Oral dryness/immune-mediated |
| Female | Oral mass ↔ Benign oral neoplasm | 44.9 (23.7–85.1) | 11 | Benign oral tumors |
| Female | Cheilitis ↔ Herpetic gingivostomatitis | 19.2 (11.0–33.4) | 13 | Oral mucosal inflammation co-occurrence |
Table 7.
Summary of sensitivity analyses.
| Dimension | Parameter variation | Impact on core findings | Robustness |
|---|---|---|---|
| S1 ICD granularity | 3-character (28 nodes/45 edges) vs. 4-character (75 nodes/167 edges) | Four-character codes provide richer structure; community directions consistent | Robust |
| S2 RR threshold | 1.2/1.5/2.0/3.0 → 191/167/135/106 edges | Hub node rankings stable | Robust |
| S3 Age grouping | 5 unequal-width vs. 8 equal-width 10-year strata | Topological trends consistent | Robust |
| S4 Co-occurrence measure | RR (167 edges) vs. Phi > 0.02 (101 edges) | Core edges highly overlapping | Robust |
| S5 Community algorithm | Louvain (Q = 0.584 *)/Greedy (0.531)/LabelProp (0.532) | Major communities highly consistent | Robust |
| S6 Time window | 30 d/90 d/180 d → 627/577/509 frequent 2-sequences | Top sequence rankings stable | Robust |
| S7 Single-diagnosis bias | Same-day multi-visit: 4.56% of patient-days; same-day-only RR-filtered: 7 vs. 167 main | Cross-visit design captures broader comorbidity structure; main estimates conservative | Informative |
| S8 Temporal stability | 3 periods (2011–15/2016–20/2021–25): 21 stable edges; top-10 sequences consistent | Core structure stable; early-period smaller samples limit power | Moderate |
* S5 modularity was calculated on the 69-node subgraph with edges; the all-age modularity 0.53 in Table 2 was based on all 75 nodes (including 6 isolated nodes).
Disclaimer/Publisher’s Note: The statements, opinions and data contained in all publications are solely those of the individual author(s) and contributor(s) and not of MDPI and/or the editor(s). MDPI and/or the editor(s) disclaim responsibility for any injury to people or property resulting from any ideas, methods, instructions or products referred to in the content. |
© 2026 by the authors. Licensee MDPI, Basel, Switzerland. This article is an open access article distributed under the terms and conditions of the Creative Commons Attribution (CC BY) license (http://creativecommons.org/licenses/by/4.0/).
Copyright: This open access article is published under a Creative Commons CC BY 4.0 license, which permit the free download, distribution, and reuse, provided that the author and preprint are cited in any reuse.


