
Submitted:
05 June 2026
Posted:
08 June 2026
You are already at the latest version
Abstract
The objective of this study is to undertake a quantitative analysis of the Park Cooling Intensity (PCI) generated by different three Park in the city center of Bartın in Black Sea Region during the summer periods of 2015 and 2025, using Remote Sensing and Geographic Information Systems based methods. The calculation of PCI values was based on the buffer zones created at 100 meter intervals around the parks. The findings indicate that Gazhane Park exhibited the highest PCI values in both years (2.85 °C), while Kaynarca Park demonstrated negative PCI values (-2.90 °C). A correlation analysis was conducted between PCI values and park metrics. The analysis revealed a strong negative correlation between impermeable surface areas and PCI, and a positive correlation with vegetation, water surfaces, and the Landscape Shape Index. The findings of the regression analysis conducted between the structural components (PCA1) and the plant components (PCA2) of PCI demonstrate that the PCA1 exert a more significant and determinative influence on PCI, while the PCA2 assume a supportive and complementary role. Results demonstrate that park cooling performance is more strongly determined by spatial configuration and blue-green integration than by park size alone, providing evidence for configuration-sensitive climate adaptation strategies in compact urban fabrics.
Keywords:
land surface temperature
; urban heat ısland
; park metrics
; urban parks
; climate change
1. Introduction
Rapid urbanisation has accelerated the transformation process of natural lands into urban areas; the mass and height of buildings, thermal pollution emissions from traffic, and impermeable artificial surfaces have increased with the growing population in cities, and urban plant communities have tended to reduce [1,2]. Excessive urbanisation has further intensified human-induced warming at the local scale, and the heat waves have intensified with expanding urbanisation [3].
These unfavourable factors in cities have led to the Urban Heat Island (UHI) Effect, where higher temperatures are recorded in urban areas compared to the surrounding rural areas [2,4]. The UHI effect refers to the higher temperatures in urban centres compared to rural areas resulting from the absorption of sunlight by concrete, asphalt, and other impermeable surfaces in cities and the emission of heat to the environment [5].
Studies indicate that urban green spaces mitigate the UHI effect by lowering the temperature of the surrounding areas and create a microclimatic effect [6,7,8,9]. Studies have proven that vegetation in parks is effective on energy flows through absorption/reflection of solar radiation, evaporation, shading, lowering the temperature of surrounding spaces, and improving negative UHI effects [10]. It was also concluded that large green spaces lower night-time temperatures and increase humidity, thereby making a significant contribution to mitigating the urban heat island effect [11].
In this context, urban parks are an important form of climate-adaptation infrastructure, reducing the urban heat island effect by providing the cooling-regulatory ecosystem service. When evaluated within the framework of ecosystem services, the cooling effect created by parks contributes to the climate resilience of cities by lowering land surface temperature (LST) and regulating the microclimate, as well as acting as a buffer during periods of extreme heat. However, the magnitude and spatial distribution of this cooling service does not depend solely on the size of the park. The spatial characteristics considered within the framework of landscape configuration theory, such as the park's level of compactness, edge density, degree of fragmentation and connectivity status, determine cooling performance. These metrics influence the magnitude, scope, and spatial distribution of cooling effects within the urban landscape.
PCI is used to assess the UHI effect of urban green spaces. PCI refers to the difference between the surface temperature within a green space and the surface temperature of the surrounding urban areas. The PCI makes it possible to quantitatively analyse both absolute and relative cooling capacity by assessing the temperature fall around parks over certain buffer distances [12,13,14,15,16]. This method not only demonstrates the cooling effect of green spaces but also allows the identification of prioritised intervention areas for urban planning.
Remote sensing (RS) and Geographic Information Systems (GIS)-based data are used in the calculation of PCI. Land Surface Temperature (LST) [17], Normalised Difference Vegetation Index (NDVI) [18], and Normalised Difference Built-up Index (NDBI) [19] are the basic parameters used in PCI analyses.
The studies conducted based on the literature review indicate that urban parks are effective in lowering ambient temperatures and create a microclimatic effect in cities [20,21,22].
Bowler et.al (2010) revealed that urban green spaces lowered the surrounding temperature by 0.94°C on average [20]. However, different types of parks had different cooling intensities. Li et al., (2020) reached this conclusion by analysing parks according to type, size, shape, and environmental land cover factors [23]. On the other hand, Shah et al. (2021) emphasised that large green areas as well as informally shaped green areas had a more cooling effect, and small green areas had less cooling effect by utilising the remote sensing method [13]. A study conducted in China, concluded that parks which had water in or around them, complex boundaries, and dense vegetation intensified the cooling effect [15].
Furthermore, studies have found that the park cooling effect mitigated as one moved away from the park, and a significant negative correlation was found between vegetation rate and land surface temperature [12]. Correspondingly, similar studies conducted in 30 m [13,24], 90 m [15], and 300 m [25] buffer zones around urban green spaces also reported that the PCI effect tended to diminish as one moved away from the park.
Unlike these studies, a comprehensive review study reported that there was no significant correlation between PCI and climate zone. Larger green areas tended to produce a stronger PCI; PCI was less dependent on latitude, geographical location or climate zone, or even specific seasons [26].
In a study investigating the correlation between LST and NDVI in Berlin, it was concluded that there was a negative correlation between these two factors [27]. On the other hand, in their study, Trotter et al. (2017) concluded that vegetation and water surfaces had a relatively constant LST, but when these surfaces were converted into large impermeable urban areas, the temperature rose by 2°C on average [28].
The studies conducted in Turkey have revealed similar results. A study conducted in the city of Kayseri was emphasised that there was a direct proportional correlation between NDBI, LST, and UHI, and an inverse proportional correlation between NDVI and NDBI, LST, and UHI. The results indicated a strong negative correlation between LST and NDVI and a strong positive correlation between LST and NDBI [29]. Parallel to this result, a study conducted in Adana showed that there was a continuous negative correlation between NDVI and LST values in urban green spaces [30].
A study conducted in Elazig city using RS and satellite imaging techniques in three parks indicated that the cooling effect of parks on their surroundings was directly proportional to their size and LST values rose as they moved away from the park boundaries [31]. Likewise, when the effect of blue-green infrastructure on urban surface temperature in Izmir province was analysed using Landsat 8 satellite images, it was reported that the cooling effect in buffer zones (100-300 m) was mitigated as the distance increased; whereas, surface temperatures rose as the distance from the park boundary increased [32].
When the international and national literature has been reviewed, it has been found that the PCI effect of urban parks has been studied, mapped, and statistically analysed using remote sensing and Landsat satellite images. On the other hand, these studies in Turkiye on urban parks are very limited, especially in the Black Sea climate zone, and no study was found in Bartın. Therefore, it is considered that this study would contribute to bridging this gap in the literature, allow for the comparison of studies conducted in different regions such as the Black Sea region and Central Anatolia, Marmara, and Aegean regions, form a data-based infrastructure for climate-resilient urban planning, and provide data for those working on similar issues.
This study quantitatively evaluated the PCI effect of the parks in city centre of Bartın, varying in size, shape, spatial layout, plant density, and usage characteristics, during the summer months through remote sensing-based indicators. Spatial determination of the microclimate-regulating functions of parks has become increasingly important in cities with humid climates, such as Bartın, where population growth and building density have increased in recent years, and urban green spaces have decreased. In this regard, LST and PCI analyses were done using satellite images and related remote sensing indices, and the cooling effects of parks were identified comparatively.
This study conceptualizes PCI as a regulating ecosystem service emerging from landscape configuration and blue–green structural integration.
The study aimed to demonstrate the capacity of parks to generate PCI, especially in urban areas with dense housing, where the size and character of parks produce a higher cooling effect, and how landscape components (size, form, spatial characteristics, plant density, presence of water surface, etc.) are correlated with PCI. In this regard, three basic research questions were focused:
- What is the PCI capacity of parks in urban areas with dense housing?
- Which types and scales of parks produce a stronger cooling effect?
- How are landscape metrics and PCI statistically correlated with each other?
One of the important aspects of the study was to test the assumption that small parks in cities could also have a significant cooling effect. The unique contribution of the study was to reveal the spatial distribution and quantitative magnitudes of PCI specifically in urban parks in the case of Bartın in the Black Sea climate zone and to assess the effects of landscape metrics on PCI through statistical analyses.
The findings are predicted to contribute to the development of feasible strategies for climate-sensitive green infrastructure planning and to the literature on urban heat management, ecosystem services, and sustainable planning.
2. Materials and Methods
2.1. Study Area
Bartın Province is located in the Western Black Sea region, situated between 41°37’ north latitude and 32°22’ east longitude. The surface area of the province is 2143 km2, and the mean elevation is 25 m. Bartın is characterised by the Black Sea climate with hot summers and cool and rainy winters. Bartın Province was settled on the plain formed by the Kocacay and Kocanaz streams flowing into the Bartın River [33].
The highest mean temperature was measured as 28.6 °C in August, and the lowest mean temperature was measured as 0.5 °C in January. The mean sunshine duration is recorded as 9.9 hours in July. The mean annual precipitation is 1062.7 mm. The annual maximum temperature is 42.8°C, and the annual minimum temperature is -18.6°C [34]. According to Turkish Statistical Institute (TSI) data, the population of the city centre was 87.803 people in 2025, and there has been a growth of 21.712 people over the last 10 years [35].
The city centre, comprising the study area, lies 12 km inland from the sea. According to the data from the Directorate of Parks and Gardens of Bartın Municipality, there are 165 parks with different spatial sizes and different functions in the city centre Among them, Kaynarca Park, Gazhane Park, and Vefa Park were preferred as study areas (Figure 1). The parks were selected according to the following criteria:
- -
- Having an area larger than 5.000 m2;
- -
- Having green spaces and different recreational facilities or water bodies;
- -
- Being easily accessible;
- -
- Being preferred by local people;
- -
- Having different shapes and positions from each other.
Gazhane Park: The park is located on a plain area. It includes a pergola, an ornamental pool decorated with a fishing boat, a walking track, an outdoor cinema, a café, a children’s playground, examples of civil architecture, and mini models of monumental structures. The park is planted with leafy and coniferous trees. The informal park boundary extends approximately 370 m along the riverside [36].
Figure 1.
Location of Bartın Province and parks.
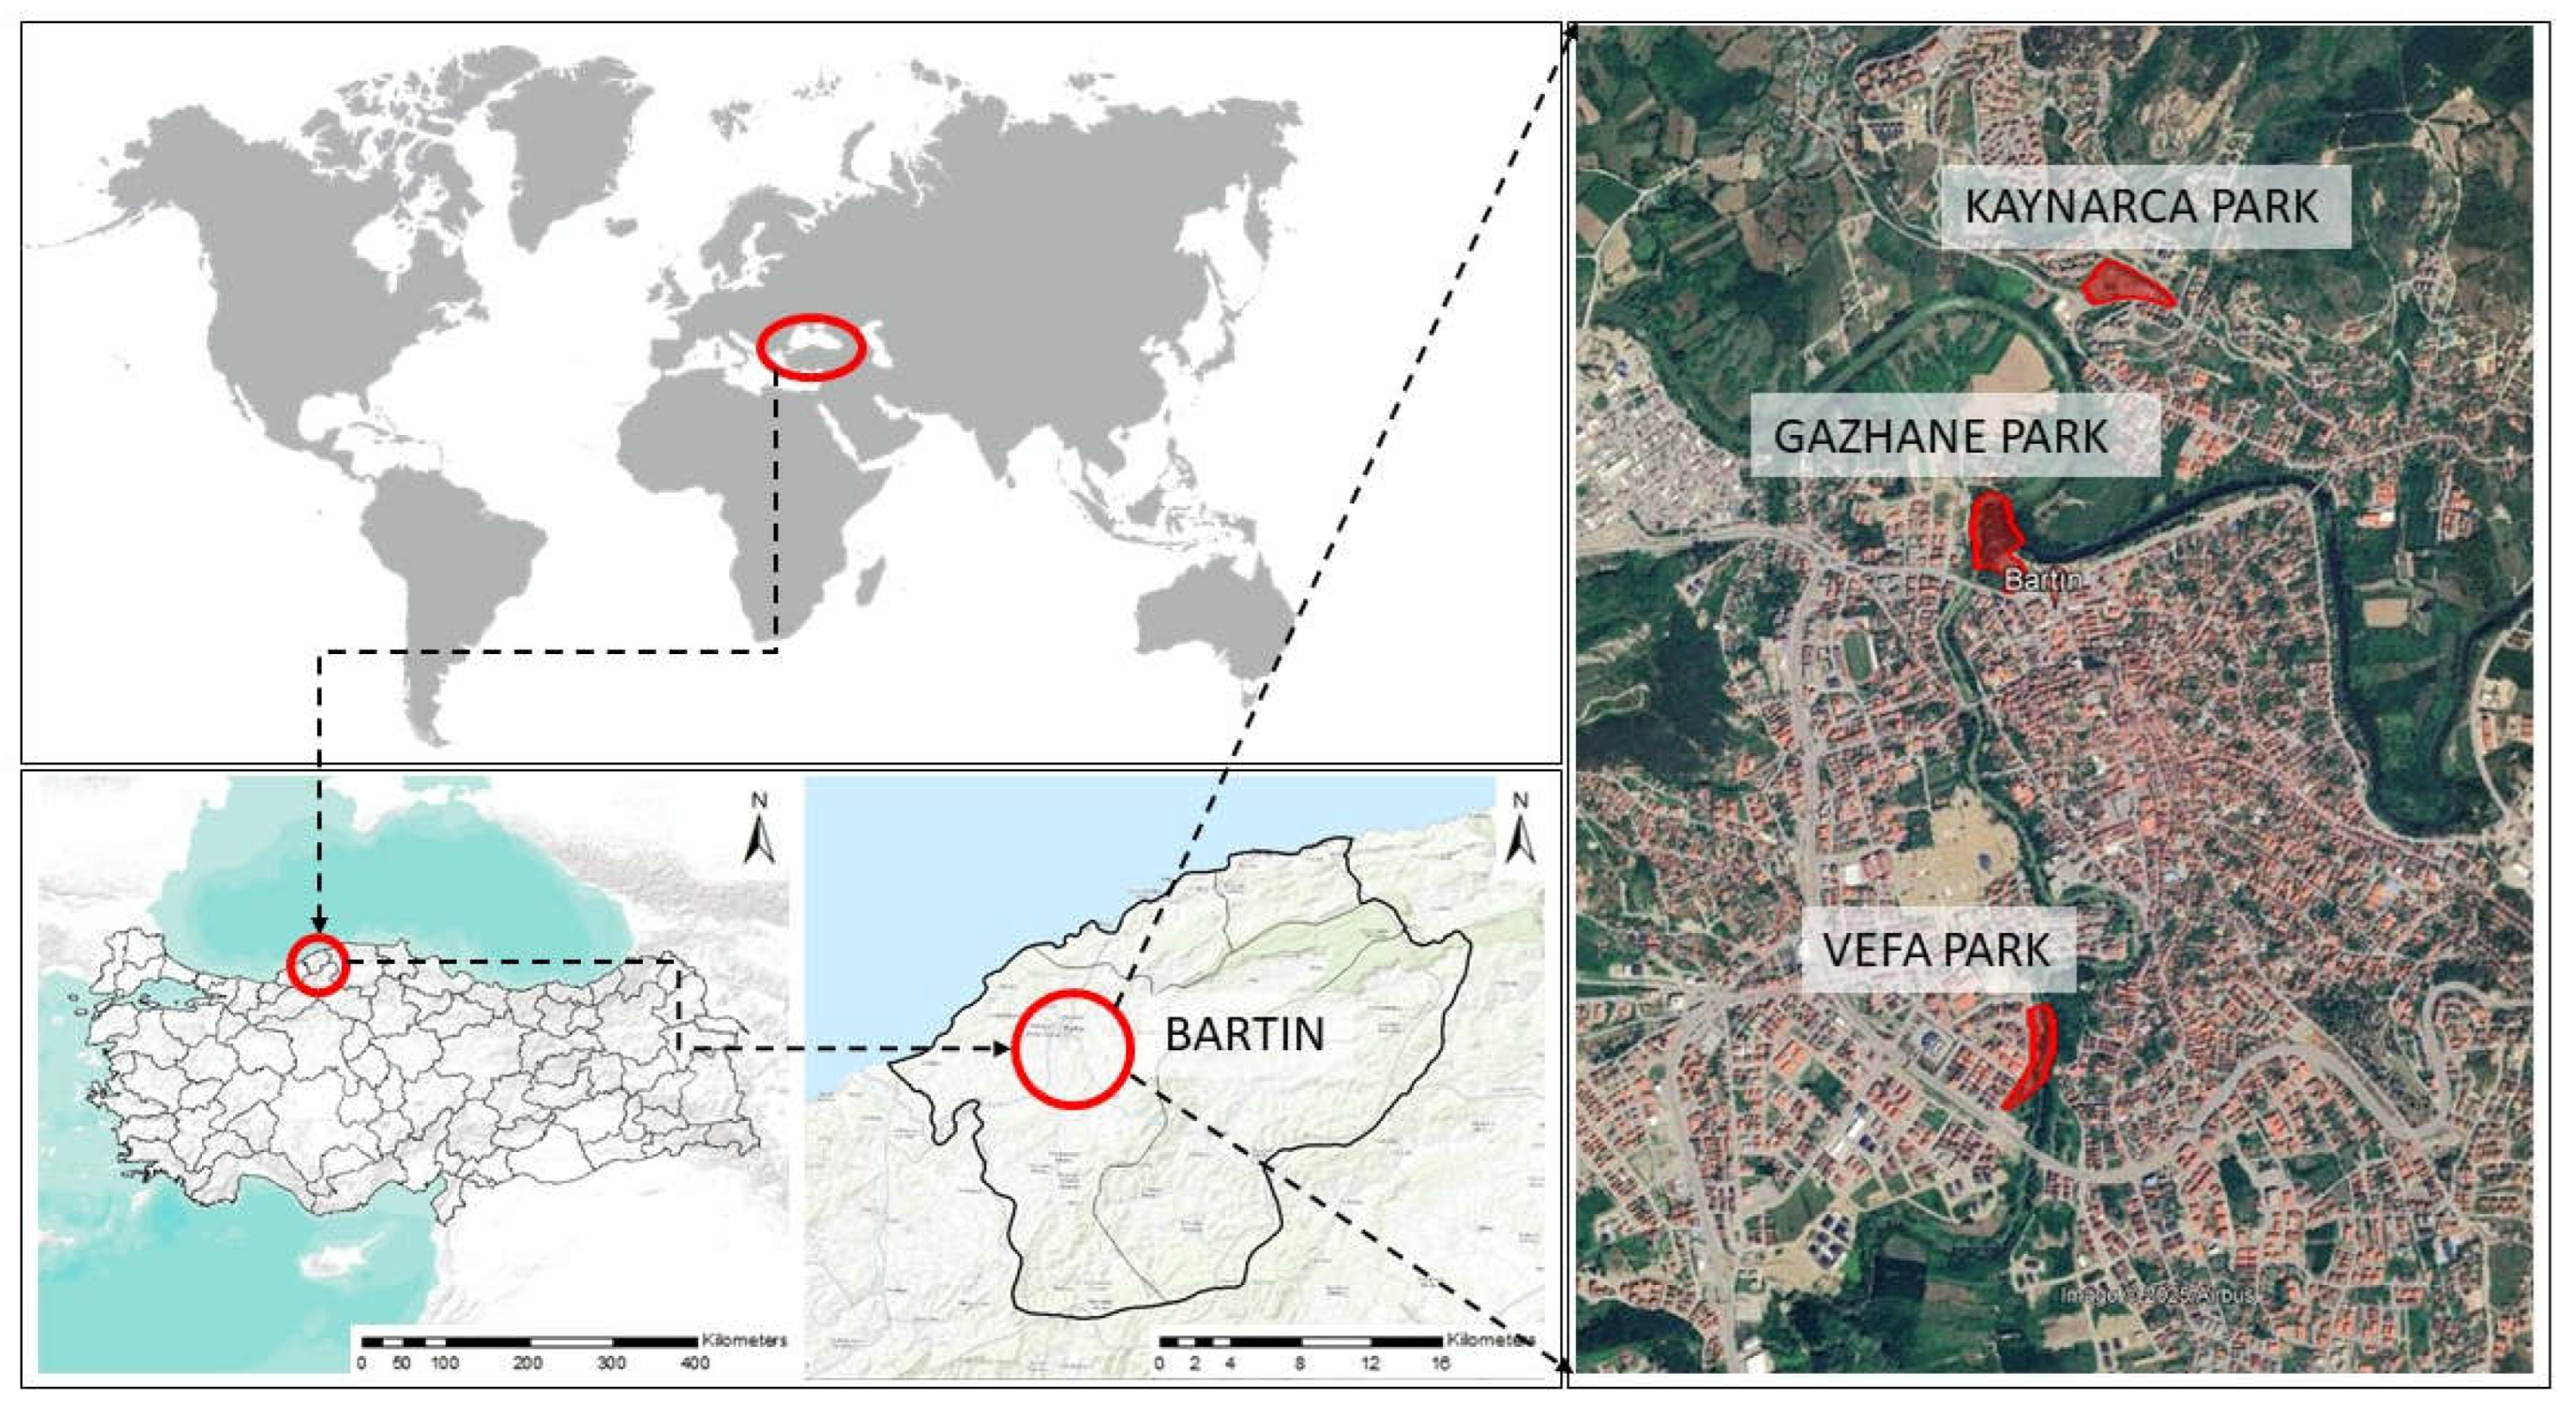
Kaynarca Park: The park is built on an inclined terrain, and the elevation difference inside the park is around 10 metres. The park features a walking track, basketball court, mini tennis court, mini golf course, recreation grounds, children’s playground, fitness equipment, and a café. Leafy and evergreen plants are available in the park. A 15-metre road extends along both sides of the park [36].
Vefa Park: The park is located on a plain area and features a walking track, children’s playground, fitness equipment, picnic site, resting spots, café, and basketball courts. The park is planted with leafy and coniferous plants. This linear park is bordered by a river on one side [36].
Gazhane and Vefa parks are located by the river. The city inhabitants prefer these parks due to their wide range of recreational activities and shady spaces, as well as the microclimatic comfort of the river. Therefore, the parks and the adjacent river are considered an ecological and microclimatic system and incorporated into the parkland. The cooling effect of the parks is not only driven by the evapotranspiration capacity of the vegetation but also by the cooling contribution of the river surface. This approach accords with the blue-green infrastructure integration approach in the literature [37].
2.2. Spatial Data Sources and Data Processing Methods
Corine maps retrieved from the European Environment Agency Copernicus Land Monitoring Service (CLMS) [38] were utilised to demonstrate the detailed land cover of the study area and its surroundings. These maps indicate the overall land cover classifications on a large scale and give an idea about the study area and its surroundings (Figure 2).
Corine Land Cover maps of 1990 and 2018 retrieved from CLMS were used to analyse land cover change. The generated maps were reclassified in accordance with the purpose of the study using ArcMap 10.8 software, and all calculations and visualisations were made using the same software. When the total land cover change was analysed, it could be argued that green spaces decreased by 2.31 %, while settlement sites increased by 2.71 % (Table 1). Similar results are present in the study by Dal (2025) as well [39].
2.3. Remote Sensing Procedures and Data Set
The boundaries of the parks focused in this study were determined by using Google Earth Pro software. The park boundaries were drawn manually with the polygon plotting tool of the software. The parks in the study area were downloaded as digital data by marking them from the parcel query screen on the General Directorate of Land Registry and Cadastre (GDLRC) website, verified through Google Earth Pro data, and transferred to the ArcMap 10.8 software as polygons. The drawn boundaries laid the groundwork for analysing the spatial characteristics and thermal performances of the parks.
To generate the LST map of the study area, Landsat 8 satellite images retrieved from the US Geological Survey (USGS) Earth Explorer platform [40] with a spatial resolution of 30 m and a cloudiness of less than 10% were used. LST calculations were carried out through ArcMAP 10.8 software using Landsat satellite data. NDVI rasters were created to determine vegetation density and this data was used for emissivity calculation. When determining the park attributes (structural and vegetation), polygon data plotted from Google Earth Pro software were transferred to the ArcMap 10.8 environment, converted into polygons, classified, and spatially calculated.
The July-August period with the highest temperatures recorded for Bartın, according to the official statistics of the General Directorate of Meteorology (GDM) for the years 2015-2025, was preferred for capturing the images. In this study, two cloud-free images were used, one dated 22 July 2015 (LC08_L1TP_178031_20150722_20200908_02_T1) and the other dated 17 July 2025 (LC08_L1TP_178031_20250717_20250726_02_T1).
Selecting images taken 10 years apart made it possible to analyse the temperature changes between the time when the parks were first opened to the public and the present.
2.4. LST and PCI Calculation Stages
In this study, the LST was calculated using the thermal and reflected bands of the Landsat 8 satellite according to the methods commonly followed in the literature [15,41]. The process consists of the following basic steps.
The PCI calculation is defined in most of satellite-based studies as first converting pixels to Top-of-Atmosphere (TOA) radiance, expressing it as brightness temperature (TB), applying an NDVI-based method to estimate surface emissivity, and finally obtaining LST (skin temperature) by emissivity correction. The final step involves calculating the PCI value of the area (Table 2). This approach and equation set are widely recognised in the literature [15,42].
In this research to spatially evaluate the cooling effect of the parks, the study created three buffer zones with a radius of 100 m, 200 m, and 300 m outside each park polygon (Figure 3). The factors influencing the determination of buffer zone distances and numbers are the use of 30 m satellite images and the proximity of parks to each other in the city centre. The resulting PCI values were used as the dependent variable.
2.5. Spatial Data Generation of Park Attributes
Within the scope of the study, the cooling effect analyses of all parks considered were conducted using the metrics reported in the literature. The park metrics were classified as composition metrics and configuration metrics. The composition metrics included park area (m2), PLAND/for impermeable surfaces (m2), PLAND/for water surfaces (m2), PLAND/for tree-shrub covered areas (m2), PLAND/grass areas (m2), AREA_MN (mean patch area), and LPI (Largest Patch Index). The configuration metrics included perimeter length (m), LSI (Landscape Shape Index), PD (Patch Density), and ED (Edge Density) (Table 3) [37,45,46,47,48,49].
2.6. Statistical Analysis
A two-stage statistical analysis was done to determine the correlations between PCI values and the park attributes. The analyses were carried out using SPSS 27.0 software.
2.6.1. Correlation Analysis
The linear correlations between park area, perimeter length, water surface area, impermeable surface area, tree-shrub area, grass area, LSI variables, and PCI were tested by Pearson correlation. In addition, a Pearson correlation analysis was conducted between LST and LSI. Due to the limited sample size, the results were not interpreted statistically but were rather evaluated according to the direction and magnitude of the correlation between the variables.
2.6.2. Regression Analysis
Regression analysis involved the use of “Component-Based Regression Analysis,” which eliminated the problem of multicollinearity for park studies with small sample sizes and allowed for the interpretation of multidimensional thermal indices such as PCI with a component-based approach. Six explanatory variables that represented the structural and vegetative characteristics for the years 2015 and 2025, and the PCI were used for three parks located in the city centre of Bartın. The independent variables were PCA1 (structural components) and PCA2 (vegetative components), and the dependent variable was PCI. As the PCI value, the yearly means were calculated for each park. The data set consisted of three park observations for each year (n=3) and six observations in total (n=6). The regression analysis was calculated using the following formula
All statistical analyses were performed at a confidence interval of 95% (p< 0.05).
3. Results
The findings from this study were utilised to comparatively evaluate the microclimatic performance of the parks selected as the research area in the city centre between 2015 and 2025. Within this scope, LST, NDVI, and PCI analyses were performed. The first stage analysed the LST distributions of the parks and three buffer areas formed at 100 m intervals, and then the correlations of these values with the NDVI changes. Furthermore, the thermal differences between years were evaluated by using the min-max LST graphs for each park, and the spatial pattern of the cooling effect was identified by analysing the PCI values of the buffer areas.
When the average LST results for 2015 and 2025 were analysed together, a significant temperature rises in the microclimatic performance of the parks between years and a differentiation between parks were observed. While Gazhane Park stood out with lower LST values compared to its surroundings in both years, Kaynarca Park had the highest average LST values (Figure 4).
When the park-based NDVI results for 2015 and 2025 were analysed together, continuous spatial differences between parks for vegetation cover density and a generally downward trend over the years were observed. The spatial pattern on the maps supported these quantitative results, indicating that there were more continuous green spaces around Vefa and Gazhane parks, while the vegetation pattern around Kaynarca Park was more fragmented and weaker (Figure 5).
A comparative analysis of the minimum and maximum LST values calculated for the parks and 100-300 m buffer areas in 2015 and 2025 showed that there was a significant thermal gradient from the park centres to the surroundings in both years, but this gradient took place at higher temperature levels in 2025. While the minimum LST values in 2015 in all parks generally fell as the buffer distance increased, the maximum LST values showed an upward trend, especially in the 100-300 m range. On the other hand, the graphs for 2025 draw attention to how the minimum LST values started higher in the park centres and showed a more limited fall as the buffer distance increased, whereas the maximum LST values reached higher levels at all distances compared to 2015 (Figure 6).
When the PCI values calculated for 100-300 m buffer distances for 2015 and 2025 were analysed together, significant differences were observed between the parks for both the magnitude and the spatial spread of the cooling effect. While Gazhane Park exhibited the strongest cooling effect in both years, with positive and high PCI values at all buffer distances, Kaynarca Park had a weak microclimatic performance compared to its surroundings, with negative PCI values. On the other hand, Vefa Park lies between Gazhane and Kaynarca parks with moderate and distance-dependent PCI values. Compared to 2015, the PCI values in 2025 showed a general downward trend, indicating that the cooling effect of the parks has weakened over time; this was particularly evident in the 300 m buffer areas (Figure 7).
When the perimeter length and area values of the parks and 100-300 m buffer areas were analysed together, significant differences between parks were observed for area, spatial extent, and environmental impact potential (Tablo 3). As the buffer areas expanded, the area and perimeter lengths increased steadily in all parks, indicating that the environmental impact areas of the parks grew spatially. When the morphological differences were evaluated together with the previous PCI results, they showed that as the size and compactness progressed, a higher cooling effect was noticed; whereas, as the size and compactness diminished (Vefa & Kaynarca), the cooling effect weakened faster with the buffer distance (Table 4).
When the LST distributions, NDVI changes, min-max LST graphs, PCI results, and park morphological indicators were evaluated together for 2015 and 2025, it was observed that the microclimatic performances of the parks in the study area differed significantly both temporally and spatial. The LST distributions and min-max plots showed that the minimum and especially maximum surface temperatures rose in all parks in 2025 compared to 2015, and the thermal contrast between the park and the environment weakened. This trend was consistent with the fall in NDVI observed in all parks over the period 2015-2025, suggesting that the drop in vegetation density limited the cooling potential of the parks. The higher NDVI values in Vefa and Gazhane parks compared to Kaynarca explain the ability of these parks to partially maintain lower LST values in park centres and close buffer areas. However, PCI analyses showed that the cooling effect strongly depended not only on the amount of vegetation but also on the spatial form of the park. In this sense, Vefa Park, with the highest LSI value (LSI = 1.66), despite having a more fragmented and irregular form, exhibited a moderate PCI performance due to its relatively high NDVI values. On the other hand, Gazhane Park (LSI = 1.43) produced the strongest and most consistent PCI values at all buffer distances due to its more compact and balanced spatial structure, high NDVI and large area-perimeter effect. On the contrary, the lower LSI value (1.33) and fragmented environmental context of Kaynarca Park were correlated with a weak microclimatic performance resulting in low NDVI, high LST and negative PCI values. Overall, the findings suggested that the cooling effect of parks was determined not only by area size, but also by the interaction of morphological features such as vegetation density, spatial continuity and LSI, which reflected the complexity of park form, and that the urban heat island effect strengthened over time as these components weakened.
Regarding the findings on park composition and configuration metrics, Gazhane Park exhibits the strongest ecological structure, with the highest PLANDwater (35.51%), PLANDtree-shrub (39.46%), LPI (37.15%) values, AREA_MN (699 m2) and the lowest PD (0.001) values. These characteristics increase the park’s evapotranspiration capacity, thereby lowering surface temperatures and enabling it to have a greater cooling effect on its surroundings. The park has the highest PCI values, with a peak of 200 m, and the cooling distance is longer (Fig. 8).
Vefa Park has the highest PLANDgrass value (38.66%), a moderate PLAND/forest-shrub covered area value (28.91%), and a very high ED value (2.303). While the high proportion of grassy areas in the park may contribute to its cooling potential, the high edge density indicates that the landscape is fragmented. Such structures generally result in a weaker capacity for microclimatic regulation. Therefore, Vefa Park’s PCI values are moderate, with a cooling effect that increases with distance (Figure 8).
With the highest PLAND impervious value (37.07%), the lowest PLAND water value (0.61%) and the highest PD value (0.003), Kaynarca Park's ecological integrity is weak. The high proportion of impervious surfaces increases surface temperatures, while the fragmented landscape limits the park’s cooling capacity. Consequently, the park’s PCI values are consistently negative and the lowest compared to other parks. As the buffer zone increases, the PCI value decreases further (Fig. 8). The findings show that the cooling effect of parks does not always decrease monotonically with distance, and that the internal landscape characteristics of each park play a decisive role in determining this effect
3.1. Correlation Analysis Results
Pearson correlation analyses were used to examine the correlation between PCI and park metrics. Those analyses showed that the spatial components affecting PCI values differed over the years.
The Pearson correlation analysis between LSI and PCI indicated a positive correlation in both years, suggesting that as park shape complexity grew, the cooling effect tended to grow. In 2025, the relative weakening of the LSI/PCI correlation suggested that parking form alone was insufficient to determine the cooling effect and could not be evaluated independently of the environmental and urban context.
In general, negative correlations tended to lower PCI values in 2015, while positive correlations tended to raise PCI values. The data for 2025 indicated that the relative significance of natural elements such as water and dense vegetation in cooling performance improved over time, while impervious surfaces in particular significantly worsened (Figure 9). Those findings clearly indicated that the microclimatic functions of parks were determined not only by surface area but also by surface composition and ecological characteristics.
When average LST temperatures in parks in 2015 and 2025 were analysed in relation to LSI values, the correlation coefficients were found to be negative for both years (Table 5). This indicated that as the park shape complexity grew, the surface temperatures tended to fall.
3.2. Regression Analysis Results
Principal component analysis (PCA) was done for 2015 and 2025. PCA1 (park area, perimeter length of the park, impermeable surface area of the park; water surface area in the park, and LSI) and PCA2 (tree–shrub covered area, grass area, and NDVI) scores were calculated for each park, and these scores were analysed together with PCI values. In both years, two components with eigenvalues above 1 were found, and 100% of the total variance was explained by these two components. In 2015, the first component explained 61% of the total variance, and the second component explained 39%, and in 2025, 68.2% and 31.8%, respectively.
In both years, PCA1 exhibited positive values. An increase in variables such as impervious surface area and irregular park form led to a decrease in PCI. A moderately strong relationship has been identified between PCA and PCI. In contrast, the correlation between PCA2 and PCI is unidirectional and positive (Figure 10).
In 2015 and 2025, Gazhane Park had the highest PCA1 and PCI values. In contrast, Kaynarca Park had low PCA1 values and negative PCI values. This suggests that a park's structural characteristics play a decisive role in its cooling effect. Vefa Park had high absolute negative PCA2 values and low PCI values. This indicates that, while vegetative components contribute to a park's cooling performance, they may not be sufficient to create a sustainable cooling effect independently. Furthermore, the high PCI output of Gazhane Park shows that the effect of vegetative components cannot be evaluated independently of the structural context. In conclusion, structural components have a stronger and more decisive effect on PCI, while vegetative components play a supportive and complementary role (Figure 11).
This situation highlights the fact that increasing the amount of green space alone is not sufficient for urban park planning and design; structural arrangement, spatial continuity and environmental relations must also be considered.
4. Discussion
The findings of the three parks in the study area in 2015 and 2025 were compared with the national and international literature, and the similar aspects are given below.
The correlation analysis showed very weak and statistically insignificant correlations between the area and perimeter of the parks and PCI, supporting the trend that the size of the park alone was an insufficient factor to explain the cooling effect. Likewise, the literature suggests no significant correlation between park area and cooling effect and highlights that the indoor and outdoor landscape attributes of the park, such as impermeable area, water surface and plant ratio, are more determinant [46,50].
The strong negative correlation between the rate of impervious surface in parks and PCI indicated that the higher hard surface ratio in the park may reduce the cooling effect. Correspondingly, a study conducted in the city of Zhengzhou reported the strongest negative correlation between the rate of impermeable surfaces in parks and PCI [23].
The strong positive correlation between the size of water surfaces and PCI suggested that increased water surfaces strengthened the cooling capacity of the park. This result is compatible with the findings of the literature, which report that water bodies stabilise the microclimate due to their high heat storage capacity, and as the water surface increase, the cooling effect would be strengthened [51,52].
Although Vefa Park was small and linear, the most important factor in producing a positive PCI value was its location by the river. These inferences overlap the view in the literature that park form and riverside location can produce an effect on PCI, regardless of park size [46,53,54,55].
The correlation between the size of green spaces covered by trees and shrubs and PCI is important for showing the tendency that a higher density of vegetation in parks may intensify the cooling effect through evapotranspiration and shading. This result is compatible with studies indicating that plant communities in parks exert significant cooling and moisturising effects [56].
The strong negative correlation between lawn area and PCI suggested that large lawn surfaces may exert a weaker cooling effect compared to densely forested areas due to their high albedo and low evapotranspiration rate. This result is compatible with the finding of a negative correlation between PCI and park lawn area in a study conducted in Changchun, China [57].
The studies in the literature where the distance was limited were conducted in 100-300 m buffer areas [48,58,59,60]. Likewise, 100-300 m buffer distances were used in this study due to the distance limitation. The results obtained in these buffer areas showed that the PCI value dropped as the distance increased. This result is compatible with the literature [17,61,62].
The literature reports that variables such as area, shape index, canopy cover density and the presence of outdoor water significantly affected PCI and cooling area [47,52,63]. This could be explained by the positive PCI in Gazhane and Vefa parks located along the riverside.
Although Kaynarca Park had a large surface area in the study, it consistently showed negative PCI values in 2015 and 2025, and the temperature inside the park was determined to be higher than the surrounding buffer zones. However, some studies conducted in China and Europe have shown a positive correlation between park size and PCI, and that PCI value rises as park size grows [15,64] moreover, PCI values are stronger in large and compact parks, whereas the cooling effect is limited in small parks that are vulnerable to environmental pressures [15,17,59,60]. The findings from Kaynarca Park showed that the area size did not always positively affect the PCI value. The negative PCI observed in Kaynarca Park proves this. The proportional excess of impervious surfaces, vegetation density and low canopy can be listed as factors that might explain this result.
The study showed that as the shape complexity of the parks grew, the cooling effect tended to intensify. This result is compatible with studies in the literature examining the effect of park shape on microclimate [48,58]. Therefore, although the findings from this study were based on a limited sample, they are compatible with the literature that formal attributes could affect the micro-scale thermal environment.
Recently, many studies have emphasised the effect of park size, shape and perimeter/area ratio on PCI [49,65]. Likewise, the strong effect of PCA1 on PCI in this study confirmed that the thermal performance of parks in city centre of Bartın was largely correlated with spatial attributes and area scale. In particular, it could be asserted that the parks with longer perimeters can exchange more heat from the surrounding warm urban fabric, and this affects the PCI values.
Literature contains studies indicating that the effect of the amount of vegetation on PCI is insufficient alone and the type, size, water availability and environmental factors of the plants are at least as important as the amount [54,66,67]. In a similar vein, this study showed that the effect of PCA2 on PCI weakened in 2025. This can be explained by less vegetation cover or more construction around the park.
5. Conclusions
This study compared the cooling capacities of three parks of different scales located in an urban area based on PCI, LST, NDVI, LSI and park metric values to determine their impact on microclimatic performance.
The findings indicate that the cooling capacity of parks depends not only on park size but also on landscape composition and configuration. Parks with high vegetation coverage, water features, large, compact landscape patches and low fragmentation exhibit a higher capacity for microclimatic regulation.
The fact that the cooling effect around the park was strongest at a buffer distance of 100 m, and the cooling effect weakened with increasing distance indicates that the green spaces in the city have a cooling capacity limited by distance. Here, it was concluded that properly positioned parks in the city and parks equipped with the infrastructure to support the microclimate in terms of their attributes could produce a high cooling effect.
As a closing remark, urban cooling is not merely a function of green space quantity but emerges from spatial configuration, structural compactness, and blue–green continuity. Planning strategies should prioritize morphologically coherent and hydrologically integrated park systems over isolated green fragments. Results support configuration-based urban climate adaptation frameworks.
6. Limitations
This study has some limitations. The analysis based on Landsat satellite images with a spatial resolution of 30 m limited the detailed representation of different land cover types inside the parks, especially in small-scale parks. Furthermore, PCI analyses were limited to 100-300 m buffer distances. Due to the close proximity of the parks, it was not possible to take more than three buffers. If more than three buffers were taken, the buffers would overlap each other. This also reduced the number of parks selected. Examining only a small number of parks could have introduced a small sample bias. Furthermore, no socio-spatial equity analysis or thermal comfort modelling has been carried out.
It is considered that the inclusion of factors such as NDBI, topography, wind conditions and urban fabric characteristics in the study, not only the formal metrics of the parks and NDVI in explaining the park cooling effect, and the use of a long-term time interval (such as 2000-2025) will reinforce the results. This study was limited to selected dates representing only the summer season, and seasonal variability and in-situ microclimatic measurements were excluded from the analyses. It would be possible to overcome these limitations with higher resolution data, multi-seasonal analyses and field measurements in future research.
Author Contributions
The conceptualization, resources, methodology, analysis, data curation, original draft, and review and editing of the manuscript were conducted by Deniz Çelik and Pınar Bollukcu. The Landsat satellite data were obtained and processed using ArcMAP 10.8 software by Ömer Faruk Kahraman. All authors read and approved the final manuscript.
Funding
This research received no external funding.
Institutional Review Board Statement
Not applicable.
Informed Consent Statement
Not applicable.
Data Availability Statement
The data and methods used in the research are presented in sufficient detail in the paper.
Acknowledgments
We sincerely thank Prof. Dr. Mehmet Çetin from Ondokuz Mayıs University for his help in revising the draft of the manuscript.
Conflicts of Interest
All authors declare that there is no conflict of interest.
References
- Chunming, H.; Shuaiqi, L.; Xi, D. A new method for evaluate the cold island effect in cities. Urban Clim. 2024, Vol. 54, 101846. [Google Scholar] [CrossRef]
- Wei, Z.; Liu, J.; Gao, X.; Wu, Y.; Liu, Z.; Yao, J. Diurnal variations in cooling effects of urban parks based on ECOSTRESS data: A case study of Beijing. Urban Clim. 2024, Vol. 55, 102229. [Google Scholar] [CrossRef]
- IPCC. Summary for Policymakers. In Climate Change 2021: The Physical Science Basis; Masson-Delmotte, V., Zhai, P., Pirani, A., Connors, S.L., Péan, C., Berger, S., Caud, N., Chen, Y., Goldfarb, L., Gomis, M.I., Huang, M., Leitzell, K., Lonnoy, E., Matthews, J.B.R., Maycock, T.K., Waterfield, T., Yelekçi, O., Yu, R., Zhou, B., Eds.; Cambridge University Press: Cambridge, United Kingdom and New York, NY, USA, 2021; pp. 3–32. [Google Scholar] [CrossRef]
- Santamouris, M. Regulating the damaged thermostat of the cities-status, impacts and mitigation challenges. Energy Build. 2015, Vol. 91, 43–56. [Google Scholar] [CrossRef]
- Kuşçu Şimşek, Ç. Orta ölçekli parkların mikro iklimsel etki alanlarının araştırılması: Gezi Parkı, Maçka Parkı ve Serencebey Parkı örneği. METU J. Fac. Archit. 2016, Vol. 33(No. 2), 1–17. [Google Scholar] [CrossRef]
- Fan, H.; Yu, Z.; Yang, G.; Liu, T.Y.; Liu, T.Y.; Hung, C.H.; Vejre, H. How to cool hot-humid (Asian) cities with urban trees? An optimal landscape size perspective. Agric. For. Meteorol. 2019, Vol. 265, 338–348. [Google Scholar] [CrossRef]
- Chen, X.; Wang, H.; Yang, J. Effect of green blue spaces on the urban thermal environment: A field study in Hong Kong. Urban Clim. 2024, Vol. 55, 101912. [Google Scholar] [CrossRef]
- Wong, N.H.; Chen, Y. Study of green areas and urban heat island in a tropical city. Habitat Int. 2005, Vol. 29(No. 3), 547–558. [Google Scholar] [CrossRef]
- Algretawee, H. The effect of graduated urban park size on park cooling island and distance relative to land surface temperature (LST). Urban Clim. 2022, Vol. 45, 101255. [Google Scholar] [CrossRef]
- BinteAli, S.; Patnaik, S. Assessment of the impact of urban tree canopy on microclimate in Bhopal: A devised low-cost traverse methodology. Urban Clim. 2019, Vol. 27, 430–445. [Google Scholar] [CrossRef]
- Li, Y.; Fan, S.; Li, K.; Ke, K.; Li, D. Contributions of urban green and blue spaces on local-scale climate in the core area of Beijing, China. Urban Ecosyst. 2023, Vol. 26, 1639–1650. [Google Scholar] [CrossRef]
- Setyawan, A.D.; Suhardono, S.; Indrawan, M.; Rarasti, K.A.; Wijayanti, S. Evaluating the cooling potential of green open spaces in urban environments. In Proceedings of the 10th International Conference on Climate Change “Climate Change, Plant and Health”, BIO Web of Conferences; p. 29.01.2025. [CrossRef]
- Shah, A.; Garg, A.; Mishra, V. Quantifying the local cooling effects of urban green spaces: Evidence from Bengaluru, India. Landsc. Urban Plan. 2021, Vol. 209, 104043. [Google Scholar] [CrossRef]
- Liu, Z.; Fu, L.; Wu, C.; Zhang, Z.; Zhang, Z.; Lin, X.; Li, X.; Hu, Y.; Ge, H. Spatialized importance of key factors affecting park cooling intensity based on the park scale. Sustain. Cities Soc. 2023, Vol. 99, 104952. [Google Scholar] [CrossRef]
- Zhu, W.; Sun, J.; Yang, C.; Liu, M.; Xu, X.; Ji, C. How to measure the urban park cooling island? A perspective of absolute and relative indicators using remote sensing and buffer analysis. Remote Sens. 2021, Vol. 13(No. 16), 3154. [Google Scholar] [CrossRef]
- Weng, Q. Thermal infrared remote sensing for urban climate and environmental studies: Methods, applications and trends. ISPRS J. Photogramm. Remote Sens. 2009, Vol. 64(No. 4), 335–344. [Google Scholar] [CrossRef]
- Zhang, J.; Zhang, H.; Qi, R. A study of size threshold for cooling effect in urban parks and their cooling accessibility and equity. Sci. Rep. 2024, Vol. 14, 16176. [Google Scholar] [CrossRef]
- Chibuike, E.M.; Ibukun, A.O.; Abbas, A.; Kunda, J.J. Assessment of green parks cooling effect on Abuja urban microclimate using geospatial techniques. Remote Sens. Appl. Soc. Environ. 2018, Vol. 11, 11–21. [Google Scholar] [CrossRef]
- Zha, Y.; Gao, J.; Ni, S. Use of normalized difference built-up index in automatically mapping urban areas from TM imagery. Int. J. Remote Sens. 2003, Vol. 24(No. 3), 583–594. [Google Scholar] [CrossRef]
- Bowler, D.E.; Buyung-Ali, L.; Knight, T.M.; Pullin, A.S. Urban greening to cool towns and cities: A systematic review of the empirical evidence. Landsc. Urban Plan. 2010, Vol. 97(No. 3), 147–155. [Google Scholar] [CrossRef]
- Norton, B.A.; Coutts, A.M.; Livesley, S.J.; Harris, R.J.; Hunter, A.M.; Williams, N.S.G. Planning for cooler cities: A framework to prioritise green infrastructure to mitigate high temperatures in urban landscapes. Landsc. Urban Plan. 2015, Vol. 134, 127–138. [Google Scholar] [CrossRef]
- Sökmen, E.D.; Aksoy, O. Evaluation of climate justice in open green spaces based on landscape metrics: The case of Istanbul. Urban Ecosyst. 2025, Vol. 28, 156. [Google Scholar] [CrossRef]
- Li, H.; Wang, G.; Tian, G.; Jombach, S. Mapping and analyzing the park cooling effect on urban heat island in an expanding city: A case study in Zhengzhou City, China. Land 2020, Vol. 9(No. 2), 57. [Google Scholar] [CrossRef]
- Yan, L.; Jia, W.; Zhao, S. The cooling effect of urban green spaces in metacities: A case study of Beijing, China’s capital. Remote Sens. 2021, Vol. 13(No. 22), 4601. [Google Scholar] [CrossRef]
- Kuşçu Şimşek, Ç.; Serter, G.; Ödül, H. A study on the cooling capacities of urban parks and their interactions with the surrounding urban patterns. Appl. Spat. Anal. Policy 2022, Vol. 15, 1287–1317. [Google Scholar] [CrossRef]
- Saaroni, H.; Amorim, J.H.; Hiemstra, J.A.; Pearlmutter, D. Urban green infrastructure as a tool for urban heat mitigation: Survey of research methodologies and findings across different climatic regions. Urban Clim. 2018, Vol. 24, 94–110. [Google Scholar] [CrossRef]
- Marzban, F.; Sodoudi, S.; Preusker, R. The influence of land-cover type on the relationship between NDVI–LST and LST-Tair. Int. J. Remote Sens. 2017, Vol. 39(No. 5), 1377–1398. [Google Scholar] [CrossRef]
- Trotter, L.; Dewan, A.; Robinson, T. Effects of rapid urbanisation on the urban thermal environment between 1990 and 2011 in Dhaka Megacity, Bangladesh. AIMS Environ. Sci. 2017, Vol. 4(No. 1), 145–167. [Google Scholar] [CrossRef]
- Cetin, M.; Ozenen Kavlak, M.; Senyel Kurkcuoglu, M.A.; Ozturk, G.B.; Cabuk, S.N.; Cabuk, A. Determination of land surface temperature and urban heat island effects with remote sensing capabilities: The case of Kayseri, Türkiye. Nat. Hazards 2024, Vol. 120, 5509–5536. [Google Scholar] [CrossRef]
- Yılmaz, E. Landsat görüntüleri ile Adana yüzey ısı adası. Coğrafi Bilim. Derg. 2015, Vol. 13(No. 2), 115–138. [Google Scholar] [CrossRef]
- Menteş, Y.; Yilmaz, S.; Qaid, A. The cooling effect of different scales of urban parks on land surface temperatures in cold regions. Energy Build. 2024, Vol. 308, 113954. [Google Scholar] [CrossRef]
- Yüksel, A.T.; Coskun Hepcan, Ç. Kentsel yüzey sıcaklığı ve mavi-yeşil altyapı ilişkisi: Karşıyaka örneği. Adnan Menderes ÜNiversitesi Ziraat Fakültesi Derg. 2023, Vol. 20(No. 1), 91–98. [Google Scholar] [CrossRef]
- Anonymous. Bartın 2023 Strategic Objectives and Provincial Development Plan; Bartın Governor's Office: Bartın, Türkiye, 2008; p. 440 pp. ISBN 9789755858807. [Google Scholar]
- General Directorate of Meteorology (GDM). Official Climate Statistics. Available online: https://www.mgm.gov.tr/veridegerlendirme/il-ve-ilceler-istatistik.aspx?m=BARTIN (accessed on 22 August 2025).
- Turkish Statistical Institute (TSI). Address-based population registration system results. Available online: https://biruni.tuik.gov.tr/medas/?kn=95&locale=tr (accessed on 12 September 2025).
- Çelik, D. Parkların erişebilirlik ve mekânsal analizleri: Bartın örneği. In Akademik Araştırma, Uygulama ve Güncel Gelişmeler, 1st ed.; Kayahan, K., Çelik, D., Eds.; Detay Yayıncılık: Ankara, Türkiye, 2022; pp. 2–22. [Google Scholar]
- Xiong, Y.; Xie, X.; Yang, Y. Evaluation and optimization of park cooling benefits based on cumulative impact and landscape pattern. Sci. Rep. 2024, Vol. 14, 25092. [Google Scholar] [CrossRef] [PubMed]
- Copernicus Land Monitoring Service (CLMS). Corine Maps of Bartın. Available online: https://land.copernicus.eu/en/products/corine-land-cover (accessed on 6 June 2025).
- Dal, İ. Climate Smart City and Landscape Context in the Framework of Sustainability: Case of Bartın. Dissertation 2025. [Google Scholar]
- United States Geological Survey (USGS). Landsat 8 Satellite Images. Available online: https://earthexplorer.usgs.gov (accessed on 17 July 2025).
- Blachowski, J.; Hajnrych, M. Assessing the cooling effect of four urban parks of different sizes in a temperate continental climate zone: Wroclaw (Poland). Forests 2021, Vol. 12(No. 8), 1136. [Google Scholar] [CrossRef]
- Chang, C.R.; Li, M.H.; Chang, S.D. Assessing the cooling effect of urban parks using remote sensing data. Urban For. Urban Green. 2021, Vol. 58, 126945. [Google Scholar]
- Feng, X.; Yu, J.; Xin, C.; Ye, T.; Wang, T.; Chen, H.; Zhang, X.; Zhang, L. Quantifying and comparing the cooling effects of three different morphologies of urban parks in Chengdu. Land 2023, Vol. 12(No. 2), 451. [Google Scholar] [CrossRef]
- Zhu, W.; Sun, J.; Yang, C.; Liu, M.; Xu, X.; Ji, C. How to measure the urban park cooling island? A perspective of absolute and relative indicators using remote sensing and buffer analysis. Remote Sens. 2021, Vol. 13(No. 16), 3154. [Google Scholar] [CrossRef]
- Zhao, X.; Kong, K.; Wang, R.; Liu, J.; Deng, Y.; Yin, L.; Zhang, B. Assessing the cooling effects of urban parks and their potential influencing factors: Perspectives on maximum impact and accumulation effects. Sustainability 2025, Vol. 17(No. 15), 7015. [Google Scholar] [CrossRef]
- Wang, L.; Wang, W.; Tang, F.; Xu, H. Optimizing urban park cooling effects requires balancing morphological design and landscape structure. Sci. Rep. 2025, Vol. 15, 15435. [Google Scholar] [CrossRef]
- Li, W.; Wu, T.; Xuan, L.; Zhu, K.; Yu, L.; Wang, Y.; Wang, X.; Yu, K. Quantifying and mapping the cooling effect and equity of urban parks during extreme heat events in coastal cities. Land 2024, Vol. 13(No. 10), 1607. [Google Scholar] [CrossRef]
- Cai, X.; Yang, J.; Zhang, Y.; Xiao, X.; Xia, J. Cooling island effect in urban parks from the perspective of internal park landscape. Humanit. Soc. Sci. Commun. 2023, Vol. 10, 1–12. [Google Scholar] [CrossRef]
- Gao, Y.; Pan, H.; Tian, L. Analysis of the spillover characteristics of cooling effect in an urban park: A case study in Zhengzhou city. Front. Earth Sci. 2023, Vol. 11, 1133901. [Google Scholar] [CrossRef]
- Ghale, B.; Mamgain, S.; Gupta, K.; Roy, A. Urban Parks and their Cooling Potential: Evaluating How Park Characteristics Affects Land Surface Temperature. In Proceedings of the ASPRS 2024 Annual Conference at Geo Week Virtual Conference, Denver, Colorado, USA, 11–13 February 2024. [Google Scholar] [CrossRef]
- Qiao, Y.; Sun, H.; Qi, J.; Liu, S.; Li, J.; Ji, Y.; Wang, H.; Peng, Y. Examining water bodies' cooling effect in urban parks with buffer analysis and random forest regression. Urban Clim. 2025, Vol. 59, 102301. [Google Scholar] [CrossRef]
- Liao, W.; Guldmann, J.-M.; Hu, L.; Cao, Q.; Gan, D.; Li, X. Linking urban park cool island effects to the landscape patterns inside and outside the park: A simultaneous equation modeling approach. Landsc. Urban Plan. 2023, Vol. 232, 104681. [Google Scholar] [CrossRef]
- Spronken-Smith, R.A.; Oke, T.R. The thermal regime of urban parks in two cities with different summer climates. Int. J. Remote Sens. 1998, Vol. 19(No. 11), 2085–2104. [Google Scholar] [CrossRef]
- Norouzi, M.; Chau, H.-W.; Jamei, E. Design and site-related factors impacting the cooling performance of urban parks in different climate zones: A systematic review. Land 2024, Vol. 13(No. 12), 2175. [Google Scholar] [CrossRef]
- Deng, Y.; Yao, Y.; Zhang, L. Analysis of urban wetland park cooling effects and their potential influence factors: Evidence from 477 urban wetland parks in China. Ecol. Indic. 2023, Vol. 156, 111103. [Google Scholar] [CrossRef]
- Bao, Y.; Gao, M.; Luo, D.; Zhou, X. The influence of plant community characteristics in urban parks on the microclimate. Forests 2022, Vol. 13(No. 9), 1342. [Google Scholar] [CrossRef]
- Yang, C.; He, X.; Yu, L.; Yang, J.; Yan, F.; Bu, K.; Chang, L.; Zhang, S. The cooling effect of urban parks and its monthly variations in a snow climate city. Remote Sens. 2017, Vol. 9(No. 10), 1066. [Google Scholar] [CrossRef]
- Chibuike, E.; Ibukun, A.; Abbas, A.; Kunda, J. Assessment of green parks cooling effect on Abuja urban microclimate using geospatial techniques. Remote Sens. Appl. Soc. Environ. 2018, Vol. 11, 11–21. [Google Scholar] [CrossRef]
- Wang, T.; Tu, H.; Min, B.; Li, Z.; Li, X.; You, Q. The mitigation effect of park landscape on thermal environment in Shanghai city based on remote sensing retrieval method. Int. J. Environ. Res. Public Health 2022, Vol. 19(No. 5), 2949. [Google Scholar] [CrossRef]
- Soltanifard, H.; Amani-Beni, M. The cooling effect of urban green spaces as nature-based solutions for mitigating urban heat: Insights from a decade-long systematic review. Clim. Risk Manag. 2025, Vol. 49, 100731. [Google Scholar] [CrossRef]
- Aram, F.; Solgi, E.; García, E.; Mosavi, A.; Várkonyi-Kóczy, A. The cooling effect of large-scale urban parks on surrounding area thermal comfort. Energies 2019, Vol. 12, 3904. [Google Scholar] [CrossRef]
- Liu, Y.; Xu, X.; Wang, F.; Qiao, Z.; An, H.; Han, D.; Luo, J. Exploring the cooling effect of urban parks based on the ECOSTRESS land surface temperature. Front. Ecol. Evol. 2022, Vol. 10, 1031517. [Google Scholar] [CrossRef]
- Zheng, S.; Liu, L.; Dong, X.; Hu, Y.; Niu, P. Dominance of influencing factors on cooling effect of urban parks in different climatic regions. Int. J. Environ. Res. Public Health 2022, Vol. 19(No. 23), 15496. [Google Scholar] [CrossRef]
- Zhang, T.; Zhang, J.; Yang, N.; Li, J.; Gao, Y.; Zhang, L.; Li, S. Cooling effects of urban park green spaces in Downtown Qingdao. Sustainability 2025, Vol. 17(No. 10), 4521. [Google Scholar] [CrossRef]
- Wu, T.; Wang, X.; Xuan, L.; Yan, Z.; Wang, C.; Du, C.; Su, Y.; Duan, J.; Yu, K. How to plan urban parks and the surrounding buildings to maximize the cooling effect: A case study in Xi’an, China. Land 2024, Vol. 13, 1117. [Google Scholar] [CrossRef]
- Xie, Q.; Li, J. Detecting the cool island effect of urban parks in Wuhan: A city on rivers. Int. J. Environ. Res. Public Health 2020, Vol. 18(No. 1), 132. [Google Scholar] [CrossRef]
- Wang, X.; Cheng, H.; Xi, J.; Yang, G.; Zhao, Y. Relationship between park composition, vegetation characteristics and cool island effect. Sustainability 2018, Vol. 10, 587. [Google Scholar] [CrossRef]
Figure 2.
Corine maps (a) 1990 and (b) 2018.
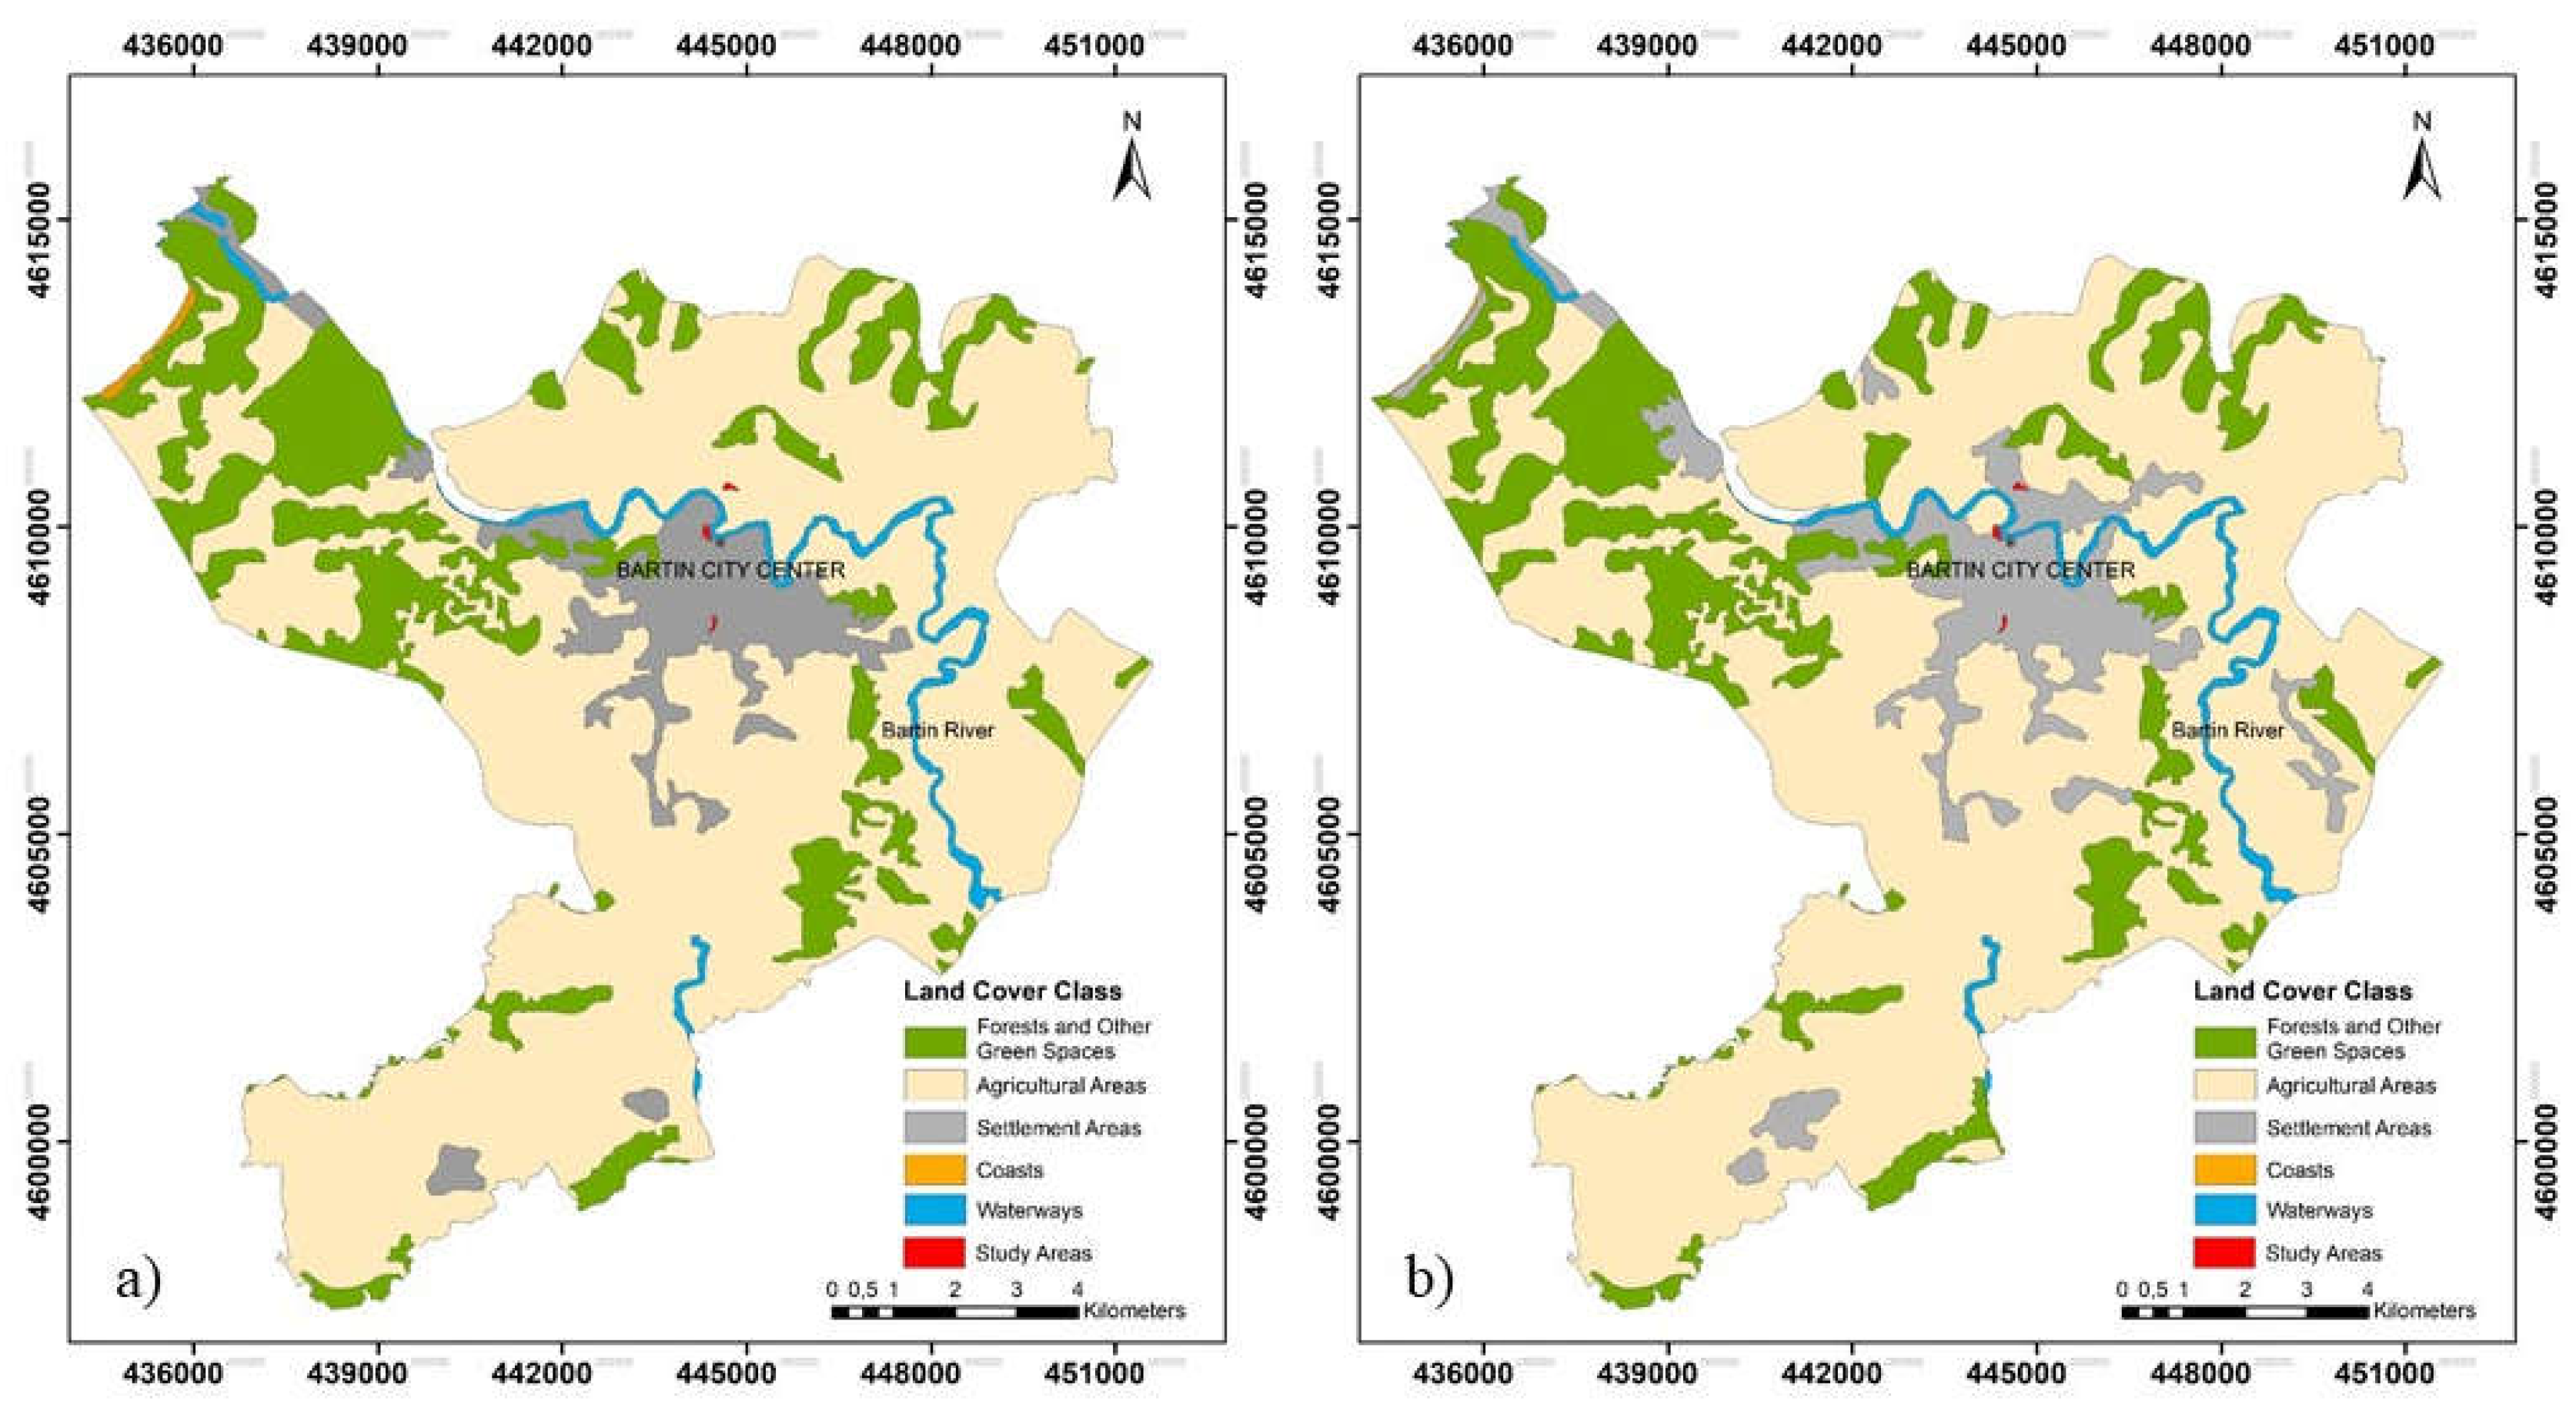
Figure 3.
Parks and their buffer zones.
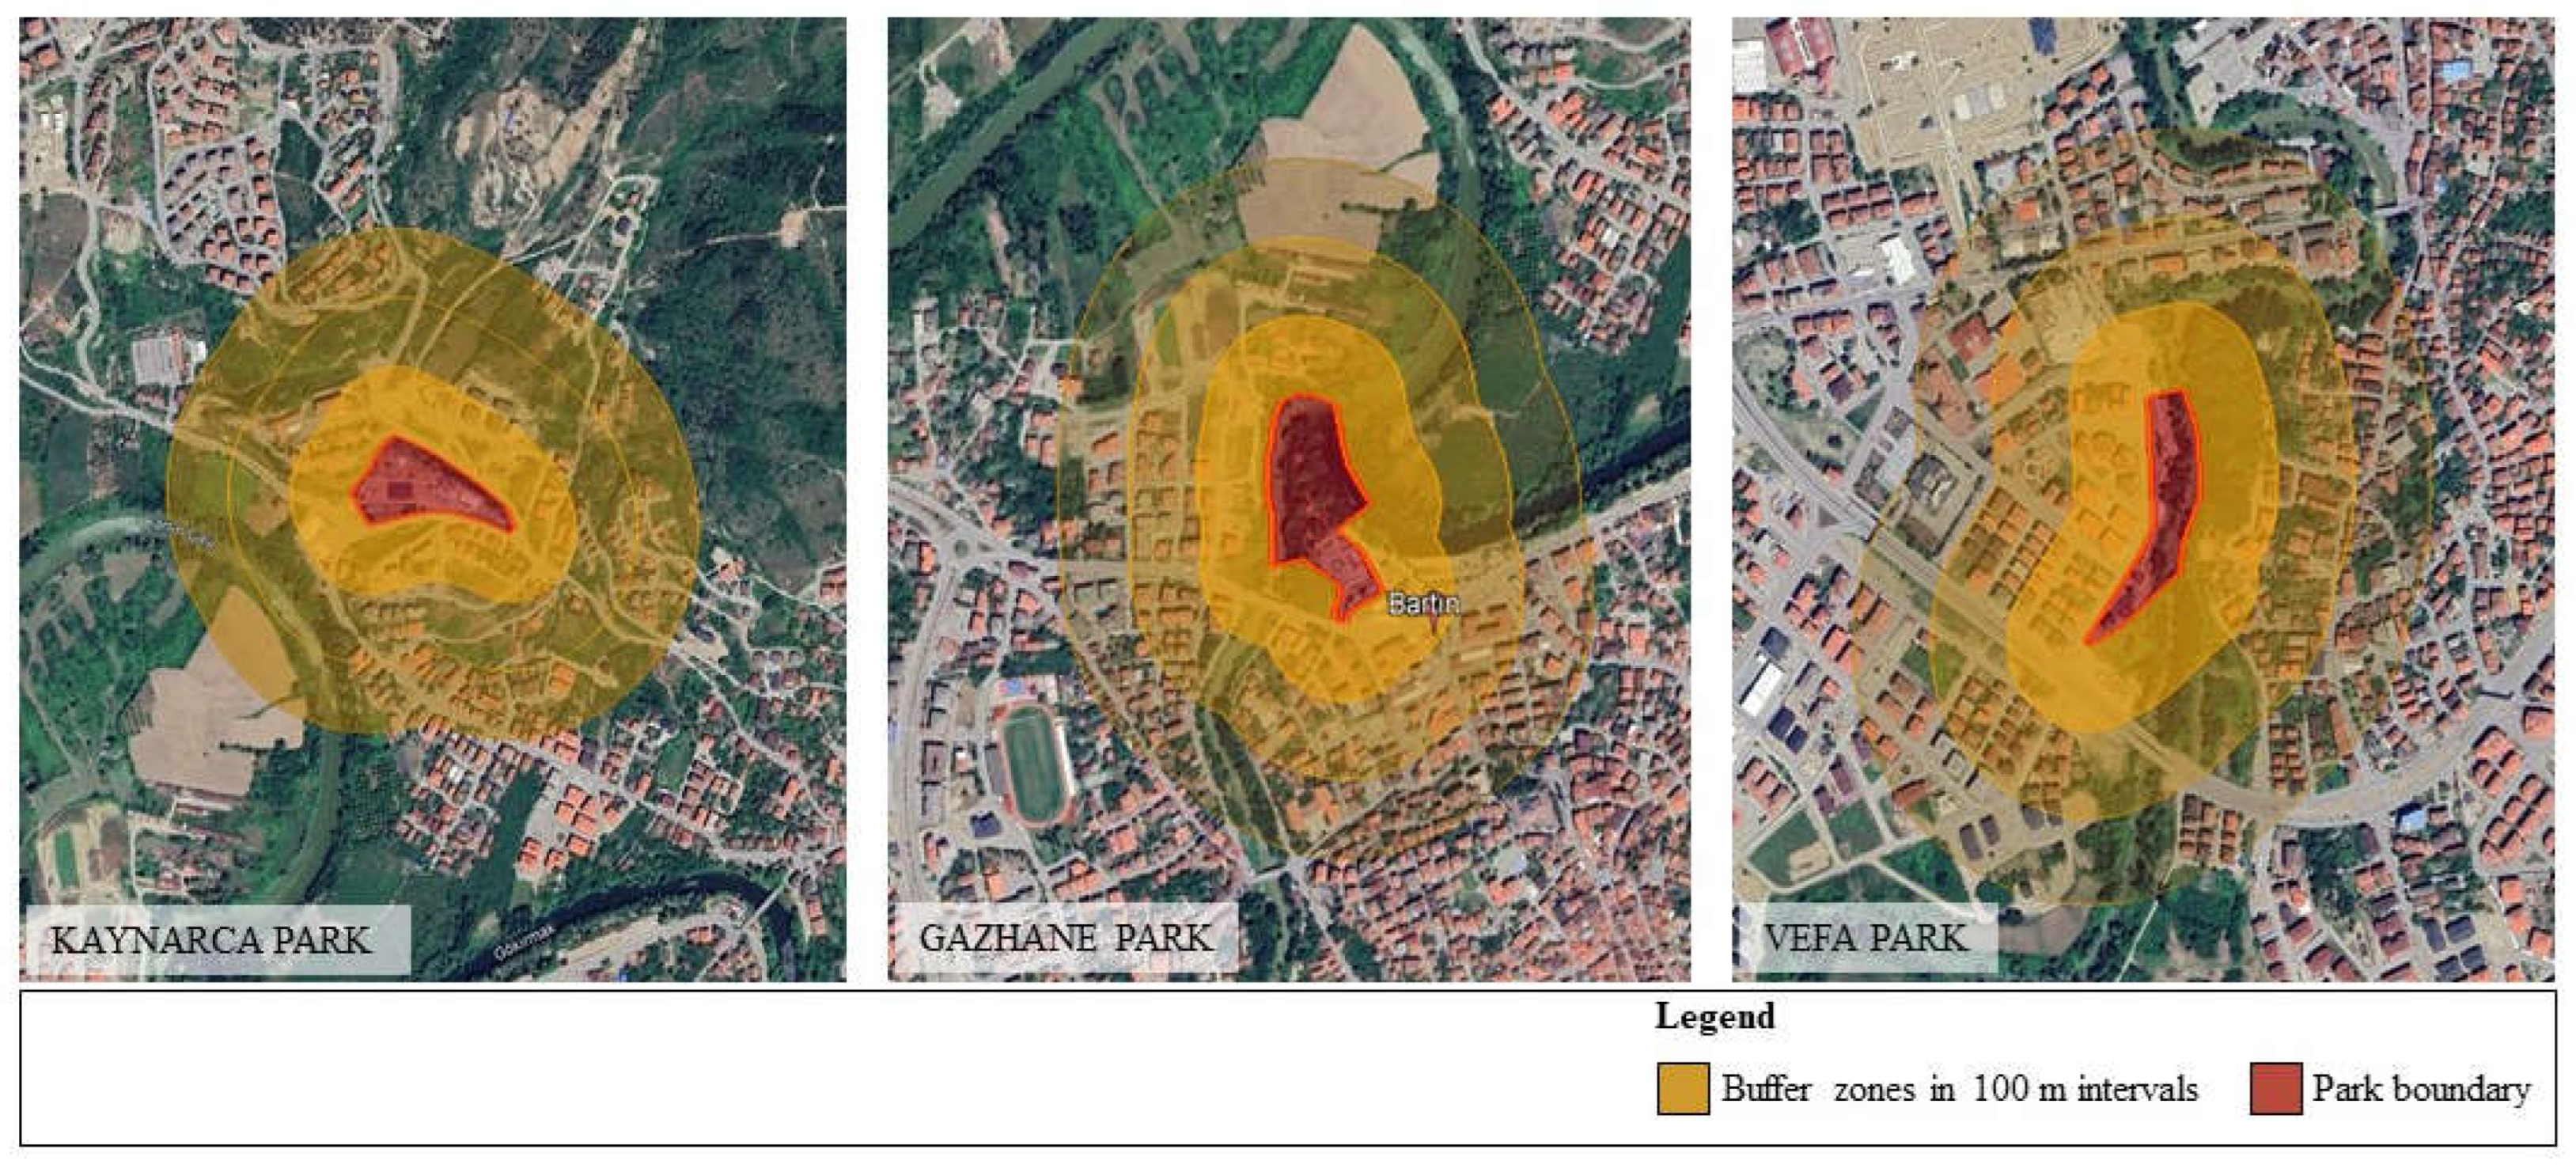
Figure 4.
LST maps of the parks and their buffer zones for the years 2015 and 2025.
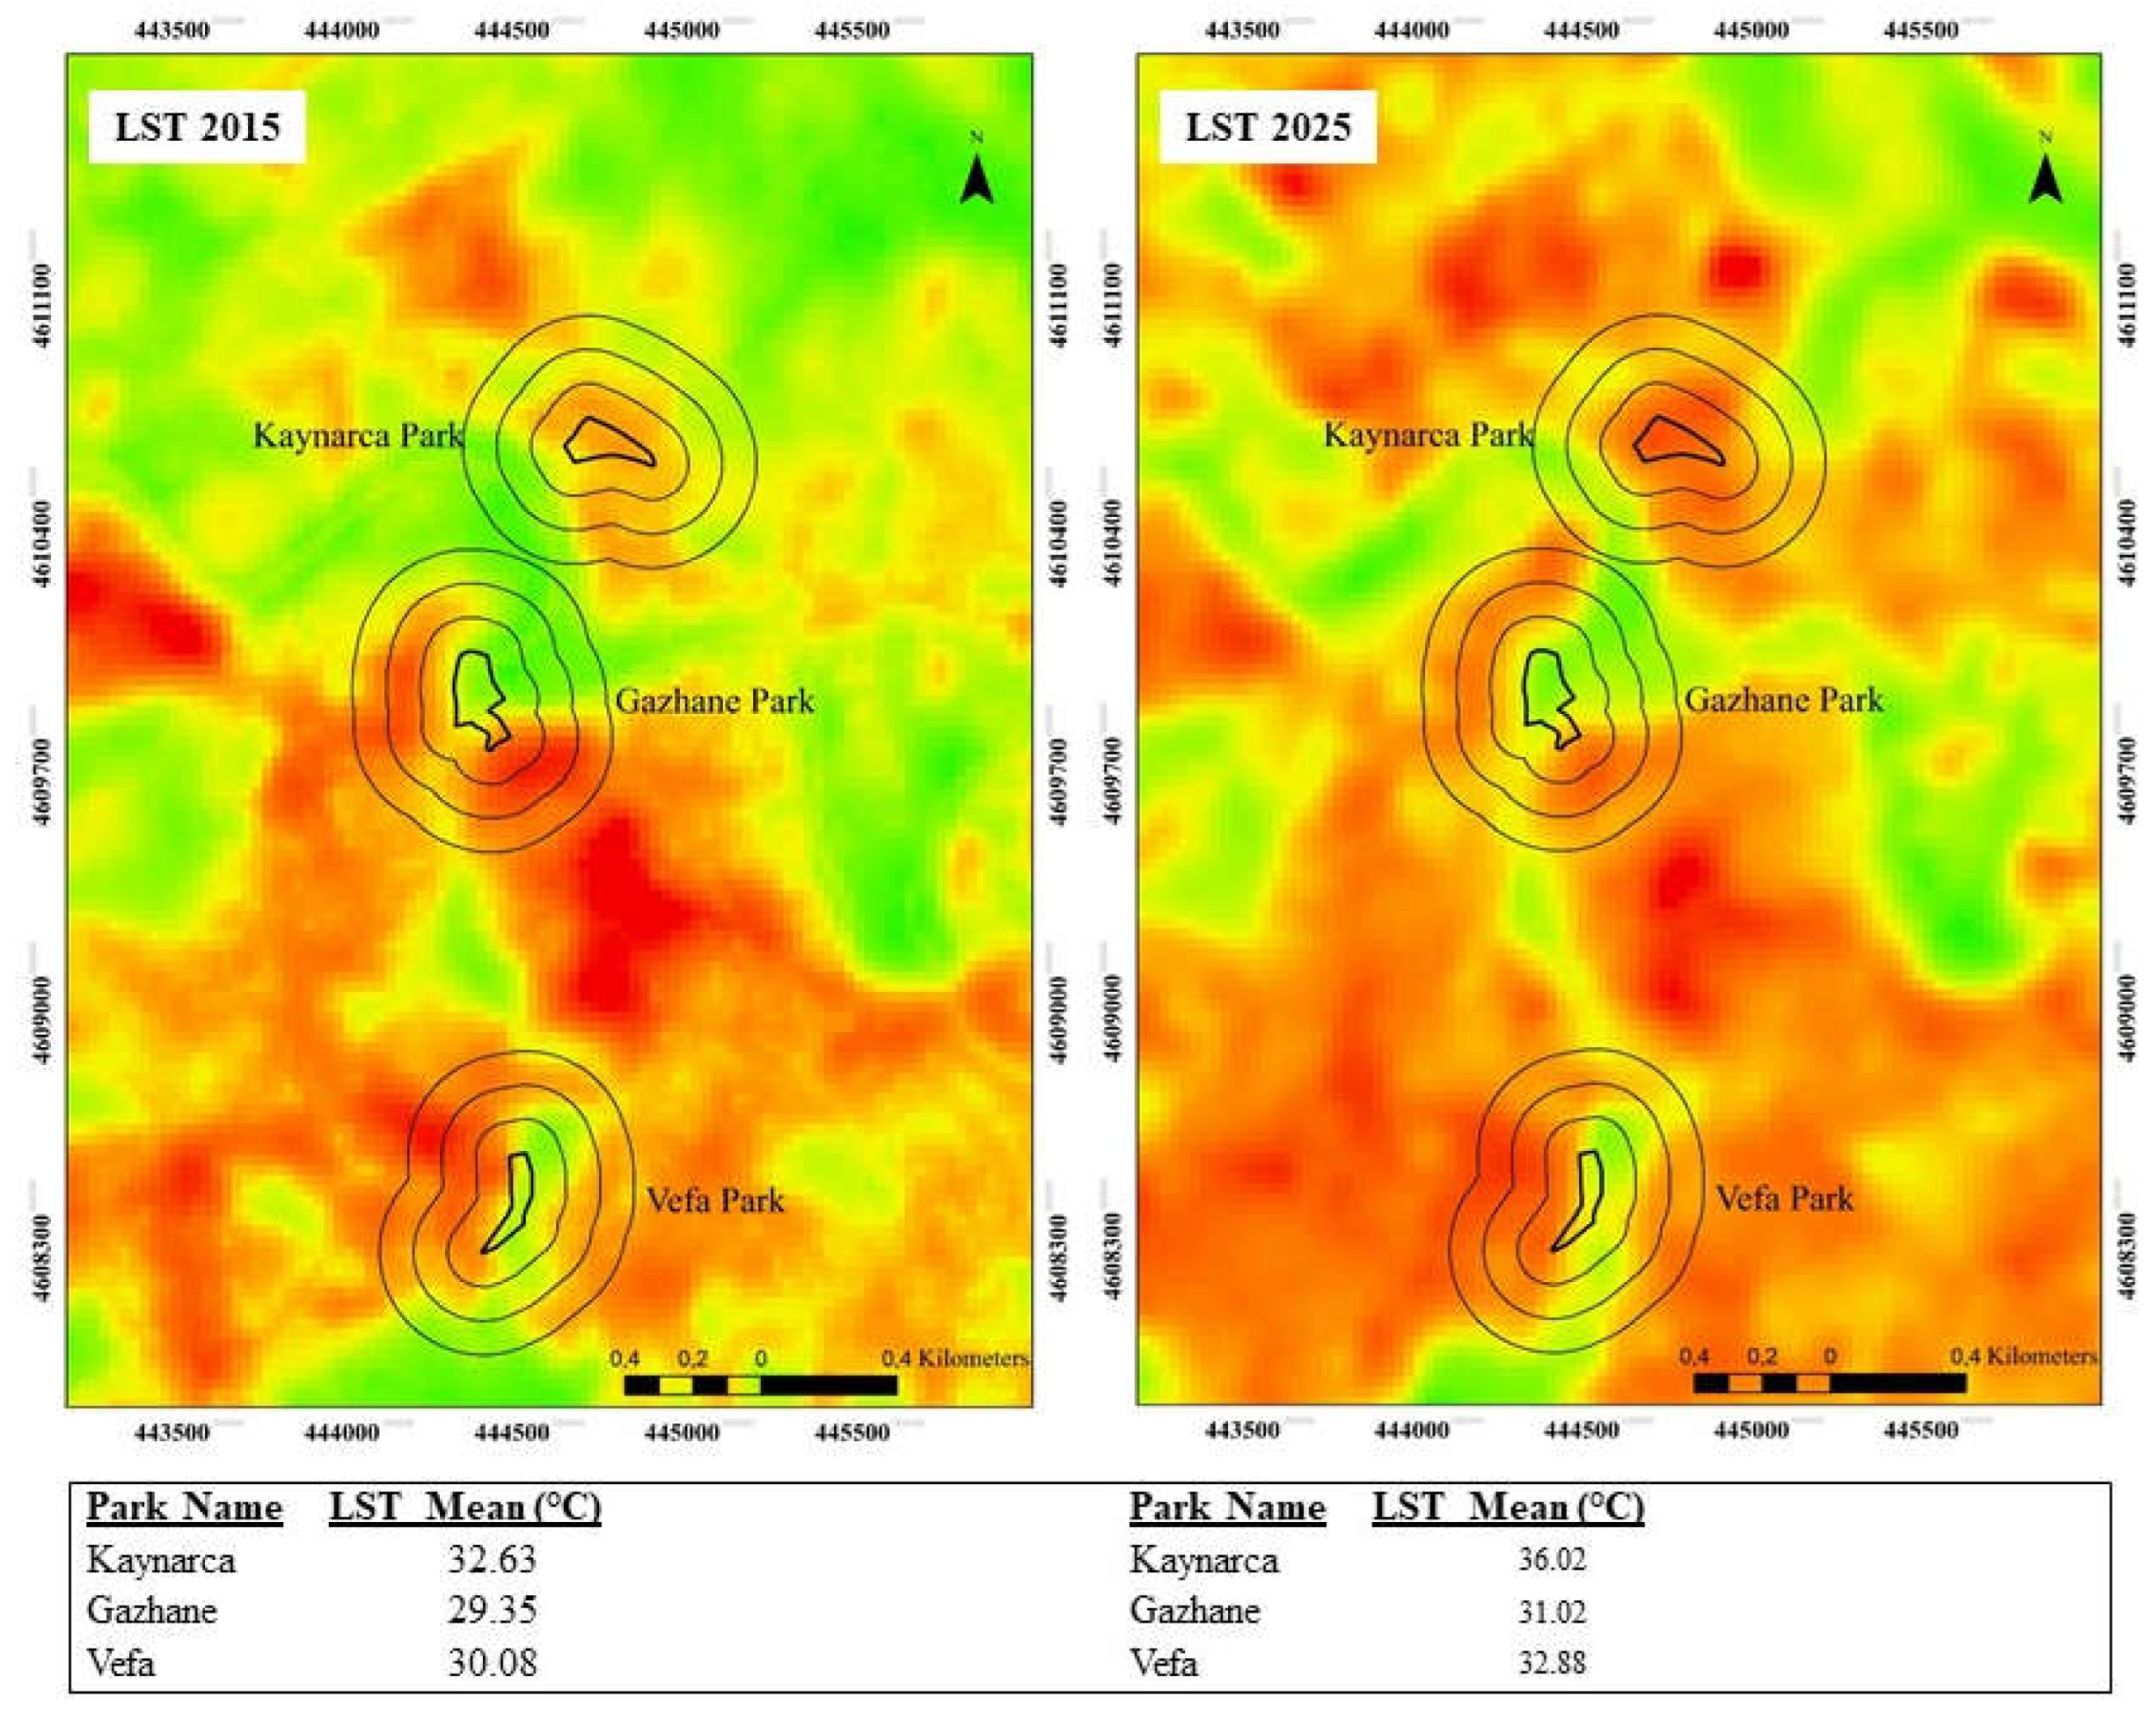
Figure 5.
Minimum and maximum NDVI map of park and buffer zones for the years 2015 and 2025.
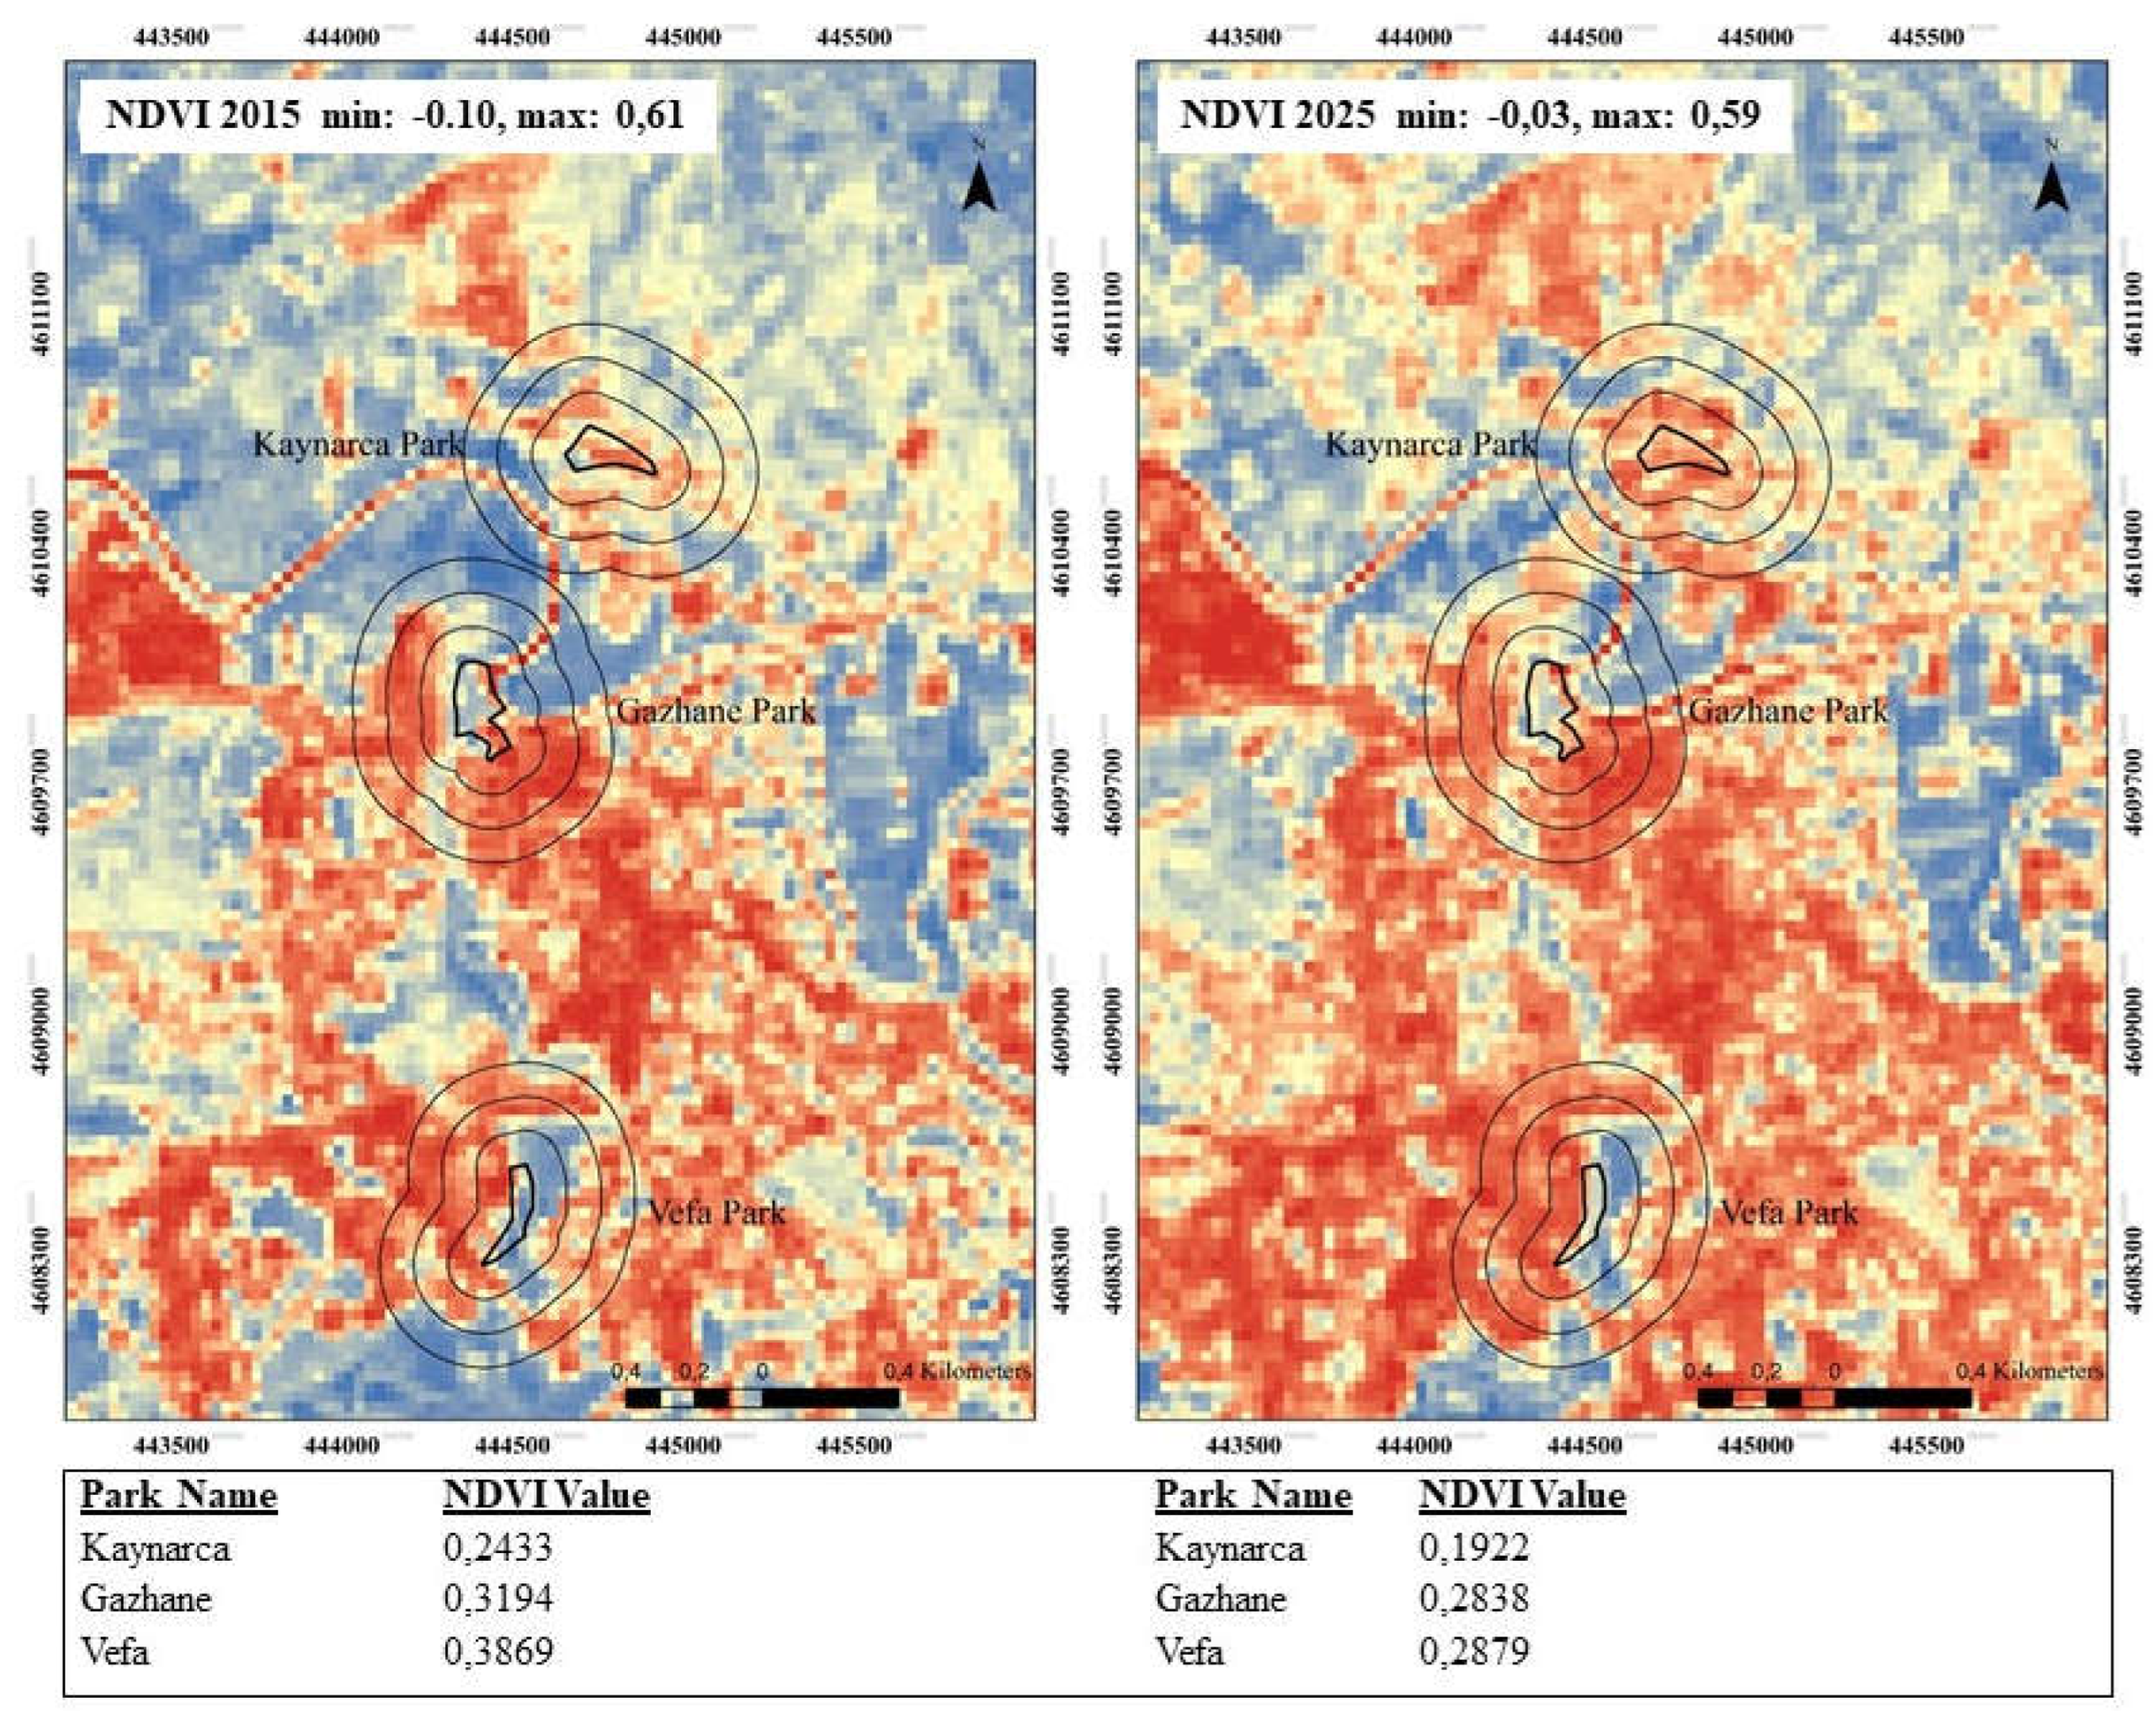
Figure 6.
Min. and max. LST graph for parks and buffer zones for the years 2015 and 2025.
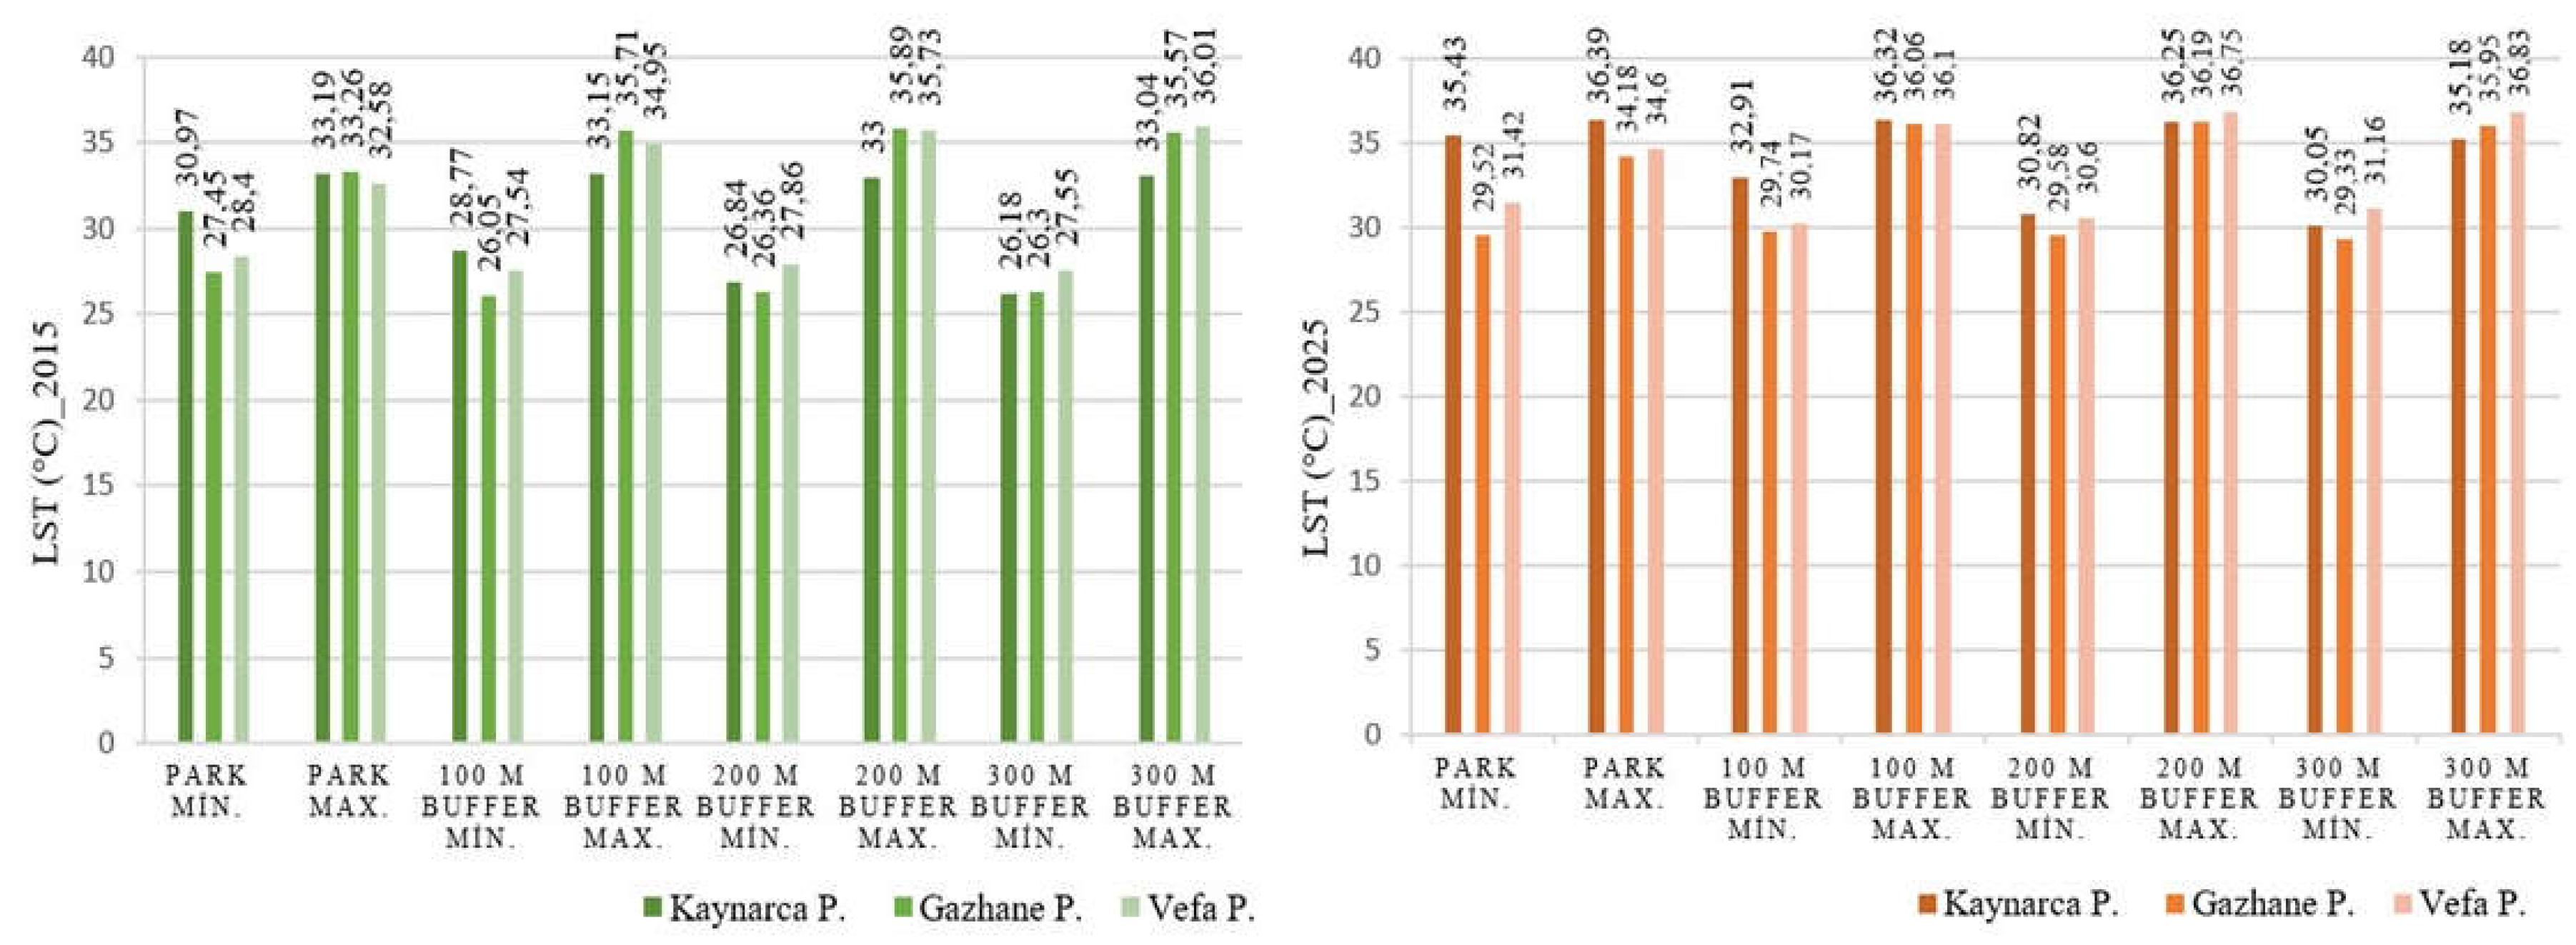
Figure 7.
PCI values graph for parks and buffer zones for the years 2015 and 2025.
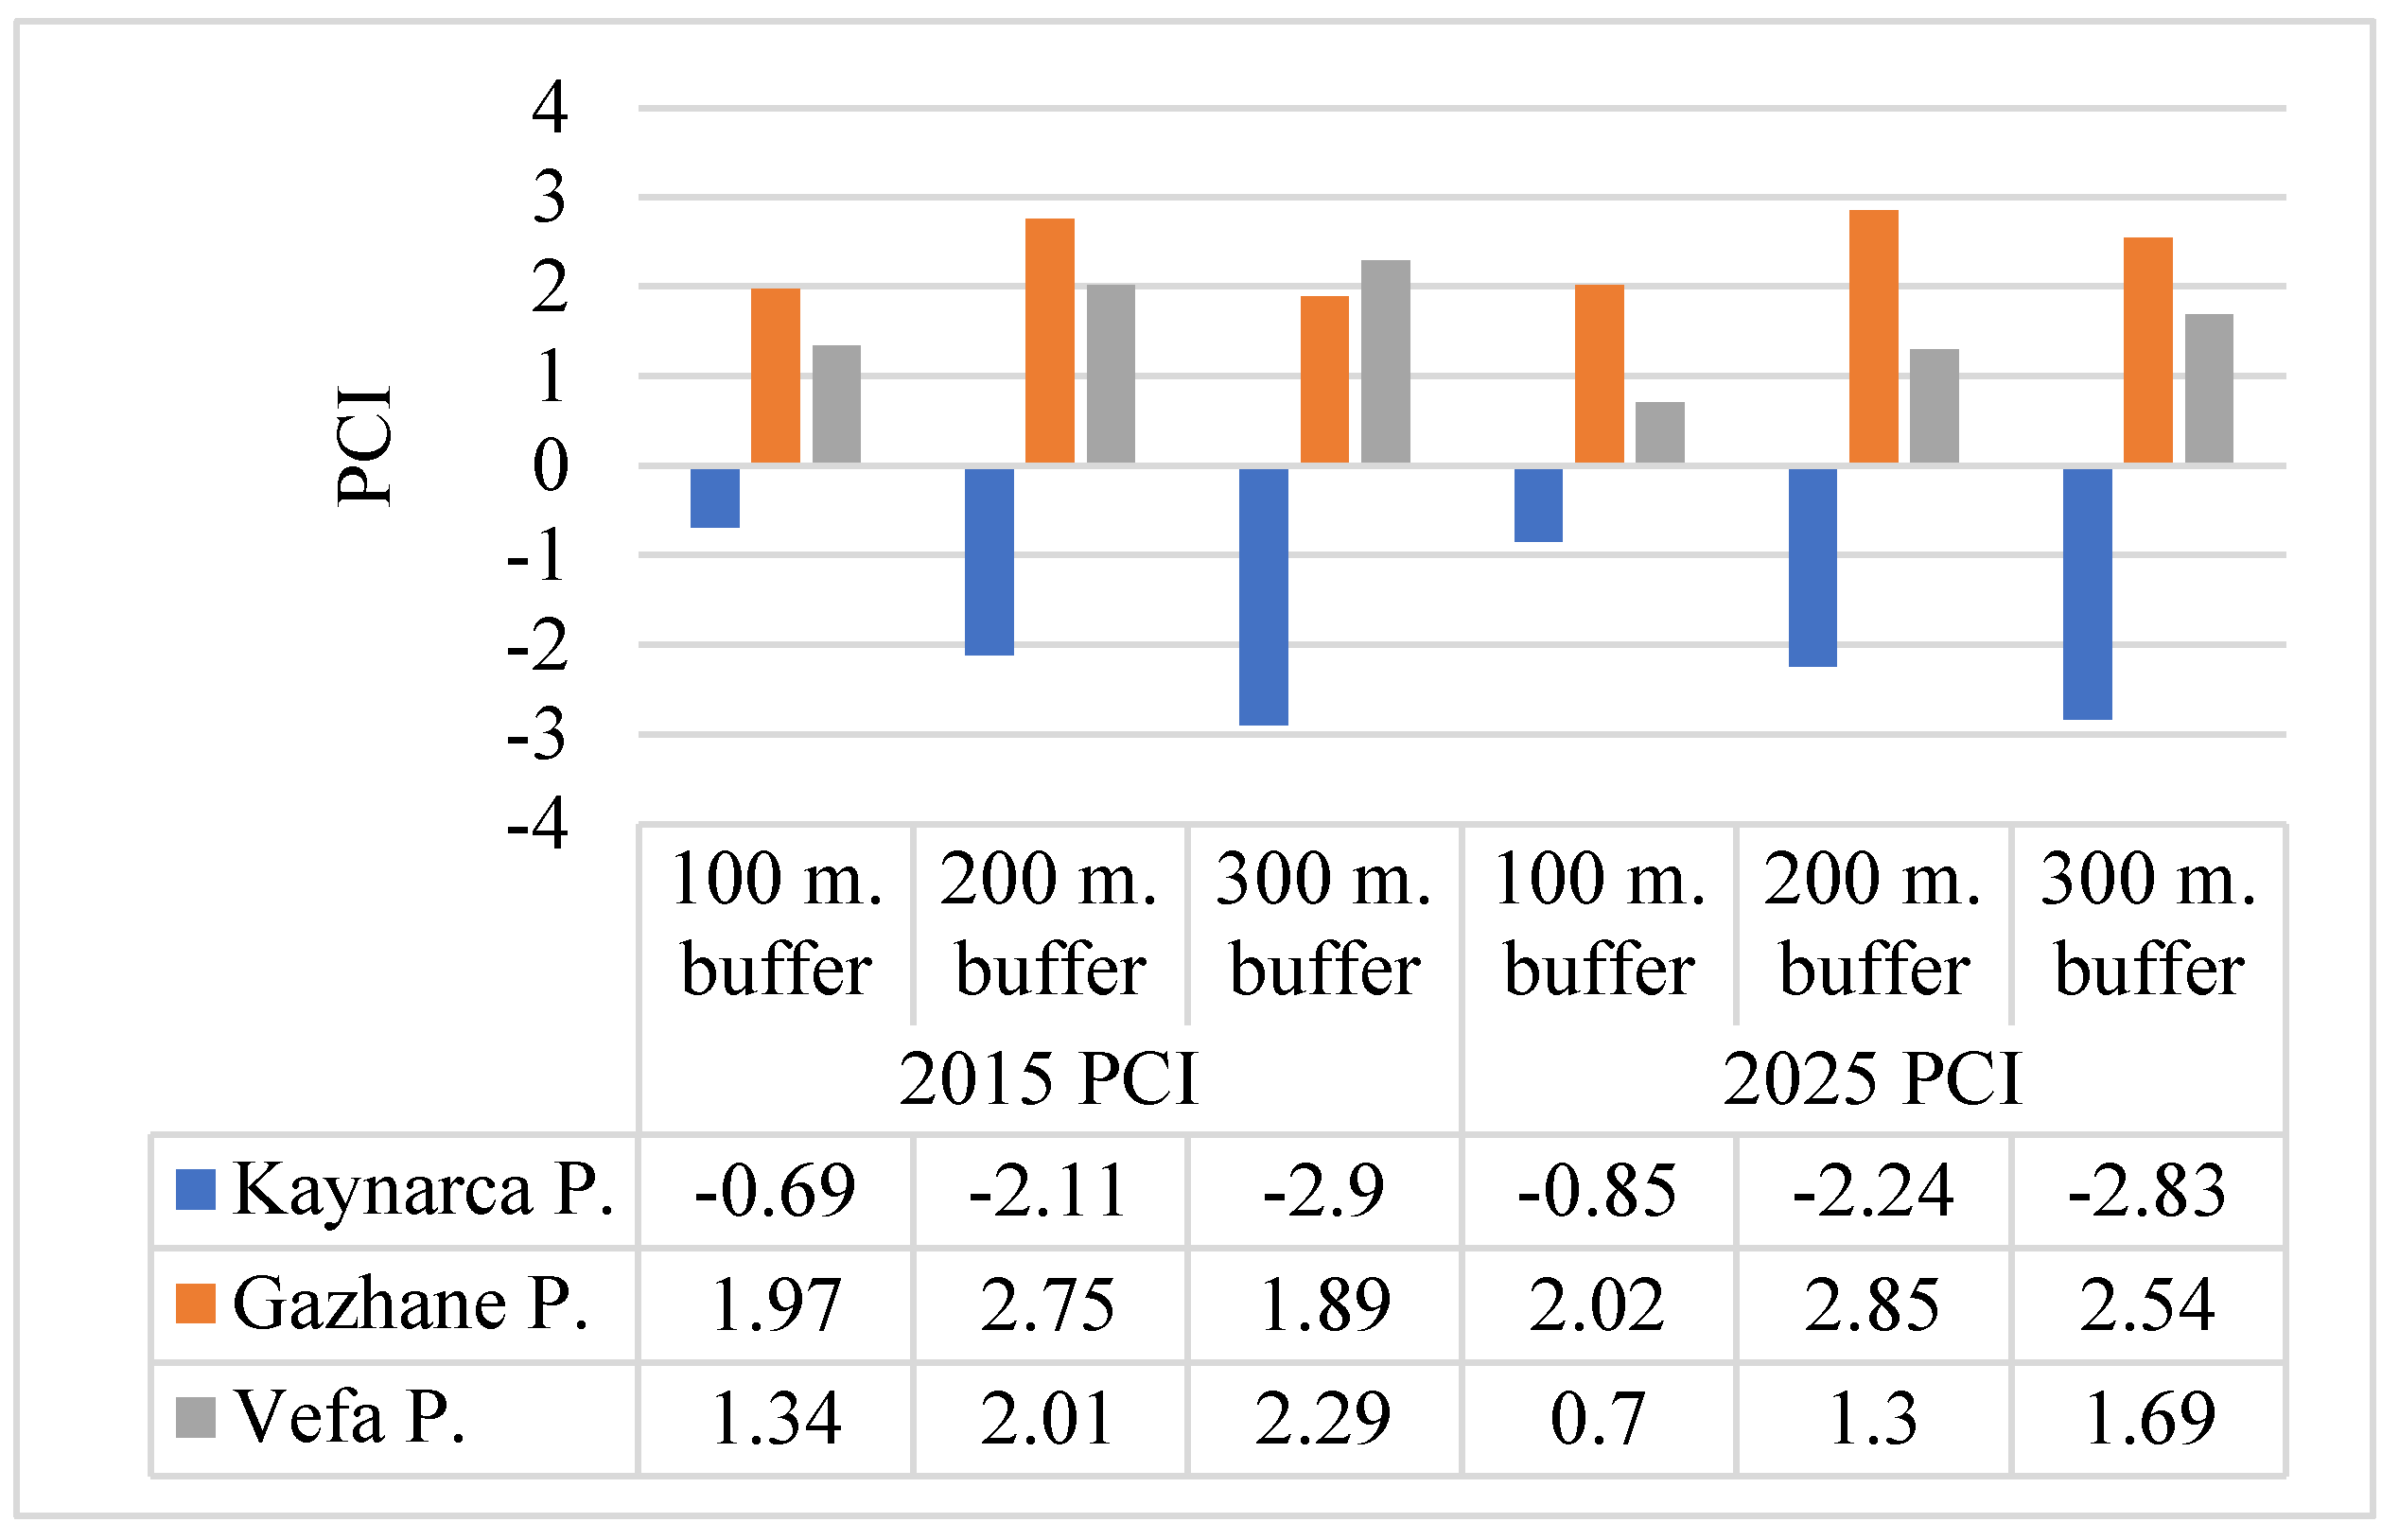
Figure 8.
PCI and Buffer relationship.
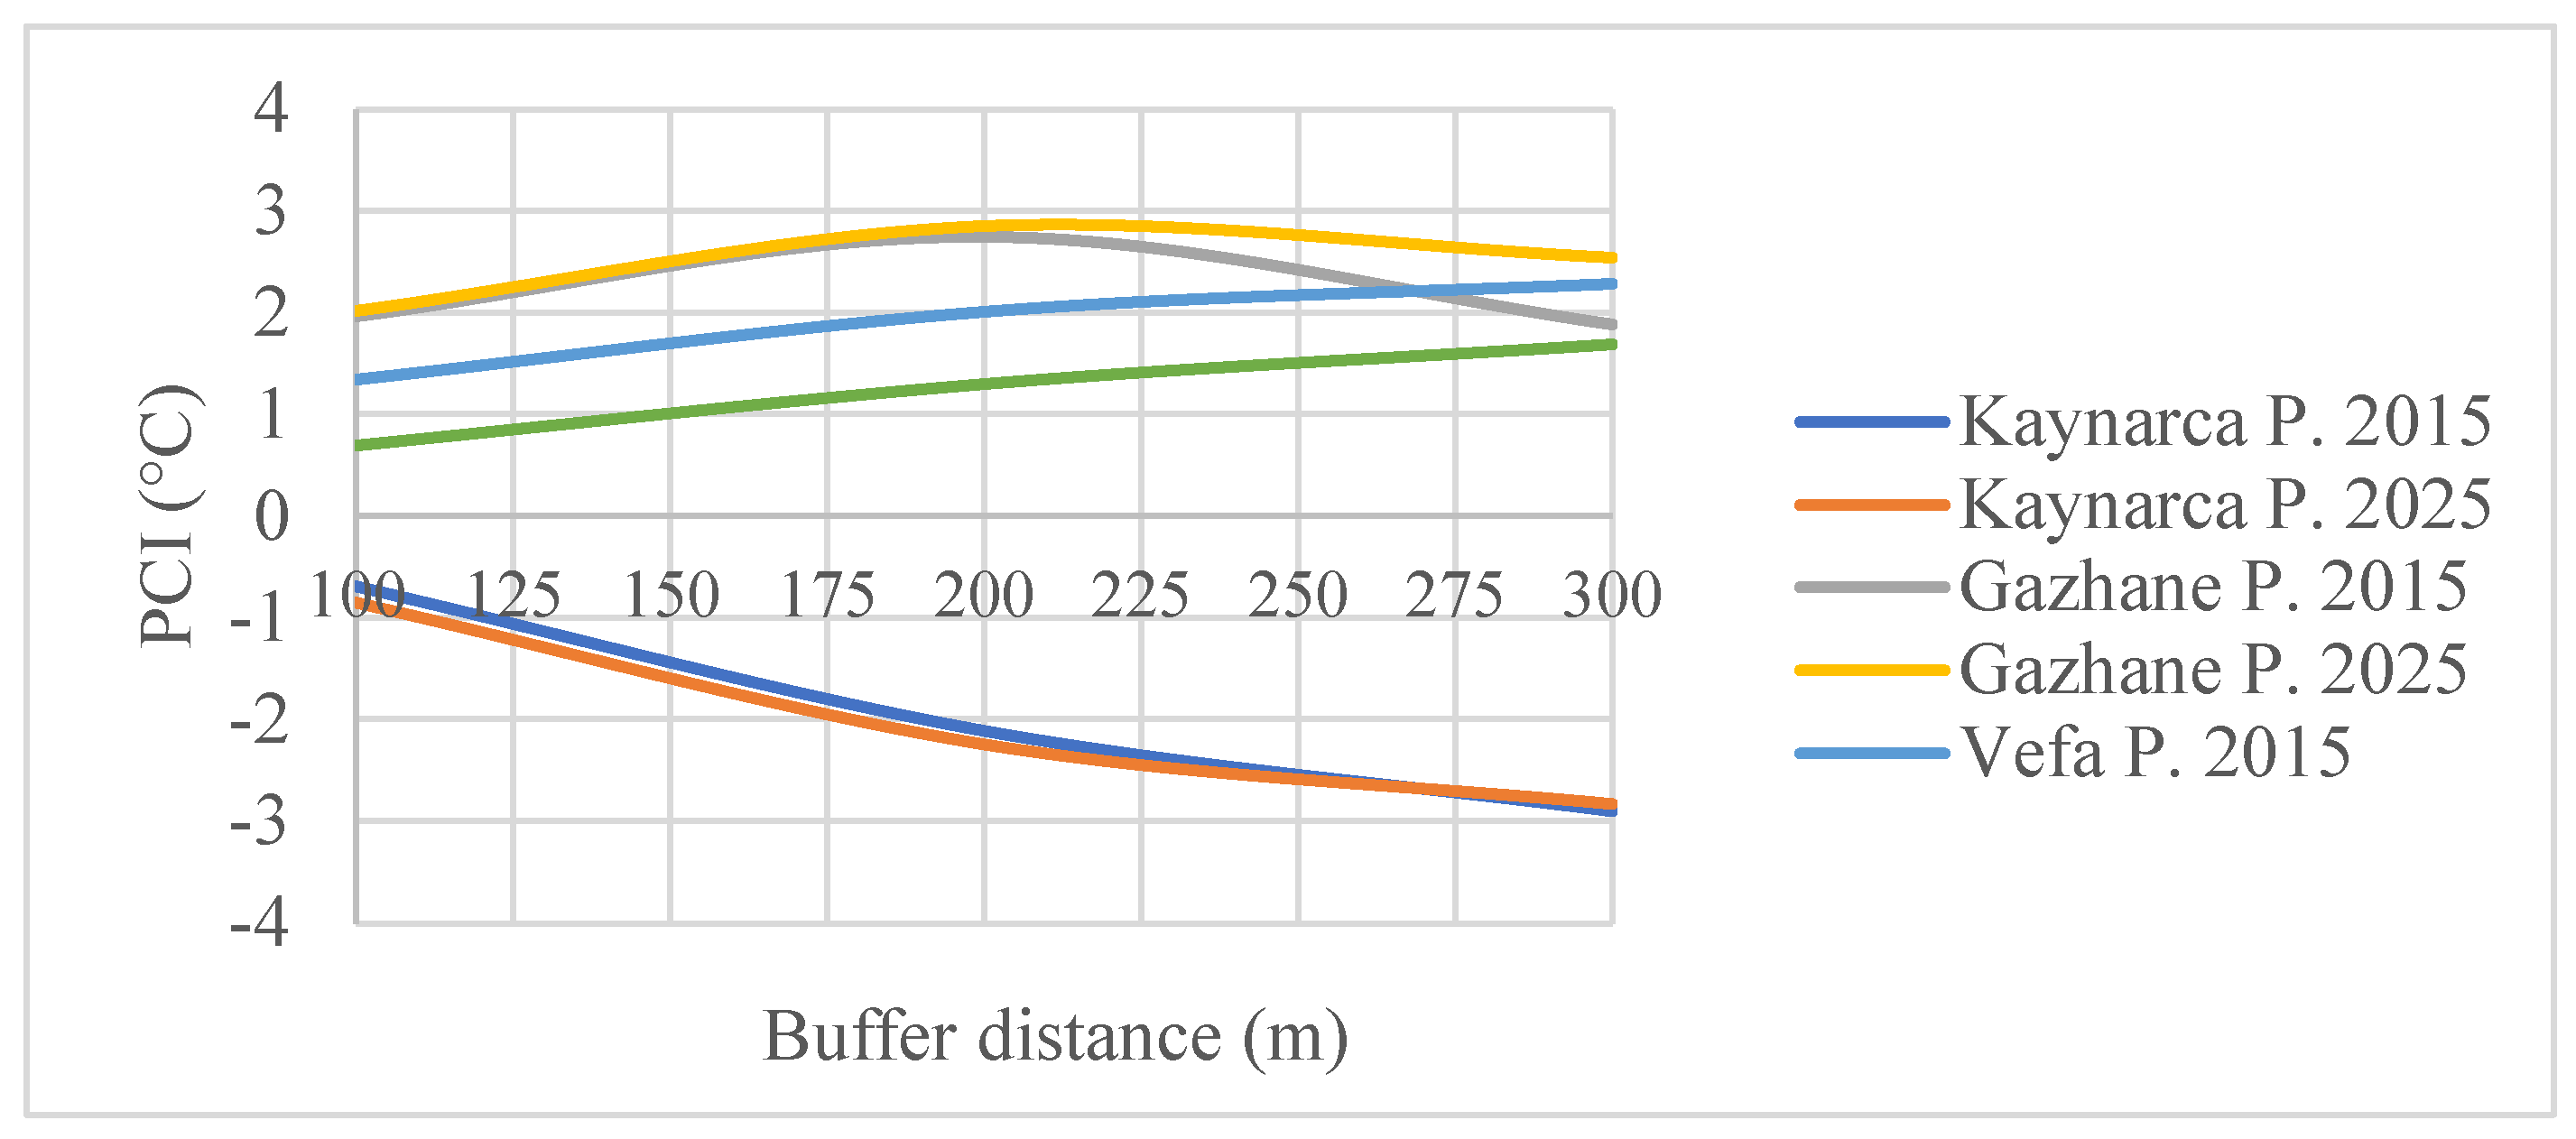
Figure 9.
Pearson’s correlation graph.
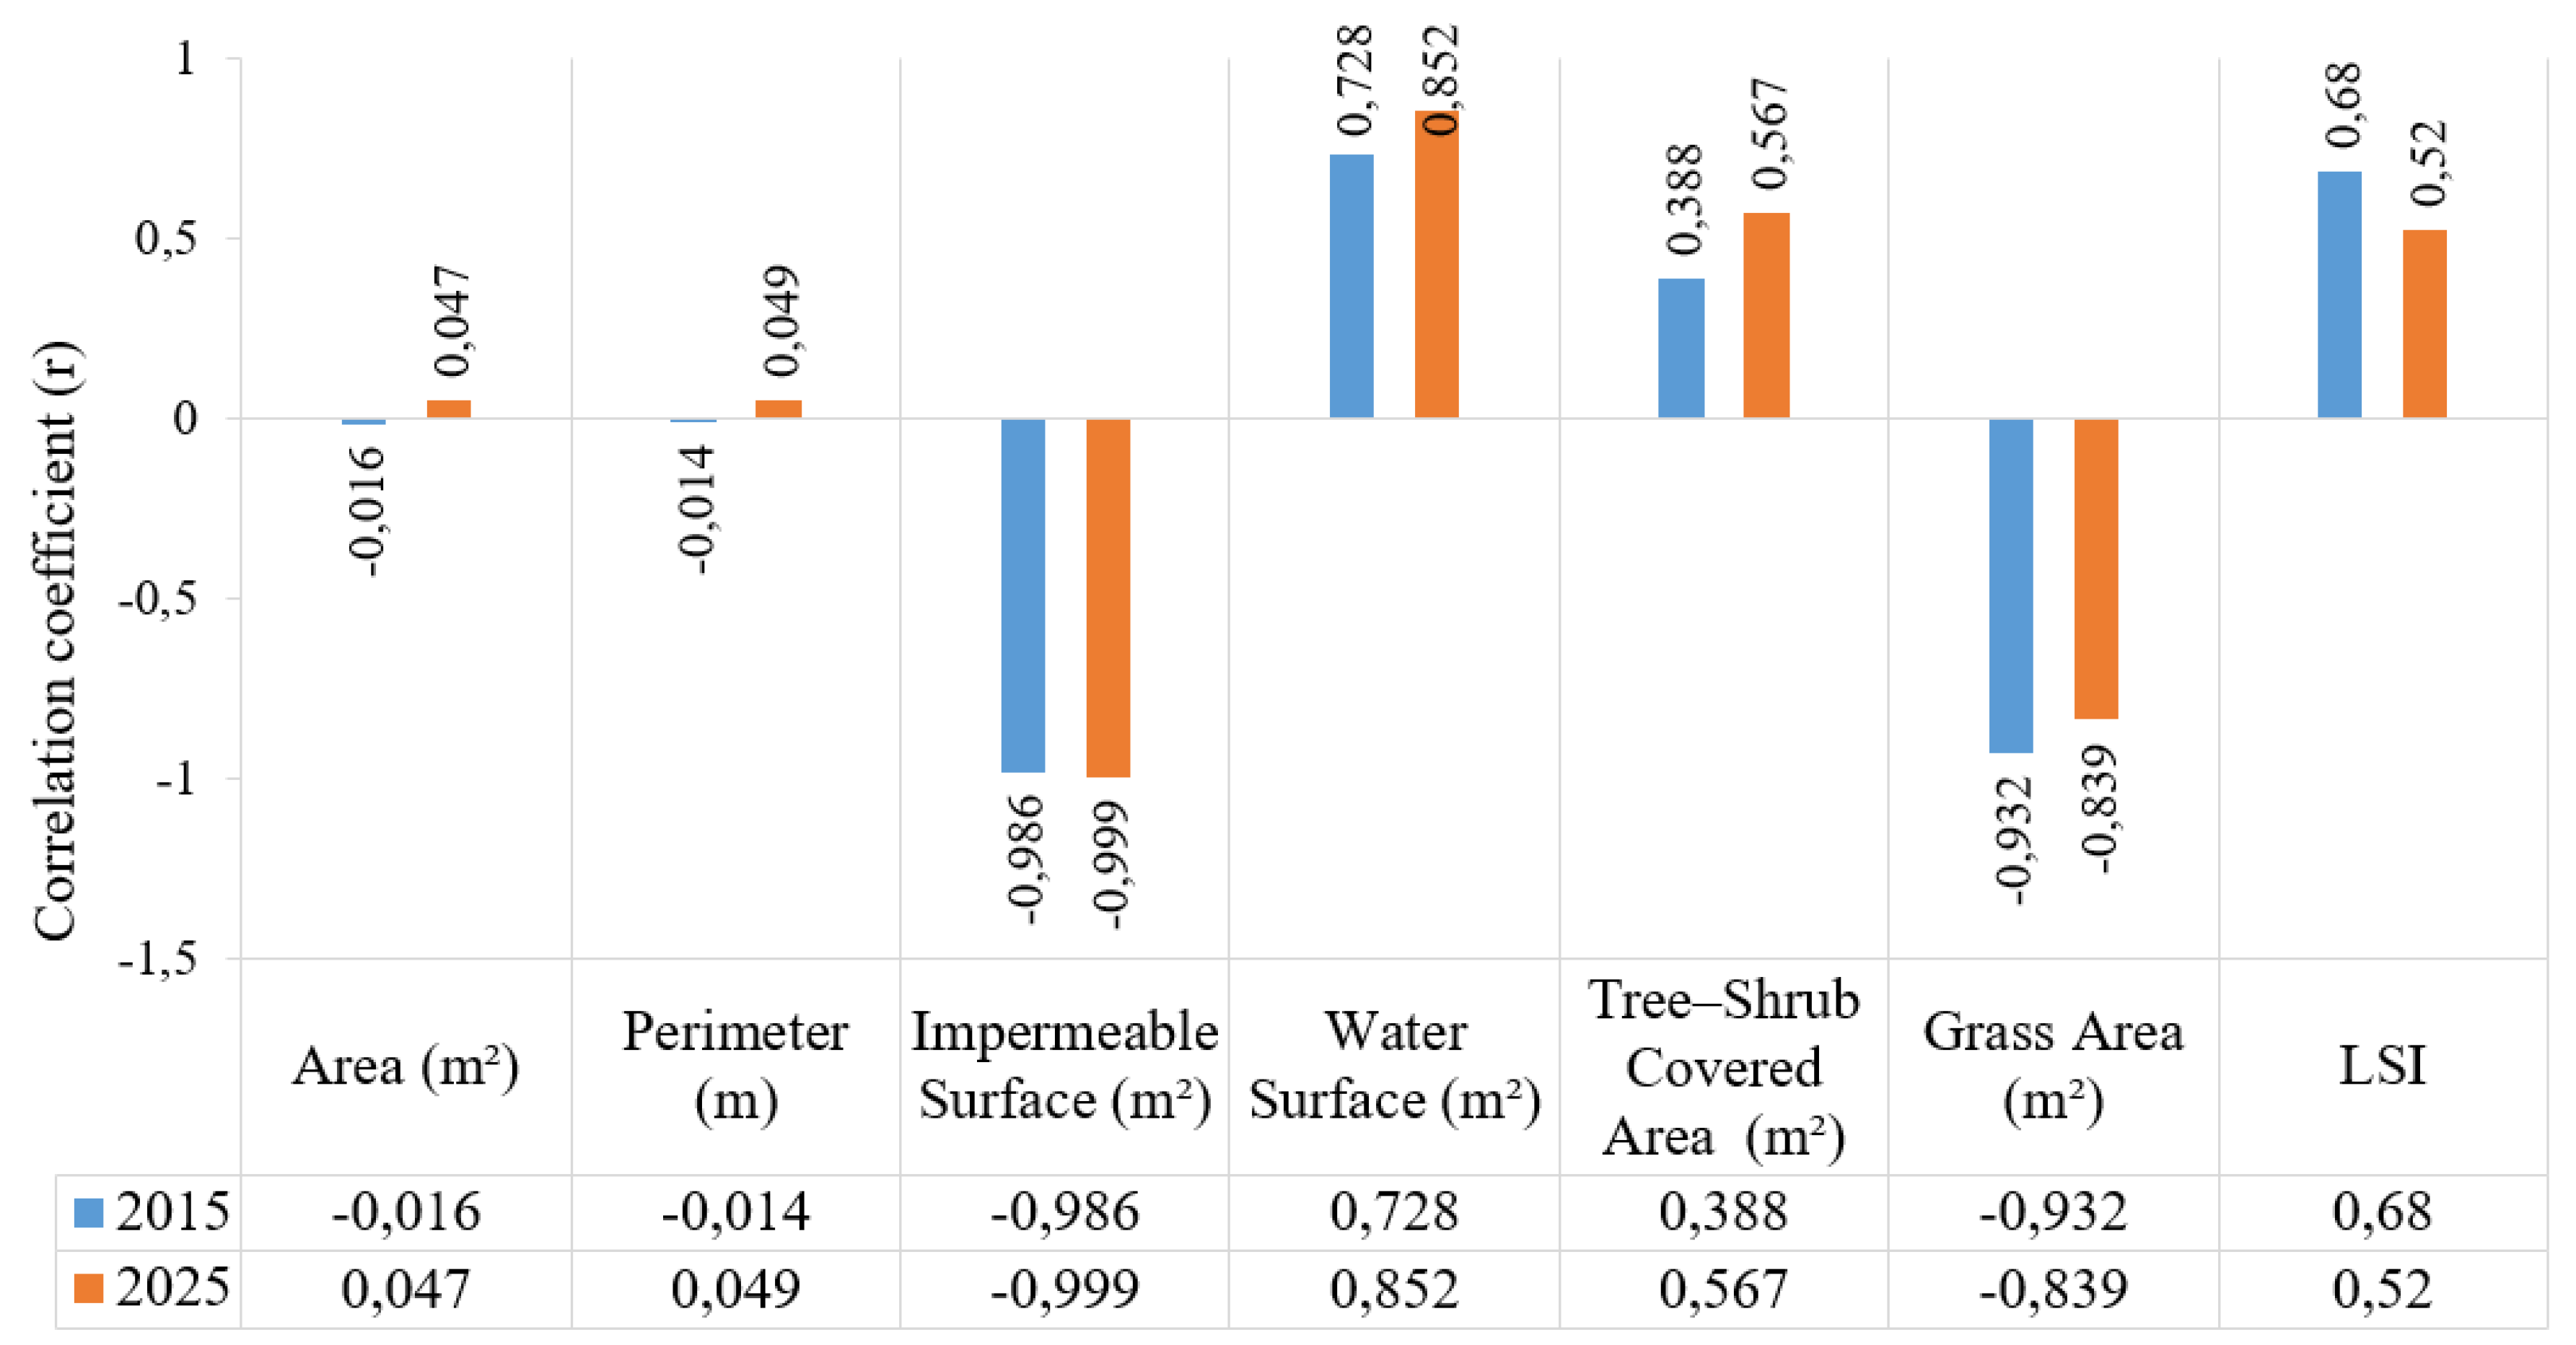
Figure 10.
The correlation between PCI and PCA1, and between PCI and PCA2.
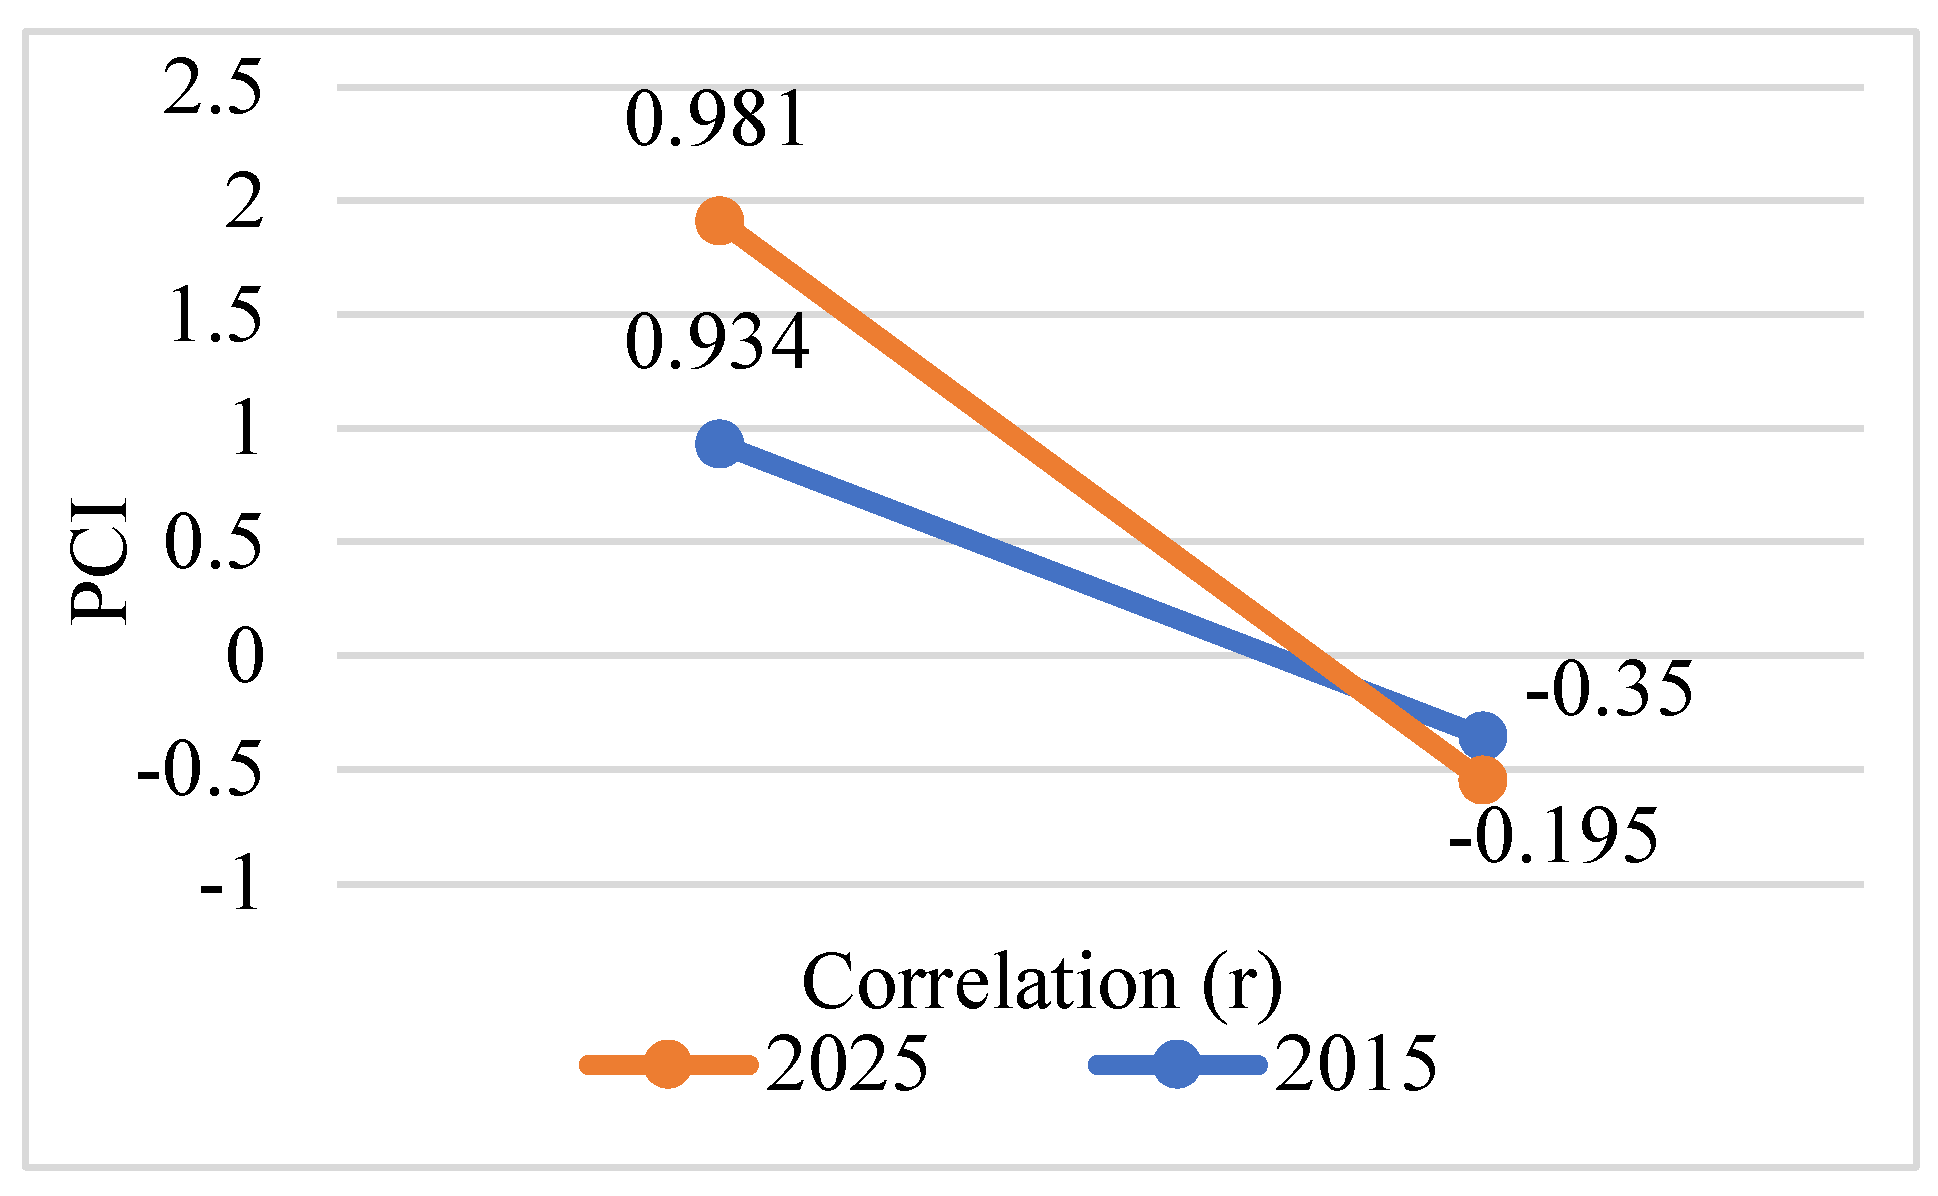
Figure 11.
Relationship between PCA1, PCA2 and PCI (2015-2025).
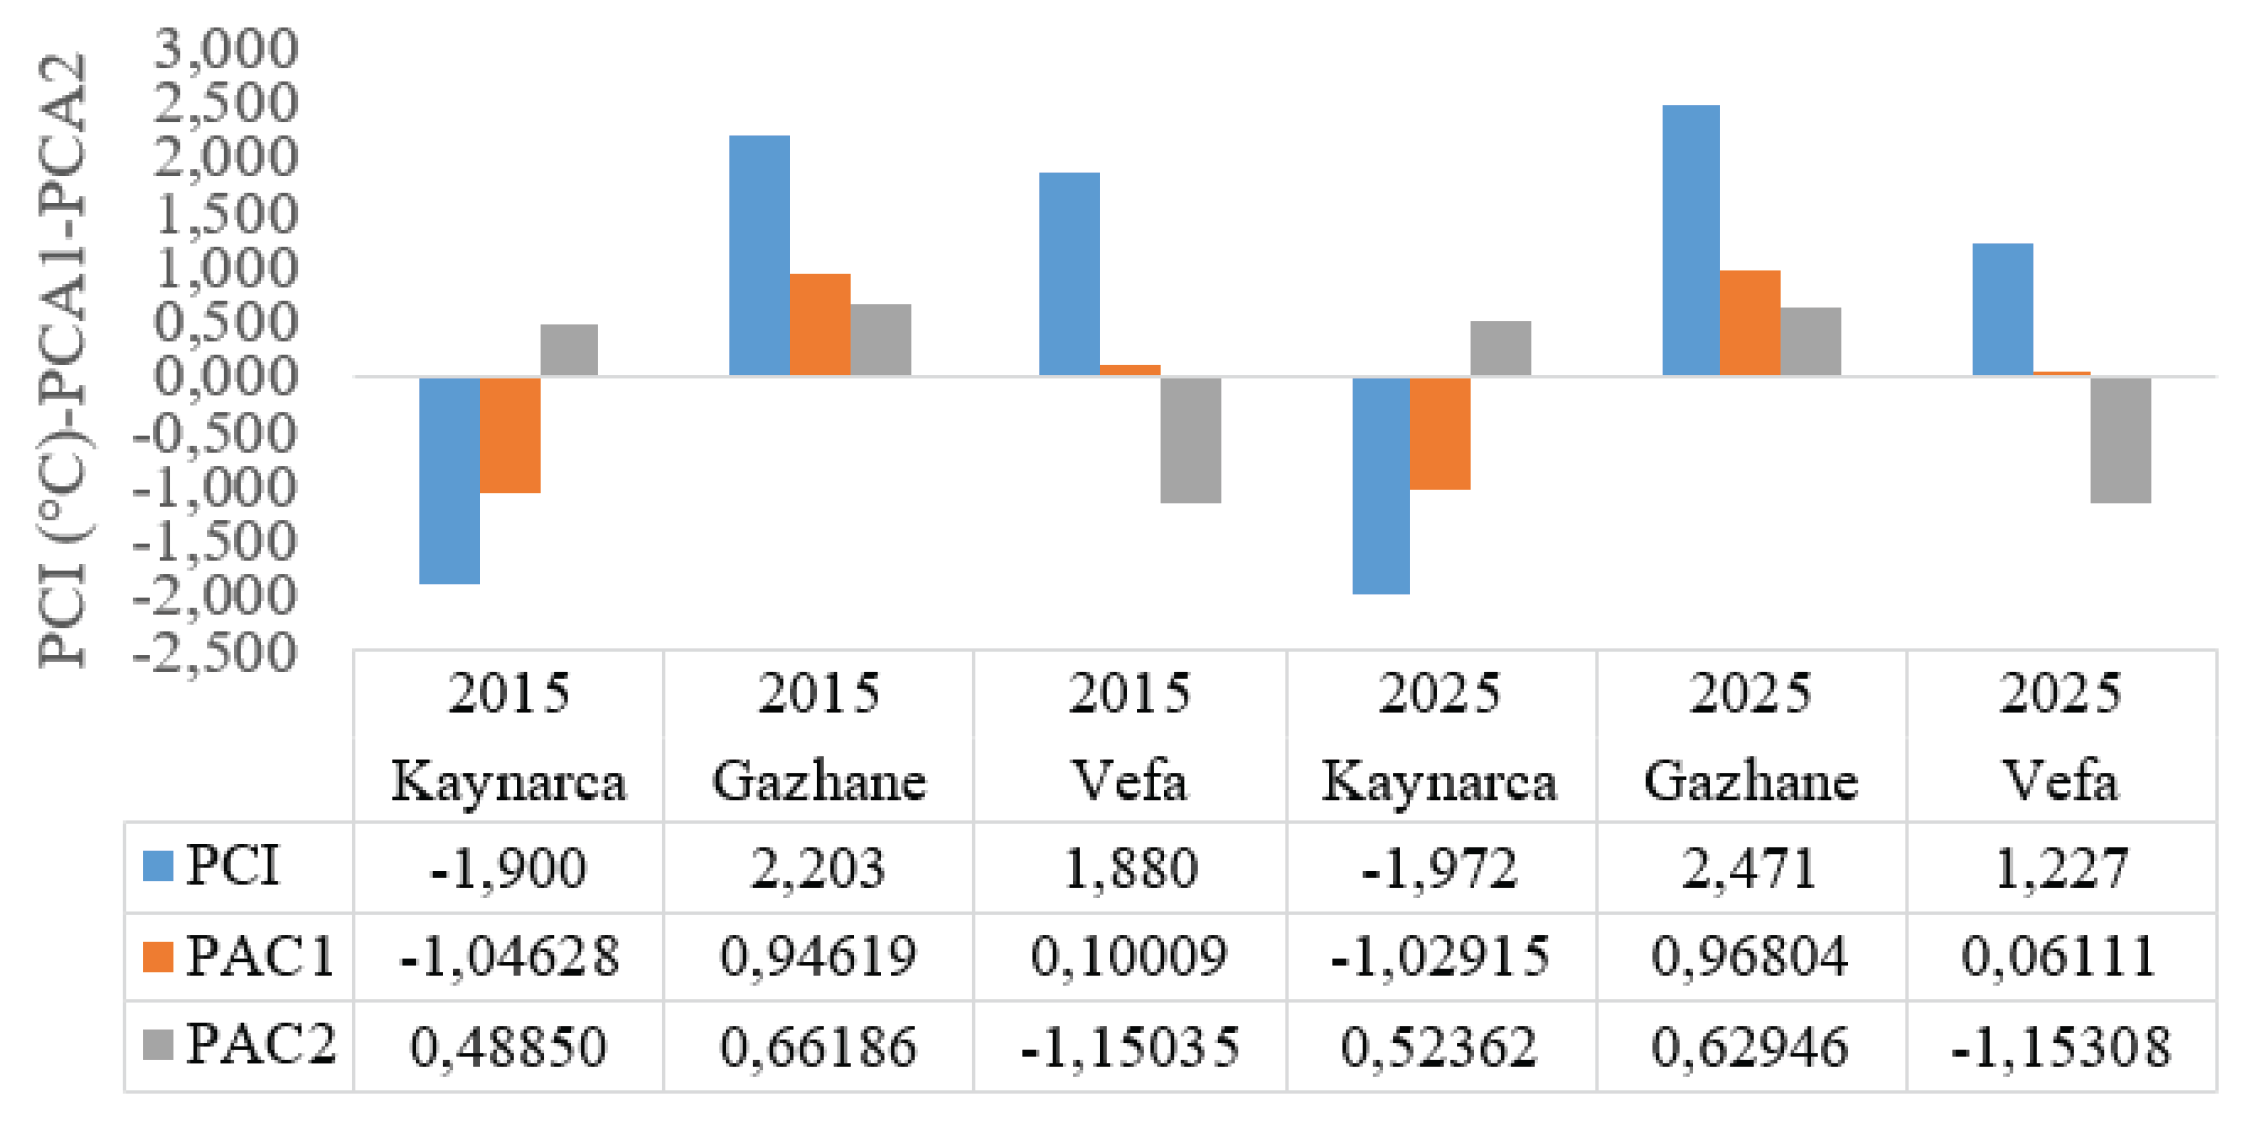

Table 1.
Land cover change between 1990 and 2018 in Bartin province.
| Land Cover Class | Area in 1990 (ha) | Area in 2018 (ha) | Amount of Change (ha) | Rate of Change (%) |
|---|---|---|---|---|
| Forests and Other Green Spaces | 2880 | 2953 | + 73 | 0,5 |
| Agricultural Areas | 10767 | 10342 | - 425 | - 2,80 |
| Settlement Areas | 1185 | 1574 | + 389 | 2,57 |
| Coasts | 31 | 9 | - 22 | - 0,14 |
| Waterways | 331 | 316 | - 15 | - 0,1 |
| TOTAL | 15194 | 15194 |
Table 2.
LST and PCI calculation stages and equations.
| LST and PCI Calculation Stages | Equations |
|---|---|
| Top-of-Atmosphere (TOA) Spectral Radiance | Lλ=ML⋅Qcal+AL
|
| Brightness Temperature (TB) |
:TOA, (K1 = 774.89, K2 = 1321.08) TC=TB−273.15 [43]. |
| NDVI calculation |
NIR= band 5, RED= band 4 [15]. |
| Vegetation fraction (vegetation proportion, Fv or Pv) |
[41]. |
| Normalisation of NDVI Values and Determination of Surface Emissivity (ε) | NDVI>0.5, ε≈0.99 (dense vegetation), NDVI<0.2, ε≈0.97 (very few plants), For occasional cases: ε=0.986+0.004⋅Fv [44]. |
| LST calculation |
|
| PCI and Buffer Analysis | PCI=TU−TP TU= mean LST for the buffer area outside the park, TP= mean LST inside the park. [42]. |
Table 3.
Internal patch characteristics and their definitions.
| Internal patch characteristics | Definition |
|---|---|
| PLAND/Percentage of Landscape. | The proportion of a specific type of area within the total landscape area. |
| LPI/Largest patch index. | The percentage of the total landscape area occupied by the largest patch. Higher values indicate greater dominance of the landscape by a single patch. |
| AREA_MN/Mean of patch area. | The mean area magnitude of a given category of patch |
| PD/Patch Density. | The number of different types of patch per unit area is an indicator of fragmentation.. |
| ED/Edge Density. | The edge length between heterogeneous landscape patches within the total unit area of the landscape |
Table 4.
Area and perimeter length of parks.
| Park Name | Area (m2) | Perimeter (m) | LSI |
|---|---|---|---|
| Kaynarca | 19162,947 | 654,33 | 1.33 |
| Gazhane | 27263,993 | 834,256 | 1.43 |
| Vefa | 15240 | 726,212 | 1.66 |
Table 5.
The correlation between LSI and LST.
| Year | Pearson r | p-value |
|---|---|---|
| 2015 | -0.57 | 0.61 |
| 2025 | -0.43 | 0.72 |
* p < .05.
Disclaimer/Publisher’s Note: The statements, opinions and data contained in all publications are solely those of the individual author(s) and contributor(s) and not of MDPI and/or the editor(s). MDPI and/or the editor(s) disclaim responsibility for any injury to people or property resulting from any ideas, methods, instructions or products referred to in the content. |
© 2026 by the authors. Licensee MDPI, Basel, Switzerland. This article is an open access article distributed under the terms and conditions of the Creative Commons Attribution (CC BY) license (http://creativecommons.org/licenses/by/4.0/).
Copyright: This open access article is published under a Creative Commons CC BY 4.0 license, which permit the free download, distribution, and reuse, provided that the author and preprint are cited in any reuse.


